Distribution and ecology of planktonic foraminifera from ... · PDF fileDistribution and...
21
Distribution and ecology of planktonic foraminifera from the seas around the Indonesian Archipelago X. Ding a, * , F. Bassinot b , F. Guichard b , Q.Y. Li c , N.Q. Fang a , L. Labeyrie b , R.C. Xin a , M.K. Adisaputra d , K. Hardjawidjaksana d a China University of Geosciences (Beijing), Beijing 100083, PR China b Laboratoire des Sciences du Climat et de l’Environnement, Domaine du CNRS, Gif-sur-Yvette 91198, France c School of Ocean and Earth Sciences, Tongji University, Shanghai 200092, PR China d Marine Geological Institute, Bandung 40174, Indonesia Received 14 August 2005; received in revised form 26 September 2005; accepted 11 October 2005 Abstract Planktonic foraminiferal assemblages in 50 core-top samples from the western and southern areas of the Indonesian Archipelago and 29 core tops retrieved northwest of Australia were grouped using cluster analysis. These assemblages make it possible to sub-divide the studied area in five provinces: 1/ the Banda/Java region (I); 2/ the Timor region (II); 3/ the Java upwelling region (III); 4/ the Indian monsoon Sumatra region (IV), and 5/ the NW Australia margin region (V). The foraminiferal assemblage groups reflect differences in sea-surface temperature, salinity, thermocline depth, and nutrient supply between these five provinces. These differences are related to surface circulation patterns. The carbonate dissolution is rather intense compared to that in other areas of the eastern Indian Ocean. Within the studied area, the strongest dissolution occurs in samples from the Java upwelling region, with the lysocline level rising above ~2800 m. The increase in abundance of Globigerina bulloides at 10–8 ka BP in core SHI-9034 (the Java upwelling region) corresponds to the decrease in core SHI-9006 (the Banda/Java region) which indicates an intensification of upwelling in relation to a strengthened southeastern monsoon over the studied area. D 2005 Elsevier B.V. All rights reserved. Keywords: Indonesian Archipelago; planktonic foraminifera; carbonate dissolution; cluster analysis; upwelling; southeastern monsoon 1. Introduction The Indonesian Archipelago is a pathway for oce- anic heat transfer between the Pacific and Indian oceans (Godfrey and Golding, 1981; Godfrey and Ridgway, 1985). Within this archipelago there are at least eight deep-sea basins connected through relatively shallow sills (Tomczak and Godfrey, 1994; Martinez et al., 1997). The surface circulation shows a strong seasonal variability related to monsoonal forcing. The Indone- sian Archipelago, the only low-latitude connection be- tween two major ocean basins, is a key area along the return branch of the Great Conveyor Belt which ulti- mately brings surface waters from the Pacific to the north Atlantic (Gordon, 1986; Hirst and Godfrey, 1993; Bray et al., 1996; Gordon and Fine, 1996; Mu ¨ller and Opdyke, 2000). The archipelago is situated within the Western Pa- cific Warm Pool (WPWP), and annual mean sea surface temperatures exceed 28 8C(Tomczak and Godfrey, 1994; Martinez et al., 1997). The WPWP not only supplies large amounts of water vapor and latent heat 0377-8398/$ - see front matter D 2005 Elsevier B.V. All rights reserved. doi:10.1016/j.marmicro.2005.10.003 * Corresponding author. Tel.: +86 10 82323501; fax: +86 10 82321540. E-mail address: [email protected] (X. Ding). Marine Micropaleontology 58 (2006) 114 – 134 www.elsevier.com/locate/marmicro
Transcript of Distribution and ecology of planktonic foraminifera from ... · PDF fileDistribution and...
www.elsevier.com/locate/marmicro
Marine Micropaleontolog
Distribution and ecology of planktonic foraminifera from the seas
around the Indonesian Archipelago
X. Ding a,*, F. Bassinot b, F. Guichard b, Q.Y. Li c, N.Q. Fang a, L. Labeyrie b, R.C. Xin a,
M.K. Adisaputra d, K. Hardjawidjaksana d
a China University of Geosciences (Beijing), Beijing 100083, PR Chinab Laboratoire des Sciences du Climat et de l’Environnement, Domaine du CNRS, Gif-sur-Yvette 91198, France
c School of Ocean and Earth Sciences, Tongji University, Shanghai 200092, PR Chinad Marine Geological Institute, Bandung 40174, Indonesia
Received 14 August 2005; received in revised form 26 September 2005; accepted 11 October 2005
Abstract
Planktonic foraminiferal assemblages in 50 core-top samples from the western and southern areas of the Indonesian
Archipelago and 29 core tops retrieved northwest of Australia were grouped using cluster analysis. These assemblages make it
possible to sub-divide the studied area in five provinces: 1/ the Banda/Java region (I); 2/ the Timor region (II); 3/ the Java
upwelling region (III); 4/ the Indian monsoon Sumatra region (IV), and 5/ the NWAustralia margin region (V). The foraminiferal
assemblage groups reflect differences in sea-surface temperature, salinity, thermocline depth, and nutrient supply between these
five provinces. These differences are related to surface circulation patterns. The carbonate dissolution is rather intense compared to
that in other areas of the eastern Indian Ocean. Within the studied area, the strongest dissolution occurs in samples from the Java
upwelling region, with the lysocline level rising above ~2800 m. The increase in abundance of Globigerina bulloides at 10–8 ka
BP in core SHI-9034 (the Java upwelling region) corresponds to the decrease in core SHI-9006 (the Banda/Java region) which
indicates an intensification of upwelling in relation to a strengthened southeastern monsoon over the studied area.
D 2005 Elsevier B.V. All rights reserved.
Keywords: Indonesian Archipelago; planktonic foraminifera; carbonate dissolution; cluster analysis; upwelling; southeastern monsoon
1. Introduction
The Indonesian Archipelago is a pathway for oce-
anic heat transfer between the Pacific and Indian oceans
(Godfrey and Golding, 1981; Godfrey and Ridgway,
1985). Within this archipelago there are at least eight
deep-sea basins connected through relatively shallow
sills (Tomczak and Godfrey, 1994; Martinez et al.,
1997). The surface circulation shows a strong seasonal
0377-8398/$ - see front matter D 2005 Elsevier B.V. All rights reserved.
doi:10.1016/j.marmicro.2005.10.003
* Corresponding author. Tel.: +86 10 82323501; fax: +86 10
82321540.
E-mail address: [email protected] (X. Ding).
variability related to monsoonal forcing. The Indone-
sian Archipelago, the only low-latitude connection be-
tween two major ocean basins, is a key area along the
return branch of the Great Conveyor Belt which ulti-
mately brings surface waters from the Pacific to the
north Atlantic (Gordon, 1986; Hirst and Godfrey, 1993;
Bray et al., 1996; Gordon and Fine, 1996; Muller and
Opdyke, 2000).
The archipelago is situated within the Western Pa-
cific Warm Pool (WPWP), and annual mean sea surface
temperatures exceed 28 8C (Tomczak and Godfrey,
1994; Martinez et al., 1997). The WPWP not only
supplies large amounts of water vapor and latent heat
y 58 (2006) 114–134
X. Ding et al. / Marine Micropaleontology 58 (2006) 114–134 115
to the western Pacific atmosphere, but it represents a
major contributor to global climate changes through the
El Nino/Southern Oscillation system. The WPWP dy-
namics are intimately linked to current transport pro-
cesses in the Indonesian Archipelago (Thunell et al.,
1994; Ahmad et al., 1995; Linsley, 1996; Wang, 1998;
Martinez et al., 1999; Wang et al., 1999b).
Thus, researches focused on surface circulation var-
iability in the low-latitude Indian–western Pacific re-
gion are critical for a better understanding of the Asian
monsoons, the dynamics of the WPWP, El Nino events
and thermohaline circulation in the global ocean.
Several paleoceanographic studies have been con-
ducted in the study area. Martinez et al. (1998, 1999)
studied the late Pleistocene paleoceanography of the
northern Australian margin and the eastern Indian
Ocean including the Indonesian Archipelago. Gingele
et al. (2002) analyzed the history of the South Java
Current during the last 80 ka using the distribution of
clay minerals. Hanebuth et al. (2000) studied late-glacial
sea level changes across the Sunda shelf. Visser et al.
(2003) found that SST of waters within the Indonesian
Archipelago increased by 3.5–4.0 8C across the last two
glacial–interglacial transitions, leading the Northern
Hemisphere ice sheets melting by about 2000–3000
years. The tropical Pacific region possibly regulates the
poleward flux of heat and water vapor, thus affecting
global glacial–interglacial climate changes (Cane, 1998),
similar to the mechanisms involved in El Nino/Southern
Oscillation.
Much work remains to be done to unravel the history
of this region, having an intricate geographic setting with
numerous straits and basins, and affected by complex
climatic mechanisms on various timescales (monsoon,
El Nino/Southern Oscillation). Because the Indonesian
Archipelago is located near the equator and has vast,
shallow shelves and coasts, the glacial–interglacial and
seasonal temperature differences are small, but changes
in the amount of fresh water transported are large, mak-
ing paleoclimatologic and paleoceanographic research in
the region difficult. Many attempts have been made
using single cores or single proxies to reconstruct spe-
cific aspects of local environmental changes. However,
these attempts often lack a solid background based on
modern sedimentary and faunal patterns. A comprehen-
sive survey based on seafloor surface samples can pro-
vide us with a key to unravel the interrelation between
modern sedimentation and ocean environment. Once this
interrelation is revealed, we can reconstruct past current
distribution and sediment transport patterns over longer
time periods in the past. Therefore, this paper focuses on
providing a more complete planktonic foraminifera da-
tabase obtained from core-top material recently collected
in the seas around the Indonesian Archipelago, correlat-
ing foraminiferal distribution with environmental vari-
ables and an attempt to apply the results to interpretation
of down-core observations.
2. Modern hydrography and environments in the
Indonesian region
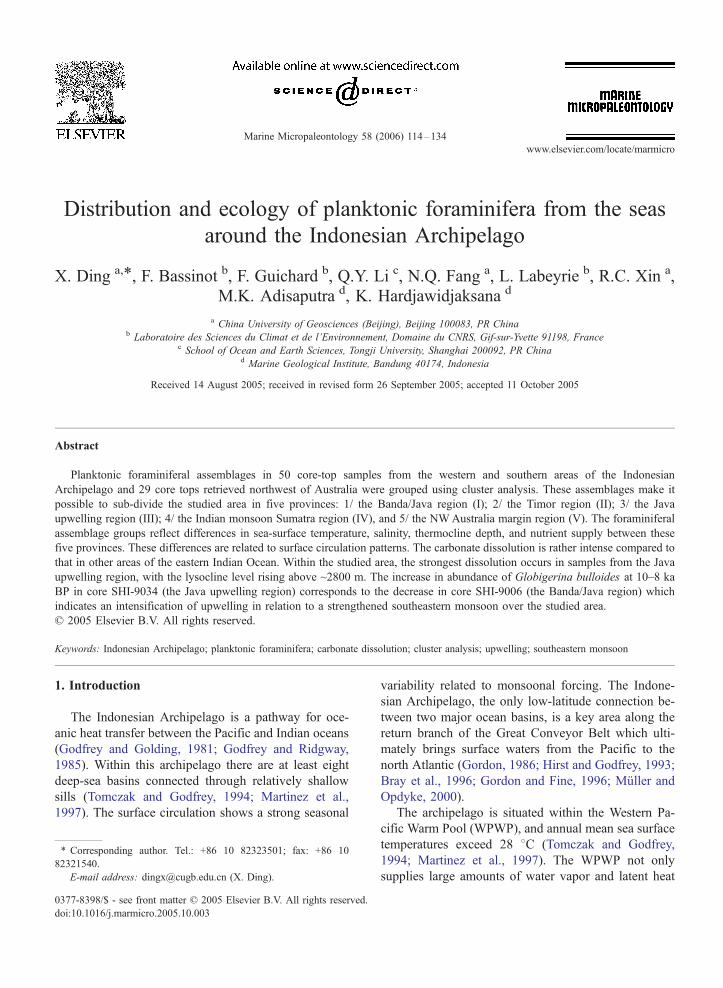
2.1. Surface currents, throughflow and monsoon-
related, seasonal changes
The wind stress between the Pacific and the Indian
oceans maintains a sea level height difference between
these two ocean basins (Bray et al., 1996), leading to a
net inflow of water into the Indian Ocean (Hirst and
Godfrey, 1993). The major components of the Indone-
sian throughflow (ITF) are the Mandanao Current
waters that originate from the upper thermocline of the
north Pacific and are transported into the Indonesia seas
through the Makassar Strait (Gordon, 1986; Gordon and
Fine, 1996) (Fig. 1). Halmahera Eddy water originates
from the upper thermocline of the South Pacific and
seeps into the lower thermocline of the Banda Sea,
making up an important part of the Throughflow (Fig.
1). Only a small portion of the waters flowing through
the Makassar Strait into the Indonesian seas directly
enters the Indian Ocean through the Lombok Strait,
between the islands of Bali and Lombok. The largest
part of these waters turns eastward into the Banda Sea
and Flores Sea before spreading into the Indian Ocean
through the Timor Sea as parts of the west-flowing
South Java Current, the South Equatorial Current, and
the south-flowing Leeuwin Current that runs along the
western Australian margin (Gordon and Fine, 1996;
Siedler et al., 2001) (Fig. 1).
Temperature gradients between the ocean and adja-
cent continents (eastern Asia and Australia) result in
monsoon winds blowing from the southeast during
winter (August), and turning to the opposite direction
during summer (February). Ocean currents in the area
move according to the wind regime. During the summer
monsoon (NW monsoon), the surface currents flow
from the Java Sea into the Banda Sea. The high atmo-
spheric temperatures in the region induce evaporation
of oceanic water at the surface, low-pressure cells and
rain. The overall balance is a gain of freshwater from
precipitation at the sea surface. Consequently, SSTs are
high and sea-surface salinities (SSSs) low (Martinez et
al., 1998). Surface water masses of low salinity reach
the Banda Sea. During the winter monsoon (SE mon-
soon), surface current flows from Arafura and Banda
Fig. 1. Today August currents in the seas around Indonesian Archipelago (Gingele et al., 2002; Gordon and Fine, 1996).
X. Ding et al. / Marine Micropaleontology 58 (2006) 114–134116
Sea towards the Java Sea. Surface water masses whose
salinity has been increased by evaporation reach the
Banda Sea (Ahmad et al., 1995).
During the NW monsoon season, the South Java
Current (derived from the Equatorial Counter Current)
moves towards the southeast to meet the Leeuwin Cur-
rent. The mixing of the South Java Current with the
Leeuwin Current gives origin to the South Equatorial
Current that moves towards the west (Martinez et al.,
1998). Near the maximum in eastward flow, salinities in
the SJC can be as low as 32x and extend down to 138S.Runoff from Sumatra and Java, and advection of fresher
Java Sea water through the Sunda Strait may be respon-
sible for this low-salinity btongueQ. In August/Septem-
ber, during the peak of the SE monsoon, the throughflow
from the Pacific into the Indian Ocean through the Timor
Passage and the Lombok Straits is at its maximum. The
flow of the SJC, which incorporates some of the through-
flow water, is weak and its direction possibly westward
from September to October (Gingele et al., 2002).
2.2. Inter-connections with El Nino/Southern Oscillation
Due to the trade winds which force warm surface
waters to pile up in the WPWP (Enfield, 1989), the
steric height in the west Pacific is higher than in the
east, and the annual average sea surface temperature
(SST) is about 29 8C in the west but only 24 8C in the
eastern side. During an El Nino episode, trade winds
weaken and warm waters of the west Pacific flow to the
east causing SST to rise abnormally in the eastern and
central equatorial Pacific. The ITF and El Nino/South-
ern Oscillation are intimately inter-connected: ITF
weakens during El Nino events with a shallower ther-
mocline, and strengthens during La Nina events with a
deeper thermocline. In addition, the ITF transports
temperature anomalies related to El Nino/La Nina
events from the equatorial Pacific into the Indian
Ocean, as evidenced by the strong correlation existing
between upper thermocline temperatures recorded in
the Makassar Strait and the occurrence of El Nino
events (Gordon and Fine, 1996; Siedler et al., 2001).
2.3. Environmental variables in the western and south-
ern Indonesian Archipelago area
2.3.1. Surface temperatures and salinities
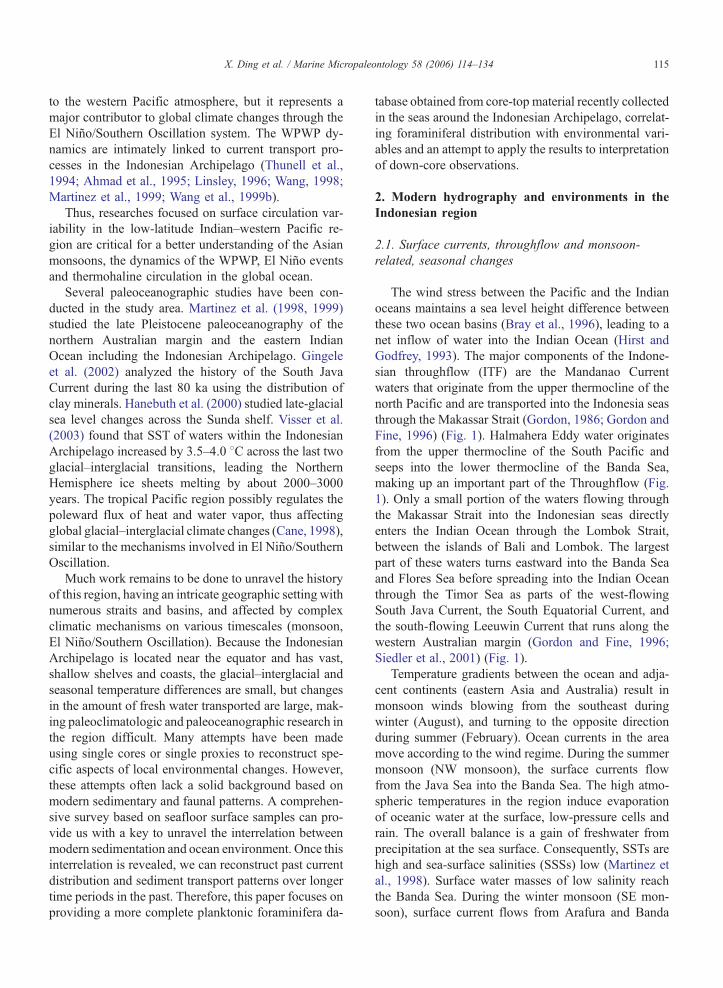
Sea-surface temperature (SST) in February varies
from ~30.0 8C in the northwest to ~26.0 8C in the
south of the study area (Fig. 2a). The Timor Sea that
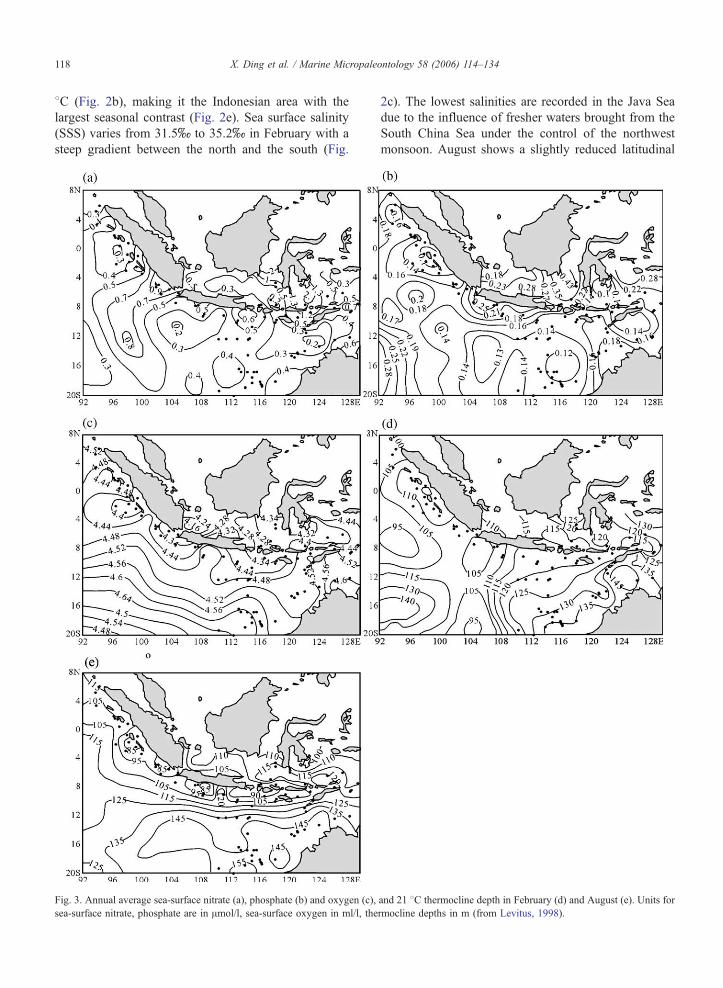
Fig. 2. Sea-surface temperature (8C) in February (a) and August (b); sea-surface salinity (x) in February (c) and August (d); SST seasonality (e) and
SSS seasonality (f) (from Levitus, 1998).
X. Ding et al. / Marine Micropaleontology 58 (2006) 114–134 117
separates the east end of the Archipelago from Australia
shows the relative high temperature (29.4 8C) (Fig. 2a).In August, the near-latitudinal SST gradient across the
studied area increases markedly, with SST ranging from
~30.2 8C in the northwest to ~23.0 8C in the south,
whereas the SST in the Timor Sea drops to about 26.5
X. Ding et al. / Marine Micropaleontology 58 (2006) 114–134118
8C (Fig. 2b), making it the Indonesian area with the
largest seasonal contrast (Fig. 2e). Sea surface salinity
(SSS) varies from 31.5x to 35.2x in February with a
steep gradient between the north and the south (Fig.
Fig. 3. Annual average sea-surface nitrate (a), phosphate (b) and oxygen (c),
sea-surface nitrate, phosphate are in Amol/l, sea-surface oxygen in ml/l, the
2c). The lowest salinities are recorded in the Java Sea
due to the influence of fresher waters brought from the
South China Sea under the control of the northwest
monsoon. August shows a slightly reduced latitudinal
and 21 8C thermocline depth in February (d) and August (e). Units for
rmocline depths in m (from Levitus, 1998).
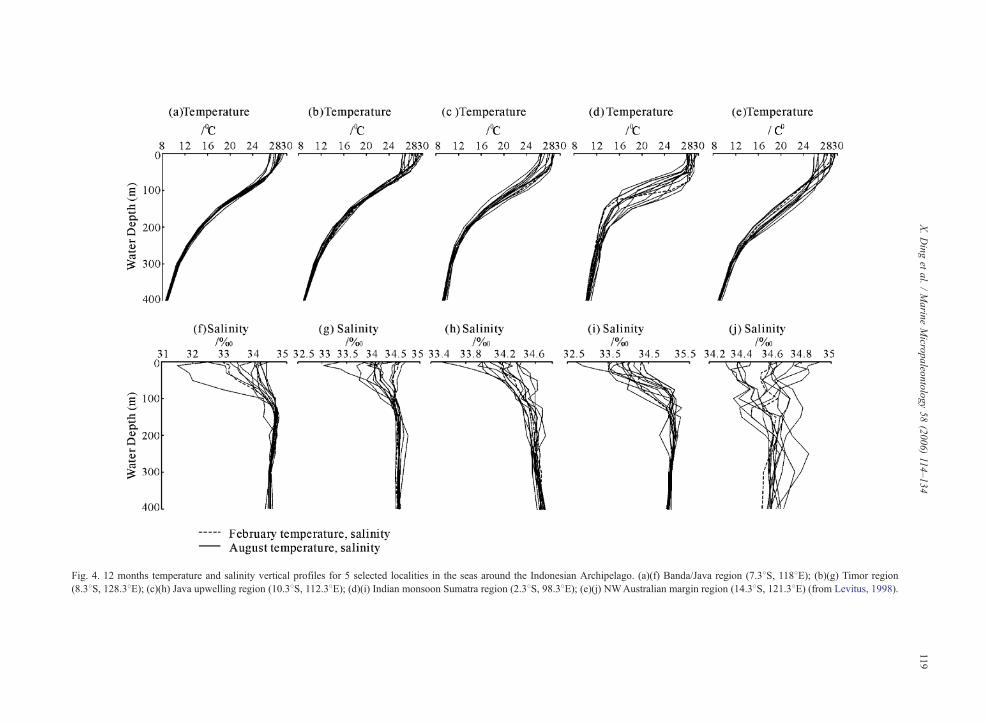
Fig. 4. 12 months temperature and salinity vertical profiles for 5 selected localities in the seas around the Indonesian Archipelago. (a)(f) Banda/Java region (7.38S, 1188E); (b)(g) Timor region
(8.38S, 128.38E); (c)(h) Java upwelling region (10.38S, 112.38E); (d)(i) Indian monsoon Sumatra region (2.38S, 98.38E); (e)(j) NWAustralian margin region (14.38S, 121.38E) (from Levitus, 1998).
X.Dinget
al./Marin
eMicro
paleo
ntology58(2006)114–134
119
X. Ding et al. / Marine Micropaleontology 58 (2006) 114–134120
salinity gradient, with SSS varying from 32.5x in the
North to 34.9x in the South (Fig. 2d). The Sunda Strait
and Great Channel have the lowest SSS as a result of
fresh water discharge from coastal regions. The Java
Sea shows the biggest seasonal salinity difference be-
tween February and August (Fig. 2f) (Levitus, 1998).
2.3.2. Nutrient and dissolved oxygen spatial distribution
Mean annual surface phosphate contents are the
highest in the Java Sea and along the Java upwelling
regions close to the south coast of the Java (Fig. 3b),
while mean annual surface nitrate contents are rela-
tively high in the Java Sea, Banda Sea and the Sunda
strait (Fig. 3a), indicating a higher surface water
fertility due either to throughflow waters carried
across the Archipelago and/or to upwelling cells
(Levitus, 1998). Surface dissolved oxygen values
show little variability, with the lowest values mea-
sured in the Java Sea and Sunda straits (Fig. 3c)
(Levitus, 1998).
2.3.3. Thermocline depth
The thermocline depth closely follows the 21 8Cisotherm (Bray et al., 1996; Martinez et al., 1998) and
is on average at about ~120 m depth in February in the
studied area, being slightly shallower to the west of
Sumatra and slightly deeper to the east of the Archi-
pelago including the Timor Sea, NW Australia margin
region (Fig. 3d) (Levitus, 1998). Important changes in
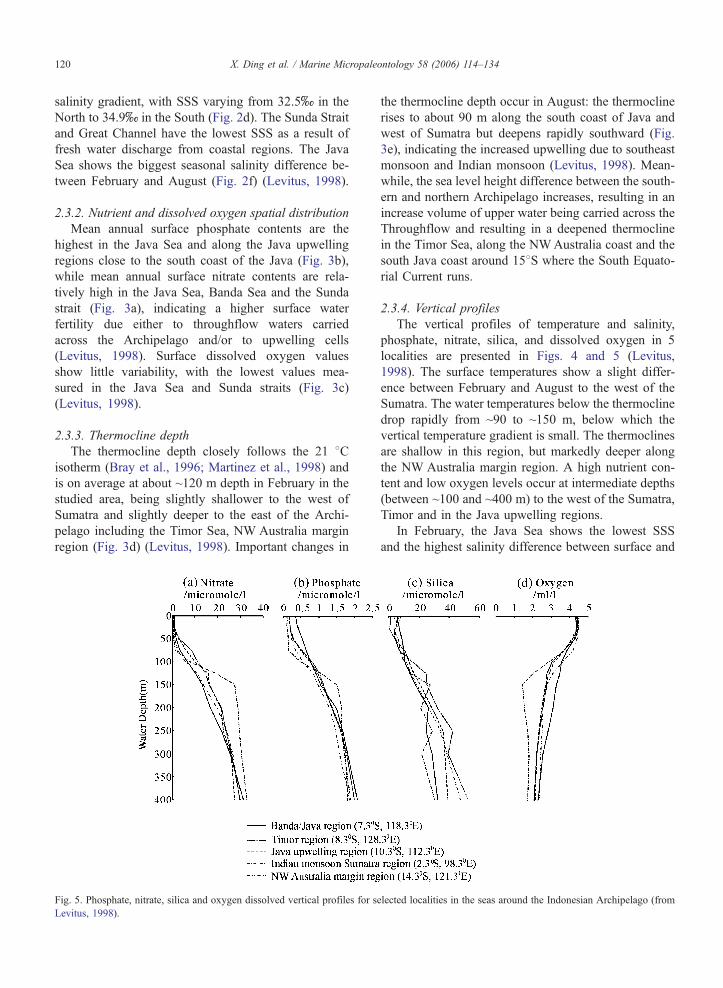
Fig. 5. Phosphate, nitrate, silica and oxygen dissolved vertical profiles for s
Levitus, 1998).
the thermocline depth occur in August: the thermocline
rises to about 90 m along the south coast of Java and
west of Sumatra but deepens rapidly southward (Fig.
3e), indicating the increased upwelling due to southeast
monsoon and Indian monsoon (Levitus, 1998). Mean-
while, the sea level height difference between the south-
ern and northern Archipelago increases, resulting in an
increase volume of upper water being carried across the
Throughflow and resulting in a deepened thermocline
in the Timor Sea, along the NWAustralia coast and the
south Java coast around 158S where the South Equato-
rial Current runs.
2.3.4. Vertical profiles
The vertical profiles of temperature and salinity,
phosphate, nitrate, silica, and dissolved oxygen in 5
localities are presented in Figs. 4 and 5 (Levitus,
1998). The surface temperatures show a slight differ-
ence between February and August to the west of the
Sumatra. The water temperatures below the thermocline
drop rapidly from ~90 to ~150 m, below which the
vertical temperature gradient is small. The thermoclines
are shallow in this region, but markedly deeper along
the NW Australia margin region. A high nutrient con-
tent and low oxygen levels occur at intermediate depths
(between ~100 and ~400 m) to the west of the Sumatra,
Timor and in the Java upwelling regions.
In February, the Java Sea shows the lowest SSS
and the highest salinity difference between surface and
elected localities in the seas around the Indonesian Archipelago (from
X. Ding et al. / Marine Micropaleontology 58 (2006) 114–134 121
subsurface waters, followed by the area to the west of
Sumatra. In contrast, the Timor Sea shows the highest
SSS and the smallest salinity difference between sur-
face and subsurface waters, which is the effect of the
northeast winter monsoon and a weakened Through-
flow. In August, the area to the west of the Sumatra
shows the lowest SSS and the biggest salinity differ-
ence between surface and subsurface waters, probably
because of the large amount of fresh water imported
as a result of the southwest monsoon. Rising SSS in
the Java Sea and falling SSS in the Timor Sea and
NW Australia margin occur at times of a stronger
Throughflow.
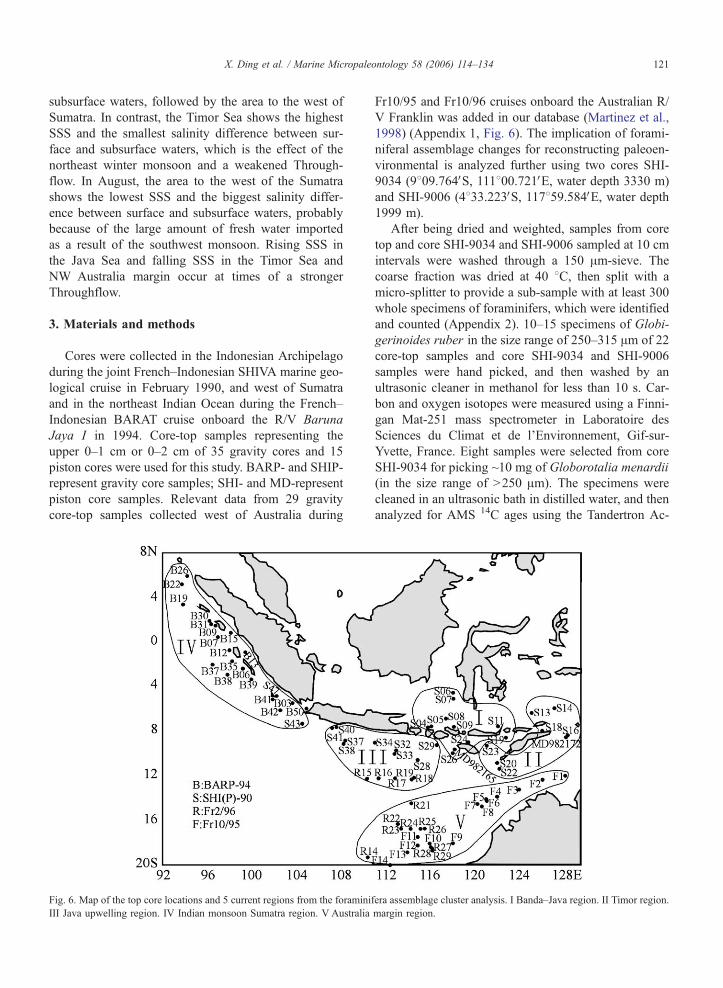
3. Materials and methods
Cores were collected in the Indonesian Archipelago
during the joint French–Indonesian SHIVA marine geo-
logical cruise in February 1990, and west of Sumatra
and in the northeast Indian Ocean during the French–
Indonesian BARAT cruise onboard the R/V Baruna
Jaya I in 1994. Core-top samples representing the
upper 0–1 cm or 0–2 cm of 35 gravity cores and 15
piston cores were used for this study. BARP- and SHIP-
represent gravity core samples; SHI- and MD-represent
piston core samples. Relevant data from 29 gravity
core-top samples collected west of Australia during
Fig. 6. Map of the top core locations and 5 current regions from the foraminif
III Java upwelling region. IV Indian monsoon Sumatra region. V Australia
Fr10/95 and Fr10/96 cruises onboard the Australian R/
V Franklin was added in our database (Martinez et al.,
1998) (Appendix 1, Fig. 6). The implication of forami-
niferal assemblage changes for reconstructing paleoen-
vironmental is analyzed further using two cores SHI-
9034 (9809.764VS, 111800.721VE, water depth 3330 m)
and SHI-9006 (4833.223VS, 117859.584VE, water depth1999 m).
After being dried and weighted, samples from core
top and core SHI-9034 and SHI-9006 sampled at 10 cm
intervals were washed through a 150 Am-sieve. The
coarse fraction was dried at 40 8C, then split with a
micro-splitter to provide a sub-sample with at least 300
whole specimens of foraminifers, which were identified
and counted (Appendix 2). 10–15 specimens of Globi-
gerinoides ruber in the size range of 250–315 Am of 22
core-top samples and core SHI-9034 and SHI-9006
samples were hand picked, and then washed by an
ultrasonic cleaner in methanol for less than 10 s. Car-
bon and oxygen isotopes were measured using a Finni-
gan Mat-251 mass spectrometer in Laboratoire des
Sciences du Climat et de l’Environnement, Gif-sur-
Yvette, France. Eight samples were selected from core
SHI-9034 for picking ~10 mg of Globorotalia menardii
(in the size range of N250 Am). The specimens were
cleaned in an ultrasonic bath in distilled water, and then
analyzed for AMS 14C ages using the Tandertron Ac-
era assemblage cluster analysis. I Banda–Java region. II Timor region.
margin region.
able 1
lanktonic foraminifera d18O values of core tops
ore d18O (PDB)
ARP-9426 �2.67
ARP-9422 �2.23
ARP-9409 �2.72
ARP-9415 �3.03
ARP-9407 �2.90
ARP-9412 �2.60
ARP-9413 �2.92
ARP-9437 �2.88
ARP-9435 �2.22
ARP-9406 �2.65
HIP-9047 �2.22
ARP-9441 �2.87
HIP-9040 �2.75
HIP-9041 �3.07
HIP-9018 �2.39
D-982172 �2.79
HIP-9037 �2.62
HIP-9024 �2.72
HIP-9034 �2.78
HIP-9029 �2.37
HIP-9038 �2.13
D-982165 �2.10
X. Ding et al. / Marine Micropaleontology 58 (2006) 114–134122
celerator in Gif-sur-Yvette. Finally, foraminiferal 14C
ages were adjusted for the apparent reservoir effect on
the ages of surface seawater (400 years). Planktonic
foraminiferal assemblages from the 79 top samples of
the Indonesian Archipelago and the NWAustralia were
grouped using cluster analysis. The cluster analysis was
performed using JMP statistic package (version 3) for
Macintosh, available from SAS Institute, Cary, NC
27513, USA. Similarity in cluster analysis was calcu-
lated with the Complete and/or Ward methods without
weighting. A planktonic foraminifera dissolution index
(FDX) was estimated using the weighted average meth-
od based on different dissolution grades for foraminif-
eral species (Berger, 1979).
4. Results
4.1. The foraminiferal distribution in core-top samples
and oceanographic conditions
The plankton-tow samples could be correlated well
with recent oceanographic condition, but plankton-tow
material may differ substantially from core-top mate-
rial, because these samples represent the average (viz.
seasonal and inter-annual variations) of possibly sev-
eral centuries. Plankton-tow samples are thus of lim-
ited value when reconstruction past oceanographic
conditions rely on core material (Martinez et al.,
1998).
Planktonic foraminifera in deep-sea core-top sam-
ples from the eastern Indian Ocean were compared with
assemblages collected in plankton-tows (Martinez et
al., 1998), and these studies indicated that data on
core-top samples, grouped by principal components
and analyzed by canonical correspondence, are related
significantly to environmental variables (temperature,
salinity and nutrients), although some differences exist
in foraminiferal assemblages in plankton-tow and core-
top samples. Variables correlating with latitude could
account for most of the variance in the species data.
Data on some core-top samples from d18O analyses
(Table 1) were used to compare information with that in
the surface sediment from the studied area. The around
�2.5x d18O values are the same as those in core-top
d18O analyses from the WPWP (Martinez et al., 1997)
that were assumed to represent present-day upper water
conditions.
4.2. Dissolution overprint
Most planktonic foraminifera from deep-sea core-
top samples are affected to some extent by post-depo-
T
P
C
B
B
B
B
B
B
B
B
B
B
S
B
S
S
S
M
S
S
S
S
S
M
sition dissolution. Selective dissolution alters the orig-
inal foraminiferal assemblages by removing the more
fragile foraminiferal species preferentially. Pore water
saturation within the sediments is strongly dependent
upon acidification resulting from oxic respiration of
organic matter and the release of CO2. Thus, the seas
around Indonesian Archipelago are particularly com-
plex as far as dissolution is concerned, owing to 1/ its
complex bathymetry characterized by numerous semi-
isolated basins inter-connected through shallow sills,
with water depths changing rapidly and greatly from
place to place, and 2/ the local variability of its surface
water productivity.
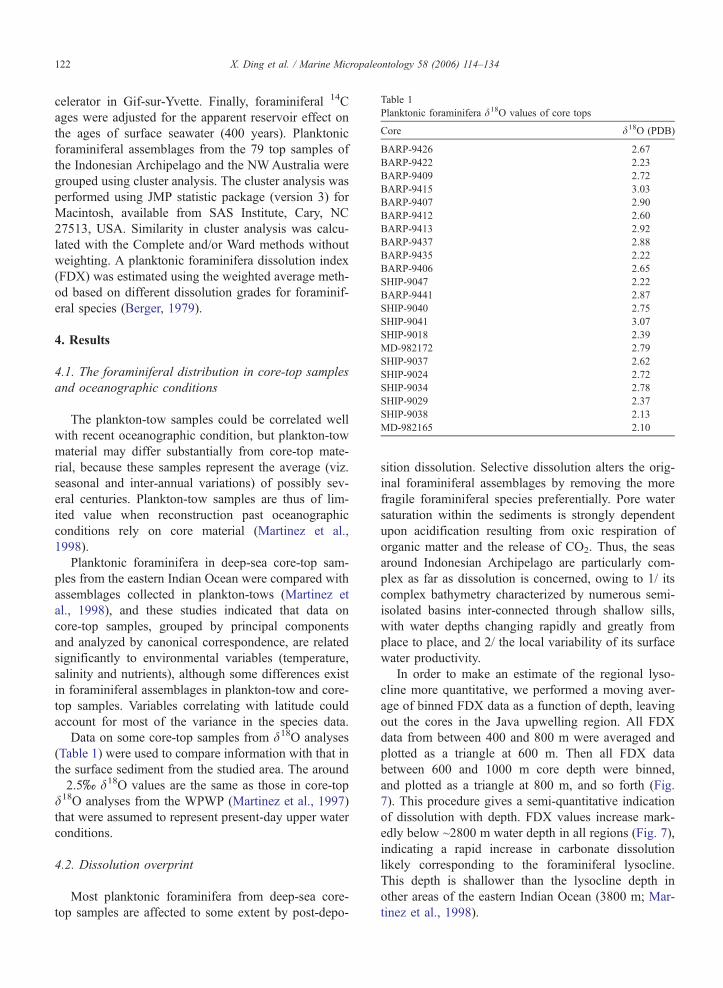
In order to make an estimate of the regional lyso-
cline more quantitative, we performed a moving aver-
age of binned FDX data as a function of depth, leaving
out the cores in the Java upwelling region. All FDX
data from between 400 and 800 m were averaged and
plotted as a triangle at 600 m. Then all FDX data
between 600 and 1000 m core depth were binned,
and plotted as a triangle at 800 m, and so forth (Fig.
7). This procedure gives a semi-quantitative indication
of dissolution with depth. FDX values increase mark-
edly below ~2800 m water depth in all regions (Fig. 7),
indicating a rapid increase in carbonate dissolution
likely corresponding to the foraminiferal lysocline.
This depth is shallower than the lysocline depth in
other areas of the eastern Indian Ocean (3800 m; Mar-
tinez et al., 1998).
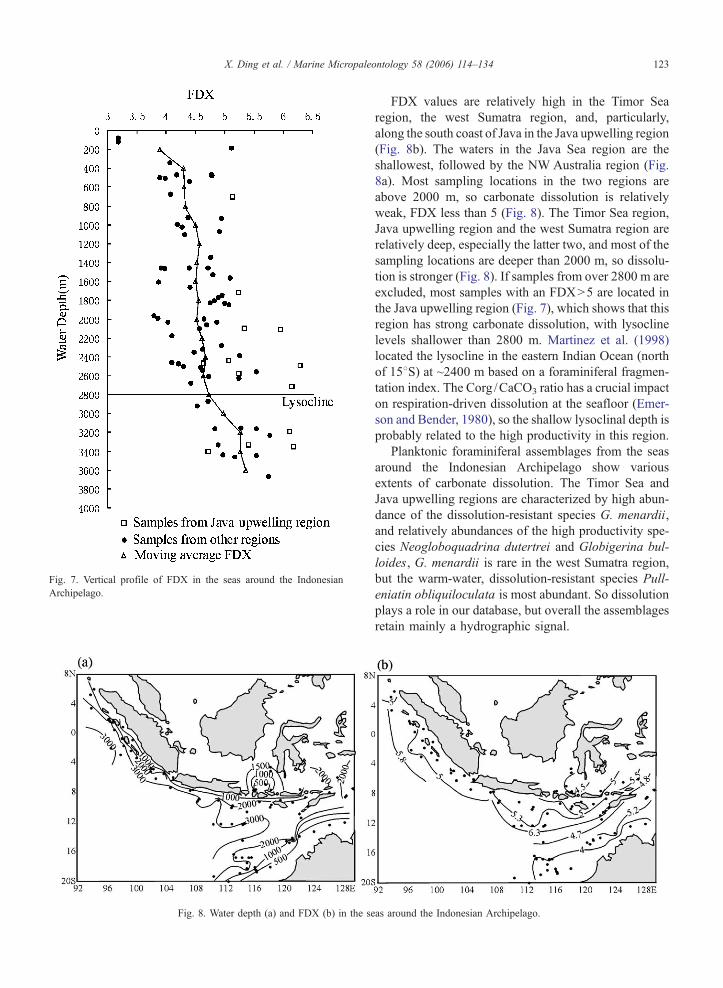
Fig. 8. Water depth (a) and FDX (b) in the se
Fig. 7. Vertical profile of FDX in the seas around the Indonesian
Archipelago.
X. Ding et al. / Marine Micropaleontology 58 (2006) 114–134 123
FDX values are relatively high in the Timor Sea
region, the west Sumatra region, and, particularly,
along the south coast of Java in the Java upwelling region
(Fig. 8b). The waters in the Java Sea region are the
shallowest, followed by the NW Australia region (Fig.
8a). Most sampling locations in the two regions are
above 2000 m, so carbonate dissolution is relatively
weak, FDX less than 5 (Fig. 8). The Timor Sea region,
Java upwelling region and the west Sumatra region are
relatively deep, especially the latter two, and most of the
sampling locations are deeper than 2000 m, so dissolu-
tion is stronger (Fig. 8). If samples from over 2800 m are
excluded, most samples with an FDXN5 are located in
the Java upwelling region (Fig. 7), which shows that this
region has strong carbonate dissolution, with lysocline
levels shallower than 2800 m. Martinez et al. (1998)
located the lysocline in the eastern Indian Ocean (north
of 158S) at ~2400 m based on a foraminiferal fragmen-
tation index. The Corg /CaCO3 ratio has a crucial impact
on respiration-driven dissolution at the seafloor (Emer-
son and Bender, 1980), so the shallow lysoclinal depth is
probably related to the high productivity in this region.
Planktonic foraminiferal assemblages from the seas
around the Indonesian Archipelago show various
extents of carbonate dissolution. The Timor Sea and
Java upwelling regions are characterized by high abun-
dance of the dissolution-resistant species G. menardii,
and relatively abundances of the high productivity spe-
cies Neogloboquadrina dutertrei and Globigerina bul-
loides, G. menardii is rare in the west Sumatra region,
but the warm-water, dissolution-resistant species Pull-
eniatin obliquiloculata is most abundant. So dissolution
plays a role in our database, but overall the assemblages
retain mainly a hydrographic signal.
as around the Indonesian Archipelago.
X. Ding et al. / Marine Micropaleontology 58 (2006) 114–134124
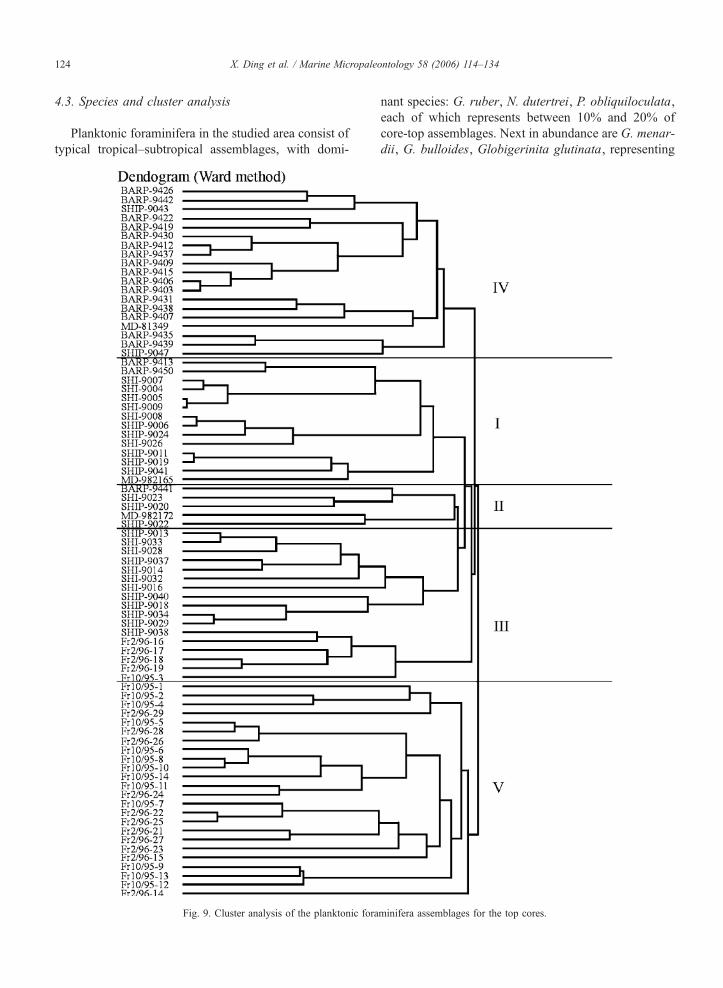
4.3. Species and cluster analysis
Planktonic foraminifera in the studied area consist of
typical tropical–subtropical assemblages, with domi-
Fig. 9. Cluster analysis of the planktonic fora
nant species: G. ruber, N. dutertrei, P. obliquiloculata,
each of which represents between 10% and 20% of
core-top assemblages. Next in abundance are G. menar-
dii, G. bulloides, Globigerinita glutinata, representing
minifera assemblages for the top cores.
Table
2
Ecological
characteristicsoftheim
portantplanktonic
foraminiferaspecies
N.dutertrei
G.ruber
G.bulloides
G.sacculifer
G.glutinata
G.manardii
N.pachyderma(R)
P.obliquiloculata
Atropical
totemperatespecies,abundant
inactivecurrentsystem
s,along
continentalmarginsandin
upwelling
regionswhereit
lives
mainly
within
thethermocline,
nearthechlorophyll
maxim
um
(Fairbankset
al.,1982;
Curry
etal.,
1983;Cannariato
and
Ravelo,1997;Kaw
ahataet
al.,
2002).Abundantin
highproductivity
areas
with
warm
water
and
alow
salinity
(Be,
1977;Prell
and
Curry,
1981;Thompson,1981;Thunelland
Reynolds,
1984;Thiede
and
Junge,
1992;Pflaumannet
al.,1996;
Hilbrecht,1997;Martinez
etal.,1998;
PflaumannandJian,1999).
Awarm-w
ater
species,a
shallow
dweller,most
commonin
warm
mixed
layer
abovethethermocline
(Fairbankset
al.,1982),
symbiont-bearingwith
zooxanthellae,
prefers
oligotrophic
regionswith
a
deepmixed
layer,andis
the
leastresistantto
dissolution
(Be,
1977;Raveloet
al.,
1990;Andreasen
and
Ravelo,1997;Patrick
and
Thunell,1997;Martinez
etal.,1998;Pflaumann
andJian,1999).
Occurs
predominantlyin
subpolarregions,also
commonin
upwelling
areasandboundary
currentsin
low-latitude
regionswheresurface
productivityis
high(Be,
1977;Duplessyet
al.,
1981;PrellandCurry,
1981;Brock
etal.,1992;
Martinez
etal.,1998;
PflaumannandJian,
1999).
Atropical,shallow-dwelling
species,toleratesawiderangeof
temperatures,
butprefers
mixed
layer
waterswithtemperatures
N248C
andlow
seasonal
changes
inSSTandvertical
temperature
gradients,notwell
suited
tolargeseasonal
salinity
changes,andsusceptible
to
dissolution(Be,
1977;Fairbanks
etal.,1982;Thunelland
Reynolds,
1984;Cannariato
and
Ravelo,1997;Patrick
and
Thunell,
1997;Martinez
etal.,
1998;PflaumannandJian,1999).
Has
awidelatitudinal
distribution,toleratesarather
extensiverangeof
temperaturesandsalinities
andismoderatelysusceptible
todissolution.Itis
abundant
inmid
tohighlatitudes
and
inupwellingregionsat
low
latitudes
with
fertile
waters
(Fairbankset
al.,1982;
ThunellandReynolds,1984;
Martinez
etal.,1998;
Pflaumann
and
Jian,1999;
Kaw
ahataet
al.,2002).
Atropical
tosubtropical
speciesthat
prefers
high
SSTandnorm
alSSS,
andisnotvery
susceptible
to
dissolution.Itis
abundantin
upwelling
regionswith
ashallow
thermoclineandhigh
primaryproductivity
(Be,
1977;Fairbanks
etal.,1982;Thunelland
Reynolds,1984;
Martinez
etal.,1998).
Theright-coilingpopulation
ofN.pachyderma
ismost
abundantin
subpolarand
transitional
regionsandonly
rarely
encounteredin
tropical
areas.
Itoccurs
inareasof
upwelling
ofcold
water
in
thetropical/subtropical
belt
(Be,
1977;Thunelland
Reynolds,1984;Reynolds
andThunell,1986;
Pflaumannet
al.,1996;
PflaumannandJian,
1999).
Athick-w
alledtropical
shallow
water
and
dissolutionresistant
species,
which
calcifies
mostofitstestbelow
themixed
layer.It
isas
sociated
withabundant
phytoplankton
and
high
productivity
(Be,
1977;
Raveloet
al.,1990;
PflaumannandJian,
1999;Kaw
ahata
etal.,
2002).
X. Ding et al. / Marine Micropaleontology 58 (2006) 114–134 125
from less than 1% to more than 20% of the assem-
blages. Low-abundance species are: Orbulina universa,
Globigerinoides conglobatus, G. tenellus, G. sacculi-
fera, Sphaeroidinella dehiscens, Globigerinella aequi-
lateralis, Globigerina calida, G. falconensis, G.
rubescens, Neogloboquadrina pachyderma (R), Globo-
quadrina conglomerata, and Globorotalia scitula.
Cluster analysis of our planktonic foraminiferal
assemblages revealed the existence of five main
groups (Fig. 9). These groups correspond to provinces
characterized by differences in hydrographic settings:
1/ the Banda/Java region (I); 2/ the Timor region (II);
3/ the Java upwelling region (III); 4/ the Indian mon-
soon Sumatra region (IV), and 5/ the NW Australia
margin region (V) (Fig. 6). The settings of the NW
Australia margin region (V) are the same as those of
Group II— the WPWP assemblage from Martinez et
al. (1998).
5. Discussion
5.1. Planktonic foraminiferal cluster groups: distribu-
tion and characteristics
The ecological preferences of all species are listed in
Table 2, the environmental characteristics of the regions
in Table 3, and the correspondence between foraminif-
eral assemblages and environmental parameters in
Table 4.
5.1.1. Cluster I—Banda/Java region
This cluster is dominated by N. dutertrei (13.0% to
28.3%, average 21.9%) (Fig. 10b, Table 2).
The next dominant species is G. ruber (13.1% to
25.6%, average 21.2%) (Fig. 10g), but high percentages
(~20%) of this species are not typical, because as G.
ruber is abundant in most of the other clusters with the
exception of region III (see below).
The third dominant species is G. bulloides (6.2% to
22.6%, average 15.8%) (Fig. 10a). The tropical, shal-
low-dwelling species G. sacculifer is least abundant in
core-top assemblages from cluster I (1% to 7.3%, av-
erage 3.4%) (Fig. 10h). The rarity or absence of G.
sacculifer indicates important variability in seasonal
SST, SSS and vertical temperature gradients in the
region (Table 2).
Other species show either minor or extremely vari-
able abundance in cluster I. G. glutinata ranges from
4% to 34.1% (average 12%) (Fig. 10c), only slightly
less than in cluster II (see below).
Cluster I corresponds to core tops from the Java Sea
and Banda Sea; the environmental characteristics of this
Table 3
The environmental characteristics of the 5 regions
Environment
indexes
Cluster I—Banda/Java
region
Cluster II—Timor
region
Cluster III—Java
upwelling region
Cluster IV—Indian monsoon
Sumatra region
Cluster V—NW
Australia margin region
Currents This region corresponds to the
main body of the Indonesian
Throughflow coming from the
Makassar strait, and seasonal
reversal of surface currents
due to the monsoon.
The region is along the
pathway of the most important
Throughflow. These waters
flow from the Makassar strait
eastward in the Flores Sea
before entering the Timor Sea
and then the Indian Ocean.
The upwelling from the
southeast monsoon, and some
Throughflow from Lombok
strait affect this region.
Influenced by Indian monsoon
Currents, and the South Java
Current. Fresh waters imported
through the Sunda Strait and
Great Channel in the eastern
and northern parts of this
province affect the region also.
Water spreads into the Indian
Ocean as the west-flowing
South Java and the South
Equatorial Current, and as the
south-flowing Leeuwin
Current.
SST Important seasonal SST
contrasts, with high SST in
February and relatively low
SST in August.
High SST in February, low
SST in August, with a
large seasonal temperature
difference.
High SST in February and low
SST in August with a large
seasonal temperature
difference.
Low SST in August, and slight-
ly higher SST in February, with
small seasonal SST difference.
High SST in February, low
SST in August, with large
seasonal temperature
difference.
SSS Important seasonal SSS
contrasts, the lowest February
SSS from our studied area and
high SSS in August.
High SSS, the SSS in February
is slightly higher. Seasonal
salinity difference is small.
The SSS in the northern part
are relatively low in February
but increase southward to reach
the same high values typical of
August.
Salinity is low in February due
to northeast monsoon winds.
The opposite occurs in August
when southwest monsoon
winds prevail.
Salinity is slightly higher in
February than in August, but
the seasonal difference is small.
Thermocline The thermocline depth remains
constantly at about 115 m,
although it may deepen slightly
in February.
The thermocline deepens
southward, but seasonal
difference is small.
The thermocline is shallow,
especially in August being the
shallowest for the whole
studied area due to
monsoon-induced upwelling,
but deepen rapidly southward.
The thermocline remains
shallow throughout the year,
becoming shallower in some
periods of August.
The thermocline is deep,
especially in August being the
deepest for the whole studied
area due to the increased
Throughflow.
Nitrate Nitrate distribution is highly
variable, with high contents in
the extremity of the Makassar
strait and the east.
Nitrate content is relative high
but less than region I, and is
well distributed.
Nitrate content is not high, only
higher than region IV and V.
Nitrate content is low. Nitrate content is low.
Phosphate Phosphate content reaches its
maximum value in the
extremity of the Makassar
strait, and is usually very large.
Phosphate content is low. Phosphate distribution
variable, with relatively high
contents in the North. Values
are similar to those from
region II.
Phosphate content is low. Phosphate content is low.
X.Dinget
al./Marin
eMicro
paleo
ntology58(2006)114–134
126

Table 4
Planktonic foraminiferal cluster groups: distribution and characteristics
Regions Cluster I—Banda/Java
region
Cluster II—Timor
region
Cluster III—Java
upwelling region
Cluster IV—Indian
monsoon Sumatra region
Cluster V—NWAustralia
margin regionImportant foraminifera species
N. dutertrei 21.9% (13–28.3%) 11.8% (6.8–16.1%) 13.6% (7.3–25.3%) 18.8% (10.1–27.4%) 3.9% (0.8–15.8%)
G. ruber 21.2% (13.1–25.6%) 19.6% (12.9–26.4%) 11.9% (2.3–22.5%) 20% (5.5–30.5%) 30.2% (21–52.5%)
G. bulloides 15.8% (6.2–22.6%) 9% (4.4–13.5%) 8.3% (1.3–17.1%) 4.8% (0.2–16.4%) 2.9% (0.3–7.8%)
G. sacculifer 3.4% (1–7.3%) 4.7% (2.1–6.8%) 8.1% (1.8–16.9%) 13.9% (6.9–26.3%) 13.2% (4.6–21.1%)
G. glutinata 12% (4–34.1%) 14.7% (10.8–22.1%) 7.2% (1.3–17.5%) 6.9% (0.3–13.1%) 9.7% (0–34.2%)
G. menardii 6% (1.1–20.7%) 19.8% (7.5–31.5%) 29.3% (9.2–51.8%) 7.9% (3.2–18.9%) 11.8% (0–28.7%)
N. pachyderma (R) 0.7% (0–2.2%) 1.8% (0–5.5%) 3% (0.3–6.9%) 0.7% (0–2.7%) 2.1% (0–5.6%)
P. obliquiloculata 12.11% (5.9–16%) 9.9% (4.1–15.3%) 10% (5.6–18.2%) 13.3% (6.6–19.7%) 4% (2–17.2%)
The relationship
between the planktonic
foraminiferal assemblages
and environment
characteristics in the
5 regions
The planktonic
foraminifera assemblages
characterize an
environment with strong
current activity, constant
thermocline depth,
abundant nutrient supply,
low salinity, high
productivity, and large
seasonal SST and SSS
changes.
The characteristics of
the planktonic foraminifera
assemblages are typical
of an environment with
large seasonal different
SST, high salinity,
and a relatively high
productivity, relatively
strong dissolution
and deep thermocline.
The characteristics of
the planktonic foraminifera
assemblage indicate an
environment with
upwelling activity, low
temperature, high salinity,
high productivity, and
high dissolution.
The planktonic foraminiferal
characteristics indicate an
environment with relatively
oligotrophy, low salinity,
small seasonal temperature
differences and warm in
winter, shallow thermocline,
and high dissolution.
The characteristics of the
planktonic foraminifera
assemblage indicate an
environment with oligotrophy,
high salinity, low SST in
winter, deep thermocline,
and weak dissolution.
X.Dinget
al./Marin
eMicro
paleo
ntology58(2006)114–134
127
X. Ding et al. / Marine Micropaleontology 58 (2006) 114–134128
X. Ding et al. / Marine Micropaleontology 58 (2006) 114–134 129
region are listed in Table 3, and the correspondence
between foraminiferal assemblages and environmental
parameters in Table 4.
5.1.2. Cluster II—Timor region
The planktonic foraminifera assemblages in cluster
II resemble those in cluster I, but the relative abun-
dances of N. dutertrei and G. bulloides are lower (6.8–
16.1%, average 11.8% and 4.4–13.5%, average 9%,
respectively) (Fig. 10b, a).
The abundance of G. glutinata is the highest of all
clusters, varying from 10.8% to 22.1% (average 14.7%)
(Fig. 10c), possibly reflecting relatively high produc-
tivity and higher salinity (Table 2).
The percentage of G. menardii is significantly
higher than in cluster I, from 7.5% to 31.5%, averaging
19.8% (Fig. 10e), but lower than in cluster III. The
abundances of G. ruber and G. sacculifer are similar to
those in region I, averaging 19.6% and 4.7% respec-
tively (Fig. 10g, h).
The environmental characteristics of the Timor re-
gion are listed in Table 3, and the correspondence
between foraminiferal assemblages and environmental
parameters in Table 4.
5.1.3. Cluster III—Java upwelling region
The two dominant species N. dutertrei and G. bul-
loides are less abundant than in cluster I but more
abundant than in the other clusters, and show large
fluctuations: 7.3–25.3% (average 13.6%) and 1.3–
17.1% (average 8.3%), respectively (Fig. 10b, a). The
warm water species G. menardii reaches its highest
abundance in this cluster, with large fluctuations:
9.2% to 51.8%, averaging 29.3% (Fig. 10e). G. ruber
is not very abundant, from 2.3% to 22.5%, average
11.9% (Fig. 10g). N. pachyderma (R) only averages
about 3% in this cluster, but this is a higher abundance
than in other clusters (Fig. 10f). G. sacculifer is slightly
more abundant than in clusters I and II, with percen-
tages varying from 1.8% to 16.9%, and averaging 8.1%
(Fig. 10h).
This region corresponding to cluster III is situated in
the south coast of the Java, affected by the upwelling
from the southeast monsoon wind, and small Through-
flow from Lombok strait (Table 3). Its environmental
characteristics are listed in Table 3, and the correspon-
dence between foraminiferal assemblages and environ-
mental parameters in Table 4.
Fig. 10. Planktonic foraminifera relative abundances (%) from top-core
abliquiloculatar; (e) G. menardir; (f) N. pachyderma (R); (g) G. ruber; (h)
5.1.4. Cluster IV—Indian monsoon Sumatra region
The high productivity species G. bulloides shows
abundances ranging from 0.2% to 16.4%, averaging
4.8%, which is low for the study region, although abun-
dances are lower in cluster V (Fig. 10a). The N. dutertrei
abundance ranges from 10.1% to 27.4%, average
18.8%, slightly less than in region I (Fig. 10b). The
distribution and abundance changes of N. dutertrei in-
dicate that it is influenced not only by productivity but
also by salinity. G. glutinata abundances average 6.9%,
the lowest in the studied area, whereas G. ruber is
relatively abundant, averaging 20%. G. sacculifera has
relative abundances between 6.9% and 26.3% (average
13.9%), the highest for the studied area (Fig. 10c, g, h).
The low G. bulloides and G. glutinata content, and the
presence of abundant G. ruber and G. sacculifera indi-
cate that this region is oligotrophic; the high N. dutertrei
content indicates a low salinity and shallow thermocline.
P. obliquiloculata has an average abundance of
around 10% with minor variability between samples.
In region IV, P. obliquiloculata shows its highest abun-
dances of the whole studied area, from 6.6% to 19.7%,
average 13.3% (Fig. 10d), which probably reflects se-
lective dissolution. The other dissolution-resistant spe-
cies, G. menardii, is much less abundant (average
7.9%), probably (Fig. 10e).
The environmental characteristics of this region are
listed in Table 3, and the correspondence between
foraminiferal assemblages and environmental para-
meters in Table 4.
5.1.5. Cluster V—NW Australia margin region
This cluster corresponds to core tops from the NW
Australian margin, as published in Martinez et al.
(1998). This cluster is almost the same as Group II—
the WPWP assemblage in Martinez et al. (1998). We
include these data for comparison. The high productiv-
ity species N. dutertrei and G. bulloides are least
abundant in this cluster, with an average of 3.9% and
2.9%, respectively (Fig. 10b, a). G. ruber reaches it
maximum abundance (average 30.2%), and G. saccu-
lifera is also abundant (average 13.2%), only slightly
less than in cluster IV (Fig. 10g, h). The low G.
menardii and P. obliquiloculata content, and the rela-
tively high N. pachyderma (R) abundance reflect the
weak dissolution and lower winter SST.
The environmental characteristics of this region are
listed in Table 3, and the correspondence between
samples, (a) G. bulloides; (b) N. duterire; (c) G. glutinata; (d) P.
G. sacculifer.
X. Ding et al. / Marine Micropaleontology 58 (2006) 114–134130
foraminiferal assemblages and environmental para-
meters in Table 4.
5.2. Java upwelling
The upwelling indicator species G. bulloides and the
high productivity species N. dutertrei are less abundant
in the Java upwelling region (III) than in the Banda/
Java region (I). Though the distribution of N. dutertrei
in the studied area is also influenced by salinity, the low
abundance of G. bulloides may indicate that upwelling
is not active presently in the Java region. Selective
dissolution may have changed the species composition
and abundance of planktonic foraminifera, causing a
decrease in relative abundance of solution-susceptible
species (G. ruber, G. sacculifer and G. bulloides),
whereas the solution-resistant species N. dutertrei and
G. menardii may have increased in abundance. How-
ever, G. bulloides apparently shows similarly low per-
centages in deep-sea sediments from the Java upwelling
system and plankton-tow material from the eastern
Indian Ocean (Martinez et al., 1998). Carbonate disso-
lution may explain its absence close to Java, but not its
low abundance elsewhere (Martinez et al., 1998). Phy-
toplankton productivity in the Java upwelling system
could have been reduced as compared to other upwell-
ing regions, because the ITF limits sea surface upwell-
ing of cold, nutrient-rich subsurface water.
The implication of G. bulloides abundance changes
between region I and region III for reconstructing up-
welling is analyzed further using samples from cores
SHI-9034 and SHI-9006 retrieved from region I and III,
respectively. The AMS 14C ages, curves of d18O values
(Ding et al., 2002) and important planktonic foraminif-
era species abundance changes from the two cores are
presented in Table 5 and Figs. 11 and 12.
The abundance curve of G. bulloides from core SHI-
9034 shows that this species reaches its peak abundance
in the interval 9.5–7 ka BP, with values increasing
rapidly from 22.7% to 43.5% (averaging 32.3%),
Table 5
The AMS 14C ages of core SHI-9034
Samples (cm) Age (ka BP)
34 2.71
44 3.53
105 5.56
125 6.21
304.5 11.22
360 11.96
390 12.36
430 13.95
above the average 15% abundance typical for the rest
of the core (Fig. 11). The abundance of the warm water
and solution-resistant N. dutertrei, G. menardii and P.
obliquiloculata decreased markedly in this interval
(Fig. 11), indicating enhanced productivity, higher
SSS, lower SST and weaker dissolution. This stronger
upwelling in the Java upwelling system at ~8 ka BP
likely resulted from the coeval enhanced east Asian
monsoon as described by several authors (Shi et al.,
1993; Sirocko et al., 1993; Blunier et al., 1995; Porter
and An, 1995; Wang et al., 1999a).
The age model of Core SHI-9006 is less accurate
than that of SHI-9034 because it is not based on AMS14C dating, but was developed by tuning the d18Orecord of SHI-9006 according to the oxygen isotope
chronology of Martinson et al. (1987). The maximum
abundance of G. bulloides in core SHI-9034 corre-
sponds to an interval of low G. bulloides abundance
in core SHI-9006 (averaging 11.5%) (Fig. 12). In that
interval, the abundance of the high productivity species
G. glutinata decreased also, the oligotrophic species G.
sacculifer became more abundant, and the solution-
resistant G. menardii and P. obliquiloculata increased
in abundance in core SHI-9006 (Fig. 12). The results
indicate low nutrients and strong dissolution, thus pos-
sibly a weaker ITF in the Banda/Java region between
9.5 and 7 ka BP.
Reacting to the seasonal control of strong southeast
monsoons winds, the south Java current flows from the
southeast to the northwest, so that the sea level in the
south of the Archipelago drops. In general, a lower sea
level may lead to enhanced upwelling but it may also
lead to an enhanced ITF that may limit upwelling
activity. We argue that the ITF was indeed relatively
weak during 10~8 ka BP, thus not limiting upwelling
notably. Core SHI-9034 on the northern margin of the
Java upwelling region, to the western of the south
Lombok strait, was not influenced by the weaker ITF,
and upwelling due to the southeast monsoon was vig-
orous in that region.
6. Conclusions
Planktonic foraminifera from 50 deep-sea core-top
samples from the seas around Indonesian Archipelago
and adjoining areas were studied, and the data com-
pared with data on 29 core tops off NWAustralia, with
the following results.
1) The planktonic foraminifera dissolution index
(FDX) shows strong carbonate dissolution in the stud-
ied area compared to rest of the eastern Indian Ocean.
Within the Archipelago, dissolution is strongest in the
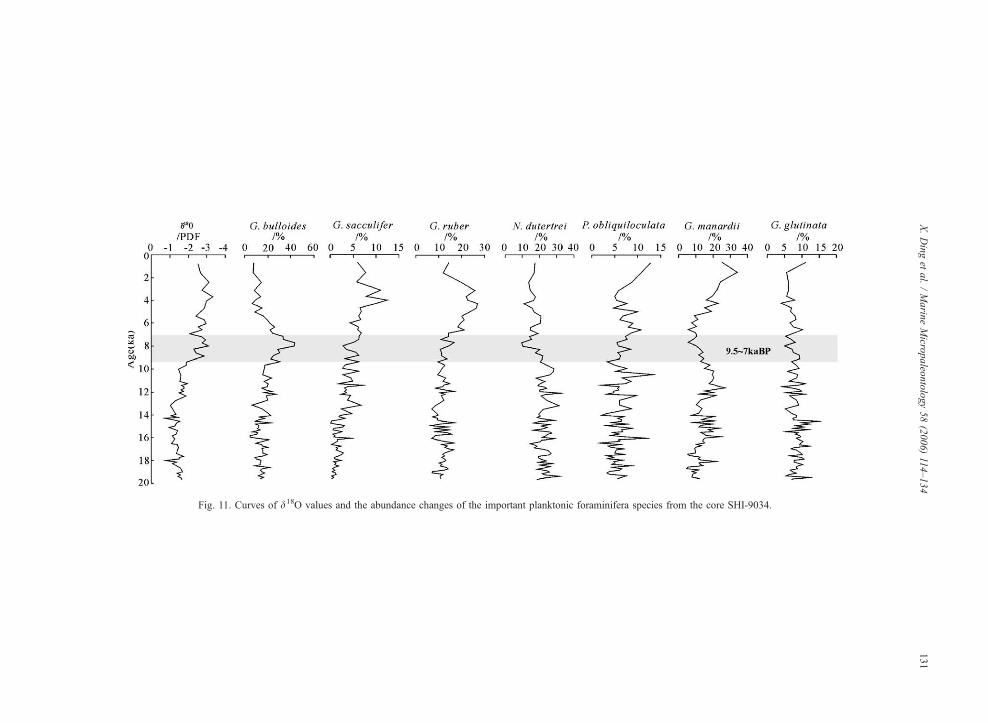
Fig. 11. Curves of d18O values and the abundance changes of the important planktonic foraminifera species from the core SHI-9034.
X.Dinget
al./Marin
eMicro
paleo
ntology58(2006)114–134
131
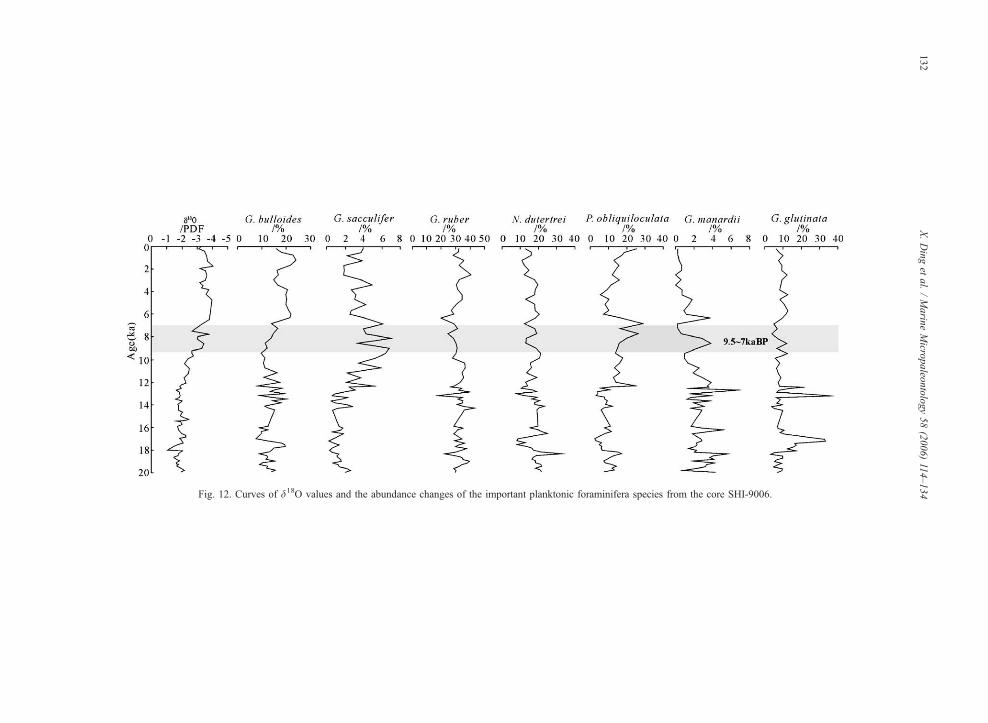
Fig. 12. Curves of d18O values and the abundance changes of the important planktonic foraminifera species from the core SHI-9006.
X.Dinget
al./Marin
eMicro
paleo
ntology58(2006)114–134
132
X. Ding et al. / Marine Micropaleontology 58 (2006) 114–134 133
Java upwelling region, with lysocline levels above
~2800 m.
2) Cluster analysis of the planktonic foraminifera
assemblages separates the area into 5 regions with
different oceanographic condition: I—Banda/Java re-
gion, II—Timor region, III—Java upwelling region,
IV—Indian monsoon Sumatra region, and V—NW
Australia margin region.
3) The planktonic foraminifera assemblages from
region I are dominated by N. dutertrei, G. ruber and
G. bulloides, characterizing an environment with abun-
dant nutrient supply, low salinity, high productivity, and
large seasonal SST and SSS changes. Region II is
dominated by G. glutinata, G. menardii and N. duter-
trei, and is a typical environment with high salinity, a
relatively high productivity, relatively strong dissolu-
tion and a deep thermocline. Region III is dominated by
G. menardii and N. dutertrei, and is an environment
with upwelling activity, high productivity, and strong
dissolution. Region IV is dominated by N. dutertrei, P.
obliquiloculata, G. sacculifer and G. ruber, indicating
a relatively oligotrophic environment with low salinity,
a shallow thermocline, and high dissolution. Region V
is dominated by G. sacculifer and G. ruber and indi-
cates an environment with oligotrophy, deep thermo-
cline, and weak dissolution.
3) The abundance changes of G. bulloides in core
SHI-9006 from the Banda/Java region and core SHI-
9034 from the Java upwelling region indicate an
enhanced southeastern monsoon and stronger upwell-
ing in the Java upwelling system at 10–8 ka BP,
corresponding to a period of strengthened east Asian
monsoon.
Acknowledgements
This work was supported by the K. C. Wang Foun-
dation of Center National de la Recherche Scientifique
of France, and the National Natural Science Foundation
of China (Grant No. 40476022, 40272074).
Appendix A. Supplementary data
Supplementary data associated with this article can be
found, in the online version, at doi:10.1016/j.marmicro.
2005.10.003.
References
Ahmad, S.M., Guichard, F., Hardjawidjaksana, K., Adisaputra, M.K.,
Labeyrie, L.D., 1995. Late Quaternary paleoceanography of the
Banda Sea. Mar. Geol. 122, 385–397.
Andreasen, D.J., Ravelo, A.C., 1997. Tropical Pacific Ocean thermo-
cline depth reconstructions for the last glacial maximum. Paleo-
ceanography 12 (3), 395–413.
Be, A.W.H., 1977. An ecological, zoogeographic and taxonomic
review of recent planktonic foraminifera. In: Ramsay, A.T.S.
(Ed.), Oceanic Micropaleontology, vol. 1. Academic Press, Lon-
don, pp. 1–100.
Berger, W.H., 1979. Preservation of foraminifera. Foraminiferal eco-
logy and paleoecology. SEPM Short Course 6, 105–155.
Blunier, T., Chappellaz, J., Schwander, J., Stauffer, B., Raynaud, D.,
1995. Variations in atmospheric methane concentration during the
Holocene epoch. Nature 374, 46–49.
Bray, N.A., Hautala, S., Chong, J., Pariwono, J., 1996. Large-scale
sea level, thermocline, and wind variations in the Indonesian
Throughflow region. J. Geophys. Res. 101 (C5), 12239–12254.
Brock, J.C., McClain, C.R., Anderson, D.M., Prell, W.L., Hay, W.W.,
1992. Southwest monsoon circulation and environments of recent
planktonic foraminifera in the northwestern Arabian Sea. Paleo-
ceanography 7 (6), 799–813.
Cane, M.A., 1998. A role for the tropical Pacific. Science 282,
59–61.
Cannariato, K.G., Ravelo, A.C., 1997. Pliocene–Pleistocene evolution
of eastern tropical Pacific surface water circulation and thermo-
cline depth. Paleoceanography 12 (6), 805–820.
Curry, W.B., Thunell, R.C., Honjo, S., 1983. Seasonal changes in the
isotopic composition of planktonic foraminifera collected in Pan-
ama Basin sediment traps. Earth Planet. Sci. Lett. 64 (1), 33–43.
Ding, X., Guichard, F., Bassinot, F., Labeyrie, L., Fang, N.Q., 2002.
Evolution of heat transport pathways in the Indonesian Archipel-
ago during last deglaciation. Chin. Sci. Bull. 47 (22), 1912–1917.
Duplessy, J.C., Be, A.W.H., Blanc, P.L., 1981. Oxygen and carbon
isotopic composition and biogeographic distribution of planktonic
foraminifer in the Indian Ocean. Palaeogeogr. Palaeoclimatol.
Palaeoecol. 33, 9–46.
Emerson, S., Bender, M., 1980. Carbon fluxes at the sediment water
interface of the deep-sea: calcium carbonate preservation. J. Mar.
Sci. 39, 139–162.
Enfield, D.B., 1989. El Nino, past and present. Rev. Geophys. 27 (1),
159–187.
Fairbanks, R.G., Sverdlove, M., Free, R., Wiebe, P.H., Be, A.W.H.,
1982. Vertical distribution and isotopic fractionation of living
planktonic foraminifera from the Panama Basin. Nature 298,
841–844.
Gingele, F.X., De Deckker, P., Girault, A., Guichard, F., 2002. History
of the South Java Current over the past 80 ka. Palaeogeogr.
Palaeoclimatol. Palaeoecol. 183, 247–260.
Godfrey, J.S., Golding, T.J., 1981. The Sverdrup relation in the
Indian Ocean, and the effect of Pacific–Indian Ocean through-
flow on Indian Ocean circulation and on the East Australian
Current. J. Phys. Oceanogr. 11, 771–779.
Godfrey, J.S., Ridgway, K.R., 1985. The large-scale environment of
the poleward-flowing Leeuwin Current, western Australia: long-
shore steric height gradients, wind stresses and geostrophic flow.
J. Phys. Oceanogr. 15, 481–495.
Gordon, A.L., 1986. Interocean exchange of thermocline water.
J. Geophys. Res. 91, 5037–5046.
Gordon, A.L., Fine, R.A., 1996. Pathways of water between the
Pacific and Indian Oceans in the Indonesian seas. Nature 379,
146–149.
Hanebuth, T., Stattegger, K., Grootes, P.M., 2000. Rapid flooding of
the Sunda Shelf: a late-glacial sea-level record. Science 288,
1033–1035.
X. Ding et al. / Marine Micropaleontology 58 (2006) 114–134134
Hilbrecht, H., 1997. Morphologic gradation and ecology in Neoglo-
boquadrina pachyderma and N. dutertrei (planktic foraminifera)
from core top sediments. Mar. Micropaleontol. 31, 31–44.
Hirst, A.C., Godfrey, J.S., 1993. The role of Indonesian throughflow
in a global ocean GCM. J. Phys. Oceanogr. 23, 1057–1086.
Kawahata, H., Nishimura, A., Gagan, M.K., 2002. Seasonal change in
foraminiferal production in the western equatorial Pacific warm
pool: evidence from sediment trap experiments. Deep-Sea Res. II
49, 2783–2800.
Levitus, 1998. World Ocean Atlas. http://www.ifremer.fr/sismer/
references/climatologies/.
Linsley, B.K., 1996. Oxygen-isotope record of sea level and climate
variations in the Sulu Sea over the past 150,000 years. Nature 380,
234–237.
Martinez, J.I., De Dekker, P., Chivas, A.R., 1997. New estimate for
salinity changes in the Western Pacific Warm Pool during the Last
Glacial Maximum: oxygen-isotope evidence. Mar. Micropaleon-
tol. 32, 311–340.
Martinez, J.I., Taylor, L., De Deckker, P., Barrows, T., 1998. Plank-
tonic foraminifera from the eastern Indian Ocean: distribution and
ecology in relation to the Western Pacific Warm Pool (WPWP).
Mar. Micropaleontol. 34, 121–151.
Martinez, J.I., De Deckker, P., Barrows, T.T., 1999. Palaeoceanogra-
phy of the last glacial maximum in the eastern Indian Ocean:
planktonic foraminiferal evidence. Palaeogeogr. Palaeoclimatol.
Palaeoecol. 147, 73–99.
Martinson, D.G., Pisias, N.G., Hays, J.D., Imbrie, J., Moore, T.C.,
Shackleton, N.J., 1987. Age dating and the orbital theory of the
ice age: development of a high resolution 0 to 300,000 year
chronostratigraphy. Quat. Res. 27, 1–29.
Muller, A., Opdyke, B.N., 2000. Glacial–interglacial changes in
nutrient utilization and paleoproductivity in the Indonesian
Throughflow sensitive Timor Trough, easternmost Indian Ocean.
Paleoceanography 15, 85–94.
Patrick, A., Thunell, R.C., 1997. Tropical Pacific sea surface tem-
peratures and upper water column thermal structure during the last
glacial maximum. Paleoceanography 12, 649–657.
Pflaumann, U., Jian, Z., 1999. Modern distribution patterns of plank-
tonic foraminifera in the South China Sea and western Pacific: a
new transfer technique to estimate regional sea-surface tempera-
tures. Mar. Geol. 156, 41–83.
Pflaumann, U., Duprat, J., Pujol, C., Labeyrie, L.D., 1996. SIMMAX:
a modern analog technique to deduce Atlantic sea surface tem-
peratures from planktonic foraminifera in deep-sea sediments.
Paleoceanography 11 (1), 15–35.
Porter, S.C., An, Z., 1995. Correlation between climate events in the
North Atlantic and China during the last glaciation. Nature 375,
305–308.
Prell, W.L., Curry, W.B., 1981. Faunal and isotope indices of mon-
soonal upwelling: western Arabian Sea. Oceanol. Acta 4, 91–98.
Ravelo, A.C., Fairbanks, R.G., Phillander, S.G.H., 1990. Reconstruct-
ing tropical Atlantic hydrography using planktonic foraminifera
and an ocean model. Paleoceanography 5, 409–431.
Reynolds, L.A., Thunell, R.C., 1986. Seasonal production and mor-
phologic variation of Neoglaoboquadrina pachyderma (Ehren-
berg) in the northeast Pacific. Micropaleontology 32, 1–18.
Shi, Y., Kong, Z., Wang, S., Tang, L., Yao, T., Zhao, X., Zhang, P.,
Shi, S., 1993. Mid-Holocene climates and environments in China.
Glob. Planet. Change 7, 219–233.
Siedler, G., Church, J., Gould, J., 2001. Ocean Circulation and
Climate: Observing and Modeling the Global Ocean, International
Geophysics Series, vol. 77. Academic Press, A Harcourt Science
and Technology Company, pp. 303–314.
Sirocko, F., Sarnthein, M., Erlenkeuser, H., Lange, H., Arnold, M.,
Duplessy, J.C., 1993. Century-scale events in monsoonal climate
over the past 24,000 years. Nature 364, 322–324.
Thiede, J., Junge, B., 1992. Faunal and floral indicators of ocean
coastal upwelling (NW African and Peruvian continental mar-
gins). In: Summerhayes, C.P., Prell, W.L., Emeis, K.C. (Eds.),
Upwelling Systems: Evolution Since the Miocene, Geological
Society London Special Publication, vol. 64, pp. 47–76.
Thompson, P.R., 1981. Planktonic foraminifera in the western north
Pacific during the past 150,000 years: comparison of modern and
fossil assemblages. Palaeogeogr. Palaeoclimatol. Palaeoecol. 35,
241–279.
Thunell, R.C., Reynolds, L.A., 1984. Sedimentation of planktonic
foraminifera: seasonal changes in species flux in the Panama
Basin. Micropaleontology 30, 243–262.
Thunell, R., Anderson, D., Gellar, D., Miao, Q., 1994. Sea-surface
temperature estimates for the tropical western Pacific during the
Last Glaciation and their implications for the Pacific Warm Pool.
Quat. Res. 41, 225–264.
Tomczak, M., Godfrey, J.S., 1994. Regional Oceanography: An In-
troduction. Pergamon, Oxford. 422 pp.
Visser, K., Thunell, R., Stott, L., 2003. Magnitude and timing of
temperature change in the Indo-Pacific warm pool during degla-
ciation. Nature 421, 152–155.
Wang, P.X., 1998. Western Pacific in glacial cycles: seasonality in
marginal seas and variability of Warm Pool. Sci. China (Ser. D) 4
(1), 35–41.
Wang, L.J., Sarnthein, M., Grootes, P.M., Erlenkeuser, H., 1999a.
Millennial reoccurrence of century-scale abrupt events of East
Asian monsoon: a possible heat conveyor for the global deglaci-
ation. Paleoceanography 14 (6), 725–731.
Wang, L., Sarnthern, M., Erlenkeuser, H., Grimalt, J., Grootes, P.,
Heilig, S., Ivanova, E., Kienast, M., Pelejero, C., Pflaumann, U.,
1999b. East Asian monsoon climate during the late Pleistocene:
high-resolution sediment records from the South China Sea. Ma-
rine Geology 156, 245–284.