Distributed Topology-based Resource Allocation for a ... · Distributed Topology-based Resource...
71
Transcript of Distributed Topology-based Resource Allocation for a ... · Distributed Topology-based Resource...


Distributed Topology-based Resource Allocation for a Femtocell-based Cellular Network
A thesis submitted to
Division of Research and Advanced Studies
University of Cincinnati
In partial fulfillment of the requirements for the degree of
MASTER OF SCIENCE
in the Department of Computer Science
College of Engineering and Applied Science
July 2015
by
Anusha Dharmaraj
B. Tech. in Computer Science and Engineering, Vardhaman College of Engineering, JNTU,
Hyderabad, India 2010.
Thesis Advisor and Committee Chair: Dr. Dharma P. Agrawal

ii
ABSTRACT
A Femtocell (FC) is a low-power, low cost indoor cellular home base station installed by an end
user in a home or an office environment. The typical indoor coverage is tens of meters, covering
the area of several rooms. Femtocell is a new technology designed to solve communication
problems with cell phones indoors. It is known as a home base station because it works like an
indoor cell tower. Apart from this, it also provides internet connectivity to devices that connect
to it. When an FC is turned on, it searches for the mobile phone’s appropriate operator in the
environment. Femtocells use internet infrastructure to satisfy VOIP with mobile phone.
Femtocells have many advantages; such as increased indoor coverage, better voice quality, and
higher performance data. Some of the recognized, recurring challenges in a Femtocell Network
are interference, handoff, security, accessibility etc. One of the major drawbacks of using this
technology is that it increases traffic load on the internet lines.
When FCs are densely deployed, interference between them becomes an unavoidable issue.
Hence, there is an urgent requirement for a robust interference management technique before
FCs can be extensively used for commercial purpose. In this thesis, we address this issue by
taking into account, the dynamic topology of FC-network to allocate communication channels to
each FC carefully. This also addresses the co-domain interference problem in FCs. We include
simulation results to demonstrate that our proposed novel scheme, known as the distributed
topology-based spectrum allocation, facilitates efficient resource allocation for each cell;
avoiding spectrum overlap, thereby enabling high resource low interference and increased reuse
efficiency.

iii

iv
ACKNOWLEDGEMENTS
First and foremost, I offer my sincerest gratitude to my thesis advisor and committee chair, Dr.
Dharma P. Agrawal, for providing me the opportunity to do research under his esteemed
guidance, motivating me with his teaching, reviewing and providing feedback for my thesis, and
encouraging me throughout the course of my Master’s program. I would also like to thank Dr.
Chia Han and Dr. Carla Purdy for reviewing my thesis and agreeing to be a part of my defense
committee.
I thank my fellow students at the Center for Distributed and Mobile Computing (CDMC) for
their support and suggestions. I especially thank Hailong Li for his invaluable ideas and
suggestions during various phases of my research.
I would like to extend my deepest gratitude to two very special people at the Graduate Studies
Office- Julie Muenchen and Barbara Carter, for allowing me the opportunity to work with them
as a Graduate Assistant for over 2 years. I am grateful for all the help and encouragement
provided during my tenure.
Beyond academics, I would like to thank Sahithi Chintapalli for applying to the same school and
coming all the way from India with me to be a part of my American journey, and supporting me
through thick and thin. This would not have been easy without her. Special thanks to my best
friend and partner in crime, Abhi, for all the encouragement and moral support.

v
Lastly, none of this would have been possible without the constant love and encouragement of
my family. Huge thanks to my brother Abhishek, who motivates me to do better each day. He is
my pillar of strength. I would like to express my heart-felt gratefulness to my parents for guiding
me in the right direction throughout my life, yet giving me the freedom to make my own
decisions. I shall never be able to express in words how thankful I am to God for making me
their daughter. I dedicate this thesis to them.

vi
Table of Contents
ABSTRACT ................................................................................................................................................................II
TABLE OF CONTENTS ........................................................................................................................................ VII
TABLE OF FIGURES………………………………………………………………...………………….………IX LIST OF TABLES……..………………………………………………………………...………………….………XI
CHAPTER 1
INTRODUCTION ....................................................................................................................................................... 1
1.1 Background ................................................................................................................... 1
1.2 History of Femtocells ................................................................................................... 3
1.3 Overview ...................................................................................................................... 4
1.4 Scope of the Study ........................................................................................................ 5
CHAPTER 2
FEMTOCELLS OVERVIEW AND CO-LAYER INTERFERENCE .................................................................... 7
2.1 Femtocell Technology .................................................................................................. 7
2.2 Deploying Femtocells ................................................................................................... 8
2.3 Resource Management ................................................................................................. 9
2.4 Allocation of Spectrum ............................................................................................... 11
2.5 Interference ................................................................................................................. 12
2.6 Co-Layer Interference ................................................................................................. 13
CHAPTER 3
DISTRIBUTED TOPOLOGY-BASED RESOURCE ALLOCATION FOR A FEMTOCELL-BASED
CELLULAR NETWORK ......................................................................................................................................... 21
3.1 Labeling FBS .............................................................................................................. 22

vii
3.2 Sensing Neighbors ...................................................................................................... 24
3.3 Generating Neighbor List ........................................................................................... 25
3.4 Local Topology Table ................................................................................................ 25
3.5 Ordering FBS .............................................................................................................. 26
3.6 Dividing Channels ...................................................................................................... 27
3.7 Primary Channel ......................................................................................................... 27
3.8 Secondary Channel ..................................................................................................... 29
3.9 Supplementary Channel .............................................................................................. 31
3.10 Channel Allocation List .......................................................................................... 31
CHAPTER 4
SIMULATION EXPERIMENT ............................................................................................................................... 33
4.1 Path Loss..................................................................................................................... 33
4.2 Reserving Resource .................................................................................................... 34
4.3 User Connection ......................................................................................................... 34
4.4 Channel Selection ....................................................................................................... 35
4.5 Interference and SINR Calculation ............................................................................. 36
4.6 Our Model................................................................................................................... 38
4.7 Simulation Models ...................................................................................................... 38
4.8 Numerical Analysis .................................................................................................... 39
4.8.1 Numerical Simulation Model .................................................................................. 39
4.8.2 Numerical Simulation Results ................................................................................ 40
4.8.3 Inference from the results ....................................................................................... 43
4.9 Ranking Parameter ..................................................................................................... 44

viii
4.10 Network Simulation ................................................................................................ 45
4.10.1 QualNet ................................................................................................................... 45
4.10.2 Network Setup ........................................................................................................ 45
4.11 Inference from the results ....................................................................................... 54
CHAPTER 5
CONCLUSION AND FUTURE WORK ................................................................................................................. 56
5.1 Conclusion .................................................................................................................. 56
5.2 Future Work ................................................................................................................ 57
BIBLIOGRAPHY ...................................................................................................................................................... 58

ix
TABLE OF FIGURES
FIGURE 1.1: COMMUNICATION PATHS IN MACRO-FEMTOCELL NETWORKS ..................................... 3
FIGURE 2.1: TOTAL 3G FEMTOCELL DEPLOYMENT MARKET IN 2013 (TAKEN FROM [5]) .................. 9
FIGURE 2.2: CROSS-LAYER INTERFERENCE AND CO-LAYER .......................................................... 13
FIGURE 2.3: DOWNLINK COVERAGE AREAS OF FEMTOCELLS IN A RESIDENTIAL ENVIRONMENT WITH
ABSENCE OF MACROCELL COVERAGE (TAKEN FROM [6]) ....................................................... 15
FIGURE 2.4: DOWNLINK COVERAGE AREAS IF CINR>10 DB AT EACH SUBCHANNEL (TAKEN FROM
[5])......................................................................................................................................... 17
FIGURE 2.5: CO-LAYER DOWNLINK INTERFERENCE ....................................................................... 19
FIGURE 3.1: STEP-BY-STEP PROCEDURE FOR DYNAMIC RESOURCE ALLOCATION ............................ 22
FIGURE 3.2: ASSIGNING ADDRESS USING DHCP ............................................................................ 24
FIGURE 3.3: SENSING NEIGHBORS .................................................................................................. 25
FIGURE 3.4: DEPECTION OF ONE NODE A MAINTAINING LOCAL TOPOLOGY INFORMATION ............. 26
FIGURE 4.1: SINR VS PRIMARY CHANNEL POWER PROPOSED SCHEME ........................................... 40
FIGURE 4.2: SINR VS PRIMARY CHANNEL POWER OTHER SCHEME ................................................. 41
FIGURE 4.3: AVERAGE THROUGHPUT OF FEMTO-USERS FOR PERCENTAGE OF PRIMARY CHANNEL
USAGE .................................................................................................................................... 41
FIGURE 4.4: USER SATISFACTION COMPARISION FOR NUMBER OF FEMTOCELLS IN A NETWORK ..... 41
FIGURE 4.5: AVERAGE THROUGHPUT FOR EACH USER BASED ON CELL THROUGHPUT AND USER
SATISFACTION ........................................................................................................................ 42
FIGURE 4.6: AVERAGE THROUGHPUT FOR EACH FEMTOCELL FOR PROPOSED SCHEME AND EXISTING
SCHEME .................................................................................................................................. 42
FIGURE 4.7: SIMULATION NETWORK TOPOLOGY ........................................................................... 48

x
FIGURE 4.8: SIMULATION NETWORK SNAPSHOT ............................................................................ 48
FIGURE 4.9: RUNNING SIMULATION DEMONSTRATION WITH TRAFFIC FLOW ................................. 499
FIGURE 4.10: TOTAL NUMBER OF BYTES SENT ON CLIENT SIDE (FROM HOPS) ................................. 50
FIGURE 4.11: NUMBER OF BYTES RECEIVED ON SERVER SIDE......................................................... 50
FIGURE 4.12: TIME AT WHICH FIRST PACKETS WERE SENT (FROM HOPS) ........................................ 51
FIGURE 4.13: FIRST-PACKET RECEIVED ON SERVER SIDE ................................................................ 51
FIGURE 4.14: TOTAL NUMBER OF PACKETS SENT (FROM HOPS) ...................................................... 52
FIGURE 4.15: TOTAL PACKETS RECEIVED ....................................................................................... 52
FIGURE 4.16: AVERAGE JITTER EXPERIENCED BY USERS ................................................................ 53
FIGURE 4.17: TOTAL THROUGHPUT ON CLIENT SIDE (AT HOPS) ...................................................... 53
FIGURE 4.18: TOTAL THROUGHPUT ON RECEIVING END WHICH DECIDES NETWORK PERFORMANCE
......................................................................................................................................................................... ..54
LIST OF TABLES
Table 2.1: Subchannel division in F1 and F2………………………………………………20

xi

1
CHAPTER 1
INTRODUCTION
1.1 Background
In the United States, there are about 306 million people. The majority of these people use
telephone and internet. Also, 86 percent (262.7 million) people, use cell phones. This means
there is a huge market in this sector. The operators are in competition with each other. To have
more customers, they conduct some campaigns, decrease monthly prices, make new kinds of
plans (like family plan, data plan), etc. Another way to attract more customers is also to serve
with high quality voice call. To obtain it, operators build up new cell towers. Every cell tower is
built up at a cost of approximately $750,000. Only in Baton Rouge, LA, there are 622 cell
towers . This means operators paid $466.5 million for their towers in only Baton Rouge, LA.
But, in fact, the customers end up paying that amount over the years. Also cell towers don’t
necessarily ensure that we get good quality voice calls everywhere and everytime. Especially,
when a call originates indoor, voice call quality may diminish. In statistics, an average of 40% of
voice call originate from indoors. This is almost half of the all voice calls made. If a call is made
from indoor and there is a problem with voice calls, it could potentially lead to operators losing
customers. To address this problem, much research has been done and some improved solutions
have been proposed such as WiFi. But these solutions are expensive.
Therefore, our goal should be using an approach that makes it cost effective for both
operators and customers, and have good voice quality and data traffic. To fulfill them, Femtocell
technology has been introduced. Femtocells are home base stations. They look like modems and

2
are set up indoor. An existing internet infrastructure, such as DSL and cable is used to route the
signals. It offers a cheap solution and has 5 bar coverage indoor.
An autonomous wireless architecture has been proposed in [1] which introduced the
concept of automatic deployment and configuration of cellular access points. These cellular
access point are low-power base stations. The major key to the autonomous wireless architecture
is a unified physical layer with interference and power management capabilities that will allow
an autonomous deployment of cells of various sizes [2].
This new autonomous wireless network architecture led to the invention of small base
stations called femto access points (FAP), commonly known as femtocell (FC), Femto Base
Stations (F-BS) or Home NodeBS (H-NB) in 3GPP standards. FCs provide indoor cellular
coverage to mobile devices and also utilize broadband internet connections in their premises as
backbone communications. They are the size of a regular modem. Some of the key features of
these FCs are their low-cost, low-power consumption, broadband-connectivity, and user-
installability [3]. We use the terms FC and F-BS interchangeably to denote a femtocell
throughout this thesis.

3
Figure 1.1: Communication Paths in Macro-Femtocell Networks
Cellular phones can either communicate with an FC or the macro base station (M-BS) as
illustrated in Figure 1.1. Femtocells are hence backward compatible with existing technology,
i.e., mobile and smart phones which makes it the most favorite choice as compared to its
contenders.
1.2 History of Femtocells
In 1999, Bell Labs of Alcatel-Lucent first came up with the idea of home base stations.
Later in the year 2002, Motorola announced first 3G-based home base station. Several
companies have already reduced the price and size of 2G technology and gave the term picocells.
These picocells are only small in size and cheaper as compared to larger equipment but were still
aimed at large companies or group of people. The operator had to install these for the customers.
Taking this boom into consideration, picoChip was a new company that started making and
demonstrating lower cost 3G chipsets. Using this, two UK based startup companies in 2004
started developing their own chipsets and 3G home base stations - Ubiquisys and 3Way

4
networks, now a part of Airvana. Around 2005, the term femtocell was adopted for a standalone,
self-configuring home base station. Rupert Baines, VP Marketing of picoChip and Will Franks,
CTO of Ubiquisys are both said to have coined the term during this period, although picoChip in
April 2006 registered the website URL www.femtocell.com first. The term “Femtocell” was first
documented by analyst Dean Bubley at a conference in November 2005. Several products by
several vendors were demonstrated at the 3GSM conference in February 2007. As the topic
gained more popularity and many companies showing interest in femtocell research, the Femto
Forum (www.femtoforum.org) was set up in July 2007. It represents the field of femtocells and
has been aimed to promote this concept on a large scale so that it could gain popularity.
1.3 Overview Over the next few years, billions of devices will be connected to the Internet and cloud-based
applications using 3G and LTE mobile wireless networks, creating a tremendous demand for
mobile wireless capacity and ubiquitous coverage [4]. The femtocell concept aims to provide
ultra-low cost, low power 3G base stations for a home environment by combining fixed-line
broadband access with cellular technology.
Traditional cellular networks cannot handle the demand for resources even with 4G technology.
There are limitations on how many Macro base stations can be built due to space, cost and local
resistance. There is limited availability of spectrum and increasing the number of stations within
the allocated spectrum will not only cause more traffic congestion but also decrease the overall
performance in the long run. Homes and small offices can be equipped with small base stations
with low transmission power but high signal to interference noise ratio (SINR).

5
This enables providers to explore new market with high speed, low-cost, better quality services
so that could capture wireline voice minutes, and revenue can be grown. Node-B works like an
FC in UMTS. However, an FC also contains Radio Network Controller and all the core elements.
Thus, it only requires a DSL connection or an Internet cable. It does not require a central
controller like a cellular network. Although an FC looks like a WiFi modem, their functionalities
are totally different. Femtocells do not implement any of the WiFi technologies such as IEEE
802.11b, 802.11g, 802.11n, and 802.11ac. Instead it implements cellular technologies such as
GSM/GPRS/EDGE, UMTS/HSPA/LTE and mobile WiMAX [5].
Femtocells can be classified into two categories based on their capacity: Home and
Enterprise. Home FBS can support 3-5 users simulteanously and an enterprise FBS can support
8-16 users at the same time. Although there is a limited bandwidth, FCs aim to provide high data
rate services for the residential sector. FCs can also be classified into UMTS FAP, GSM FAP,
WiMAX FAP, and so on.
1.4 Scope of the Study
There are two kinds of access controls- Closed and Open. In a closed access control, only
owners of the FBS are allowed to connect to it, whereas in an Open access control, any user can
connect. The problem with closed access control is that it increases Cross-Layer interference.
Open access control increases network overhead and is usually insecure.
Interference management is one of the foremost problems that need to be addressed
before FCs can be widely accepted by the users’ community. There are two types of interference
in FCs:

6
-Cross layer interference: Occurrence of disturbance at FCs due to unwanted signals from the
base station of another network.
-Co-Layer interference: Occurrence of noise due to other FCs that belong to the same network,
causing decrease in the quality of signal.
In this thesis, we propose a distributed algorithm that takes into account dynamic topology of
FCs and carefully allocates communication channels to each F-BS. This also addresses the co-
layer interference problem in FCs. We perform extensive simulations to demonstrate a novel
scheme, called as distributed topology-based spectrum allocation. This avoids spectrum overlap
that facilitates efficient resource allocation for each cell, thereby enabling low interference under
high resource utilization and increased reuse efficiency.

7
CHAPTER 2
FEMTOCELLS OVERVIEW AND CO-LAYER INTERFERENCE
2.1 Femtocell Technology
In traditional WiFi networks uplink transmission, a common channel is used for access
by the users. Collision avoidance between multiple users accessing the channel at the same time
is done using Carrier Sensing Multiple Access-Collision Avoidance (CSMA/CA) channel access
protocol. Under CSMA/CA, the performance of wireless connections degrades drastically when
the number of users accessing the resource increases.
Femtocells, on the other hand, are better at handling interference when there are large
number of users in the network and also adapt to the legacy cellular standards such as the 2G
TDMA, the 3G Wideband Code Division Multiple Access (WCDMA), or the 3G+ OFDMA
access schemes.
The key of femtocell technique is femtocell base station (F-BS), which is installed by the
end users at home or an office environment, provides wireless interface for subscribers and
connects small number of wireless users with Core Telephony Network via wired internet. F-BS
is used for an indoor network access purpose. A typical indoor coverage is tens of meters,
serving the region of several rooms. For the region of M-BS coverage, there may exist tens to
hundreds of F-BSs, which forms tens to hundreds femtocells supplementing coverage holes
inside the M-BS.
Several wireless network companies have released their F-BS products and multiple wireless
service providers have already started field trial in many regions. However, performance of

8
existing femtocell devices is still far below users’ expectation. Compared to existing well-
developed techniques, each femtocell has its own new characteristics as follows.
(1) Operating in licensed frequency band,
(2) Wired Internet backhaul,
(3) Ad-hoc network, and
(4) No central controller.
2.2 Deploying Femtocells F-BSs do not need an enormous amount of effort and manpower to be installed. They can be
installed by the users themselves rather than the service providers. When users of the same
network as the FC are within the communication range, the user’s device automatically connects
to the FC. This enables minimum interference to M-BS and also neighboring F-BSs. The key
motive behing that the technology is expected to provide high data rate service to the residential
sector.

9
Figure 2.1: Total 3G femtocell deployment market in 2013 (Taken from [5])
2.3 Resource Management
Quality of Service (QoS) is one of the major concerns when it comes to incorporating
new technologies in an existing and ever growing user base. The operator has to concentrate on
providing the best QoS, with greater coverage area, and possibly serve several users at the same
time.
But, it is difficult to satisfy all these requirements at the same time. If coverage area is
increased, the quality is commonly decreased. If quality is increased, it affects the handling
capacity. If these issues are not addressed and handled properly, it drastically impacts the overall
business prospects. User’s will be very disappointed if these criteria are not met and that could

10
lead to an eventual loss. Therefore, there is an urgent need for operators to make sure they
provide service with high quality, vast coverage, and high capacity.
The main resources affecting these factors are admission control, power management and
channel use. According to [1], power is a physical resource. Higher the power is, better will be
the throughput and the coverage. Channels are defined by orthogonal spreading codes of
WCDMA and combination of sub-carrier frequencies and time slots in the Orthogonal Frequency
Division Multiple Access (OFDMA). Admission implies allowing access to the resources by the
users. A user must first be recognized by the FC and be allowed to access its resources. The
access control mechanisms will aid in such an admission process.
All the users within a given cell’s scope share the same resources. Hence, the total
received power available is also shared among them. When the network is large (when the
number of users are high), an overall decrease in the performance of the FC is observed. When a
new user gets added, it only adds to extra load on the network, higher interference and poor QoS
for all existing users.
Efficient power control mechanism is needed to keep such problems from re-occurring.
Allocation of power resource should be strictly monitored and coded in such a way that no user
gets overly chosen when some user is completely deprived of access. The power control
mechanism should provide expected QoS to each user while reducing interference at other users
as much as possible [6]. If a user is experiencing too much interference, FC is notified and
requested to adjust the power level accordingly so that the downlink interference is reduced.
Efficient channel control mechanisms ensure that no user gets special privilege over the
other when they are at the same level. Each user should be allocated optimum amount of channel
space in order to achieve good QoS. The downlink channel is shared bu all users in the network.

11
If there are free channels available occasionally, it is safe to assign more than one channel to one
user for transmission to achieve higher throughput at lesser transmission power. Channel control
and power control are inter-dependent factors and should take each other into consideration. This
is necessary so that the interference is avoided in a downlink channel utilization.
To understand co-layer mechanism between two FCs, we need to consider monitoring
their downlink parameters. By using the admission control strategy, we can limit the number of
users that can access an FC at any given time. In [1], a user count based algorithm is proposed
that ensures that each user consumes fixed amount of radio resources and puts a cap on the
amount of radio resources to be consumed. Another downlink method for admission control is
the cell load. This will give a better admission control mechanism than just using user count as
the cell load primarily depends on the throughput of an FC.
2.4 Allocation of Spectrum
Classifying based on how FCs access the resource spectrum, two kinds of deployments
are possible: dedicated channel deployment and co-channel deployment. In dedicated channel
deployment, the FCs will have their own frequency band and will not interfere with the M-BS
channels. This reduces interefence issues between FCs and M-BSs. But the biggest limitation of
this approach is that getting a dedicated frequency spectrum for each FC network is a tedious
task. Hence, mobile operators usually go with co-channel deployment where FCs and M-BSs
share the same frequency spectrum. The major advantage is higher spectral efficiency [7] [8].
Although the major concern is the cross-layer interference, extensive work has been done to

12
efficiently manage cross-layer intereference. However, in this thesis, we only discuss a method
to reduce co-channel interference.
2.5 Interference With the introduction of femtocells, the conventional network topology has to undergo
some changes. The network is now divided into two layers: the macrocell layer and the femtocell
layer. Such a network architecture is therefore called a two-layer or two-tier network [5]. The
first layer consists of the traditional cellular network and the second layer can consist of several
cells that can be deployed in either organized or a random manner. The second layer consists of
several small (microcells or femtocells) that can be deployed in order to provide coverage in
places where the first layer architecture fails to have adequate signal strength. This can ensure
improved coverage as well as higher data rates as the traffic is distributed among various cells.
Given its advantages, there are also few disadvantages with this two-layer architecture.
One of them being the interference. When several cells of a single network are transmitting at the
same time, the receiving device gets confused as to which signal to select. This could possibly
cause a lot of disturbance and could introduce noise. Existing systems such as CDMA and
OFDMA will need to adapt to this new change and make way of incorporating frequency
planning strategies in order to co-exist with the new two-layer network architecture. Hence,
interference management is among the most important challenge that service providers must face
before F-BS can be widely accepted. Femtocell interference can be divided into two categories:
(I) Interference between Macrocell and Femtocell (Cross-Layer Interference)
(II) Interference between adjacent Femtocells (Co-Layer Interference)

13
Figure 2.2: Cross-Layer interference and Co-Layer
2.6 Co-Layer Interference Co-Layer means cells belonging to the same network layer. Co-Layer interference is
described as the occurance of noise due to other femtocells that belong to the same network
layer, influencing the quality of signal. F-BSs are deployed by the end users in a very small
spaces such as residential areas or small office rooms. Because of these restricted areas, it is very
likely that several FCs exist in a very close proximity of each other. This can cause interference
between them.
To get a clear picture of the scenario, let us consider an example. Lets us say a mobile
user of a particular carrier is in a location where the macrocell is unable to provide coverage. A
14
femtocell fa is deployed in this location to make sure the user gets good signal quality. In the
surrounding area, if there are additional femtocells using the same frequency, the user will
experience noise. The performance of both the femtocells will be affected. If the Carrier to
Interference and Noise Ratio (CINR) value is too low, it could be impossible to establish a
communication through any femtocell and such a location would be called as a dead zone[5].
The impact of interference will be different for different access methods. There are three kinds of
access methods:
1. Public access method where anybody can connect to a femtocell,
2. Private access method where only registered users can access, and
3. Hybrid access method where it can function as both public and private based on
different scenarios.
Figure 2.3 projects a realistic scenarios of femtocells under different Quality of Service (QoS)
requirements.

15
Figure 2.3: Downlink coverage areas of femtocells in a residential environment with absence of macrocell coverage (Taken from [5])

16
The dark squares indicate the location of the F-APs and the black areas are regions where the
CINR requisite is not met by any femtocell.
Figure 2.3 (a) shows the coverage areas of nine randomly deployed femtocells when the
coverage area is defined as those locations where the main femtocell signal is stronger than the
overall interference plus noise if only one carrier is assumed [5]. In an open access network, a
user can move from one FC to another as long as no dead zones are present.
Figure 2.3 (b) presents the same scenario with the added restriction of having a dominant signal
of at least 10 dB above the interference+noise level (CINR>10 dB). It is then clear how dead
zones grow larger as the QoS requisites increase and it could possible, a user would not be able
to move freely from one femtocell to another due to the presence of these gaps even with these
open access femtocells. [5].
The concept of dead zone differs from CDMA to OFDMA femtocell. In CDMA, the
modulation process is spread across the spectrum which reduces the Carrier to Interference and
Noise Ratio. The conditions are a bit relaxed as compared to OFDMA. In OFDMA, the dead
zones are dependent on the sub-channel allocation. The sub channel allocation differs for each
femtocell. Channels can be divided into a fixed set of sub-channels before transmission or can be
dynamically divided at the time of network formation.
Figure 2.4 illustrates allocation of sub-channels in OFDMA for the scenario mentioned in figure
2.3.

17
Figure 2.4: Downlink coverage areas if CINR>10 dB at each subchannel (Taken from [5])

18
From the above Figure 2.4, we can observe that the dead zones are minimized in terms of
numbers when the spectrum is divided into sub-channels. Co-Layer interference can occur in two
scenarios: uplink and downlink. Uplink co-layer interference occurs when many users
transmission time is synchronized. If more than one user starts a connection with one or more
femtocells at the same time, interference is primarily present at the user end. In downlink
interference, it’s the other way around. When more than one FC begins transmitting data to users
simultaneously, there could be interference originating from one of these base stations. The point
of interference in such cases (TDD) is fairy simple to determine. In situations where
transmissions from F-BSs are not synchronized, it makes the task of determining the source of
interference a little more complicated. There are different approaches to addressing each of these
kind of interference in both CDMA and OFDMA systems.
Let us discuss downlink interference with an example. The algorithm that is proposed in this
thesis is mainly focused on reducing interference caused due to FCs as a source. Hence, we will
look at how downlink interference occurs in using both CDMA and OFDMA systems.
CDMA: When FCs are deployed at very close proximity indoors, their transmission signals
interfere with each other due to various factors like open space, thin walls, windows and doors.
In order to mitigate this interference, the power levels of FCs need to be controlled using
adaptive techniques. In case of private access, a user that is registered with one FC should not
face connectivity issues and higher noise due to another FC which employs higher power and
larger range. The transmit power of each femtocell can be decided at the time of adding it to the
network. So, this will co-exist with other cells without causing interference. Also, the problem
with simultaneous transmission can be resolved by implementing proper time hopping

19
techniques. The basic concept of time hopping is to only transmit during a short interval of time
instead of being powered for the entire time.
OFDMA: In OFDMA, the situation of interference is different from that of CDMA due to
division of sub-channels. The spectrum is split into multiple sub-channels and every user
connected to one FC need not be transmitting on the same sub-channel. When there is an
interference between two FCs in OFDMA, not all users that are connected to those FCs
experience the same kind of interference.
Figure 2.5: Co-Layer downlink interference
Let us consider an example: Let us assume there are 4 users u1, u2, u3 and u4 and two
FCs F1 and F2 are placed in adjacent rooms of two residential apartment units located next to
each other as shown in Figure 2.5. The spectrum is divided into 5 subchannels. u1, u2 are users
belonging to the first house with femtocell F1 and u3, u4 belong to the second house with

20
femtocell F2. Let us assume u3 and u1 get a call and both are talking standing in the balcony
with doors open. The FCs are located right next to each other. Now, let us say first three
subchannels of F1 are allocated to u1. 2, 3, 4 of F2 are allocated to u3. Since u1, u3 are both
outside and very easily exposed to each others’ FCs, there is a high chance of low-voice quality,
call drop or noise in both their calls because they are both also on the same sub-channels. This
has been illustrated in table 2.1.
Table 2.1: Subchannel division in F1 and F2

21
CHAPTER 3
DISTRIBUTED TOPOLOGY-BASED RESOURCE ALLOCATION FOR A
FEMTOCELL-BASED CELLULAR NETWORK
Based on the literature review covered in the previous chapter, it can be deduced that there is a
dire need for stronger interference mitigating techniques in order to cater to the evolving
demands of the market and overcome associated challenges. Several papers have discussed cross
layer interference. But little work has been done on co-layer interference. Interference between
F-BSs becomes unavoidable when they are densely deployed [9]. When multiple F-BSs
simultaneously operate in the same channel, it causes interference which significantly affects the
system performance. Resource allocation is an effective method to address the co-channel
interference problem [10]. This can be done in two ways: centralized and distributed. Due to
their adhoc nature, a distributed resource allocation is desirable for FCs. Many new schemes
have been introduced for resource allocation in welldeveloped networks like in [11] and [12]. A
fully distributed resource allocation algorithm avoiding interference between M-BS and F-BS
has been proposed in [13]. A fully distributed and scalable algorithm known as autonomous
component carrier selection has been proposed in [14] that could easily mitigate interference
between FCs. This method takes into account five component carriers of an LTE-Advanced
spectrum by allocating cells as their primary and secondary component carriers. However, no
work has been done taking F-BS topology as a network information for allocating resources. In

22
this thesis, we propose a topology-based resource allocation algorithm for mitigating co-layer
interference between F-BSs.
A novel 10-step process called distributed topology-based resource allocation for a femtocell
based cellular network is proposed to provide a clear definition in a step-by-step method that can
effectively aid in reducing co-layer interference. Figure 2.6 shows the steps involved in this
method:
Figure 3.1: Step-by-step procedure for dynamic resource allocation
3.1 Labeling FBS
Similar to our computer with unique IP address or MAC address, each F-BS in local indoor
environment should have a unique local label to differ itself from others. Since each F-BS is
connected with broadband internet, there is a unique MAC address with every F-BS. This MAC

23
address is a unique sequence of number, assigned to each internet adapter by manufacturer.
When a user first installs an F-BS, is connected with a cable to the local internet router. The
modem searches the downlink frequency for available RF carrier. When a carrier is found, it
checks if a MAC message has been present on the downstream. The CMTS issues periodic
messages for new modems which contain information that decided which upstream frequency,
intital tramsit power, symbol rate and modulation type to be used. After configuring this
upstream channel, F-BS looks for granting messages that tell when the slot counter number rolls
over and what are the next available slots. This is a standard IP routing model where the modem
forwards packets to a default router. These FCs are plug-and-play installable [15]. The addresses
can also be allocated using DHCP (Dynamic Host Configuration Protocol) which is used to
assign IP addresses to a devide automatically. The DHCP server can be either a Server system, a
router, Windows, or Linux machines. The DHCP option should be enabled in order to allocate IP
addresses to new connecting devices.

24
Figure 3.2: Assigning address using DHCP
3.2 Sensing Neighbors
After the F-BS is powered on and the initialization process has completed, the first step in
sensing the environment. The FCs can scan the surrounding environment and listen for any users
requesting access in uplink channels within its coverage area. F-BSs have ability of scanning the
frequency radio around itself, which is similar to regular cell phone that scans its cell phone
tower. This function could help F-BS to identify its local environment and how many F-BSs are
close-by. The FBS uses antenna to scan signal-received-power-level (SRPL) from its
neighboring F-BSs. The signal received power is calculated as a linear average (in absolute
power) from those resources that are transporting cell specific information. If the reception is
diversified, the SRPL is calculated by taking an average of all the received signals [16]. There is
a SRPL threshold in F-BS system and one F-BS only treats the nearby F-BS with SRPL higher
25
than a given threshold as its neighbors, as lower signal power level means that F-BS is too far
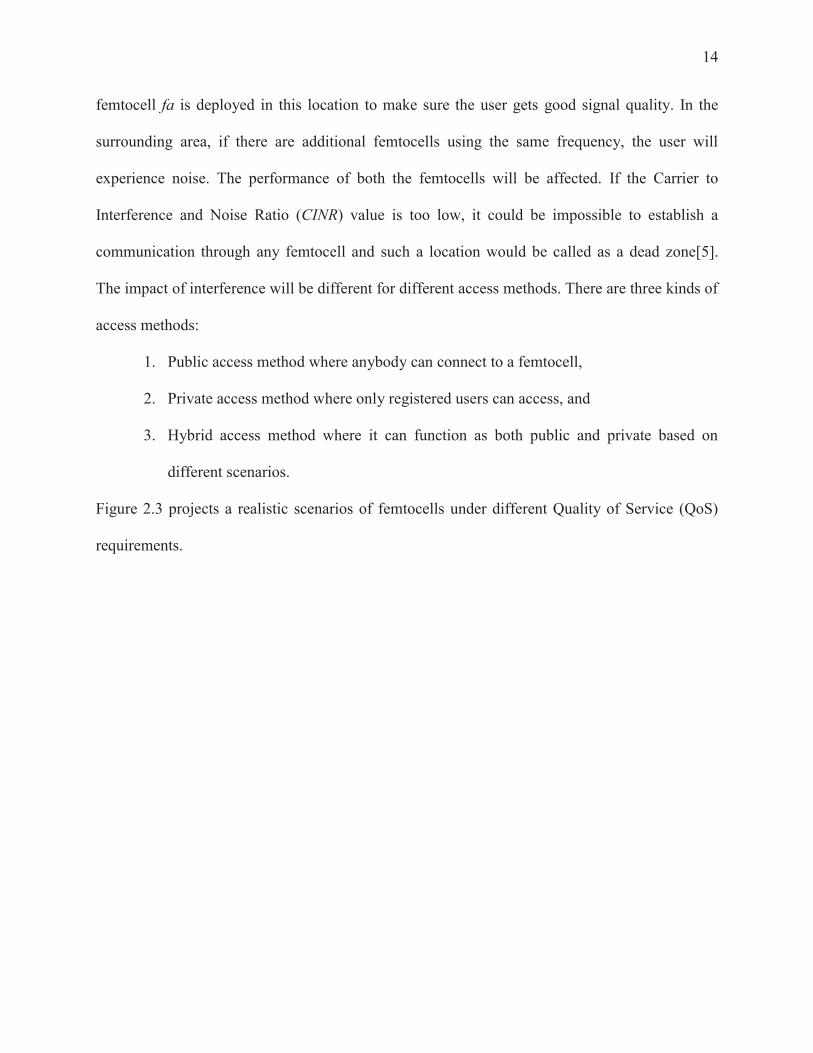
away to have significant effect on the performance of the system. All requesting users will be
granted resources. However, different priorities will be assigned to different users based on the
criteria set at the network level which we will discuss in the following sections.
Figure 3.3: Sensing Neighbors
3.3 Generating Neighbor List After the second step of sensing neighbors, each FBS created and maintains a neighbor
list. Methods have been proposed for the construction and updation of neighbor information
tables for a dynamic network. During this stage, all nearby users within the femtocell coverage
are identified. Each FC maintains this list which changes with changing network topology.
3.4 Local Topology Table With each F-BS having its own neighboring list, a network topology table is formed. In
computer networking, an algorithm called distance-vector routing protocol (DVRP) is

26
extensively used, where each computer node can only own its local neighbor information and
they pass the local information to all their neighbors’ and renew the neighbors list. They keep
passing information until no list needs to be updated and then all computer nodes have the same
global information for all computers in this network. This DVRP could be applied here when
each F-BS has a local neighbors list and each F-BS can build a local node topology table.
Figure 3.4: Depection of one node A maintaining local topology information
3.5 Ordering F-BS
In this step, all F-BS are ordered based on a simple rule executed in each node. This rule could
be either ascending or descending order of MAC addresses, time stamp of when the nodes are
switched on (First come, first serve), or any other ordering technique for maintain consistency of
the network. For example, let us assume there are six FCs in a network, each having a unique
MAC address labeled as A B, C, D, E, F. Let us say each of these was added to the network and
turned on in the same order mentioned. Based on first come, first serve, we might attain a

27
sequence like A < B < C < D < E < F. This step is not to give priority to one F-BS over another.
The distribution of spectrum will be done later based on other factors. It is used only to attain an
ordered list for easy labeling to allocate resources.
3.6 Dividing Channels
This is the most important step of the process. The entire available LTE bandwidth in [14], is
divided into 5 channels of 20 MHz each. The spectrum is divided based on the number of F-BSs
in the network. This avoids two neighbor FCs using the same channel. In order to divide the
spectrum, we follow a orthogonal frequency-division multiplexing (OFDM) technique. In
OFDM, the entire available bandwidth is divided into a series of sub-channels. Each of these sub
channels operate on different signal frequencies which can be run in parallel.
3.7 Primary Channel
After dividing the entire available spectrum, each F-BS is allocated one primary channel.
We denote the primary channel for any given node A by P(A). Primary channel is the first choice
for cellular communication and overlap would never occur because no two F-BS share the same
primary channel. As stated in [14], we assume each FC always has one active channel, called the
primary channel. Each FC’s primary channel is automatically selected when the it is initially
switched on. Depending on offered traffic in the cell and mutual interference coupling with
surrounding cells, transmission and reception on all component carriers may not always be the
best solution, especially for users on the edge of the cells. It is therefore proposed that each FC
dynamically selects additional channels for transmission or reception. This channel can be called

28
a secondary channel. All the other channels are muted for the cells that do not select them. This
selection of primary and secondary channels is done locally in a distributed manner at each node.
This eliminates the need for a centralized network. In order to avoid slow network generation
times and reduce computational overhead, we set the following rules for our scheme:
Primary channel is always given importance over the secondary.
Each channel can be primary for one and only one node. No two FCs can have the same
primary channel.
Secondary channels may be used when a node requires more than allocated bandwidth.
Secondary channel can only be used as long as it does not cause interference for other
cells that have that channel as a primary unit.
By following these rules, we can ensure that no one FC can gulp up the entire available
bandwidth available that causes interference for others. This method provides improved
scalability and also security for both the nodes and the channels. The allocation of channels is
done dynamically. Hence, FCs send periodic updates about the status of their allocation to ensure
that any new nodes joining the network do not miss this out. Each node maintains this
information in their neighbor list generated in step 3 and updates the local topology table in step
4.
Adapting for the cognitive access strategy mentioned in [1], density of reserved resource
owned by an FC can be calculated as the total number of owners over total number of users for
that FC. In this case, the total number of owners for a particular sub-channel will always be 1
because each sub-channel can only be allocated to one FC as a primary channel. The density will
vary for each FC depending on the number of users it is serving. Putting in an equation form,
density can be defined as 1 over total number of users Nu.

29
DFC=1/Nu…………………..(3.1)
The percentage of channel that can be dedicated to one FC as the primary can be calculated using
a utility function. Let this coefficient be KFC. This is dependent on the number of users that will
be accessing the FC at any given time. This ensures a distinction between reserving resources for
primary and secondary channels. KFC will be greater than or equal to corresponding DFC.
3.8 Secondary Channel
When primary spectrum is not enough for wireless communication or users want more
bandwidth for multimedia data, F-BS begins to use secondary channels. FCs have to take into
account the interference that could occur at other nodes before selecting secondary channels.
One of the design targets is to maximize the cell throughput for each FC, but always
ensuring that the experienced SINR on primary and secondary channels equals at least (C/I)P and
(C/I)S, which respectively represent minimum SINR targets expressed in decibels for the primary
and secondary [14]. SINR of the primary is always assumed to be greater than that of the
secondary. Primary channels have more coverage and higher transmission power as compared to
the secondary. The decision whether or not to use a secondary channel is taken based on the
traffic at each node, the bandwidth it is using and number of users it is serving. As stated in [14],
the first source to provide this information is the local topology table, which provides realtime
information on the usage of the channels by neighboring FCs. The second source is something
called the background interference matrix (BIM), which expresses the interference coupling

30
between cells. Creation of BIM depends on the users at each node. Each user connected to an FC
performs SRPL for the downlink measurements which is done for the primary connected FC and
also its neighboring FCs. Based on these measurements, each FC calculates a ratio of SRPL of its
own to other cells, called the condition C/I sample [14]. Based on these values, each FC
estimates the quality of signals with which it can serve each of the users and BIM is built. This
value gives each node an estimate of interfereing cells, which it maintains in its table.
Set operations are needed for selection of secondary channels and some relations are proposed in
this project. For any given node A, we use PA, PA*, SA to represent the primary channel set, the
primary channel set of A’s neighbors, and the secondary channel set. Equation (2) is the set
operation on the secondary channel.
S(A)= *) - P(A) - P(A)*………………….(3.2) Where X denotes set of all A’s neighbors
Resource allocation can be done based on the power levels as mentioned in [1]. The total power
for any given FC is the sum of its initial power plus the data power which is dependent on the
number of channels it uses. If a primary channel is inadequate to meet its demands, an FC makes
use of the secondary channel, as described earlier. Relations mentioned below can determine
how much portion of a node’s primary channel can be reserved for the FC and the rest can be
used as secondary.
PTotal = Pinitial + Pdata………………………..(3.3)
Pdata = Pprimary + Pother…………………….…..(3.4)
Pprimary = KFC (Pdata)…………………………(3.5)
Therefore, Pothers = 1-(KFC(Pdata))……..…………………(3.6)

31
3.9 Supplementary Channel
To increase the channel reuse efficiency, more channel space can be allocated without causing
interference to others. Supplementary channel set can be empty as well for few FCs. There is a
possibility that a node’s supplementary channel might overlap with other node’s secondary
channel. It is necessary to scan the environment before using a supplementary channel because
priority is given to the secondary channel over supplementary, primary channel over secondary.
Let E(A) denote node A’s supplementary channel, then, P(A) > S(A) > E(A). We use this set of
operations to define an equation for supplementary channel as follows:
E(A) = U - P(A) - S(A) - P(A)*…………………………………(3.7) Where U is the set of all available channel parts in the network.
3.10 Channel Allocation List Based on steps 7, 8, and 9, each F-BS is assigned three kinds of channels and overlapping is
limited to minimum to minimize co-channel interference. In the final step, we could summarize
step 7-9 and build a channel allocation list for each F-BS. The channel allocation list could be
considered as a union operation of primary, secondary and supplementary channel list.
Channel Allocation List= ……………………………(3.8)

32
FBS behave in an adhoc manner. They use cognitive strategy to keep an eye on the
environment and make changes to their resources to adapt to the network so as to maintain an
optimum state. This is how distributed topology could be formed dynamically.

33
CHAPTER 4
SIMULATION EXPERIMENT
As observed in our discussion so far, the number of resources used by an FC depends on several
factors which we will consider now. The number of users accessing the resource and their role
plays a huge role in setting these factors. Apart from that, we have environmental factors to
consider like throughput, SINR, power level, path loss, usage probability, penetration, distance
and insulation. In this section, we do channel modeling based on the path loss, reserving
resources, and user impact that are dependent on most of these factors and their inter-relationship
between each other. We also give a simulation experiment parameters and the results.
4.1 Path Loss
Signal strength received by a user can be determined using a path loss model. For co-
layer FC networks, the path loss model ITU P.1238 is recommended by the Femto Forum. The
scenario considered consists of the user the and FC in the same house. An additional 20dB
deduction is considered for wall penetrations with a maximum two-wall penetration, if the FC
and user are in different rooms. The following equation gives a path loss calculation for an FC
and a user atleast 1m apart as:
PL = 20.log10(f) + N.log10(d) – 28 + δ…………………(4.1)

34
Where PL is path loss in decibels, δ is the shadow fading effect coefficient represented by a
Gaussian random variable of 4σ, N is a coefficient for which the value is 22 for commericial
areas, and 28 for residential regions. We use an average value of 25 for simplicity.
4.2 Reserving Resource
In order to manage available resources better, we assign priority to the primary users
(owners) of an FC. These owners share the primary resource of the FC that are registered with
and the other users accessing it, are served based on availability of resources. In order to stay
close to practical scenario, we assume that each FC can only support up to eight primary users at
a time. The remaining secondary users (visitors) are served based on 3GPP-defined opportunistic
scheduling. The concept of resource reservation varies for different cellular standards. In 3G
WCDMA systems, resources are distributed based on the power level. In an OFDMA system,
resources are divided based on the frequencies or time or both. When a user connects to an FC,
the FC authenticates the user based on some identification number. If the identification matches,
the user is considered as the primary user or owner and if the identification number is different,
the user is considered a visitor.
4.3 User Connection
Any user that is trying to connect to an FC can detect the received pilot signals and
attempt to connect itself to the base station with the highest received pilot power. The received
signal power (R) is a factor of transmitted signal power (P) with corresponding path loss (PL)
and antenna gain (G)

35
……………………….(4.2)
4.4 Channel Selection
F-BS typically covers a circular area with a fixed radius. They are uniformly distributed over a
linear area with a given density. A random number of users are allocated for each F-BS. In an
OFDMA based cellular system with F femtocells, each of them serves N users. For practicality
point of view, we will consider a residential scenario with a possibility of no less than 6 and no
greater than 10 FCs to maintain. The available spectrum is split into K channels (where K = F).
Each femtocell selects a primary channel P by scanning the environment. The channel with
highest probability “b” is selected. This probability is based on the highest offering of SINR. A
reuse factor “r” is introduced for the use of a primary channel P by a distant femtocell that is not
in the immediate neighboring area of the node using P. The reuse factor is defined in such a way
that when a channel P is in use, it cannot be used simultaneously by more than of available
femtocells (F) for keeping interference at a reasonable level [17]. The relationship between K
and b is selected based on r as given below:
K = min(r, F)b where 1 ≤ r ≤ F………….(4.3)
In case where F ≤ r, Fb channels are allocated to the available set of nodes so that each FC can
select disjoint subset of frequencies [17] for transmissions interference free. If F ≥ r, then rb
channels are allocated. The selection of b suchannels is made under the assumption that by

36
limiting the reuse factor, the co-channel interference will be within manageable limits. This
process of channel selection is similar to that of WiFi systems, where the router scans the
environment and selects the channel with best signal quality from all the available channels [18].
For computing b, we assume that each FC has atleast ‘c’ per channel rate. For b channels, the
user throughput would be:
TFC > c.b…………………(4.4)
In order to derive a value for b, we compute K in such a way that each femtocell user has a rate α
times larger than the average rate of MBS users. If the throughput of an MBS user is TMBS,
TFC ≥ c.b =α.TMBS………………..(4.5)
From equation 4.3,
Hence,
…………………(4.6)
4.5 Interference and SINR Calculation
When one FC transmits desired signals to its users, it causes unwanted interference to its
neighboring FCs. Hence, this is one of the most important points to be taken into consideration
while allocating channels. The deployment scenario can be divided into several zones,

37
aggregating more than 5 but less than 7 FCs per zone. The total aggregate interference emitted
from a zone should also be taken into consideration because there could be a large number of
femtocells using the same channel. This division not only simplifies the application of mitigation
algorithm but also makes it easy to keep a closer note of the problem areas. It could be quite
challenging to obtain an ideal performance situation when availability of resources is limited
while the number of users increases. Most popular femtocell providers limit the number of users
to a closed access FC to 4 or less in order to be able to handle this issue effectively.
Taking all the factors into consideration, a centralized method would be much more difficult to
handle and prove to be inefficient when a non-idealistic scenario is present. Hence, we opt for a
distributed method that could adjust according to the local network topology. When FCs share
the same primary channel adjacent to each other, a higher level interference may be present.
Thus, neighboring femtocells are assigned to different channels to avoid co-channel interference.
In [19], the authors have imperatively selected the Hungarian algorithm that is generally used to
solve the linear task allocation. As we considered about the zones earlier, each zone in the
network will be implementing the Hungarian algorithm to assign different channels to each
femtocell and each of this channel will be sub-divided into secondary and supplementary
channels.
In addressing interference mitigation, most of the schemes proposed have one QoS requirements
in common: the Signal to Interference Noise Ration (SINR). In order to provide desirable service
to users and meet the QoS requirement of service providers, SINR value needs to be improved.
This means that the ratio should always be maintained above a minimum threshold level. If it

38
reaches close to or goes beyond the set threshold, the network performance is affected
drastically. In fact, SINR has been touted to be the most important parameter in deciding the data
throughput of the LTE networks.
In simple words, SINR is defined as the power of the signal divided by sum of power of
interference and power of noise.
…………………(4.7),
where SP is the signal power, IP is the interference power, and NP is the noise power. Many adaptive SINR threshold allocation schemes have been proposed for wireless networks to
represent various network deployment models.
4.6 Our Model
Both cross-channel deployment and co-channel deployment networks have their own
advantages and disadvantages. In our model, we consider a co-channel femtocell system,
interference that can occur in various cases and consider the 10-step algorithm with a use-case
explanation. Network design and calculations involved for performance determination are
described in the following sub-sections.
4.7 Simulation Models
The analysis results are obtained in two ways:

39
1. Numerical Simulation: This simulation results are obtained from theortical concepts as
explained above with the implementation of proposed algorithm.
2. Network Simulation: This simulation results are obtained from an example real-life
scenario network using QualNet simulator.
4.8 Numerical Analysis
Two strategies are evaluated using numerical analysis to determine the output of both the
schemes and we compare to find the most efficient strategy. The two scenarios in this case are:
a. Network that allocates spectrum resources using distributed topology-based
channel allocation algorithm, and
b. Network that does not implement dynamic resource allocation scheme.
4.8.1 Numerical Simulation Model The numerical simulations are done by using a java program to generate a sample network and
then based on the network parameters, various graphs are plotted using Matlab 7.7.0 tool to
analyze the system performance.

40
4.8.2 Numerical Simulation Results
0 5 10 15 20 25 300
5
10
15
20
25
30
Primary Channel Power (dB)
SIN
R (
dB)
Primary Channel 90% utilization
Primary Channel 20% utilization
Figure 4.1: SINR vs Primary channel power proposed scheme
0 5 10 15 20 250
5
10
15
20
25
Primary Channel Power (dB)
SIN
R (
dB)
Primary Channel 90% utilization
Primary Channel 20% utilization
Figure 4.2: SINR vs Primary channel power other scheme

41
10 20 30 40 50 60 70 80 90 1000
20
40
60
80
100
120
140
160
180
200
Percentage
Ave
rage
Thr
ough
put
FBS using different downlink channel
FBS using same downlink channel
Figure 4.3: Average throughput of Femto-users for percentage of primary channel usage
0 1 2 3 4 5 60
0.1
0.2
0.3
0.4
0.5
0.6
0.7
0.8
0.9
1
Number of Femtocells
Use
r S
atis
fact
ion
Proposed Scheme
Other Scheme
Figure 4.4: User satisfaction comparision for number of Femtocells in a network
42
1 2 3 4 5 6 7 8 9 10 11 12 13 14 150
5
10
15
20
x10 6̂
User
Thr
ough
put
Based on Total Cell Throughput
Based on User Satisfaction
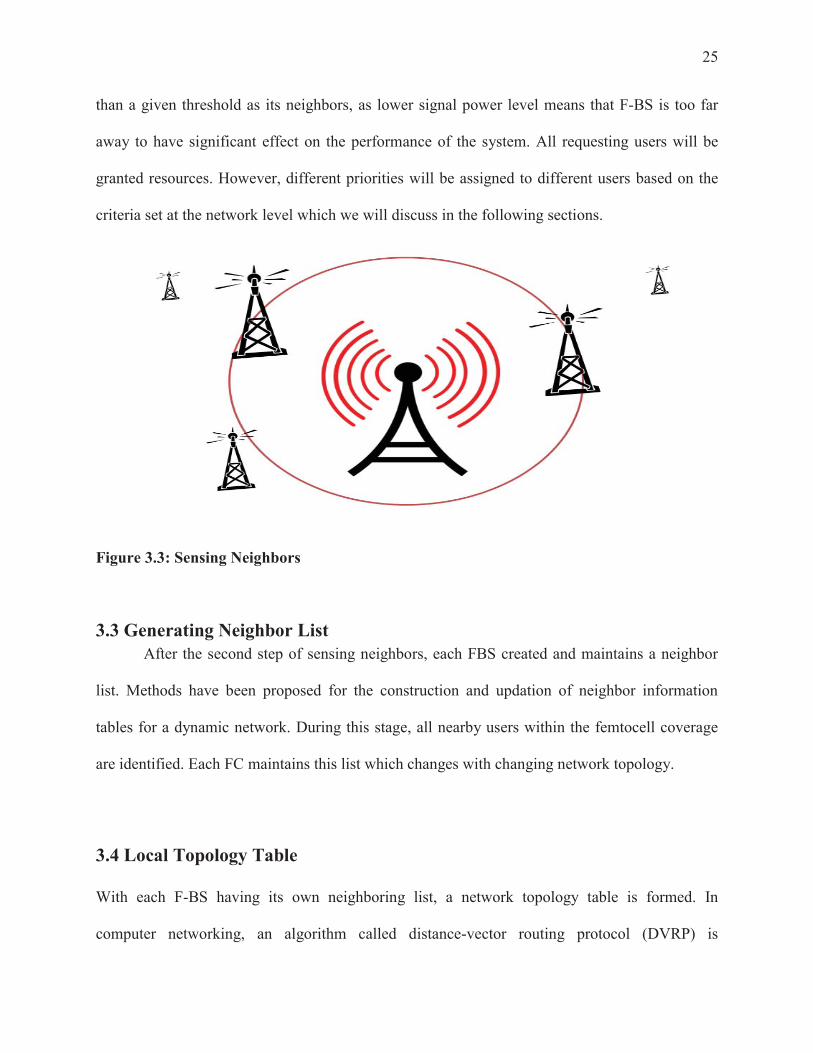
Figure 4.5: Average throughput for each user based on cell throughput and user satisfaction
1 2 3 4 5 6 7 8 9 100
5
10
15
20
x10 6̂
User
Thr
ough
put
Cell Throughput-Our Scheme
Cell Throughput-Other Scheme
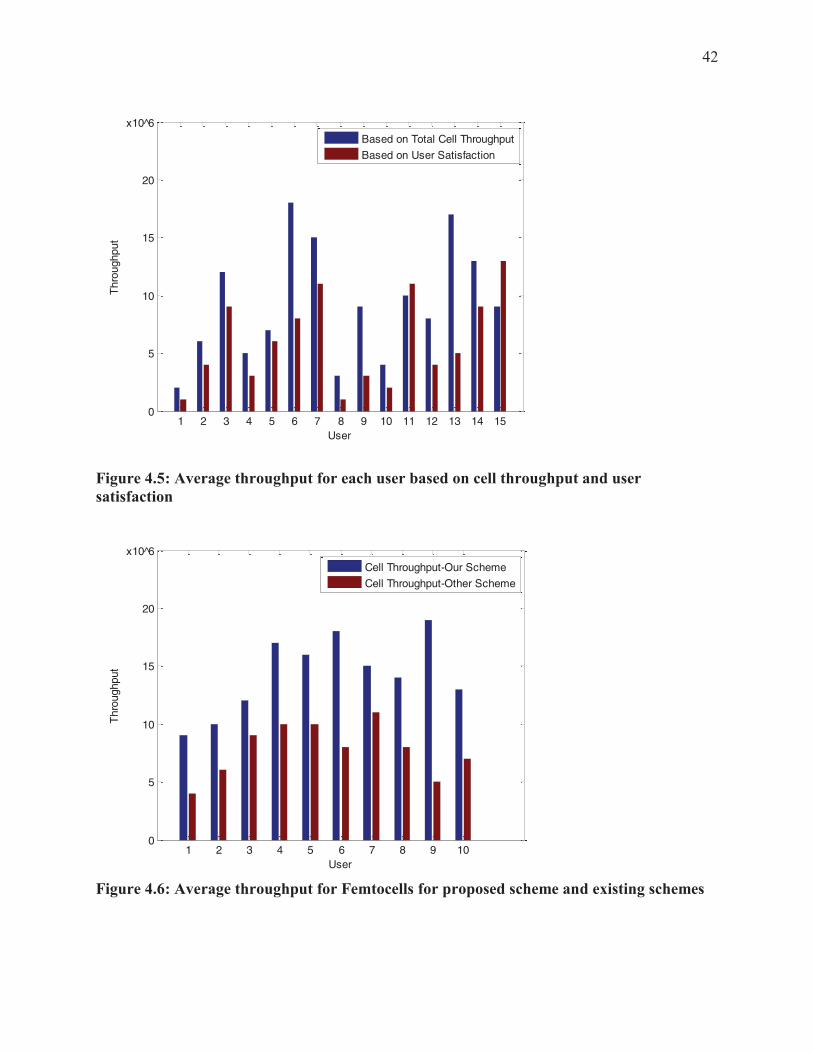
Figure 4.6: Average throughput for Femtocells for proposed scheme and existing schemes

43
4.8.3 Inference from the results From Figure 4.1, it can be observed that the SINR is much lower when higher percentage of
primary channel is used. The smaller the primary channel usage is, higher is the increase in
SINR. This is only taking into consideration a single cell. If multiple cells use the same primary
channel, this ratio would decrease drastically.
From figure 4.2, it can be observed that the average throughput collected for each user over a
period of time for a percentage usage of primary cell decreases with an increase in the usage. The
throughput is higher when only a smaller percentage of primary channel is used. This is the case
when only a single user uses a single channel. The values drop drastically when multiple users
use the same primary channel, which not only increases the usage percentage but also causes
network congestion leading to significant reduction in throughput.
From figure 4.3, it can be noted that for a single zone in a large network, the percentage of user
satisfaction decreases with increasing the number of nodes in the network. We divide a large
network into multiple zones, with each zone containing no more than 6-8 nodes. In our proposed
scheme, where each node has a dedicated primary channel, the worst case scenario doesn’t fall
beyond 40%. In other schemes (without a dedicated primary channel) with 6 nodes in a network,
the percentage of satisfaction is less than 10%, which indicates a sign of a really low network
performance.
In figure 4.4, we combine the statistics of Figure 4.2 and 4.3, to show an overall average
throughput per node based on the trade-off between the cell throughput and the user satisfaction.

44
4.9 Ranking Parameter
Ranking parameter is a unit that is used to determine the best deciding factor for comparing
multiple strategies proposing the same theory. It is very important to choose the right parameters
as selecting wrong ones to define the nature of a network could lead to undesired reults.
Identifying the right parameter is crucial in deciding the effectiveness of a proposed scheme.
There could be multiple ranking parameters for any given scheme. We identify a few of them as
listed below:
Number of nodes: A node is defined as a connection point or end point in a network used for
data transmission. The number of nodes in a network, also known as the size of the network, is
an important factor in analyzing the traffic handling capability of the network.
Throughput: Throughput is the amount of data transferred from a source to destination in a
specified amount of time. It is typically measured in kbps, Mbps, and Gbps and is a crucial factor
in measuring the network performance.
Packets received: Packets received is a measure of the number of packets that were successfully
received on the client side. There is a difference between the packets sent and packets
transmitted.

45
4.10 Network Simulation
4.10.1 QualNet
QualNet is a software that is used to model wired and wireless networks. It provides a
comprehensive environment for designing protocols, creating and animating network scenarios,
and analyzing their performance [20]. We can create network simulations and run them in a
similar way as we would do in a real time implementation.
QualNet enables users to:
Design new protocol models,
Optimize new and existing models,
Design large wired and wireless networks using pre-configured or user-designed models,
and
Analyze the performance of networks and perform what-if analysis to optimize them.
More information on QualNet can be found in [20].
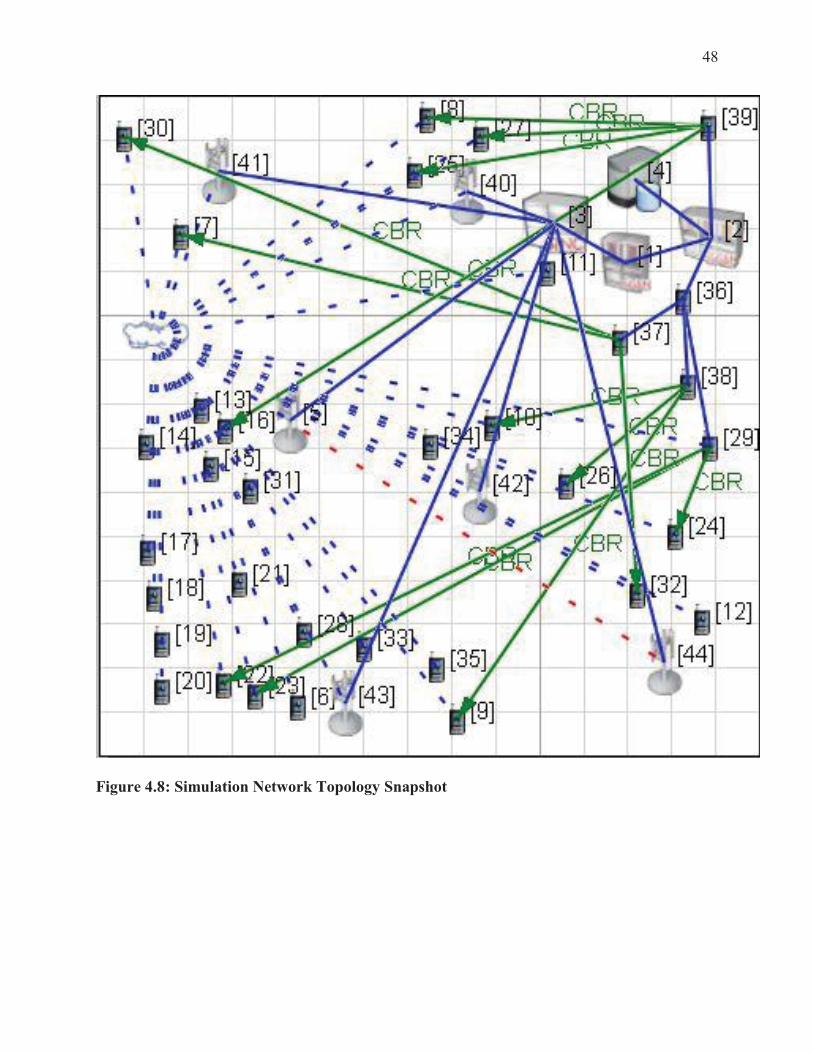
4.10.2 Network Setup This section describes the network configuration that has been used for the simulations. The
simulation consists of a grid topology in a square area.
There are 6 Femtocells deployed randomly,
There are 36 nodes deployed randomly around the entire network area,

46
All the femtocells are connected by a single MBS since they all fall under a close
geographical area,
The channel frequencies for each femto node is adjusted to different values and the
uplink and downlink channels are also configured,
It is assumed that a user can connect to only oneFC at any time, and,
Each simulation is run for 30s over multiple runs and the results obtained are averaged.

47
Figure 4.7: Simulation Network Topology
48
Figure 4.8: Simulation Network Topology Snapshot

49
Figure 4.93: Running simulation demonstration with traffic flow

50
Figure 4.10: Total number of bytes sent on client side (from hops)
Figure 4.114: Number of bytes received on server side
51
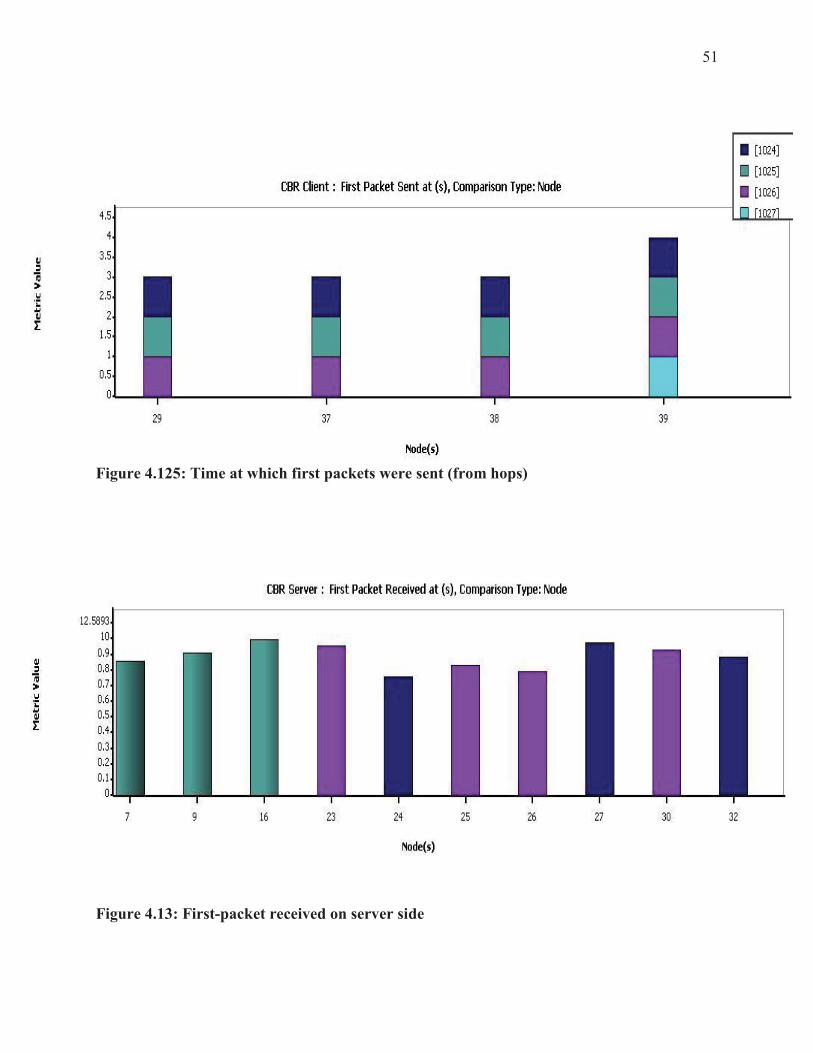
Figure 4.125: Time at which first packets were sent (from hops)
Figure 4.13: First-packet received on server side
52
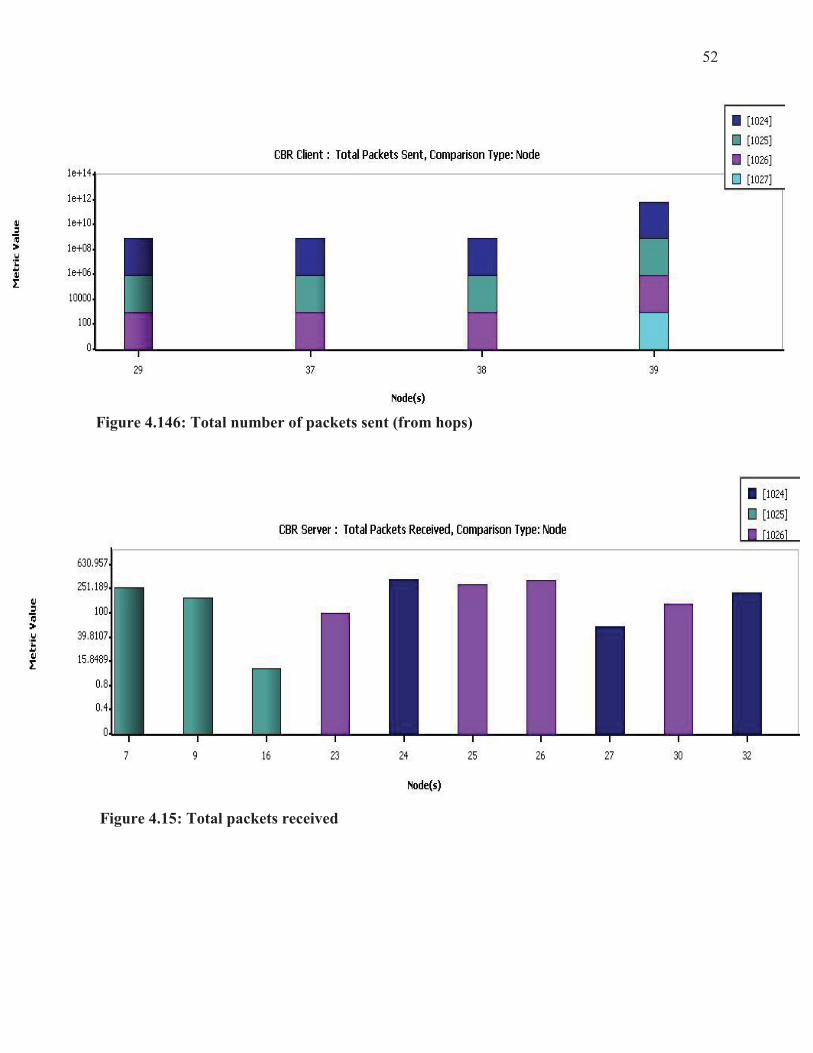
Figure 4.146: Total number of packets sent (from hops)
Figure 4.15: Total packets received

53
Figure 4.16: Average jitter experienced by users
Figure 4.17: Total throughput on client side (at hops)

54
Figure 4.18: Total throughput on receiving end which decides network performance
4.11 Inference from the results
We also run simulations with the same topology with channels using the same frequency
channel. The following are the inferences from the results obtained:
The distributed topology-based resource allocation strategy proves to be the best of all
the strategies evaluated. The application of this algorithm improves overall network
throughput on the receiver’s side.
Variating the number of users on each FC has not had a significant impact on the
performance of the network. The throughput hasn’t variated much which shows that the
algorithm is applicable to the networks with heavy traffic load.
The throughput gain on the femtocell side is also significantly increased, thus decreasing
the load and improving the performance of an M-BS

55
In certain scenarios, the throughput obtained is equal for both the strategies. This can
happen when the FCs not adjacent to each other are sercing multiple users because their
secondary or supplementary channels could be the same
From a number of consistent successful runs of the distributed topology algorithm, it can
be observed that the network throughput has a higher chance of bring enhancement in our
scheme.
More specifically, an FC implementing distributed topology-based channel allocation
more than 50% chance of improving the network over an existing strategy used in
comparision which only has a 26% chance of improving the network.

56
CHAPTER 5
CONCLUSION AND FUTURE WORK
5.1 Conclusion
We addressed the issue of co-channel interference by proposing a new scheme named distributed
topology-based resouce allocation for a femtocell-based cellular network, taking into account the
dynamic topology of a femto network to allocate communication channels to each FC carefully.
Our network takes into account a scenario where more than five FCs can exist simultaneously in
a network, increasing usability in practical day-to-day scenarios. We include simulation results to
demonstrate that our proposed scheme is novel, facilitates efficient resource allocation for each
cell; avoids spectrum overlap thereby enabling high resource low interference and increased
reuse efficiency. The simulation results show that our scheme not only improves network
throughput but also increases reusability.
57
5.2 Future Work The work presented in this thesis can be further worked on and improved in a way that allows for
many variations in the scenario. Many more real-time scenarios can be taken into account that
can make the problem even more challenging. A few of these are listed below:
One improvisation that can be done to this implementation is using LTE standard as we
need to make ways for new resource allocation schemes with new emerging technology.
Second different approach that can be taken to this thesis is to consider other factors that
determine the network health. In our scheme, we are mainly considering network throughput and
number of nodes are the primary criteria. Further work can be done by developing schemes
based the on QoS, network traffic, user handling capability, femtocell penetration, etc.
Third approach that can be taken is to find a resource reservation scheme with more than
six nodes in a network. This way, effective deployment schemes can be implemented in real time
scenarios when we have more than 6 femtocells deployed in close vicinity of each other.

58
Bibliography [1] L. C.-D. Yen, "Cognitive Access and Resource Allocation in Autonomous Femtocell
Networks," https://tspace.library.utoronto.ca/bitstream/1807/25526/6/Yen_Leon_201011_MASc_thesis.pdf, Toronto, 2010.
[2] E. S. Sousa, "Autonomous Infrastructure Wireless Networks," in 16th IST Mobile and Wireless Communications Summit, 2007.
[3] J. G. Andrews, G. Alan, and V. Chandrasekhar, "Femtocell Networks: A Survey," IEEE Communications Magazine, pp. 59-67, 2008.
[4] Airvana, [Online]. Available: http://www.airvana.com/technology/lte-femtocells/. [5] G. d. l. R. a. E. L. Jie Zhang, Femtocells Technologies and Deployment, John Wiley &
Sons Ltd, 2010. [6] Z. B. T. &. S. P. Lu, "Achieving User-Level Fairness in Open-Access Femtocell-Based
Architecture," Mobile Computing, IEEE Transactions, vol. 12, no. 10, pp. 1943-1954, 2013.
[7] H. Claussen, "Performance of Macro- and Co-Channel Femtocells in a Hierarchical Cell Structure," 18th Annual IEEE International Symposium on Personal, Indoor and Mobile Radio Communications, pp. 1-5, 2007.
[8] H. H. L. T. W. and S. L. Claussen, "Self-Optimization of Coverage for Femtocell Deployments," Wireless Telecommunications symposium , pp. 278-285, 2008.
[9] Y. S. P. and S. Talwar, "Wimax femtocells: A perspective on network architecture, capacity and coverage," IEEE Communications Magazine, vol. 46, no. 10, 2008.
[10].
I. K., and M. Naghshineh, "Channel assignment schemes for cellular mobile telecommunication systems: A comprehensive survey," IEEE Personal Communications, 1996.
[11] B.-J. Ko, "Distributed channel assignment in multi-radio 802.11 mesh networks," in Wireless COmmunications and Networking Conference, Hong Kong, China, 2007.
[12] C. Peng, "A distributed algorithm for optimal resource allocation in cognitive ofdma systems," in International Conference on Communications, Beijing, China, 2008.
[13] K. S. a. S. Rangarajan, "Efficient resource management in ofdma femto cells," in MobiHoc, New Orleans, Louisiana, 2009.
[14] K. P. a. P. M. L.G.U. Garcia, "Autonomous component carrier selection: Interference management for local area environments for lte-advanced," in IEEE Communications Magazine, 2009.
[15] D. J. F. S. D. D. Mark E. Laubach, Delivering Internet Connections over Cable: Breaking the Access Barrier, Wiley, 2001.
[16] J. T. Penttinen, The LTE / SAE Deployment Handbook, Wiley, 2011. [17] R. a. R. C. Di Taranto, "Throughput-Based Incentives for Residential Femtocells," in IEEE
22nd International Symposium on Personal Indoor and Mobile Radio Communications (PIMRC), Toronto, 2011.

59
[18] A. F. Molisch, Wireless Communications, 2nd Edition, Wiley, 2010. [19] Z. Z. R. L. J. P. a. H. Z. Xin Tao, "Downlink interference minimization in cooperative
cognitive LTE-femtocell networks," EURASIP Journal on Wireless Communications and Networking, 2013.
[20] "Scalable Network Technologies," [Online]. Available: http://web.scalable-networks.com/content/qualnet.