Distributed generation: remote power systems with advanced ...
17
Energy Policy 32 (2004) 1573–1589 Distributed generation: remote power systems with advanced storage technologies Woodrow Clark a, * ,1 , William Isherwood b,2 a Governors Office of Planning and Research, 1400 Tenth Street, Sacramento, CA 95184, USA b Lawrence Livermore National Laboratory (LLNL), USA Abstract The paper discusses derived from an earlier hypothetical study of remote villiages. It considers the policy implications for communities who have their own local power resources rather than those distributed through transmission from distant sources such as dams, coal power plants or even renewables generation from wind farms, solar thermal or other resources. The issues today, post 911 and the energy crises in California, Northeast North America and Europe, signal the need for a new and different approach to energy supply(s), reliability and dissemination. Distributed generation (DG) as explored in the earlier paper appears to be one such approach that allows for local communities to become energy self-sufficient. Along with energy conservation, efficiency, and on-site generation, local power sources provide concrete definitions and understandings for heretofore ill defined concepts such as sustainability and eco-systems. The end result for any region and nation-state are ‘‘agile energy systems’’ which use flexible DG, on-site generation and conservation systems meeting the needs of local communities. Now the challenge is to demonstrate and provide economic and policy structures for implementing new advanced technologies for local communities. For institutionalizing economically viable and sound environmental technologies then new finance mechanisms must be established that better reflect the true costs of clean energy distributed in local communities. For example, the aggregation of procurement contracts for on-site solar systems is far more cost effective than for each business owner, public building or household to purchase its own separate units. Thus mass purchasing contracts that are link technologies as hybrids can dramatically reduce costs. In short public–private partnerships can implement the once costly clean energy technologies into local DG systems. r 2004 Elsevier Ltd. All rights reserved. Keywords: Distributed generation energy; Environmentally sound technologies; Remote communities; Advanced technologies; Optimization and economic models 1. Introduction Distributed generation or distributed energy systems (DG) have been promoted in various forms for many years (Lund, 2000, 2001; CEC, 2002a, b, 2003; CPA, 2002). The notion that energy must be supplied from a central grid controlled by state monopolies has given way to power generated and transmitted from ‘‘agile’’ energy systems which are diverse, geographical and functional (Clark and Bradshaw, 2004). Some of these new DG systems are controlled by municipalities, other local government entities, private sector firms, coordi- nated public sector buildings, and in some emerging cases, partnerships between the public and private sectors. In general, DG is a different market mechanism structure for nation-states. DG has taken on a number of definitions. However, in California with the energy crisis from 2000 to 2002, one application was the use of ‘‘on-site’’ or sustainable power for buildings (CAA, 2001a, b; CPUC, 2002; CEC, 2002a, b; LADWP, 2002). The State undertook a program directed at ‘‘greening’’ public buildings. No matter what the configuration, the results tend to be same: more diverse supply of energy generation, ARTICLE IN PRESS *Corresponding author. Tel.: +1-916-445-9469; fax: +1-916-324- 9936. E-mail address: [email protected] (W. Clark). 1 Clark was Deputy Director/Senior Policy Advisor for Governor Gray Davis’ Office of Planning and Research (2000–2003). Isherwood is retired from Lawrence Livermore National Laboratory in the area of remote energy technological systems. 2 Basic data derived from earlier work with William Isherwood, Ray Smith, Woodrow Clark, Salvador Aceves, and Gene Berry at Lawrence Livermore National Laboratory (LLNL) and Professors Ronald Johnson, Deben Das, Douglas Goering, and Richard Seifert, from the University of Alaska Fairbanks (UAF) (Isherwood et al., 2000). 0301-4215/$ - see front matter r 2004 Elsevier Ltd. All rights reserved. doi:10.1016/S0301-4215(03)00017-X
Transcript of Distributed generation: remote power systems with advanced ...
Energy Policy 32 (2004) 1573–1589
Distributed generation: remote power systems withadvanced storage technologies
Woodrow Clarka,*,1, William Isherwoodb,2
aGovernors Office of Planning and Research, 1400 Tenth Street, Sacramento, CA 95184, USAbLawrence Livermore National Laboratory (LLNL), USA
Abstract
The paper discusses derived from an earlier hypothetical study of remote villiages. It considers the policy implications for
communities who have their own local power resources rather than those distributed through transmission from distant sources such
as dams, coal power plants or even renewables generation from wind farms, solar thermal or other resources. The issues today, post
911 and the energy crises in California, Northeast North America and Europe, signal the need for a new and different approach to
energy supply(s), reliability and dissemination.
Distributed generation (DG) as explored in the earlier paper appears to be one such approach that allows for local communities to
become energy self-sufficient. Along with energy conservation, efficiency, and on-site generation, local power sources provide
concrete definitions and understandings for heretofore ill defined concepts such as sustainability and eco-systems. The end result for
any region and nation-state are ‘‘agile energy systems’’ which use flexible DG, on-site generation and conservation systems meeting
the needs of local communities.
Now the challenge is to demonstrate and provide economic and policy structures for implementing new advanced technologies for
local communities. For institutionalizing economically viable and sound environmental technologies then new finance mechanisms
must be established that better reflect the true costs of clean energy distributed in local communities. For example, the aggregation
of procurement contracts for on-site solar systems is far more cost effective than for each business owner, public building or
household to purchase its own separate units. Thus mass purchasing contracts that are link technologies as hybrids can dramatically
reduce costs. In short public–private partnerships can implement the once costly clean energy technologies into local DG systems.
r 2004 Elsevier Ltd. All rights reserved.
Keywords: Distributed generation energy; Environmentally sound technologies; Remote communities; Advanced technologies; Optimization and
economic models
1. Introduction
Distributed generation or distributed energy systems(DG) have been promoted in various forms for manyyears (Lund, 2000, 2001; CEC, 2002a, b, 2003; CPA,2002). The notion that energy must be supplied from a
central grid controlled by state monopolies has givenway to power generated and transmitted from ‘‘agile’’energy systems which are diverse, geographical andfunctional (Clark and Bradshaw, 2004). Some of thesenew DG systems are controlled by municipalities, otherlocal government entities, private sector firms, coordi-nated public sector buildings, and in some emergingcases, partnerships between the public and privatesectors. In general, DG is a different market mechanismstructure for nation-states.DG has taken on a number of definitions. However,
in California with the energy crisis from 2000 to 2002,one application was the use of ‘‘on-site’’ or sustainablepower for buildings (CAA, 2001a, b; CPUC, 2002;CEC, 2002a, b; LADWP, 2002). The State undertooka program directed at ‘‘greening’’ public buildings. Nomatter what the configuration, the results tend to besame: more diverse supply of energy generation,
ARTICLE IN PRESS
*Corresponding author. Tel.: +1-916-445-9469; fax: +1-916-324-
9936.
E-mail address: [email protected] (W. Clark).1Clark was Deputy Director/Senior Policy Advisor for Governor
Gray Davis’ Office of Planning and Research (2000–2003). Isherwood
is retired from Lawrence Livermore National Laboratory in the area of
remote energy technological systems.2Basic data derived from earlier work with William Isherwood, Ray
Smith, Woodrow Clark, Salvador Aceves, and Gene Berry at
Lawrence Livermore National Laboratory (LLNL) and Professors
Ronald Johnson, Deben Das, Douglas Goering, and Richard Seifert,
from the University of Alaska Fairbanks (UAF) (Isherwood et al.,
2000).
0301-4215/$ - see front matter r 2004 Elsevier Ltd. All rights reserved.
doi:10.1016/S0301-4215(03)00017-X

separate sustainable energy systems, interconnectionproblems and barriers, and competition for customers.While distributed generation systems have not been
fully integrated into any state or national energy plan, anumber of state governments have serious legislativeinitiatives under way (CAA, 2002). In light of the energycrisis in California and then the threats to energyinfrastructures as a result of the 911 attacks on America,the blackouts in the Northeast USA and SouthernCanada and throughout Europe in the Summer of 2003,more attention is being given to this ‘‘flexible’’ systemsat the local level perspective for supplying reliableenergy (Lund, 2001; Clark and Lund, 2001; Clark andBradshaw, 2004). In California, to address these issues,Governor Davis’ Commission for the 21st Centuryspecifically recommended distributed generation (CPA,2002, pp. 40–44).This paper considers DG systems in the context of
these both energy and political events. The supply ofreliable energy is critical infrastructure for any societybut especially in the modern electron dependentindustrial nation-state. Remote communities of anykind can provide an excellent example of how dis-tributed energy systems can operate. The analysisfocuses upon a model of how remote communities mustpay economic and environmental penalties for electri-city, because they must import diesel as their primaryfuel for electric power production, paying heavytransportation costs and potentially causing environ-mental damage with empty drums, leakage, and spills.For these reasons, remote communities offer a viable
niche or demonstration market where sustainable energysystems based on renewable resources and advancedenergy storage technologies can compete favorably onpurely economic grounds, while providing environmen-tal benefits. These villages can also serve as a robustproving ground for systematic analysis, study, improve-ment, and optimization of sustainable energy systemswith advanced environmental technologies.This paper presents data, an analytical optimization
of a remote power system, economic parameters(Bolinger and Wise, 2002a, b), and derived policyrecommends (Clark, 2002) for a hypothetical Alaskanvillage (Isherwood et al., 2000). The analysis considersthe potential of generating electricity from renewableenergy (e.g., wind and solar), along with the possibilityof using energy storage to take full advantage of theintermittent renewable sources readily available to thesevillages. Storage in the form of either compressedhydrogen or zinc pellets can then provide electricityfrom hydrogen or zinc–air fuel cells when renewablesources are intermittent or undependable.The analytical results show a great potential to reduce
fossil fuel consumption and costs by using renewableelectricity generation technologies as well as advancedenergy storage devices. Moreover, it is suggested that
hydrogen could play a significant role as an energycarrier and for storage. Subsequent research appears toconfirm these earlier conclusions (Clark and Bradshaw,2004).DG can offer a number of viable economic solutions.
The best solution for the hypothetical Alaskan village,from a few years ago, appears to be a hybrid energysystem, which can reduce consumption of diesel fuel byover 50% with annualized cost savings by over 30% byadding wind turbines to the existing diesel generators.When energy storage devices are added (e.g., using
hydrogen or fuel cells), diesel fuel consumption andcosts can be reduced substantially more. With optimizedenergy storage, use of the diesel gensets can be reducedto almost zero, with the existing equipment onlymaintained for reliability and readiness. However, aboutone quarter of the original diesel consumption is stillused for heating purposes. Throughout the term ‘diesel’is used to encompass the fuel, often called ‘heating orfuel oil’, of similar or identical properties.Above all, the key to implementation of new
environmentally sound technologies is the ability toreduce costs. This was exactly how diesel and otherconventional fuels and technlogies became the standardstoday. Cost reduction is historically often governmentdriven in both government regulations and procurementpolicies. The same is true today for clean, green,renewable technologies as the State of Californiadiscovered from 2002 to 2004. The finance battle,however, is still being waged today through public–private partnerships in both sectors create and thenimplement public policy for distributed generationsystems.
2. Background
The decline of research and development (R&D)funding, especially for environmental and technologies(Clark, 1997, 2000) has lead to the need to optimize theuse of new advanced technologies in order to maximizeenergy efficiencies, reduce environmental impact onclimate and pollution, while being cost competitive withexisting technologies. We argue that the introduction ofnew technologies, when seen within a systems context,need to be analyzed and planned for implementation inlocal communities. An earlier paper focused on theoverall optimal planning for remote villages (Isherwoodet al., 2000).The United States has seen its research and develop-
ment (R&D) funding as a portion of real GDP declineover 5 years. Clark (1997) examined this issue for the USas part of a study for the United Nations on Publicly
funded research and development on environmentally
sound technologies, with a special focus on how totransfer or diffuse such technologies developed in the
ARTICLE IN PRESSW. Clark, W. Isherwood / Energy Policy 32 (2004) 1573–15891574

US to developing nations. The results of the study wereinstructive and formed a part of a 10-nation Report forthe UN. The California energy crisis provided a uniqueopportunity to apply new advanced technologies as partof the solutions (Clark, 2001).Studies of R&D characterize the demands of industry
as being short-term and often too narrow to satisfymarkets and shareholder pressures. Whereas the uni-versities are long-term oriented in their researchprograms, in part due to the time needed for graduatestudents to finish their dissertations (note the time frameis about 5–8 years, often the time needed for students toconduct research, write the thesis and publish it).Laboratories have a 2–5 years time frame, which placesthem closer to the commercialization time frame ofindustry which is within months of the funding, andcertainly not more than a year or two, before R&D mustsee products in the marketplace. These time frames areimportant because industry or the market rarely fundsR&D that takes over 2–3 years before it is commercia-lized. Competition and certainly shareholders demand afar quicker return on the R&D investment than themore long-term laboratory and university R&D cycle.Therefore, much of the long-term R&D in the US
must be publicly funded. Much of the George W. Bushadministration ‘‘Energy Budget’’ proposed in 2004(2005 FY) has large sums of funding for energy R&D,including DG and new technologies such as fuel cells,storage devices and hydrogen. Depending on how onecounts R&D budgets, and aside from the US Depart-ment of Energy with its 11+ laboratories and over $16billion budget for their operation. There are almost 720other public laboratories in other federal departmentsand agencies with another $50 billion of funding.The current American Congressional economic ideol-
ogy sees government environmental policy turned intoresearch programs through environmental R&D. Inother words, environmentally sound technologies(ESTs) need to be funded by the private sector to meetthe environmental policy demands of government, orenvironmental policies and regulations should not beimplemented in the first place, since they put an undohardship on industry. This is the essence of theAmerican debate over the global Kyoto guidelines.Government regulations or guidelines interfere with thefree market (sic) and will hinder economic development.ESTs, in this political context, differ from other forms
of research in that they are often viewed as ‘‘applied’’ toand meeting public policy decisions. Thus while thegovernment can create the regulatory demand for ESTs,it places the R&D burden on the private sector or morerecently on state, regional and local authorities. Hence,states and regions must increase their role in both theregulatory and funding arenas for ESTs.Definitions of distributed generation need to be
outlined. Consider the following potential definitions
extrapolated from IEEE DG Committee on their IEEEweb page: ohttp://grouper.ieee.org/groups/scc21/1547/index.html>.
� Distributed Generation (DG): electric generationfacilities connected to an Area EPS (Electric PowerSystem) through a PCC (Point of CommonCoupling); a subset of Distributed Resources (DR).� Distributed Resources (DR): sources of electricpower that are not directly connected to a bulkpower transmission system. DR includes bothgenerators and energy storage technologies.
� Electric Power System (EPS): facilities thatdeliver electric power to a load. Note: this caninclude generation units.
� Area Electric Power System (Area EPS): anelectric power system (EPS) that serves LocalEPSs. Note: typically an Area EPS thatnormally has primary access to public rights-of-way, priority crossing of property bound-aries, etc., and is subject to regulatory over-sight.
� Local Electric Power System (Local EPS): anEPS contained entirely within a single premisesor group of premises.
� Point of Common Coupling (PCC): the pointwhere a Local EPS is connected to an AreaEPS.
� Point of DR Connection: the point where a DRunit is electrically connected in an EPS.
3. Policy issue
Assuming the definition of DG, the policy question isclear: what is the cost of commercializing technology forDG? Without engaging in the political debate over therole in government, the basic issue often focuses uponthe justification of federal or state funds for research,development and technology commercialization in termsof ‘‘job creation’’. Aside from the political popularity ofjob creation, further analysis reveals that this is not thebest, and certainly not the sole, metric for success. Theconclusion is that DG needs government support.The important question is what are the policies that
supported distributed energy generation? California hasbegun a process which begins to outline what theimplications for public policy will be. First in 1999, theCalifornia Public Utility Commission (CPUC) issued anorder defining distributed generation as ‘‘small scaleelectric generating technologies such as internal com-bustion engines, micro-turbines, wind turbines, photo-voltaics, and fuel cells’’ (CPUC, 1999).Since then the debate over distributed generation has
taken on an important role as a national security issue in
ARTICLE IN PRESSW. Clark, W. Isherwood / Energy Policy 32 (2004) 1573–1589 1575

large part due to the issues surrounding infrastructuresecurity from the attacks on the USA on September 11,2001. If energy infrastructures, for example, are to befunctional even in the threat of attacks then they mustbe less grid dependent or distributed. The model forsuch an infrastructure needs to include distributedenergy generation (Clark, 2001). The California EnergyCommission (CEC) took up this challenge formally inearly 2002 when it began to draft a Strategic Plan fordistributed generation in which it began to more definethe field beyond technologies as: ‘‘the generation ofelectricity near the intended place of use.’’ Then the plangoes on to add, ‘‘Some parties define it with sizelimitations, others exclude backup generation, and yetothers make no distinction between generation con-nected to the transmission system and generationconnected to the distribution system.’’ In short, dis-tributed generation needs definition and regulatory ruleswith oversight.Some policy makers and scholars argue that job
creation is the basic metric for justifying governmentfunding. The essential problems are in defining the typesof jobs (public or private sector) and determine the long-term impact. Studies have found that job creation forthe public sector are often unproductive (that is, publicsector temporary positions) and often generate low taxrevenues. Creating high paying and sustainable jobsrequires a different set of metrics to measure thesuccessful outcome of government plans, policies, andfunds.Distributed generation can, for example, be seen as
economic development. Studies of ‘‘science parks’’(Clark, 2001) note that these high tech R&D centerscan also be ‘‘green’’ or part of a sustainable develop-ment planning process (CAA, 2001b; CPA, 2002).California formed a Stationary Fuel Cell Collaborative(CSFCC, 2002) in part to push and promote thecommercialization of fuel cells. Many communities havedone just that with public building such as schoolsleading the way with new solar/photovoltaic technolo-gies proving on-site power (LADWP, 2002; CPUC,2002). The applications of DG have also been shown ascost effective (Bolinger and Wise, 2002a, b) especiallywhen considering life cycle analysis and externalities(Clark and Sowell, 2002).Saxenian (1994, 2002) among others saw the need for
regional planning. Such an approach including DG atthe local level (Lund, 2000; M .unster, 2001) was alsoreflected in California state policy with the passage ofthe Environmental Goals Policy Report Bill (EGPR) inthe fall of 2002. The first EGPR was completed in thefall of 2003; nothing like it had been in California for 26years, included in the EGPR were sections on sustain-able development and DG along with new advancedtechnologies tied to a range of infrastructures includingtransportation, water and waste.
The American economy represents one of the largestsingle language, culture, and political markets in theworld. While the European Union intends to create alarger single market in terms of population (over 300million) and monetary system (with the introduction ofthe EUC by the turn of the century), the Americanmarket will remain potent given its single political andlanguage systems. For American businesses, historically,the domestic market proved to be their only market; ormore precisely the only market that they needed. Thelast decade has witnessed an enormous change in thatstrategy. Most American businesses and industrialsectors now see their domestic markets as accountingfor fewer than 50% of their revenues. The very survivalof a company depends now on foreign trade.The American economy is moving rapidly into what
Drucker calls the ‘‘post-capitalist era’’ (1993) whereby thevery definition of capitalism is changing. Capitalism is nolonger defined in terms of Adam Smith as strictlydominated by the private sector, despite the politicalrhetoric, but are now far more collaborative betweenpublic and private sectors. In that sense, the Americanform of capitalism has moved far more to that form ofother industrialized nations, while those countries in theirneed to control costs, raise federal funds to supportprograms, and be competitive in the marketplace, havemoved to sell or privatize heretofore nationalized indus-tries ranging from telecommunications to utility/power torail and postal services. The new world wide definition ofcapitalism (Drucker, 1993; Heilbronner, 1993) into moreof a ‘‘market economy’’ has produced enormous economicchanges, some of which will not be felt for another decadeor more. For some American economists and certainlyobservers in other industrialized nations, the new form ofAmerican capitalism is not new news.According to Science (March 21, 1997, p. 1729), the
USA funds just under 50% of its total research anddevelopment from public funds. While it is not stated,that percentage assumes that the amount does notinclude defense or military related R&D. In comparisonto the USA, according to the Science report, Japanfunds about 30% of its R&D using public funds, whileGermany and the United Kingdom R&D are about atthe same level as the USA in terms of publicly fundedR&D compared to their overall R&D spending. Withslightly more than half of the R&D funding comingfrom the public sector, France is the leading country, inthis respect. As the article notes in commenting on thefunding for R&D in France: ‘‘As laboratory budgetshave stagnated or fallen in recent years, many scientistshave done exactly what the government wants them todo: They have sought contracts with industry.’’ (Science,March 21, 1997, p. 1729). This is the trend in the US aswell R&D organizations seeking alliances with industry,other governmental groups and non-defense interna-tional collaborations.
ARTICLE IN PRESSW. Clark, W. Isherwood / Energy Policy 32 (2004) 1573–15891576

Yet, the USA has seen its R&D funding as a portionof real GDP decline over the last 50 years for example incomparison to other G-7 countries (from 70.6% to48.1%) and OECD countries (from 70.6% to 43%) byalmost a factor of two (Science, March 21, 1997, p. 4),despite coordinated efforts by the science community tomaintain and restore at least current levels of funding.When examining funding of R&D in the USA over thelast 5 years, the figures are even more disparate. Whilethe US percentage of GDP was 2.54% in 1994, so alsowas the United Kingdom and close behind wereGermany at 2.33% and France at 2.38%. However,Japan and Korea exceeded the US by 2.9% and 2.6%,respectively (Science, March 21, 1997, p. 4). The trendtoward among other industrialized countries for inter-national investment in R&D continues and has sig-nificantly increased, thus challenging the UScompetitiveness in technology innovation and diffusion.
In the following, a more detailed analysis of the R&Dbudgets is made which is linked up with the Charts 1–6of Appendix A. The figures and data contained in theCharts 1–6 are drawn from the following document:International Plans. Policies. & Investments in Science &
Technology. US DOC, Office of Technology Policy(April, 1997).Chart 1 gives a Grand Total of R&D spending
including all areas in the USA compared to some otherdeveloped countries. Interesting is that three areas,namely Energy, Environmental Protection, Earth &Atmospheric and Defense are rendered prominent.These areas tend to be the ones that have public fundsfor ESTs imbedded in their budgets, while others do not.Hence the Grand Total does not reflect the total of thoseareas, but instead of all areas including several notlisted. As demonstrated by the figures as contained inChart 1, the USA lags behind other countries in R&D
ARTICLE IN PRESS
Chart 1. Country (year of coverage) in millions of US Dollars. Grand total includes all areas; select areas are presented herein; areas listed thus will
not equal Grand Total. Source for Charts 1–6: International plans, policies, and investments in science and technology, US DOC, Office of
Technology Policy (April, 1997).
Chart 2. Selected Federal research obligations by agency and field FY 1995 (millions US$). Total All Fields includes all areas; select areas are
presented herein; areas listed thus will not equal Total All Fields.
W. Clark, W. Isherwood / Energy Policy 32 (2004) 1573–1589 1577

ARTICLE IN PRESS
Chart 3. Federal Obligations in basic research by science, engineering field (millions US$). Total All Fields includes all areas; select areas are
presented herein; areas listed thus will not equal Total All Fields.
Chart 4. Federal applied research by science and engineering field: FY1985–95.
Chart 5. Federal and nonfederal R&D expenditures at academic institutions, by field and sources of funds; 1993.
W. Clark, W. Isherwood / Energy Policy 32 (2004) 1573–15891578
targeted toward environmental protection funds spent.When compared to energy expenses, the amounts(except for Japan) are similar. However, the US farexceeds other countries in defense R&D funded projects.While the number is large, there are large sums (severalbillions of dollars) spent under defense programs thatare targeted for environmental restoration of closedmilitary bases throughout the US and other environ-mental R&D costs that are not readily apparent in thetotal defense funding numbers. Appendix B gives moredetails on US DOD funding areas for ESTs.Chart 2 shows that the USA total for R&D in science
and engineering was $28 billion in FY95 (last year whenactual figures were available). That amount does notaccount for administration and operations of federalagencies which according to Science and Technology inCongress (May 1996, p. 3) amounted to $102.6 billion inthe same FY95. The same journal estimated for theFY97 Budget that the request was about $300 millionless or $102.3 billion.Chart 3 specifies the amount of money in millions
US$spent by the Federal Government for basic researchby science and engineering fields for the period of 1985–1995. When data contained in Chart 3 is compared withthose contained in Chart 4 for applied research in thesame fields, it appears that basic non-defense researchhas garnered steady increasing funds over the abovestated 10-year period. Thus, federal and nonfederalR&D expenditures at academic institutions by field andsource of funds, as specified for 1993 (NSF, 1996, p.172) in Chart 5, remain fairly consistent throughout the1990s in large part since the research is primarilyconsidered ‘‘basic’’ by the federal funding authorities(Congress, Clinton Administration, Departments andAgencies).Finally, Chart 6 provides details on defense and non-
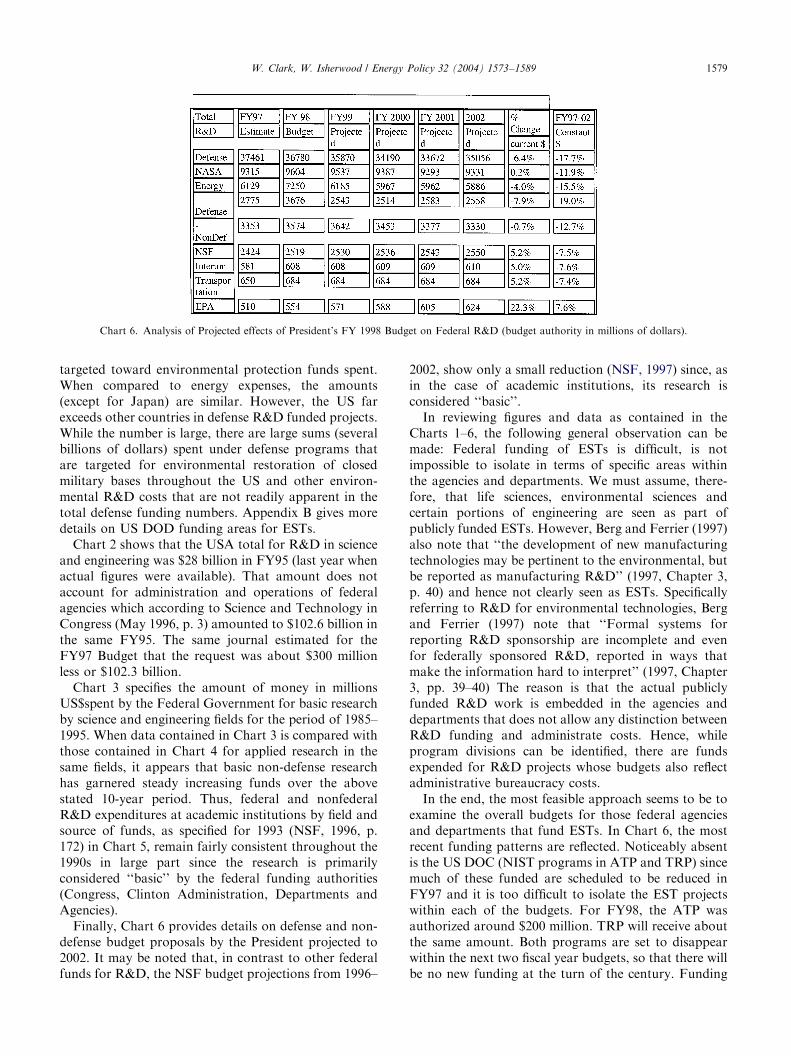
defense budget proposals by the President projected to2002. It may be noted that, in contrast to other federalfunds for R&D, the NSF budget projections from 1996–
2002, show only a small reduction (NSF, 1997) since, asin the case of academic institutions, its research isconsidered ‘‘basic’’.In reviewing figures and data as contained in the
Charts 1–6, the following general observation can bemade: Federal funding of ESTs is difficult, is notimpossible to isolate in terms of specific areas withinthe agencies and departments. We must assume, there-fore, that life sciences, environmental sciences andcertain portions of engineering are seen as part ofpublicly funded ESTs. However, Berg and Ferrier (1997)also note that ‘‘the development of new manufacturingtechnologies may be pertinent to the environmental, butbe reported as manufacturing R&D’’ (1997, Chapter 3,p. 40) and hence not clearly seen as ESTs. Specificallyreferring to R&D for environmental technologies, Bergand Ferrier (1997) note that ‘‘Formal systems forreporting R&D sponsorship are incomplete and evenfor federally sponsored R&D, reported in ways thatmake the information hard to interpret’’ (1997, Chapter3, pp. 39–40) The reason is that the actual publiclyfunded R&D work is embedded in the agencies anddepartments that does not allow any distinction betweenR&D funding and administrate costs. Hence, whileprogram divisions can be identified, there are fundsexpended for R&D projects whose budgets also reflectadministrative bureaucracy costs.In the end, the most feasible approach seems to be to
examine the overall budgets for those federal agenciesand departments that fund ESTs. In Chart 6, the mostrecent funding patterns are reflected. Noticeably absentis the US DOC (NIST programs in ATP and TRP) sincemuch of these funded are scheduled to be reduced inFY97 and it is too difficult to isolate the EST projectswithin each of the budgets. For FY98, the ATP wasauthorized around $200 million. TRP will receive aboutthe same amount. Both programs are set to disappearwithin the next two fiscal year budgets, so that there willbe no new funding at the turn of the century. Funding
ARTICLE IN PRESS
Chart 6. Analysis of Projected effects of President’s FY 1998 Budget on Federal R&D (budget authority in millions of dollars).
W. Clark, W. Isherwood / Energy Policy 32 (2004) 1573–1589 1579
ATP and TRP are considered obligations to on-goingR&D projects.Dr. Francis Narin recently published quantitative
data that documents a connection between US publiclyfunded R&D and commercial interests as seen in patentcitation data. In Narin et al. (1998, Fig. 21, seeattachments) documents how industrial patent citationsin chemistry and physics are directly linked to publiclyfunded R&D support from the top US federal agenciesand departments. In other words, publicly funded R&Din science directly impacts economic growth. Narin, ofcourse, assumes that patents are a significant businessstrategy or economic indicator and that quantitativepatent citations are hard evidence and central to supportthat argument. To date, the methodology and resultantfindings are the best empirical data available. Industry,scholars, and government are then to agree with thecorrelative linkage between patents and business oreconomic development.Therefore, skepticism must be brought to bear on
statements, such as the recent Competitiveness of the USEnvironmental Products and Services Industry from theUS DOC (March 25, 1997 draft): ‘‘The vast majority ofUS environmental R&D in the past two decades, whichamounts to over $100 billion, has been conducted withlittle direction from the market or input from the privatesector.’’ (Berg and Ferrier, 1997, Chapter 1, p. 5).Clearly, the market is not the ipso facto sole purveyor
of environmental demand, needs and concern for ESTsor public environmental policy for that matter. Industryshould not be the determining factor in consideration ofpublicly funded ESTs. Industry ‘‘demand’’ for ESTsoften is narrowly defined to establish vested corporateinterests, market share, competition, and sales/market-ing. Hence, governments must continue to play a strongrole in the diffusion of publicly funded ESTs.The UCDOC Report is correct, however, in stating
that there will be a $180 billion environmental industryin the near future and that it will evolve from a pollutioncontrol and waste management service industry into atotally integrated resource management industry ex-panding beyond the ‘‘traditional resources of water,energy, timber, and land but include materials, property,people, and information.’’ (Berg and Ferrier, 1997,Chapter 1, p. 4). Critical to the future of the environ-mental industry is continuance of publicly funded R&Dfor ESTs and how these results get diffused intopractical applications in concert with industry is theappropriate strategy.Jones et al. (1997) explore a new theoretical perspec-
tive of corporate governance by combining transactionalcost exchange analysis from economics with networktheory from sociology. This theoretical perspectiveargues that corporate governance and firm operationsneed to be seen as both a matter of economic ortransaction cost driven and part of social or business
networks among actors. ‘‘Network governance isincreasingly important but poorly understood’’ (Joneset al., 1997, p. 937) In other words, the firm is governedby people who have economic goals (quantifiable interms of stock prices, revenues and profits/losses) andsocial networks (e.g. exchange of information andknowledge as Xbusiness strategies and new technolo-gies). See Williamson (1994, 1996), Granovetter (1992,1994), Jones (1996) and Jones et al. (1997) for moredetails on theories from transaction cost exchange andsocial networks in business governance.New technologies through research and development
play a key role in network governance since theexchange of information or what Jones and others label‘‘structural embeddness’’ whereby people exchange‘‘knowledge’’ in a variety of informal circumstances.Saxenian (1994) noted the significance of this free flowof information exchange as part of the continuedsuccessful growth in Silicon Valley as opposed to thedemise in the Route #128 high tech area surroundingBoston due to the restricted information flow. In otherwords, the people who create new technologies inter-acted frequently in one geographical region (for avariety of other reasons also, see Saxenian 1994; Joneset al., 1997 for details).
4. The case of remote communities
Most remote Alaskan communities pay economicpenalties for electricity (ARECA, 1996), because theymust import diesel as their primary fuel for electricpower production, paying heavy transportation costsand potentially causing environmental damage withempty drums, leakage, and spills. Furthermore, theconsumption of fossil fuels and the local negativeenvironmental impact caused by communities befoulingthe region with leaking tanks and discarded drums mustbe considered when examining remote energy options.High fuel costs and environmental impacts occur notjust in Alaska but also many locations worldwide whereremote communities need power, regardless of climate.Modern renewable resources and advanced technol-
ogies, coupled with state-of-the-art energy storagemethods, compete favorably with conventional fossilfuel generation, when analytical comparisons areoptimized to include life-cycle costs for the entireintegrated energy system. This is true particularly whereelectric costs are high because of fuel transportationexpense, there is a reasonable renewable resourceavailable (e.g., wind, low-head hydro, solar, geothermal,etc.), and there is no inter-connection to a large-scalepower grid. A modular approach to energy systemsfurther allows the transition from a hybrid (for example,the combination of fossil fuel and renewable energygeneration) to a totally renewable system as new
ARTICLE IN PRESSW. Clark, W. Isherwood / Energy Policy 32 (2004) 1573–15891580
technologies and applications become commerciallyavailable.Resources such as wind and sunlight, however, are
not continuously available in any region. The greatestreduction in fossil fuel consumption can be achieved,therefore, by using energy storage strategies and newlyavailable technologies, capable of storing energy forperiods of several days to more than a week. Effectivelong-term storage can, for example, be provided byusing surplus power from renewable resources toelectrolyze water, producing hydrogen, which can belater used to re-generate electricity in either fuel cells orwith internal combustion engines. Alternatively, energycan also be stored in the form of reformulated, orrecovered zinc pellets which are later used to generateelectricity in a zinc-air fuel cell. In both cases, thetechnologies exist today and are now being commercia-lized (see Moore, 1997; The Economist, 1997).Renewable energy combined with energy storage also
has the potential to provide the very important benefitof increased system reliability, which has been recog-nized as one of the highest priorities in the design ofremote power systems (Brown et al., 1996). Fuel cells,for example, have no moving parts, require almost nomaintenance, and have long useful lives. Reliability canbe enhanced by a distributed generation facility,combined with storage, and optimized through systemscodes; potentially using the existing diesel generatingsystem as a backup (Smith et al., 1997).Public and private sector research has developed and
demonstrated numerous renewable energy technologies(Clark, 1997). Widespread use of renewable energytechnologies has been limited, however, by high costs(US Department of Commerce, 1997). Among otherproblems cited that prevent the commercialization of‘‘environmentally sound technologies’’ have been (1) themarket has been insufficient to stimulate mass produc-tion, (2) competition from inexpensive fossil fuels (theprice of which commonly fails to include full environ-mental costs), and (3) the lack of integrated systems thattake advantage of synergies possible between newtechnologies (The Economist, 1997). Nevertheless, agrowing literature indicates that environmental andenergy market demand is being created and supportedthrough changes in governmental regulations. This leadsto a stronger competitive advantage for private sectorfirms marketing ‘alternative’ technologies (Porter andvan der Linde, 1995; UN, 1994, 1995; Clark, 1997; Clarkand Paolucci, 1997).
5. Scope
This paper presents an analysis of remote powersystems for an Alaskan community, demonstrating howa hybrid of technologies is far superior in optimizing
energy efficiency, preventing environmental degrada-tion, and reducing costs. The analysis shows significantpotential advantages in terms of lower costs and reducedfuel consumption. Two computer codes provide thebasis for our analysis. The first is a renewable gridanalysis tool, and the second is an optimizer. These twocodes combine to obtain optimum designs for anynumber of decision variables, as well as equality andinequality constraints.This hypothetical remote village analysis treats
optimization primarily as an energy cost problem, notas an environmentally driven problem. Thus noexternalities (such as environmental regulations, legisla-tive initiatives, and system reliability), nor potentiallinkages to water and waste disposal infrastructure areincluded in the analysis. Chapman (1996) estimated thesubstantial cost of environmental degradation due toemissions and spills that result from diesel engineoperation at $0.80 per liter of fuel ($3/gal). If such‘hidden costs’ and further integration with othercommunity needs were taken into account, we expectthe advanced technologies discussed herein wouldappear even more favorable.Costs are very sensitive to a long list of parameters,
both local and external to the village. This sensitivitymakes cost comparisons difficult (Guichard, 1994). Theresults obtained in the analysis are expected to indicatetrends that would exist in an actual village in which theconditions are not too different from those assumedhere.
6. Methodology and scenarios: the remote community3
The coastal village used in the analysis is fictional, inthat it has the demands of Deering (48 homes,population 150), and the solar insulation, wind andtemperature data from Kotzebue. The parameters, data,and verification are based on profiles provided by theUniversity of Alaska, Mechanical Engineering Depart-ment. Further data were provided directly from actualremote Alaskan communities. Wind speed data havebeen scaled to 8m/s average wind speed, which is arealistic value for sites along coastal Alaska. Althoughwe considered the possibility of including photovoltaic(PV) cells in the system, this evaluation indicated thatwind was the preferred renewable resource in thissample case. Consequently, the optimized solutionspresented below all show zero PV components. Otheranalyses could include PV for remote communities,especially those in sunny and tropical regions.Space and water heating are major contributors to the
total energy demand in Alaskan villages (Koniag, Inc.,1995). For this reason, our integrated approach
ARTICLE IN PRESS
3Data from earlier study by Isherwood et al. (2000).
W. Clark, W. Isherwood / Energy Policy 32 (2004) 1573–1589 1581
considers the possibility of covering part of the heatingload with waste heat from power generation equipment,or with surplus renewable energy obtained duringperiods of high wind speed, to reduce the fuelconsumption for heating homes and public buildings.Four modular energy systems are analyzed and
compared in this paper. The systems are:
* Diesel-only, base-case: This is the system thatcurrently exists in most Alaskan villages. Dieselgensets produce electricity, with heating providedby available waste heat first, then by diesel-burningfurnaces (except that most real villages do not fullyutilize available waste heat from gensets, partlybecause noise and safety factors place gensets faraway from the greatest heating loads.). Our hypothe-tical village uses 250,000 l per year (250 kl/yr) of dieselfor electrical generation and 135 kl/yr for heating.
* Hybrid wind–diesel system: This system includes windturbines and diesel generators. Wind turbines gen-erate electricity to satisfy the power demand (70 kWaverage, 118 kW 1h peak). If there is surpluselectricity after the power demand is satisfied, thesurplus electricity provides heating for homes. As inthe base-case system, diesel generators cover theelectrical load and diesel-furnaces provide the heatwhen there is not enough wind to satisfy the electricaldemand.
* Wind–hydrogen storage–fuel cell–diesel: This systemincludes wind turbines, an electrolyzer, vessels forlow-pressure compressed hydrogen storage (4.1MPa,600 psi), an off-the-shelf phosphoric acid fuel cell(PAFC), and backup diesel generators. Protonexchange membrane (PEM) and solid oxide fuel cells(SOFCs) may soon be available with similar or evenmore suitable characteristics, but for simplicity, thecurrent analysis included only the PAFCs for usewith hydrogen. Wind turbines first satisfy the powerdemand. If there is surplus electricity after the powerdemand is satisfied, it can be used for either heatinghomes or for generating hydrogen for storage. Whenthe wind turbines cannot satisfy the electricaldemand, the fuel cell provides power to the system.If stored hydrogen becomes exhausted, the gensetcomes on line.
* Hydrogen storage has an economic advantage overlead-acid batteries for long-term storage, in thatincreased energy storage (measured in kilowatt-hours) is added by increasing only the hydrogenstorage, at relatively low cost per kilowatt-hour.Low-pressure hydrogen storage is a safe, proven, andreadily available technology. Reliable fuel cells canthen utilize the hydrogen to generate electricity.Although the overall turnaround efficiency of elec-tricity storage and retrieval from the system is onlyabout 30%, heat from the fuel cells and electrolyzers
can be used for space or process heating, substantiallyincreasing the overall energy efficiency. Because fuelcells are practically noiseless, they can be placed closeto facilities that can utilize their ‘waste’ heat.
* Wind–zinc storage–zinc–air fuel cell–diesel: Thissystem is similar in strategy and components as theprevious one, the only exception being that zincpellets produced in an electrolytic process are usedfor energy storage, and a zinc–air fuel cell is used togenerate electricity. Prototype zinc–air cells havedemonstrated a turn-around electricity storage effi-ciency of about 60%, compared to 70% for lead-acidbatteries (Cooper et al., 1995). As with hydrogen fuelcells, use of the waste heat from a zinc–air cell canbring the overall energy efficiency significantly high-er. Zinc–air cells present none of the disposalproblems of lead-acid batteries and have a consider-able per-unit-energy weight advantage, which isimportant for shipping.
Particulate zinc–air fuel cells should soon (within 2years) become commercially available and the totalproduction costs should easily compete with lead-acidbatteries on a per kW (power) basis. But as withhydrogen, the cost of incremental energy storagecapacity (kWh) is quite low, making these cellsparticularly advantageous for long-term storage. Costsused in this study are based upon an industrial partner’sestimate for commercialization of new technologies.
7. Results
The energy control strategy for the storage system iscritical to the operation of the grid itself. Two of thepossible options are:
1. Heating first: Surplus renewable electricity is used forresistive heating within the village. If there is surpluselectricity after providing all the required heat, theelectricity is used for generating either hydrogen orzinc for the storage.
2. Storage first: Surplus renewable electricity is stored aseither hydrogen or zinc. If the storage system is full,surplus electricity is then used for heating the homes.
A preliminary analysis has shown that the heatingfirst strategy has an advantage for the conditionsanalyzed in this paper. Therefore, heating first is thestrategy selected for this analysis.Table 3a shows the results of the example system
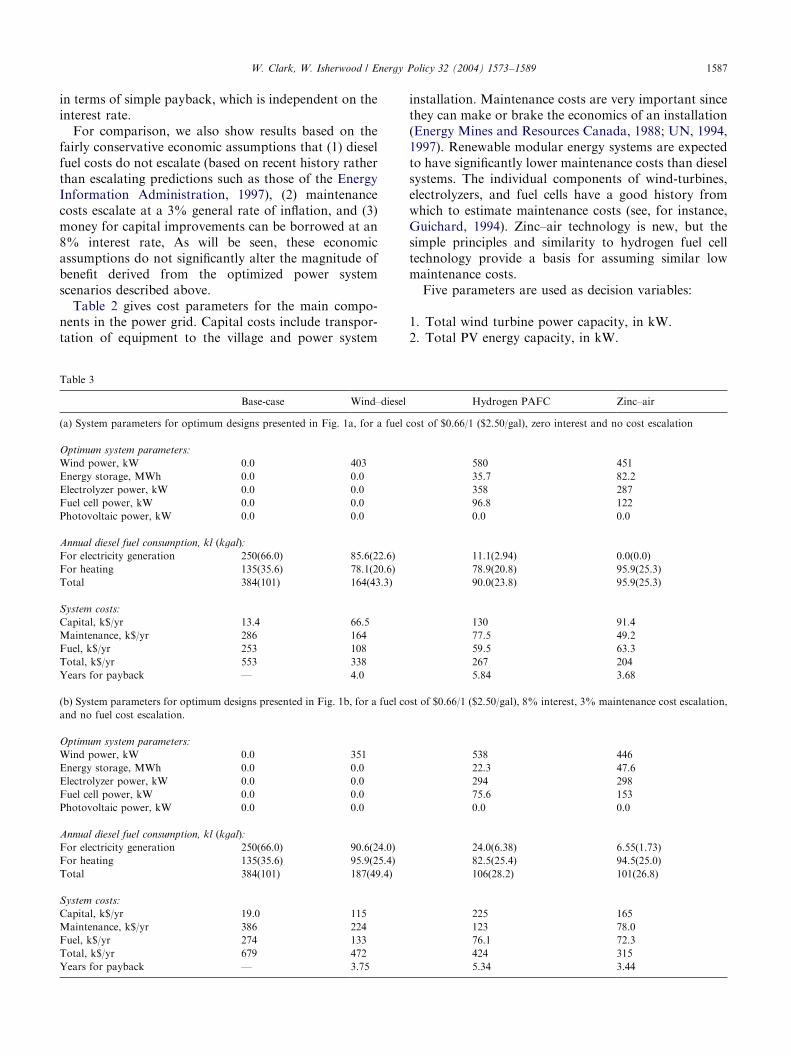
optimization for minimum yearly cost, for a $0.66/1($2.50/gal) fuel cost, and the zero interest rate, no costescalation scenario. Table 3b shows results of the sameoptimization with the alternative economic assump-tions; 8% interest, 3% maintenance cost escalation, butstill no fuel cost escalation. The tables list the values of
ARTICLE IN PRESSW. Clark, W. Isherwood / Energy Policy 32 (2004) 1573–15891582
the five decision variables, as well as the fuel consump-tion and cost values.The tables indicate none of the lowest cost systems
have a photovoltaic component. Intrinsic solar irradia-tion is low at our model village, but the lack of PV hereis most directly a consequence of today’s still relativelyhigh PV costs. However, PV costs have declined sharplyin the past, and further declines are expected, perhapssufficient for PV electricity to compete economicallywith other sources used in rural Alaskan communitieswithin a few years.The results in Table 3 indicate that maintenance costs
dominate the economics for the base-case system. Theimportance of maintenance costs has been stressed inprevious reports (e.g., AVEC, 1996; Harris et al., 1997).Most of the maintenance cost is associated with dieselgenset operation. For this reason, optimum renewablesystems tend to reduce diesel genset operation as muchas possible. For example with the zinc–air fuel cellsystem, there is almost no need to operate the dieselgenset, although the analysis considers that the dieselgenset is kept as a part of the system for increasedreliability (i.e., capital cost for the genset is included).The wind–diesel system reduces diesel genset use to
about a third, and total fuel consumption to less thanhalf of the base-case values. Considering the moderateinvestment and the short time for payback required forthese systems, installation of wind turbines constitute agood first step that can later be enhanced to includeenergy storage as additional capital is available forinvestment.Fig. 1a and b show optimization results for the same
two economic assumptions. The figures show totalsystem cost and total diesel consumption for the foursystems being considered. In addition to the fuel costconsidered for Table 3 ($0.66/1; $2.50/gal), two morevalues are used: $0.40/1 ($1.50/gal), and $0.92/1 ($2.50/gal). The figures show that the yearly cost for the base-case system is very sensitive to fuel cost. For the systemswith storage, fuel consumption is significantly reducedso that the yearly cost is less sensitive to fuel cost. Thefigure illustrates clearly the potential for cost and fuelconsumption reduction obtainable by using renewableelectricity generation in the village. Note the generalsimilarity in results between the different economiccases. For brevity, the following figures present dataonly from the simple—no interest, no escalation—case,with confidence that general conclusions will not differsignificantly over a broad spectrum of realistic economicassumptions.Fig. 2 illustrates the results of a system optimization
when only the electricity demand is considered (noheating load is satisfied). The cost and fuel savings forsystems with storage appear even greater in whenheating is neglected. We show this for comparison withother studies that do not integrate heating with power.
Consideration of the total energy picture makes moresense for village planners. Optimum (lowest yearly cost)designs for the zinc–air fuel cell can reduce diesel fuelconsumption to almost zero, so that the operating cost isindependent of fuel cost (the time for payback is still afunction of fuel cost). Wind–diesel systems can reducefuel consumption to about 40% of the original value,and the cost to almost 50%.Figs. 3 and 4 show the results of a parametric analysis
for a system with hydrogen storage and a PAFC. Fig. 3shows lines of constant total fuel consumption as afunction of energy storage capacity and installed windpower. The numbers on the curves indicate the fractionof the fuel consumed in the base-case (384,000 l/year).Decision variables are set to the optimum values for thePAFC system from Table 3a. For low wind capacity(‘low-penetration’), storage provides little benefit, sinceall of the electricity produced is immediately used tosatisfy either electrical load or electrical-heating load,and the storage system remains empty. As the windcapacity increases (‘high penetration’), the benefit ofenergy storage increases. A point in the figure indicatesthe optimum design from Table 3a.Fig. 4 shows lines of constant fuel consumption for
electricity generation only, as a function of energystorage capacity and installed wind power for the samesystem with hydrogen storage and a PAFC, with theoptimum values for the decision variables from Table3a. The numbers on the curves indicate the fraction ofthe fuel consumed in the base-case (250,000 l/year). Aspreviously discussed, operation and maintenance of thediesel engines is expensive, and therefore the optimumdesign reduces considerably the fuel consumption forelectricity generation.Figs. 5 and 6 show results that are similar to those
presented in Figs. 3 and 4, except that now the systembeing considered is the zinc–air fuel cell as energystorage. The decision variables take their optimumvalues from Table 3. Zinc–air fuel cells and storage areexpected to be cheaper that PAFC and hydrogenstorage, so that the optimum amount of storage,indicated by a point in the figure, is higher than forhydrogen. The higher efficiency of the zinc–air fuel cellresults in very low fuel consumption for electricitygeneration. Total fuel consumption remains at about thesame level as obtained for the PAFC system.
8. Analyses
Application of an analysis code and an optimizer tothe problem of sizing a renewable electricity generationgrid in a remote Alaskan village demonstrates significantpotential for life-cycle cost savings. We compared abase-case system, which consists of (1) diesel gensets anddiesel heaters, to three highly reliable systems that
ARTICLE IN PRESSW. Clark, W. Isherwood / Energy Policy 32 (2004) 1573–1589 1583

include renewable electricity generation: (2) a wind–diesel system, (3) a wind–diesel system with hydrogenstorage and a phosphoric acid fuel cell (available ‘off-the-shelf’), and (4) a wind–diesel system with zincstorage and a zinc–air fuel cell (expected to be availablewithin 2 years). The results show that, for the conditionsused for this analysis, fuel consumption and annualizedlife-cycle costs can be substantially reduced by usingrenewable electricity generation technologies as well asenergy storage devices. Specific results from the analysesdemonstrate that:
1. When wind turbines are added to diesel gensets(‘‘wind–diesel’’ hybrid), the saving of diesel fuel canbe more than 50% at a cost savings of over 30%. Thisis the most cost effective, quickest payback config-uration for a remote village that has sufficient windresource. Furthermore, wind turbines can be addedincrementally, with additional maintenance andoperational savings at every increment.
2. When energy storage devices are added (e.g., hydro-gen or zinc–air), diesel fuel consumption and costscan be reduced substantially more. Optimized energystorage allows diesel gensets to be eliminated.However, about one quarter of the original dieselconsumption is still required to satisfy heatingdemands.
3. Costs using optimized hydrogen storage can be 10–20% lower than for wind–diesel alone, while displa-cing about an additional 20% of the original dieselfuel consumption.
4. Using estimated costs for zinc–air technology forenergy storage, as much as 75% of the current dieselfuel can be displaced with 30–40% cost savings overwind–diesel without storage. This result provides astrong incentive to further speed the commercializa-tion of this technology.
5. There are a number of externalities that have notbeen factored in at this point, but could be in futureanalyses. For Alaska, we suggest the externalitiesinclude: environmental impact and regulations, poli-tical legislation and funding (direct investment,incentives, and taxes), and specific community-basedvariables such as employment opportunities and needfor reliable service. The advantages of not needing tosend hard currency out of the village for expendablefuel and reducing environmental threats provideadditional incentives not included in this analysis.
6. Further benefit can be gained by combining anyenergy system upgrades with a review of energyefficiency and demand-side management options.Education and training programs need to be anintegral part of the installation, maintenance, andoperation of such new energy systems. Expertisegained in this area would be a very viable andsignificant commodity for international commercial
exploitation through university and vocational train-ing programs.
7. Finally, there are economic and business opportunitiesfor Alaska in advancing such modular energy systems.For example, seven other countries share the remoteArctic conditions, with similar energy base-casescenarios and needs. Also new industries for energymodular systems as well as advanced energy storagetechnologies could be developed within the State.
It is expected that refinements possible during theanalysis of a real village could potentially make theeconomics more or less favorable. In general, we believethe benefits shown possible in these analyses should berealizable at numerous sites throughout Alaska.The systems described in this paper should be robust
enough for application in real communities and could bemodular enough for additions and substitutions of newtechnologies as they become available. In short, a keyconcept is the creation of new energy systems that areeconomically viable and sufficiently flexible for imple-mentation of new technological advances.A recent issue of The Economist, featured a story in
its Science and Technology section, ‘‘At last, the fuelcell’’ which stated in part: scientists ‘‘seem to havecreated something that may revolutionize two indus-tries—power generation and motor cars’’ which ‘‘makesfuel cells a double friend to the environment: if put invehicles, they would not pollute the city streets; if put inpower stations (or vehicles, for that matter) they couldnot add to any global warming that might be going on.’’(The Economist, 1997). The time has come for advancedenergy technologies to preserve the environment whileproviding for new energy resources that reverse globalwarming and climate change.
9. Conclusions
Distributed generation can be achieved in commu-nities through a combination of efforts that optimize orcombine both advanced technologies (such as wind andfuel cells) alone with a variety of environmentally soundtechnologies. Such new environmental-energy technolo-gies such as fuel cells and flywheels (e.g., see Clark 1996;Clark and Paolucci, 1997) developed in universities andAmerican national laboratories can provide technologi-cal solutions to environmental and energy issues, in partlegislated by governmental regulations, while creatingnew business opportunities and economic systems.Distributed energy systems must be systemic in thatgovernment and the public sector must play an activeplanning role in the integration of advanced technolo-gies to reduce cost and increase efficiencies.Intense and constant interaction must guided by the
public sector to take place between the market pull of
ARTICLE IN PRESSW. Clark, W. Isherwood / Energy Policy 32 (2004) 1573–15891584
the private sector—such as manufactures, energy, andpower companies—and the government supportedtechnology push providers—such as research institu-tions like universities and national laboratories—inorder to commercialize new technologies. Such closecollaboration supersedes industrial competitive issuesand problems in an interactive non-linear economicsystem (Clark and Fast, 2004). In other words, thetypical economic analysis that presents demand versussupply fails, because the business process is really onethat is a constant interactive process.The role of government has shifted from pure
regulatory concerns to financial support and internatio-nalization (through bank guarantees, patent protection,trade agreements and other means). Such new ‘‘civicmarkets’’ (Clark and Lund, 2001) provide the platformfor distributed generation systems. Clark and Bradsaw(2004) portray these systems as being ‘‘agile’’ in thatthey must be regionally and locally based. Theemergence of international strategic alliances betweenpartners in the environmental industry and the federalgovernment is the most viable approach for transferringESTs into other countries. Along with such a strategicmust be concern over issues of intellectual property,equity and debt financing, profits and losses, andmanagement of companies. In short, government cantake the risks in R&D that industry is loath to do.Capital and finance remain the key to transferring
technologies from the research culture to the interna-tional business culture. Again government plays a keyrole: it can provide the contacts and capital to movetechnologies into the marketplace. Two things need tochange (at least more rapidly): one is that governmentcan take an ‘‘equity’’ (see below on university andlaboratory policies) in companies that it supports. Sucha role for government would also necessitate it taking anon-going role in the oversight and management of thecompany as well (Clark and Jensen, 1994, 2001).The other change for government concerns its need to
coordinate and even collaborate with industry on publicpolicy with technology research and development. ESTsis an excellent example about how this might occur.Regulations for zero emission vehicles in California,federal clean water acts and other others have been animpetus and catalyst for new inventions to solveenvironmental problems. Research funds need to bemade available to fund multiple solutions.
Appendix A. Data summary from Isherwood et al. (2000)
A.1. Optimization code analyses
A remote village system analysis code has beendeveloped specifically for this project and then inte-grated to an optimizer. The purpose of this work is not
to duplicate the extensive capabilities of an existinghybrid systems code (HYBRID2, Baring-Gould, 1996;Manwell et al., 1996), which can also be linked to anoptimizer (Flowers, 1997). Instead, the purpose is tohave an energy system code that can easily incorporatenew advanced technologies (such as energy storagedevices), waste heat recovery systems, and operatingstrategies, for optimization into modular systemssuitable for remote villages.The US Magnetic Fusion Program at Lawrence
Livermore National Laboratory originally developedSUPERCODE in the early 1990s for optimizingtokamak reactors and experimental designs (Galamboset al., 1995). SUPERCODE is a shell that incorporatesprocess models and non-linear equations with uncer-tainty, which has subsequently been used to optimizeinertial fusion devices, rail-guns, and hybrid-electricvehicles (Haney et al., 1995), in addition to the presentapplication.A powerful programmable shell that takes input using
a variant of the C++ language controls SUPER-CODE, and has more recently been converted toMathematica (Perkins et al., 1997). Input can be froma terminal or from files, allowing interactive or batchoperation. The user can define real, integer, complex,array, and string variables. In addition, the languagesupports control statements, loops and functions.Finally, the SUPERCODE shell can exploit the multi-processing capabilities of UNIX to run externalprograms, such as this village simulation code, tocompute constraint and figure-of-merit values. It is evenpossible to use the parallel virtual machine system(Beguelin et al., 1991) to simultaneously run multiplecopies of the externalprogram in parallel on a number ofworkstations thereby dramatically reducing executiontime.This programmable shell offers tremendous flexibility
for the user to specify an optimization problem. Oncethe optimization is completed, the user can interrogatethe shell for variable and figure-of-merit values. Also,variables can be fixed, or new constraints applied toinvestigate ‘‘what-if’’ scenarios. Finally, loops can bewritten to perform parameter scans.The community optimization code includes:
1. Electricity generation components: These are definedby vectors that specify electricity output for everyvalue of energy input (wind speed, solar irradiation,or fuel consumption for a diesel genset or fuel cell).
2. Loads: Electrical loads are taken from Deering,Alaska. Average demand is 70 kW, and the 1-h peakis 118 kW. Average heating load is assumed equal to150 kW for the whole village. We assumed that 85%of the heating load goes for space heating and 15%for water heating. The space heating load isdistributed along the year based on the temperature
ARTICLE IN PRESSW. Clark, W. Isherwood / Energy Policy 32 (2004) 1573–1589 1585

data for the village. The water heating load isdistributed uniformly throughout the year.
3. Energy storage components: These vectors specify theefficiency as a function of power input.
4. Waste heat recovery: This component specifies thefraction of the total waste heat that can be used forheating, and the maximum percentage of the villagethat can be heated with waste heat.
5. Energy storage strategy: Surplus electricity can beeither stored by electrolyzing water to make hydrogenor recovering zinc from the zinc–air fuel cell sludge,or used for heating the homes. The systems analysiscode offers the possibility of analyzing both of theseoptions for any particular scenario.
6. Economic analysis: The code calculates annualizedoperating costs and years for return of investment asa function of all the system cost parameters, fuelconsumption and maintenance of the system, whichare in turn functions of equipment performance anduse. Options include separate rates for the cost ofcapital (interest rate), fuel cost escalation, andmaintenance cost escalation.
A.2. Optimization of remote community energy systems
and advanced technologies
Table 1 list the parameters used in the test villageanalysis. The analysis assumes that 40% of the wasteheat generated from the diesel engine can be used forheating. This value corresponds closely to the amount ofwaste heat transferred to the cooling water (Maloshet al., 1985). The rest of the waste heat is lost throughthe exhaust pipe, and it is not recovered in currentpower plants. For fuel cells, we assume that most of thewaste heat (60%) is transferred to the cooling water,making it available for heating. We also assumed that inthe diesel-only base-case a maximum of 30% of thevillage can be heated with waste heat. This is becausediesel engines are likely to be located at a central powerplant, so that waste heat can only be economically usedin a few buildings. Fuel cells can be distributed throughthe village. If desired, each home could potentially haveits own fuel cell. This affords a significantly higherpotential for heating with waste heat recovery (50%).Diesel engines present operating difficulties if oper-
ated at very low load. For that reason, a minimumoperating power (40% of full load, Malosh et al., 1985)is defined.We present here two separate sets of economic
assumptions to illustrate their effect. First we assumedno escalation of fuel or maintenance costs and used a0% interest rate on capital, due to State or Federalsubsidizes or other investment incentives. Publishedscenarios project fuel cost escalation to approximate orexceed the borrowing rate, making this approach aplausible first assumption. Furthermore, the state of
Alaska currently subsidizes the electricity for the remotevillages to a level of $0.27/kWh (Jensen, 1997), so thiscase assumes that the State might be willing to providelow- or no-interest loans in order to reduce the futureamount of the subsidies. The results are also presented
ARTICLE IN PRESS
Table 1
Parameters for remote village electric grid
Distance from wind turbines to village, km 10
Average electric demand for village, kW 70
1-h peak demand for village, kW 118
Average wind speed, m/s 8
1-h peak wind speed, m/s 35
Average heating demand, kW 150
1-h peak heating demand, kW 365
Efficiency of diesel-fueled heater, % 80
Fraction of waste heat that can be used for heating,
fuel cells, %
60
Fraction of heating load that can be met with waste
heat, fuel cells, %
50
Fraction of waste heat that can be used for heating,
diesel genset, %
40
Fraction of heating load that can be met with waste
heat, base-case, %
30
Number of diesel gensets 3
Maximum diesel genset power, kW 60
Minimum diesel genset power, kW 24
Wind turbine maximum power output, kW 20
Maximum solar irradiation, kW/m2 0.82
Fuel energy density, kWh/liter (kWh/gal) 9.51 (36)
Fuel cost, $/liter ($/gal) 0.40–0.92
(1.50–3.50)
Interest rate, % 0.0 and 8.0
Maintenance cost escalation, % 0.0 and 3.0
Fuel cost escalation, % 0.0 and 0.0
Table 2
Parameters for cost analysis of grid
Component Life (yr) Cost Maintenance,
$/kWh
Transmission lines 20 $10000/km 0.001
Compressed
hydrogen storage
20 $10/kWh 0.001
Electrolyzer 20a $1000/kW 0.001
diesel heater 10 $100/kW 0.001
Electrical resistive
heaters
20 $20/kW 0.001
Engine-generator 4a $200/kWa 0.12c
Wind turbine 20 $2400/Kw
(installed)
0.03
PAFC fuel cell 20a $1500/kWb 0.01
Photovoltaic cells 20a $770/m2 or
$5000/k\W
(peak)
0.0a
Zinc storage 20 $4/kWh 0.001
Zinc-air fuel cell 20 $150/kW 0.01
Zinc recovery unit 20 $150/kW 0.001
aFrom Guichard (1994).bFrom Guichard (1994). Projection to 1998.cFrom Malosh et al. (1985).
W. Clark, W. Isherwood / Energy Policy 32 (2004) 1573–15891586
in terms of simple payback, which is independent on theinterest rate.For comparison, we also show results based on the
fairly conservative economic assumptions that (1) dieselfuel costs do not escalate (based on recent history ratherthan escalating predictions such as those of the EnergyInformation Administration, 1997), (2) maintenancecosts escalate at a 3% general rate of inflation, and (3)money for capital improvements can be borrowed at an8% interest rate, As will be seen, these economicassumptions do not significantly alter the magnitude ofbenefit derived from the optimized power systemscenarios described above.Table 2 gives cost parameters for the main compo-
nents in the power grid. Capital costs include transpor-tation of equipment to the village and power system
installation. Maintenance costs are very important sincethey can make or brake the economics of an installation(Energy Mines and Resources Canada, 1988; UN, 1994,1997). Renewable modular energy systems are expectedto have significantly lower maintenance costs than dieselsystems. The individual components of wind-turbines,electrolyzers, and fuel cells have a good history fromwhich to estimate maintenance costs (see, for instance,Guichard, 1994). Zinc–air technology is new, but thesimple principles and similarity to hydrogen fuel celltechnology provide a basis for assuming similar lowmaintenance costs.Five parameters are used as decision variables:
1. Total wind turbine power capacity, in kW.2. Total PV energy capacity, in kW.
ARTICLE IN PRESS
Table 3
Base-case Wind–diesel Hydrogen PAFC Zinc–air
(a) System parameters for optimum designs presented in Fig. 1a, for a fuel cost of $0.66/1 ($2.50/gal), zero interest and no cost escalation
Optimum system parameters:
Wind power, kW 0.0 403 580 451
Energy storage, MWh 0.0 0.0 35.7 82.2
Electrolyzer power, kW 0.0 0.0 358 287
Fuel cell power, kW 0.0 0.0 96.8 122
Photovoltaic power, kW 0.0 0.0 0.0 0.0
Annual diesel fuel consumption, kl (kgal):
For electricity generation 250(66.0) 85.6(22.6) 11.1(2.94) 0.0(0.0)
For heating 135(35.6) 78.1(20.6) 78.9(20.8) 95.9(25.3)
Total 384(101) 164(43.3) 90.0(23.8) 95.9(25.3)
System costs:
Capital, k$/yr 13.4 66.5 130 91.4
Maintenance, k$/yr 286 164 77.5 49.2
Fuel, k$/yr 253 108 59.5 63.3
Total, k$/yr 553 338 267 204
Years for payback — 4.0 5.84 3.68
(b) System parameters for optimum designs presented in Fig. 1b, for a fuel cost of $0.66/1 ($2.50/gal), 8% interest, 3% maintenance cost escalation,
and no fuel cost escalation.
Optimum system parameters:
Wind power, kW 0.0 351 538 446
Energy storage, MWh 0.0 0.0 22.3 47.6
Electrolyzer power, kW 0.0 0.0 294 298
Fuel cell power, kW 0.0 0.0 75.6 153
Photovoltaic power, kW 0.0 0.0 0.0 0.0
Annual diesel fuel consumption, kl (kgal):
For electricity generation 250(66.0) 90.6(24.0) 24.0(6.38) 6.55(1.73)
For heating 135(35.6) 95.9(25.4) 82.5(25.4) 94.5(25.0)
Total 384(101) 187(49.4) 106(28.2) 101(26.8)
System costs:
Capital, k$/yr 19.0 115 225 165
Maintenance, k$/yr 386 224 123 78.0
Fuel, k$/yr 274 133 76.1 72.3
Total, k$/yr 679 472 424 315
Years for payback — 3.75 5.34 3.44
W. Clark, W. Isherwood / Energy Policy 32 (2004) 1573–1589 1587
3. Energy storage capacity, in kWh.4. Maximum possible power into storage (maximumelectrolyzer/zinc recovery unit power).
5. Maximum possible power out of storage (maximumfuel cell power).
The specific figure-of-merit used for this optimizationexercise is the yearly cost of the system. This includescapital, maintenance and fuel costs. The cost of fuel isassumed to be in the range of $0.40/l ($1.50 per gallon)to $0.92/liter ($3.50 per gallon).
Appendix B
Parameters for (1) remote village electric grid(Table 1); (2) parameters for cost analysis of grid(Table 2); (3) system parameters for optimum designs(Table 3).
References
ARECA, 1996. Affordable Power in Rural Alaska. ARECA Rural
Issues Forum Report, Alaska Rural Electricity Cooperative
Association, Anchorage, AK.
AVEC, 1996. 1995 Annual Report. Alaskan Village Electric Coopera-
tive, Inc., Anchorage, AK.
Baring-Gould, E.I., 1996. HYBRID2, The Hybrid System Simulation
Model, Version 1.0 User Manual. National Renewable Energy
Laboratory Report NREL/TP-440-21272, Golden, CO.
Beguelin, A., Dongarra, J., Geist, A., Manchek, R., Sunderam, V.,
1991. Users Guide to PVM: Parallel Virtual Machine. ORNL/TM-
11826, Mathematical Sciences Section, Oak Ridge National
Laboratory.
Bolinger, M., Wiser, R., 2000a. Quantifying the value that wind power
provides as a hedge against volatile natural gas prices. American
Wind Energy Association, Portland, OR.
Bolinger, V., Wise, R., 2000b. Customer-sited PVs: A Survey of Clean
Energy Fund Support. Lawrence Berkeley National Laboratory,
Berkeley, CA, pp. 1–16.
Brown, C., Guichard, A., Lyons, D., 1996. Wind energy in polar
regions: Casey Station Antarctica. Proceedings of the 12th Annual
Conference of the Canadian Wind Energy Association, Kananas-
kis, Canada.
California Consumer Affairs Agency (CAA), 2001a. Flex Your Power
Programs. Sacramento, CA, April.
California Consumer Affairs Agency (CAA), 2001b. Building Better
Buildings: A Blueprint for Sustainable State Facilities. Sustainable
Building Task Force and the State of Consumer Services Agency,
December: http://www.ciwmb.ca.gov/GreenBuilding/Blueprint/
Blueprint.pdf.
California Consumer Power and Conservation Financing Authority
(CPA), 2002. PULSE Program, June: http://www.capowerauthor-
ity.ca.gov/financing/PULSE.htm.
California Energy Commission (CEC), 2002a. Draft Strategic Plan for
Distributed Generation. Sacramento, CA. Feb 20, 02, pp. 1–5.
California Energy Commission (CEC), 2002b. Buy down programs for
on-site generation. Sacramento, CA. http://www.energy.ca.gov/
greengrid/index.html.
California Energy Commissin (CEC), 2003. Distributed Generation
Strategic Plan (Final Report), January. Electronic version at http://
www.energy.ca.gov/distgen/strategic/strategic plan.html.
California Public Utilities Commission (CPUC) 1999. Definition of
Distributed Generation. Decision #99-10-065, September.
California Public Utilities Commission (CPUC), 2002. Rebate
program for on-site power generation. San Francisco, CA:
California Stationary Fuel Cell Collaborative (CSFCC), 2002. Gover-
nor’s Office of Research and Planning; California Air Resources
Board and the University of California, Irvine. National Center for
Fuel Cells, Sacramento, CA: www.stationaryfuelcells.org.
Chapman, R.N., 1996. Hybrid Power Technology for Remote Military
Facilities. Power Quality Solutions/Alternative Energy Proceed-
ings, IEEE Annual Meeting, September, pp. 415–427.
Clark, W.W., 1996. A technology commercialization model. Journal of
Technology Transfer. Washington, DC.
Clark, W.W., 1997. Publicly Funded Research and Development in
Environmentally Sound Technologies: The Case of the US. Report
for United Nations (one of ten industrialized countries). New
York, NY and Geneva.
Clark, W.W., 2000. Developing and diffusing clean technologies:
experience and practical issues. OECD Conference. Seoul, Korea.
Clark, W.W., 2001. The California Energy Challenge: from crisis to
opportunity for sustainable development. American Western
Economic Conference, San Francisco, CA, June.
Clark, W.W., 2002 Science parks (2): the practice. International
Journal of Technology Transfer and Commercialization. Inter-
science Press, London, UK.
Clark, W.W., Bradshaw, T., 2004. Agile Energy Systems in Complex
Societies: the Case of the California Energy Crisis. Elsevier Press,
London, UK (in press).
Clark, W.W., Jensen, J.D., 1994. The IO Fund: international alliances
for developing SMEs. Paper on the Danish Government Fund for
business development in transitional economies.
Clark, W.W., Jensen, J.D., 2001. The role of government in
privatization: an economic model for Denmark. International
Journal of Technology Management 21(5/6).
Clark, W.W., Lund, H., 2001. Civic markets: the case of the California
Energy crisis. International Journal of Global Energy Issues.
Interscience, London, UK.
Clark, W.W., Paolucci, E., 1997. The development of environmental
technologies for automotive industry: issues for a new model of
innovation. Journal of International Product Development Man-
agement.
Clark, W.W., Sowell, A., 2002. Standard Practices Manual: life cycle
analysis for project/program finance. International Journal of
Revenue Management. Interscience Press, London, UK.
Cooper, J.F., Fleming, D., Hargrove, D., Koopman, R., Peterman, K.,
1995. A refuelable zinc/air battery for fleet electric vehicle
propulsion. SAE Paper 951948.
Drucker, P., 1993. Post-Capitalist Society. Butterworth-Heinemann
Ltd., Oxford, UK.
The Economist, 1997. Science and Technology Section: ‘‘At last, the
fuel cell’’. October 25, London, UK, pp. 89–92.
Energy Information Administration, 1997. Annual Energy Outlook
1998. Advance copy available on the Internet at http://www.eia.
doe.gov.
Energy Mines and Resources Canada, 1988. Small power production
in remote communities: a shared opportunity. Energy Mines and
Resources Canada, Ottawa, Canada.
Flowers, L., 1997. Renewables for sustainable village power. Proceed-
ings of the International Conference of Village Electrification
through Renewable Energy, New Delhi, India. National Renew-
able Energy Laboratory Report NREL/CP-440–22608, Golden,
CO.
Galambos, J.D., Perkins, L.J., Haney, S.W., Mandrekas, J., 1995.
Commercial Tokamak reactor potential with advanced Tokamak
operation. Nuclear Fusion 35, 551.
ARTICLE IN PRESSW. Clark, W. Isherwood / Energy Policy 32 (2004) 1573–15891588

Guichard, A., 1994. Towards new energy systems for Antarctic
Stations, Proceedings of the Sixth Symposium on Antarctic
Logistics and Operations, Rome, Italy, pp. 81–95.
Granovetter, M., 1992. Problems of explanation in economic
sociology. In: Nohria, N., Eccles, R.G. (Eds.), Networks and
Organizations: Structure, Form, and Action. Harvard Business
School Press, Boston, pp. 25–56.
Granovetter, M., 1994. Business groups. In: Smelser, N.J., Swedberg,
R. (Eds.), The Handbook of Economic Sociology. Princeton
University Press, Princeton, NJ, pp. 453–475.
Harris, R.E., Lyons, J.G., Rinehart, P., 1997. Remote monitoring and
control of electric power systems to decrease costs and improve
system performance in remote arctic locations. Unpublished paper
prepared for AVEC, Anchorage, AK.
Isherwood, W., Smith, J.R., Aceves, S., Berry, G., Clark, W.W.,
Johnson, R., Das, D., Goering, D., Seifert, R., 2000. Remote
Village Energy Systems of Advanced Technologies. University of
California, Lawrence Livermore National Laboratory, UCRL-ID-
129289, January 1998 (to be published in Energy Policy, Fall).
Jensen, H., 1997. Personal Communication, Igiugig Electric Utility.
Anchorage, AK.
Jones, C., 1996. Careers in project networks: the case of the film
industry. In: Arthur, M., Rousseau, D. (Eds.), The Boundaryless
Career. Oxford University Press, New York, NY, pp. 58–75.
Jones, C., Hesterly, W.S., Borgatti, S.P., 1997. A general theory of
network governance: exchange conditions and social mechanisms.
Academy of Management Review 22 (4).
Koniag, Inc., 1995. Native Alaska Energy Efficiency Feasibility Study.
US Department of Energy Report, Prepared under Grant No. DE-
FG51-94R020502.
Los Angeles Department of Water and Power (LADWP), 2002.
Rebate programs. Los Angeles, CA. [email protected].
Lund, H., 2000. Choice awareness: the development of technological
and institutional choice in the public debate of Danish
energy planning. Journal of Environmental Policy Planning 2,
249–259.
Lund, H., 2001, Flexible Energy System Data in Denmark. Draft
report for Danish Energy Ministry.
Malosh, J.B., Johnson, R., Bubendorf, S., 1985, Part-Load Economy
of Diesel-Electric Generators. Final Report, State of Alaska,
Department of Transportation and Public Facilities, Division of
Planning, Fairbanks, AK.
Manwell, J.F., Rogers, A., Hayman, G., Avelar, C.T., McGowan,
J.G., 1996. Theory Manual for Hybrid2, The Hybrid System
Simulation Model, National Renewable Energy Laboratory
Report NREL/TP-440-21182, Golden, CO.
Moore, T., 1997. Market potential high for fuel cells. EPRI Journal,
May–June, 6–17.
M .unster, E., 2001. Combined neat and power: Nord pool exchange.
PlanEnergi, Denmark, 2 June. [email protected].
Narin, F., Hamilton, K.S., Olivastro, D., 1998. The increasing linkage
between U.S. technology and public science. Research Policy, 1–17.
National Science Foundation, 1997. Science and Engineering Indica-
tors. Appendix A: pp. 136–139, 150–153, 172–175.
Perkins, J., Lamont, A., Clark, W.W., 1997. Global Sustainability
though SUPERCODE Optimization and Meta�Net EconomicEquilibrium Codes, LLNL, LDRD Project Proposal and Report.
Porter, M.E., van der Linde, C., 1995. Green and competitive.
Harvard Business Review, September–October, 120–134.
Saxenian, A., 1994. Regional Advantage: Culture and Competition
in Silicon Valley and Route 128. Harvard University Press,
Cambridge, MA.
Saxenian, A., 2002. Local and Global Networks of Immigrant
Professionals in Silicon Valley. Public Policy Institute of Califor-
nia, San Francisco, CA.
Smith, J.R., Aceves, S., Clark, W., John Perkins, L., (LLNL); Gehl, S.,
Maulbetsch, J (EPRI); Nakata Nakata, T. (Toakai University
of Japan, 1997). Optimization for Power/Utility Applications.
Proposal at LLNL for LDRD 1998.
United Nations, 1994. Report of the Workshop (Oslo, 13–15 October,
1993) on the Transfer and Development of Environmentally
Sound Technologies (ESTs). UNCTAD, New York and Geneva,
pp. 1–51.
United Nations, 1997. Promoting the transfer and use of environmen-
tally sound technology: a review of policies. Science and
Technology Issues, UNCTAD, New York, Geneva, pp. 1–53.
US Department of Commerce, 1997. The Global Context for US
Technology Policy. Washington, DC.
Williamson, O.E., 1994. Transaction cost economics and organization
theory. In: Smelser, N.J., Swedberg, R. (Eds.), The Handbook of
Economic Sociology. Princeton, NJ: Princeton University Press,
pp. 77–107.
Williamson, O.E., 1996. Economic organization: the case of candor.
Academy of Management Review 21, 48–57.
ARTICLE IN PRESSW. Clark, W. Isherwood / Energy Policy 32 (2004) 1573–1589 1589