Distributed Generation Opportunities in the Southeast...
72
Distributed Generation Opportunities in the Southeast Prepared for: U.S. Department of Energy Southeast Regional Office Atlanta, Georgia Prepared by: Bruce A. Hedman Anne Hampson Energy & Environmental Analysis, Inc. Arlington, Virginia December 2004
-
Upload
hoanghuong -
Category
Documents
-
view
215 -
download
0
Transcript of Distributed Generation Opportunities in the Southeast...

Distributed Generation Opportunities in the Southeast
Prepared for: U.S. Department of Energy Southeast Regional Office
Atlanta, Georgia
Prepared by: Bruce A. Hedman Anne Hampson
Energy & Environmental Analysis, Inc. Arlington, Virginia
December 2004

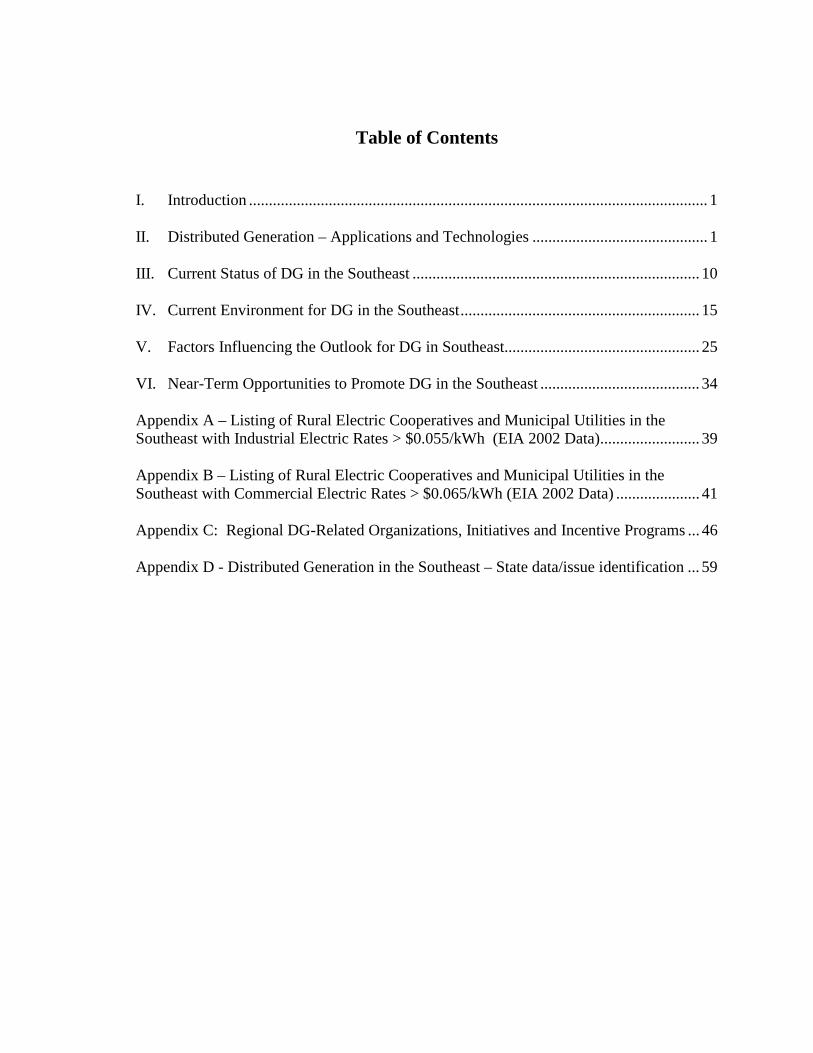
Table of Contents
I. Introduction ................................................................................................................... 1
II. Distributed Generation – Applications and Technologies ............................................ 1 III. Current Status of DG in the Southeast ........................................................................ 10
IV. Current Environment for DG in the Southeast............................................................ 15 V. Factors Influencing the Outlook for DG in Southeast................................................. 25 VI. Near-Term Opportunities to Promote DG in the Southeast ........................................ 34 Appendix A – Listing of Rural Electric Cooperatives and Municipal Utilities in the Southeast with Industrial Electric Rates > $0.055/kWh (EIA 2002 Data)......................... 39 Appendix B – Listing of Rural Electric Cooperatives and Municipal Utilities in the Southeast with Commercial Electric Rates > $0.065/kWh (EIA 2002 Data) ..................... 41 Appendix C: Regional DG-Related Organizations, Initiatives and Incentive Programs ... 46 Appendix D - Distributed Generation in the Southeast – State data/issue identification ... 59

Distributed Generation Opportunities in the Southeast
Energy and Environmental Analysis, Inc. 1
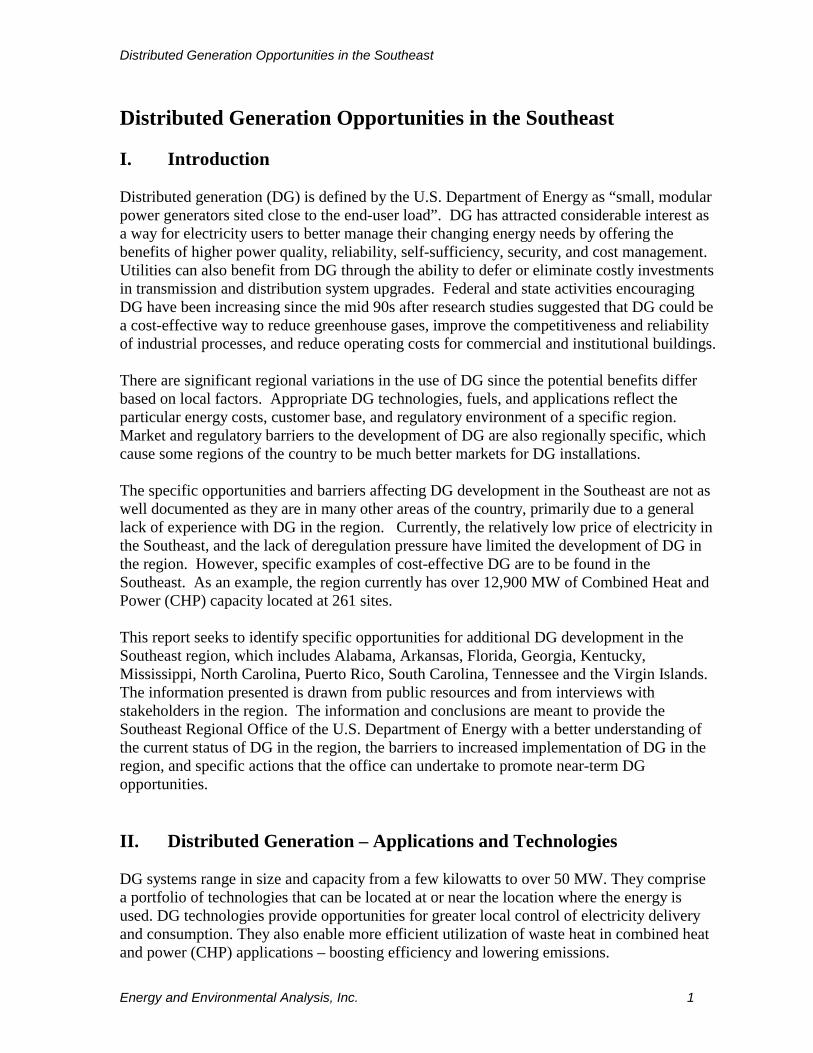
Distributed Generation Opportunities in the Southeast
I. Introduction Distributed generation (DG) is defined by the U.S. Department of Energy as “small, modular power generators sited close to the end-user load”. DG has attracted considerable interest as a way for electricity users to better manage their changing energy needs by offering the benefits of higher power quality, reliability, self-sufficiency, security, and cost management. Utilities can also benefit from DG through the ability to defer or eliminate costly investments in transmission and distribution system upgrades. Federal and state activities encouraging DG have been increasing since the mid 90s after research studies suggested that DG could be a cost-effective way to reduce greenhouse gases, improve the competitiveness and reliability of industrial processes, and reduce operating costs for commercial and institutional buildings. There are significant regional variations in the use of DG since the potential benefits differ based on local factors. Appropriate DG technologies, fuels, and applications reflect the particular energy costs, customer base, and regulatory environment of a specific region. Market and regulatory barriers to the development of DG are also regionally specific, which cause some regions of the country to be much better markets for DG installations. The specific opportunities and barriers affecting DG development in the Southeast are not as well documented as they are in many other areas of the country, primarily due to a general lack of experience with DG in the region. Currently, the relatively low price of electricity in the Southeast, and the lack of deregulation pressure have limited the development of DG in the region. However, specific examples of cost-effective DG are to be found in the Southeast. As an example, the region currently has over 12,900 MW of Combined Heat and Power (CHP) capacity located at 261 sites. This report seeks to identify specific opportunities for additional DG development in the Southeast region, which includes Alabama, Arkansas, Florida, Georgia, Kentucky, Mississippi, North Carolina, Puerto Rico, South Carolina, Tennessee and the Virgin Islands. The information presented is drawn from public resources and from interviews with stakeholders in the region. The information and conclusions are meant to provide the Southeast Regional Office of the U.S. Department of Energy with a better understanding of the current status of DG in the region, the barriers to increased implementation of DG in the region, and specific actions that the office can undertake to promote near-term DG opportunities. II. Distributed Generation – Applications and Technologies DG systems range in size and capacity from a few kilowatts to over 50 MW. They comprise a portfolio of technologies that can be located at or near the location where the energy is used. DG technologies provide opportunities for greater local control of electricity delivery and consumption. They also enable more efficient utilization of waste heat in combined heat and power (CHP) applications – boosting efficiency and lowering emissions.
Distributed Generation Opportunities in the Southeast
Energy and Environmental Analysis, Inc. 2
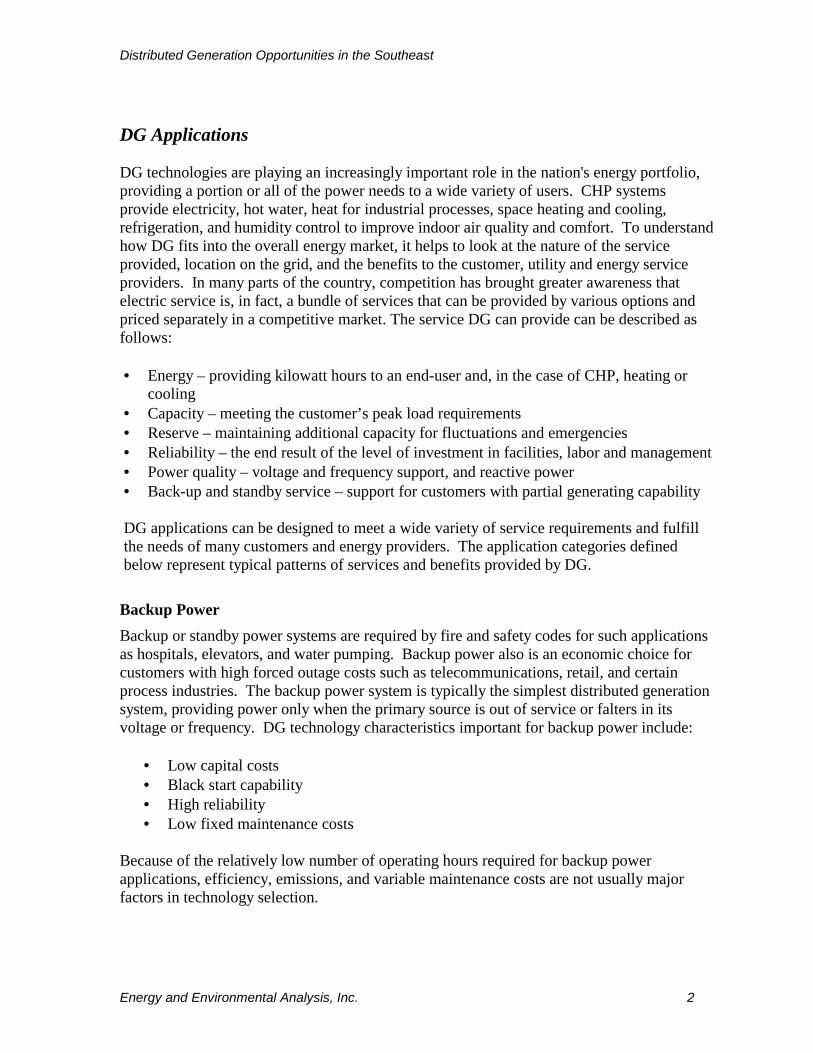
DG Applications DG technologies are playing an increasingly important role in the nation's energy portfolio, providing a portion or all of the power needs to a wide variety of users. CHP systems provide electricity, hot water, heat for industrial processes, space heating and cooling, refrigeration, and humidity control to improve indoor air quality and comfort. To understand how DG fits into the overall energy market, it helps to look at the nature of the service provided, location on the grid, and the benefits to the customer, utility and energy service providers. In many parts of the country, competition has brought greater awareness that electric service is, in fact, a bundle of services that can be provided by various options and priced separately in a competitive market. The service DG can provide can be described as follows: • Energy – providing kilowatt hours to an end-user and, in the case of CHP, heating or
cooling • Capacity – meeting the customer’s peak load requirements • Reserve – maintaining additional capacity for fluctuations and emergencies • Reliability – the end result of the level of investment in facilities, labor and management • Power quality – voltage and frequency support, and reactive power • Back-up and standby service – support for customers with partial generating capability
DG applications can be designed to meet a wide variety of service requirements and fulfill the needs of many customers and energy providers. The application categories defined below represent typical patterns of services and benefits provided by DG.
Backup Power Backup or standby power systems are required by fire and safety codes for such applications as hospitals, elevators, and water pumping. Backup power also is an economic choice for customers with high forced outage costs such as telecommunications, retail, and certain process industries. The backup power system is typically the simplest distributed generation system, providing power only when the primary source is out of service or falters in its voltage or frequency. DG technology characteristics important for backup power include:
• Low capital costs • Black start capability • High reliability • Low fixed maintenance costs
Because of the relatively low number of operating hours required for backup power applications, efficiency, emissions, and variable maintenance costs are not usually major factors in technology selection.

Distributed Generation Opportunities in the Southeast
Energy and Environmental Analysis, Inc. 3
Base-load/Remote Power Continuous on-site power generation without heat recovery can be a cost-effective option for commercial and industrial applications in high electric price areas or in specialized situations, such as remote sites or availability of low cost (or no cost) waste fuels. Important DG technology characteristics for base-load power-only include:
• High electric efficiency • Low maintenance costs (variable) • Low emissions (depending on location) • High reliability • Multi-fuel capability
Demand Response Peaking On-site generating systems can be used in coordinated peak-shaving programs with servicing utilities. Under such arrangements, the utility offers capacity and/or commodity payments for very limited hours of use. These programs typically require as few as 50 hours/year to as many as 400 hours/year. Important DG technology characteristics for demand response programs include:
• Low installed cost • Low maintenance costs (fixed) • Quick startup
Customer Peaking Customer-driven peak shaving can be used to reduce utility demand charges, defer retail electricity purchases during high-price periods, or to secure more competitive power contracts from energy service providers by smoothing site demand or by allowing interruptible service. Operating hours for customer-driven peaking are usually between 200 to 3,000 hours a year. Important DG technology characteristics for peaking power applications include:
• Low installed cost • Low maintenance costs (fixed) • Quick startup • High electric efficiency (important for systems with operating hours in the higher end
of the range)
Premium Power Premium power is an emerging market for distributed generation systems. These systems either provide high-quality power to sensitive-load customers at a higher level of reliability and/or higher power quality than is typically available from the grid. Such systems also may serve to clean up negative effects that the customer’s own load may have on power quality for neighboring customers. The growing use of sensitive electronic equipment is making control of power quality much more important in today's market. Current DG premium
Distributed Generation Opportunities in the Southeast
Energy and Environmental Analysis, Inc. 4
power approaches employ on-site generation as the primary power source and the grid as back-up (as compared to emergency or standby generation). Important DG technology characteristics for active premium power applications include:
• High efficiency • Low maintenance costs • High reliability • Clean power output • Low emissions
Utility-Based Grid Support Distributed generation can be used by an electric utility to provide ancillary services at the transmission and distribution (T&D) level, or to replace or defer T&D investments. The market for ancillary services is still unfolding, but services that distributed generation could provide include spinning reserves, voltage and frequency support to enhance local area reliability and power quality, and reactive power control. The critical DG technology characteristics vary, depending on applications, but often include:
• Low installed cost • Low maintenance costs (fixed) • High reliability
Combined Heat and Power End users with significant thermal and power needs can generate both thermal and electrical energy in a single combined heat and power system located at or near the facility. CHP, also called cogeneration, can substantially increase the efficiency of energy utilization, resulting in lower operating costs for the user and potential reductions in emissions of criteria pollutants and CO2. Heat can generally be recovered in the form of hot water or steam, or the hot exhaust from the system can be used directly for applications such as process heating or drying (e.g., grain drying, brick drying or greenhouses). The waste heat also can be used to drive thermally activated equipment, such as absorption chillers for cooling or desiccant wheel regeneration for dehumidification. Annual operating hours for CHP systems are typically 6,000 or more. Important DG technology characteristics for CHP include:
• High useable thermal output (resulting in high overall efficiency) • Low maintenance costs (variable) • Low emissions • High reliability
Because use of the thermal energy enhances application economics, CHP is the most prevalent form of DG in most areas of the country (not including standby/emergency gensets). CHP has been traditionally applied by medium to large industrial users with high steam and power demands (chemicals, paper, refining) and by large commercial/institutional
Distributed Generation Opportunities in the Southeast
Energy and Environmental Analysis, Inc. 5
applications (universities, hospitals). A large potential also exists for smaller CHP systems in light industrial and commercial applications. DG Technologies DG technologies are complex integrated systems that consist of a number of individual components from fuel treatment, combustion, mechanical energy, electric energy, electricity conditioning, heat recovery, and heat rejection systems. However, they are typically identified by the prime mover that drives the overall system. Many of the prime movers for distributed generation are commonly in use today, some are just entering the market, and others will be available within a few years.
Reciprocating Engines Reciprocating internal combustion engines represent a widespread and mature technology for power generation applications. Reciprocating engines are used for all types of power generation, from small portable gensets to larger industrial engines that power generators of several megawatts. Spark ignition engines for power generation use natural gas as the preferred fuel – although they can be set up to run on propane, gasoline and a variety of biomass fuels such as landfill gas or digester gas. Diesel-cycle, compression ignition engines operate on diesel fuel or heavy oil, or can be set up in a dual-fuel configuration that can burn primarily natural gas with a small amount of diesel pilot fuel. Reciprocating engines offer low first cost, easy start-up, proven reliability when properly maintained, and good load-following characteristics. Drawbacks of reciprocating engines include relatively high noise levels, relatively high air emissions, and the need for regular maintenance at relatively frequent intervals. The emissions profiles of reciprocating engines have improved significantly in recent years by the use of exhaust catalysts and through better design and control of the combustion process. Gas-fired reciprocating engines are well suited for packaged CHP in commercial and light industrial applications of less than 5 MW. Smaller engine systems produce hot water. Larger systems can be designed to produce low-pressure steam. The waste heat from reciprocating engines can be used with absorption chillers and desiccant dehumidification.
Gas Turbines Gas turbines for distributed generation applications are an established technology in sizes from several hundred kilowatts to over 50 MW. Gas turbines produce high-quality heat that can be used to generate steam for on-site use or for additional power generation (combined-cycle configuration). Gas turbines can be set up to burn natural gas, a variety of petroleum fuels or can have a dual-fuel configuration. Gas turbines can also, with some modification, be used with biomass fuels such as landfill gas and/or digester gas. Gas turbine emissions can be controlled to very low levels using water or steam injection, advanced dry combustion techniques, or exhaust treatment such as selective catalytic reduction (SCR). Maintenance costs per unit of power output are among the lowest of DG technology options. Low maintenance and high-quality waste heat make gas turbines an excellent match for industrial or commercial CHP applications larger than 5 MW. Technical and economic improvements in small turbine technology are pushing the economic range into smaller sizes as well. An
Distributed Generation Opportunities in the Southeast
Energy and Environmental Analysis, Inc. 6
important advantage of CHP using gas turbines is the high-quality waste heat available in the exhaust gas. The high-temperature exhaust gas is suitable for generating high-pressure steam, making gas turbines a preferred CHP technology for many industrial processes. In simple cycle gas turbines, hot exhaust gas can be used directly in a process or by adding a heat-recovery steam generator (HRSG) that uses the exhaust heat to generate steam or hot water. Because gas turbine exhaust is oxygen-rich, it can support additional combustion through supplementary firing. A duct burner can be fitted within the HRSG to increase the steam production at lower-heating-value efficiencies of 90% and greater.
Steam Turbines Steam turbines convert steam energy into shaft power and are one of the most versatile and oldest prime mover technologies used to drive generators or mechanical machinery. The capacity of steam turbines can range from fractional horsepower to several hundred MW for large utility power plants. A steam turbine is captive to a separate heat source and does not directly convert a fuel source to electric energy. Steam turbines require a source of high-pressure steam that is produced in a boiler or heat recovery steam generator (HRSG). Boiler fuels can include fossil fuels such as coal, oil, or natural gas or renewable fuels like wood, agricultural wastes or municipal waste. Most of the electricity in the United States is generated by conventional steam turbine power plants. Steam turbine CHP systems are primarily used in industrial processes where solid or waste fuels are readily available for boiler use. In CHP applications, steam is extracted from the steam turbine and used directly in a process or for district heating, or it can be converted to other forms of thermal energy including hot water or chilled water. Microturbines Microturbines are very small combustion turbines that are currently offered in a size range of 30 kW to 250 kW. Microturbine technology has evolved from the technology used in automotive and truck turbochargers and auxiliary power units for airplanes and tanks. Several companies have developed commercial microturbine products and are in the early stages of market entry. In the typical configuration, the turbine shaft, spinning at up to 100,000 rpm, drives a high-speed generator. The generator’s high-frequency output is converted to the 60 Hz power used in the United States by sophisticated power electronics controls. Electrical efficiencies of 23-26% are achieved by employing a recuperator that transfers heat energy from the exhaust stream back into the combustion air stream. Microturbines are compact and lightweight, with few moving parts. Many designs are air-cooled and some use air bearings, thereby eliminating the cooling water and lube oil systems. Low-emission combustion systems, which provide emissions performance approaching that of larger gas turbines, are being demonstrated. Microturbines have also been demonstrated on a wide variety of fuels ranging from natural gas to propane to landfill gas. Microturbines’ potential for low emissions, reduced maintenance, and simplicity promises to make on-site generation more competitive in the 30 to 300 kW size range characterized by commercial buildings or light industrial applications. Microturbines for CHP duty are typically designed to recover hot water or low-pressure steam and can be coupled with absorption chillers or desiccant dehumidification.

Distributed Generation Opportunities in the Southeast
Energy and Environmental Analysis, Inc. 7
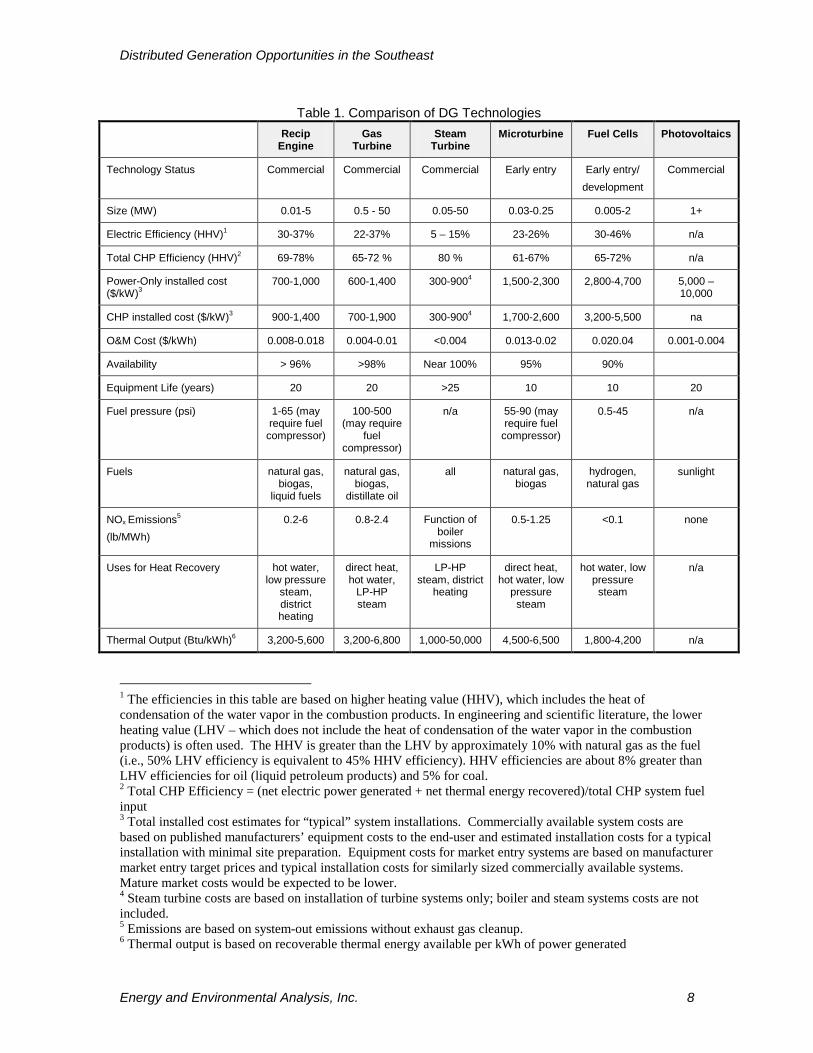
Fuel Cells Fuel cells produce power electrochemically, more like batteries than conventional generating systems. Unlike storage batteries, however – which produce power from stored chemicals – fuel cells produce power when hydrogen fuel is delivered to the cathode of the cell, and oxygen in air is delivered to the anode. The resultant chemical reactions at each electrode create a stream of electrons (or direct current) in the electric circuit external to the cell. The hydrogen fuel can come from a variety of sources, but the most economic is steam reforming of natural gas – a chemical process that strips the hydrogen from both the fuel and the steam. Several different liquid and solid media can be used inside fuel cells – phosphoric acid (PAFC), molten carbonate (MCFC), solid oxide (SOFC), and proton exchange membrane (PEMFC). Each of these media comprises a distinct fuel cell technology with its own performance characteristics and development schedule. PAFCs are in early commercial market development now, with 200 kW units delivered to more than 150 customers worldwide. The PEMFC and MCFC technologies are now in early market introduction and demonstration. SOFC units are in development and testing. Fuel cells promise higher efficiency than generation technologies based on heat engine prime movers. In addition, fuel cells are inherently quiet and extremely clean running. Similar to microturbines, fuel cells require power electronics to convert direct current to 60-Hz alternating current. Many fuel cell technologies are modular and capable of application in small commercial and even residential markets; other technologies operate at high temperatures in larger sized systems that would be suited to industrial CHP applications. Photovoltaics, Wind Turbines and Other Renewables Photovoltaics, and concentrating solar-thermal power systems utilize forms of solar energy to produce power. Modular photovoltaic power systems can be sited anywhere and have been commercially demonstrated in environmentally sensitive areas and in remote (grid-isolated) applications. High costs currently limit these systems to niche applications where economics is secondary to other requirements such as environmental impact or power availability. Wind-farms are more limited in their siting and less flexible for use in distributed generation applications. The cost of power from wind systems is growing more competitive with conventional systems when they are sited in high wind areas of the country. Both solar and wind systems are subject to environmental conditions that govern their ability to generate electricity, with solar projects requiring clear sunny weather and wind projects requiring high winds. These limitations greatly effect the applications that solar and wind projects can be used for, causing the majority of these systems to provide remote or baseload power. In a broad sense, each of these technologies competes with each other and with utility and merchant power generation. In a narrow sense, each technology is aimed at specific and often different market segments, so side-by-side comparisons must be viewed cautiously. System economics depend on first cost, running efficiencies, fuel costs, and maintenance costs. Site suitability depends on size, weight, emissions, noise and other factors. Table 1 shows the basic system performance characteristics for engines, gas turbines, microturbines, steam turbines, fuel cells and photovoltaics.
Distributed Generation Opportunities in the Southeast
Energy and Environmental Analysis, Inc. 8
Table 1. Comparison of DG Technologies Recip
Engine Gas
Turbine Steam
Turbine Microturbine Fuel Cells Photovoltaics
Technology Status Commercial Commercial Commercial Early entry Early entry/ development
Commercial
Size (MW) 0.01-5 0.5 - 50 0.05-50 0.03-0.25 0.005-2 1+
Electric Efficiency (HHV)1 30-37% 22-37% 5 – 15% 23-26% 30-46% n/a
Total CHP Efficiency (HHV)2 69-78% 65-72 % 80 % 61-67% 65-72% n/a
Power-Only installed cost ($/kW)3
700-1,000 600-1,400 300-9004 1,500-2,300 2,800-4,700 5,000 – 10,000
CHP installed cost ($/kW)3 900-1,400 700-1,900 300-9004 1,700-2,600 3,200-5,500 na
O&M Cost ($/kWh) 0.008-0.018 0.004-0.01 <0.004 0.013-0.02 0.020.04 0.001-0.004
Availability > 96% >98% Near 100% 95% 90%
Equipment Life (years) 20 20 >25 10 10 20
Fuel pressure (psi) 1-65 (may require fuel
compressor)
100-500 (may require
fuel compressor)
n/a 55-90 (may require fuel
compressor)
0.5-45 n/a
Fuels natural gas, biogas,
liquid fuels
natural gas, biogas,
distillate oil
all natural gas, biogas
hydrogen, natural gas
sunlight
NOx Emissions5
(lb/MWh) 0.2-6 0.8-2.4 Function of
boiler missions
0.5-1.25 <0.1 none
Uses for Heat Recovery hot water, low pressure
steam, district heating
direct heat, hot water,
LP-HP steam
LP-HP steam, district
heating
direct heat, hot water, low
pressure steam
hot water, low pressure
steam
n/a
Thermal Output (Btu/kWh)6 3,200-5,600 3,200-6,800 1,000-50,000 4,500-6,500 1,800-4,200 n/a
1 The efficiencies in this table are based on higher heating value (HHV), which includes the heat of condensation of the water vapor in the combustion products. In engineering and scientific literature, the lower heating value (LHV – which does not include the heat of condensation of the water vapor in the combustion products) is often used. The HHV is greater than the LHV by approximately 10% with natural gas as the fuel (i.e., 50% LHV efficiency is equivalent to 45% HHV efficiency). HHV efficiencies are about 8% greater than LHV efficiencies for oil (liquid petroleum products) and 5% for coal. 2 Total CHP Efficiency = (net electric power generated + net thermal energy recovered)/total CHP system fuel input 3 Total installed cost estimates for “typical” system installations. Commercially available system costs are based on published manufacturers’ equipment costs to the end-user and estimated installation costs for a typical installation with minimal site preparation. Equipment costs for market entry systems are based on manufacturer market entry target prices and typical installation costs for similarly sized commercially available systems. Mature market costs would be expected to be lower. 4 Steam turbine costs are based on installation of turbine systems only; boiler and steam systems costs are not included. 5 Emissions are based on system-out emissions without exhaust gas cleanup. 6 Thermal output is based on recoverable thermal energy available per kWh of power generated
Distributed Generation Opportunities in the Southeast
Energy and Environmental Analysis, Inc. 9
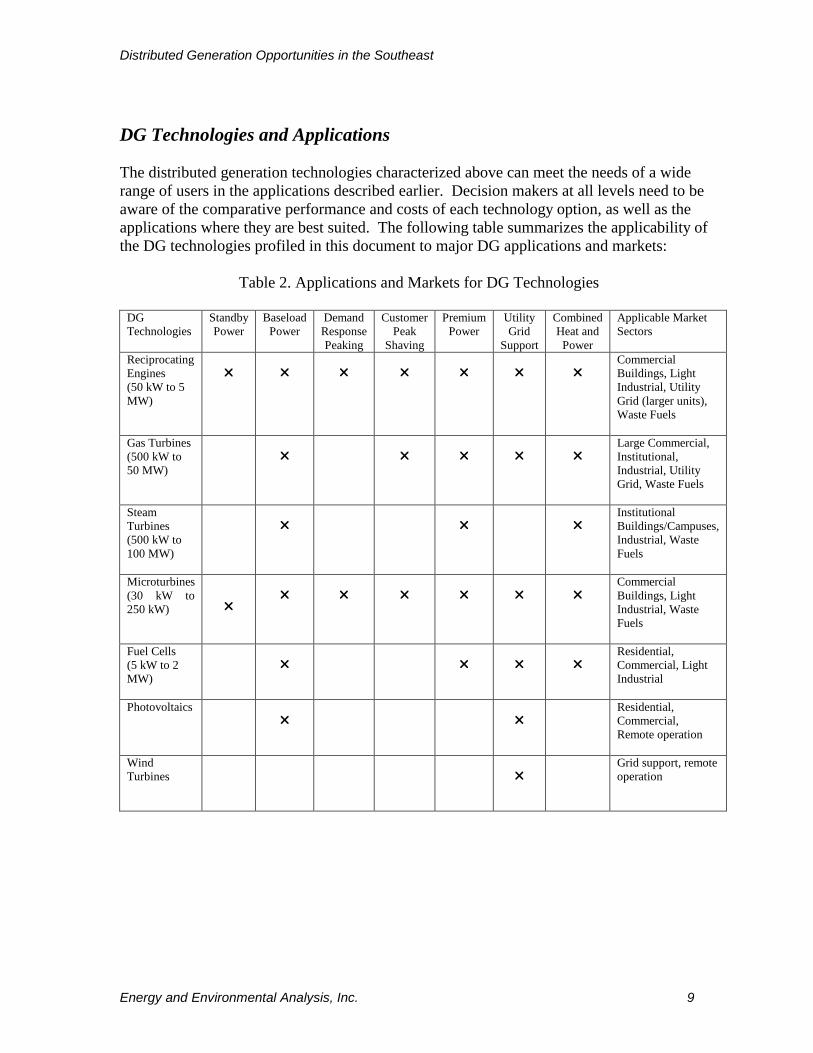
DG Technologies and Applications The distributed generation technologies characterized above can meet the needs of a wide range of users in the applications described earlier. Decision makers at all levels need to be aware of the comparative performance and costs of each technology option, as well as the applications where they are best suited. The following table summarizes the applicability of the DG technologies profiled in this document to major DG applications and markets:
Table 2. Applications and Markets for DG Technologies
DG Technologies
Standby Power
Baseload Power
Demand Response Peaking
Customer Peak
Shaving
Premium Power
Utility Grid
Support
Combined Heat and
Power
Applicable Market Sectors
Reciprocating Engines (50 kW to 5 MW)
�
�
�
�
�
�
�
Commercial Buildings, Light Industrial, Utility Grid (larger units), Waste Fuels
Gas Turbines (500 kW to 50 MW)
�
�
�
�
�
Large Commercial, Institutional, Industrial, Utility Grid, Waste Fuels
Steam Turbines (500 kW to 100 MW)
�
�
�
Institutional Buildings/Campuses, Industrial, Waste Fuels
Microturbines (30 kW to 250 kW) �
�
�
�
�
�
�
Commercial Buildings, Light Industrial, Waste Fuels
Fuel Cells (5 kW to 2 MW)
�
�
�
�
Residential, Commercial, Light Industrial
Photovoltaics �
�
Residential, Commercial, Remote operation
Wind Turbines
�
Grid support, remote operation

Distributed Generation Opportunities in the Southeast
Energy and Environmental Analysis, Inc. 10
III. Current Status of DG in the Southeast There is significant regional variation in the use of DG systems. Much of this is due to the fact that the potential benefits of DG are greater in some areas than others. In some regions, for example, relatively high electric rates, reliability concerns and pro-DG regulatory programs have encouraged DG development. But in many areas, even where DG could offer benefits, development is often blocked by market and institutional barriers. The Southeast has not traditionally been a strong market for DG and it has not kept pace with the development of DG and CHP in other areas of the country such as the Northeast, California and Southwest (Texas/Louisiana). In addition to the barriers that are commonly cited as a hindrance to DG development such as high capital costs, the difficulty of interconnection with the grid, non-uniform regulatory requirements, and lack of experience with DG technologies, DG development has been constrained in the Southeast by relatively low electric rates and the lack of electric industry restructuring pressure in the region. However, there are still a reasonable number of DG installations in the region, especially Combined Heat and Power systems. Combined Heat and Power As described earlier, combined heat and power (CHP) systems, a form of DG, recover the waste heat from on-site power generation to reduce the need for purchased fuels to supply on-site thermal energy needs. The heat from CHP systems can provide process heating for industrial applications or space heating/cooling for commercial buildings as well as provide for many other types of thermal loads. CHP is a significant generating source nationally. As of 2004, approximately 80,000 MW of CHP capacity are installed nationwide at over 2,900 sites, representing approximately 8% of the nation’s total electric generating capacity. The Southeast has approximately 13,000 MW of capacity installed at 261 sites. In comparison to the national CHP profile, existing CHP systems in the southeast are larger than the national average, more dependent on solid and waste fuels, and more reliant on boiler/steam turbine technologies. Table 3 and Figure 1 show summaries of CHP installations in the Southeast states by number of sites and capacity. The Southeast represents approximately 16% of total U.S. CHP capacity and 9% of the total 2,900 CHP installations in the country.

Distributed Generation Opportunities in the Southeast
Energy and Environmental Analysis, Inc. 11
Table 3: CHP Installations by State
Sites MW Alabama 31 2,936.3 Arkansas 13 511.5 Florida 68 3,458.1 Georgia 34 1,191.9
Kentucky 5 108.9 Mississippi 20 1,081.8
North Carolina 47 1,511.9 South Carolina 16 1,612.1
Tennessee 27 499.6 Total 261 12,912.2
Source: Energy and Environmental Analysis, Inc. As shown, Florida and Alabama have the most CHP MW capacity in the Southeast, followed by North and South Carolina. Florida and South Carolina have the most installations in the Southeast with 68 and 47 sites respectively. However, activity in these states is relatively low in comparison to California and New York and their DG encouraging policies that have encouraged significant CHP development; California currently has 840 CHP installations representing over 9,100 MW of capacity, and New York has over 260 installations representing 4,900 MW of capacity.
AL23%
AR4%
FL27%
GA9%
NC12%
SC12%
TN4%
KY1%
MS8%
U.S. = 79,896 MW Southeast = 12,912 MW
Figure 1: Southeast CHP Capacity by State
The majority of CHP installations in the Southeast are in the industrial sector with 86% of capacity, or 11,100 MW, located in industries such as paper products, chemicals, food processing and refining. The remaining 14% of capacity, or 1,810 MW, located in the
Distributed Generation Opportunities in the Southeast
Energy and Environmental Analysis, Inc. 12
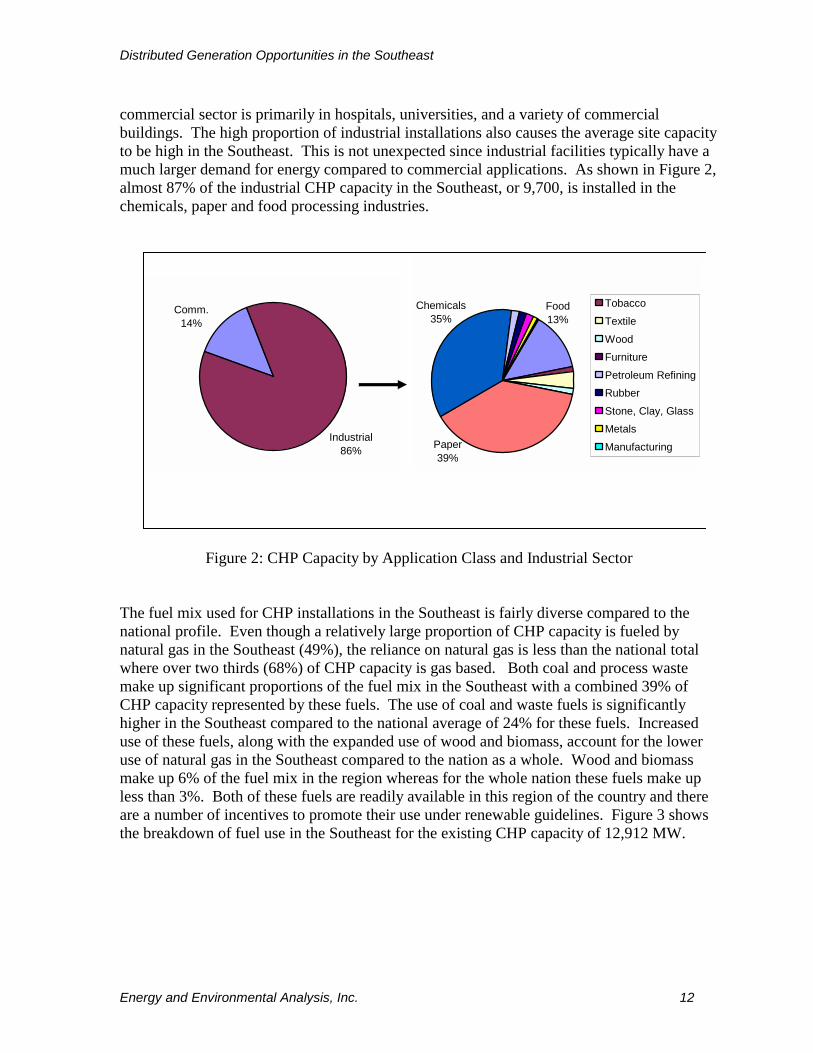
commercial sector is primarily in hospitals, universities, and a variety of commercial buildings. The high proportion of industrial installations also causes the average site capacity to be high in the Southeast. This is not unexpected since industrial facilities typically have a much larger demand for energy compared to commercial applications. As shown in Figure 2, almost 87% of the industrial CHP capacity in the Southeast, or 9,700, is installed in the chemicals, paper and food processing industries.
Industrial86%
Comm.14%
Paper39%
Food13%
Chemicals35%
TobaccoTextileWoodFurniturePetroleum RefiningRubberStone, Clay, GlassMetalsManufacturing
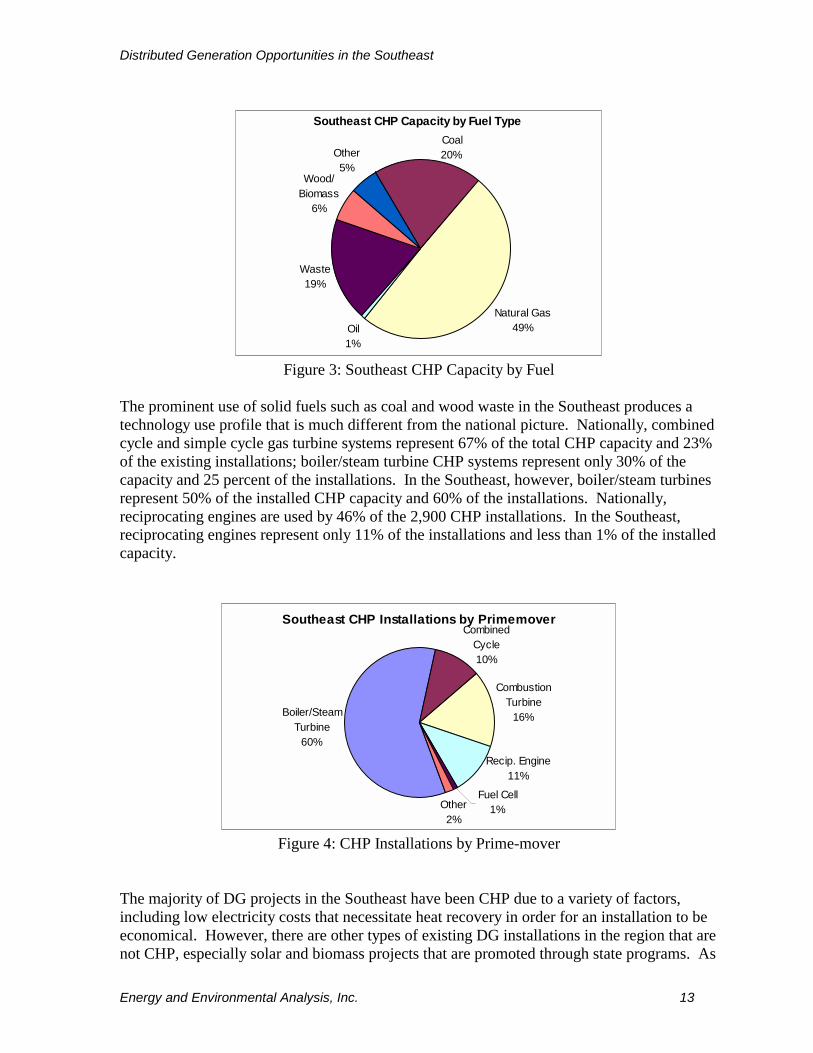
Figure 2: CHP Capacity by Application Class and Industrial Sector The fuel mix used for CHP installations in the Southeast is fairly diverse compared to the national profile. Even though a relatively large proportion of CHP capacity is fueled by natural gas in the Southeast (49%), the reliance on natural gas is less than the national total where over two thirds (68%) of CHP capacity is gas based. Both coal and process waste make up significant proportions of the fuel mix in the Southeast with a combined 39% of CHP capacity represented by these fuels. The use of coal and waste fuels is significantly higher in the Southeast compared to the national average of 24% for these fuels. Increased use of these fuels, along with the expanded use of wood and biomass, account for the lower use of natural gas in the Southeast compared to the nation as a whole. Wood and biomass make up 6% of the fuel mix in the region whereas for the whole nation these fuels make up less than 3%. Both of these fuels are readily available in this region of the country and there are a number of incentives to promote their use under renewable guidelines. Figure 3 shows the breakdown of fuel use in the Southeast for the existing CHP capacity of 12,912 MW.
Distributed Generation Opportunities in the Southeast
Energy and Environmental Analysis, Inc. 13
Southeast CHP Capacity by Fuel Type
Natural Gas49%Oil
1%
Waste19%
Other5%
Coal20%
Wood/ Biomass
6%
Figure 3: Southeast CHP Capacity by Fuel
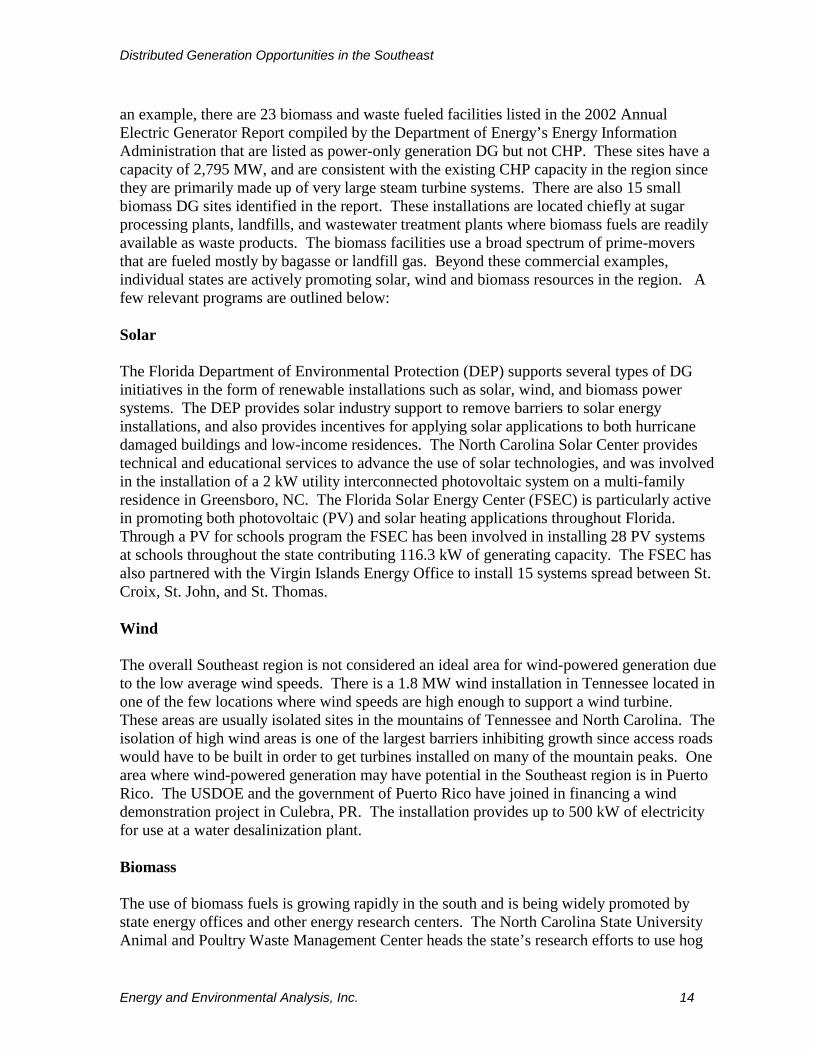
The prominent use of solid fuels such as coal and wood waste in the Southeast produces a technology use profile that is much different from the national picture. Nationally, combined cycle and simple cycle gas turbine systems represent 67% of the total CHP capacity and 23% of the existing installations; boiler/steam turbine CHP systems represent only 30% of the capacity and 25 percent of the installations. In the Southeast, however, boiler/steam turbines represent 50% of the installed CHP capacity and 60% of the installations. Nationally, reciprocating engines are used by 46% of the 2,900 CHP installations. In the Southeast, reciprocating engines represent only 11% of the installations and less than 1% of the installed capacity.
Southeast CHP Installations by Primemover
Boiler/Steam Turbine
60%
Combustion Turbine
16%
Combined Cycle10%
Recip. Engine11%
Fuel Cell1%Other
2%
Figure 4: CHP Installations by Prime-mover The majority of DG projects in the Southeast have been CHP due to a variety of factors, including low electricity costs that necessitate heat recovery in order for an installation to be economical. However, there are other types of existing DG installations in the region that are not CHP, especially solar and biomass projects that are promoted through state programs. As
Distributed Generation Opportunities in the Southeast
Energy and Environmental Analysis, Inc. 14
an example, there are 23 biomass and waste fueled facilities listed in the 2002 Annual Electric Generator Report compiled by the Department of Energy’s Energy Information Administration that are listed as power-only generation DG but not CHP. These sites have a capacity of 2,795 MW, and are consistent with the existing CHP capacity in the region since they are primarily made up of very large steam turbine systems. There are also 15 small biomass DG sites identified in the report. These installations are located chiefly at sugar processing plants, landfills, and wastewater treatment plants where biomass fuels are readily available as waste products. The biomass facilities use a broad spectrum of prime-movers that are fueled mostly by bagasse or landfill gas. Beyond these commercial examples, individual states are actively promoting solar, wind and biomass resources in the region. A few relevant programs are outlined below: Solar The Florida Department of Environmental Protection (DEP) supports several types of DG initiatives in the form of renewable installations such as solar, wind, and biomass power systems. The DEP provides solar industry support to remove barriers to solar energy installations, and also provides incentives for applying solar applications to both hurricane damaged buildings and low-income residences. The North Carolina Solar Center provides technical and educational services to advance the use of solar technologies, and was involved in the installation of a 2 kW utility interconnected photovoltaic system on a multi-family residence in Greensboro, NC. The Florida Solar Energy Center (FSEC) is particularly active in promoting both photovoltaic (PV) and solar heating applications throughout Florida. Through a PV for schools program the FSEC has been involved in installing 28 PV systems at schools throughout the state contributing 116.3 kW of generating capacity. The FSEC has also partnered with the Virgin Islands Energy Office to install 15 systems spread between St. Croix, St. John, and St. Thomas. Wind The overall Southeast region is not considered an ideal area for wind-powered generation due to the low average wind speeds. There is a 1.8 MW wind installation in Tennessee located in one of the few locations where wind speeds are high enough to support a wind turbine. These areas are usually isolated sites in the mountains of Tennessee and North Carolina. The isolation of high wind areas is one of the largest barriers inhibiting growth since access roads would have to be built in order to get turbines installed on many of the mountain peaks. One area where wind-powered generation may have potential in the Southeast region is in Puerto Rico. The USDOE and the government of Puerto Rico have joined in financing a wind demonstration project in Culebra, PR. The installation provides up to 500 kW of electricity for use at a water desalinization plant. Biomass The use of biomass fuels is growing rapidly in the south and is being widely promoted by state energy offices and other energy research centers. The North Carolina State University Animal and Poultry Waste Management Center heads the state’s research efforts to use hog
Distributed Generation Opportunities in the Southeast
Energy and Environmental Analysis, Inc. 15
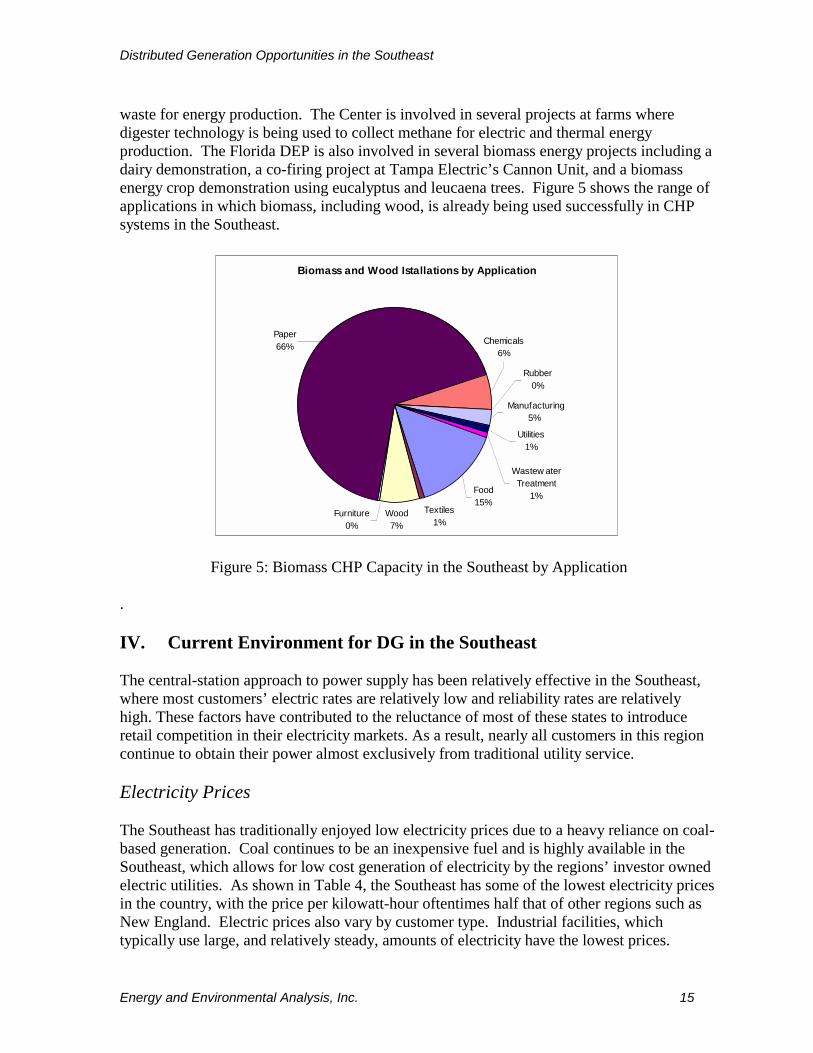
waste for energy production. The Center is involved in several projects at farms where digester technology is being used to collect methane for electric and thermal energy production. The Florida DEP is also involved in several biomass energy projects including a dairy demonstration, a co-firing project at Tampa Electric’s Cannon Unit, and a biomass energy crop demonstration using eucalyptus and leucaena trees. Figure 5 shows the range of applications in which biomass, including wood, is already being used successfully in CHP systems in the Southeast.
Biomass and Wood Istallations by Application
Textiles1%
Furniture0%
Wood7%
Food15%
Wastew ater Treatment
1%
Utilities1%
Manufacturing5%
Paper66%
Rubber0%
Chemicals6%
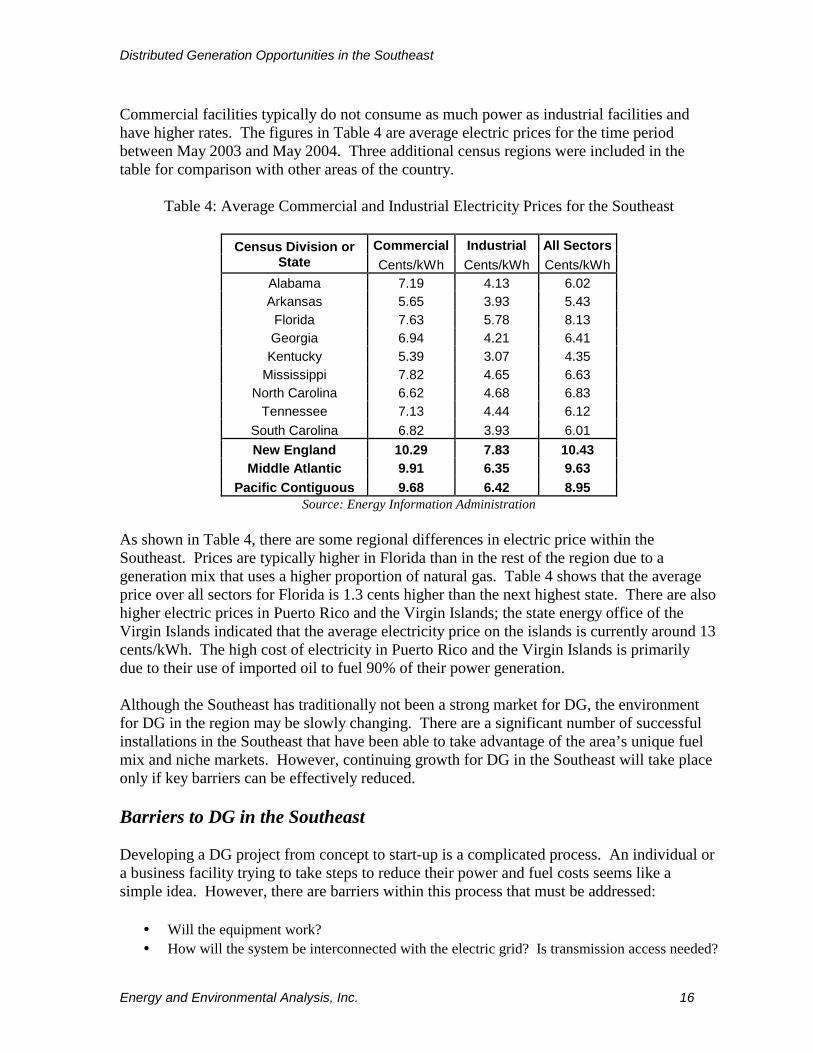
Figure 5: Biomass CHP Capacity in the Southeast by Application . IV. Current Environment for DG in the Southeast The central-station approach to power supply has been relatively effective in the Southeast, where most customers’ electric rates are relatively low and reliability rates are relatively high. These factors have contributed to the reluctance of most of these states to introduce retail competition in their electricity markets. As a result, nearly all customers in this region continue to obtain their power almost exclusively from traditional utility service. Electricity Prices The Southeast has traditionally enjoyed low electricity prices due to a heavy reliance on coal-based generation. Coal continues to be an inexpensive fuel and is highly available in the Southeast, which allows for low cost generation of electricity by the regions’ investor owned electric utilities. As shown in Table 4, the Southeast has some of the lowest electricity prices in the country, with the price per kilowatt-hour oftentimes half that of other regions such as New England. Electric prices also vary by customer type. Industrial facilities, which typically use large, and relatively steady, amounts of electricity have the lowest prices.
Distributed Generation Opportunities in the Southeast
Energy and Environmental Analysis, Inc. 16
Commercial facilities typically do not consume as much power as industrial facilities and have higher rates. The figures in Table 4 are average electric prices for the time period between May 2003 and May 2004. Three additional census regions were included in the table for comparison with other areas of the country.
Table 4: Average Commercial and Industrial Electricity Prices for the Southeast
Commercial Industrial All Sectors Census Division or State Cents/kWh Cents/kWh Cents/kWh
Alabama 7.19 4.13 6.02 Arkansas 5.65 3.93 5.43
Florida 7.63 5.78 8.13 Georgia 6.94 4.21 6.41 Kentucky 5.39 3.07 4.35
Mississippi 7.82 4.65 6.63 North Carolina 6.62 4.68 6.83
Tennessee 7.13 4.44 6.12 South Carolina 6.82 3.93 6.01 New England 10.29 7.83 10.43
Middle Atlantic 9.91 6.35 9.63 Pacific Contiguous 9.68 6.42 8.95
Source: Energy Information Administration As shown in Table 4, there are some regional differences in electric price within the Southeast. Prices are typically higher in Florida than in the rest of the region due to a generation mix that uses a higher proportion of natural gas. Table 4 shows that the average price over all sectors for Florida is 1.3 cents higher than the next highest state. There are also higher electric prices in Puerto Rico and the Virgin Islands; the state energy office of the Virgin Islands indicated that the average electricity price on the islands is currently around 13 cents/kWh. The high cost of electricity in Puerto Rico and the Virgin Islands is primarily due to their use of imported oil to fuel 90% of their power generation. Although the Southeast has traditionally not been a strong market for DG, the environment for DG in the region may be slowly changing. There are a significant number of successful installations in the Southeast that have been able to take advantage of the area’s unique fuel mix and niche markets. However, continuing growth for DG in the Southeast will take place only if key barriers can be effectively reduced. Barriers to DG in the Southeast Developing a DG project from concept to start-up is a complicated process. An individual or a business facility trying to take steps to reduce their power and fuel costs seems like a simple idea. However, there are barriers within this process that must be addressed:
• Will the equipment work? • How will the system be interconnected with the electric grid? Is transmission access needed?
Distributed Generation Opportunities in the Southeast
Energy and Environmental Analysis, Inc. 17
• Will changes in future power and fuel costs make this project economically obsolete? • Is a power or steam contract needed? What are the terms? • Where will the financing come from and for how much? Who will own and operate the
facility? • How will the existing electric service provider be affected and how will they react? • What are the environmental impacts and what will it cost to address them? • What about other land use issues such as water use, land use, fire and safety regulations, etc.?
Significant barriers to DG development in the Southeast are discussed in this section. These barriers include:
• Electric utility responses to CHP (back up power costs, interconnection access and costs, utility lost revenues to CHP, transmission access, wheeling and power sales agreements)
• State-level electric industry restructuring (utility control of resource decisions) • Natural gas availability and pricing • CHP facility siting • Environmental compliance • Technology uncertainty • Market-related barriers (commitments required by industry, availability of financing, credit
issues, lack of awareness)
In this context, a barrier is defined as a condition that keeps “the DG market” from reaching an economic equilibrium, such as lack of knowledge, exercise of monopoly power, imperfections in measurement that lead to uneconomic application of controls, and the like. If the cost of power is too low and the cost of fuel too high to make a particular project economic, then that certainly has a direct determination on the ultimate demand for DG in the Southeast. However, in this discussion the spark-spread is considered a factor in overall economic determination for DG and not a removable barrier to market penetration.
Electric Utility Responses to DG A DG project generally requires continued interaction with the local electric distribution utility to provide interconnection to the power grid, standby service, and supplementary service. Other services may be desired as well, such as a purchase agreement for excess power production or access to the power grid to wheel the power to another owned site or for a third-party purchase. For the past 25 years, there have been federal requirements under the Public Utilities and Regulatory Policies Act of 1978 (PURPA) that require certain levels of cooperation from utilities toward qualifying CHP facilities. The success of PURPA in eliminating utility imposed barriers to CHP implementation has been mixed. While certainly stimulating the market growth for CHP that has occurred in the last 20 years, the requirements of PURPA have fallen far short of creating an environment in which CHP competes equally with other utility and non-utility power options. In a restructured electric power industry, the value of on-site generation to the generating customer, the utility, and the ratepayer in general needs to be re-examined so that pricing and operating rules fairly reflect the benefits of on-site generation.
Distributed Generation Opportunities in the Southeast
Energy and Environmental Analysis, Inc. 18
Grid Interconnection
The optimal economic use of DG for most customers requires integration with the utility grid for back-up, supplemental power needs, and, in selected cases, for selling generated power. Key to the ultimate market success of small on-site generation is the ability to safely, reliably, and economically interconnect with the utility grid system. However, grid interconnection requirements for self-generators, as they exist today, are a significant barrier to more widespread economic deployment of smaller DG systems. Interconnect requirements for on-site generation have an important function. They ensure that the safety and reliability of the electric grid is protected, and the utilities have ultimate responsibility for system safety and reliability. For the utilities, there are three primary issues. First, the safety of the line personnel must be maintained at all times. Utilities must be assured that DG and other on-site generation facilities cannot feed power to a line that has been taken out of service for maintenance or as the result of damage. Second, the safety of the equipment must not be compromised. This directly implies that an on-site system failure must not result in damage to the utility system to which it is connected or to other customers. And third, the reliability of the distribution system must not be compromised. These basic concerns are important and legitimate. However, non-standardized, out-dated, and in some cases, overly stringent interconnect requirements have long been a barrier to widespread deployment of small on-site generation technologies. Interconnect requirements vary by state and/or utility and are often not based on state-of-the-art technology or data. Compliance often requires custom engineering and lengthy negotiations that add cost and time to system installation. These requirements can be especially burdensome to smaller systems (i.e., under 500 kW). Non-standardized requirements also make it difficult for equipment manufacturers to design and produce modular packages. The lack of uniformity from state to state, as well as from utility to utility within a given state, lessen the economic payback for on-site generation, no matter the market segment or type of end-use application. A national interconnection model standard – P1547 – developed by the Institute of Electric and Electronics Engineers (IEEE) is intended to provide a uniform standard for interconnection of distributed resources with electric power systems.6 Adoption of P1547 at the state level would help to minimize project costs associated with unnecessary hardware or inspections, as well as the cost of project delay.
Standby/Back-up Charges
On-site generation usually requires back-up power to cover downtime for routine system maintenance or for unplanned outages. Standby rates are a fixed monthly charge for reserved generation and distribution capacity to provide back-up power. Generally, standby service is billed, based on the rated capacity of the self-generation unit, or customer peak demand, whichever is lower. Should a customer actually require back-up power, additional charges are invoked that reflects the cost of supplying power to a self-generation customer during an outage. These back-up charges often contain an additional demand charge. These charges as 6 http://grouper.ieee.org/groups/scc21/1547/
Distributed Generation Opportunities in the Southeast
Energy and Environmental Analysis, Inc. 19
currently configured may not necessarily reflect a utility’s actual cost, nor do they necessarily reflect the diversity of DG resources on the system. A fair calculation of the true costs of these services and competitive means for supplying them are essential to ensure the economic implementation of on-site generation. However, state regulators struggling with the larger issues of restructuring are in general unaware of the importance of standby fees and back up charges on the economic viability of on-site generation. Education and outreach are needed to bring this issue to the forefront in rate discussions. Alternative approaches such as designing standby fees based on the statistical probability that some level of on-site generation on a system will be operable even if individual units are down need to be evaluated and promoted. Similarly, unreasonable performance requirements on customer-owned units can easily negate the customer value of distributed generation and must be avoided.
Electric Industry Restructuring As mentioned earlier, states in the Southeast have been reluctant to introduce retail competition through restructuring. The goal of this restructuring is to allow competitive forces to drive the generation of power. The competition is fostered by an open-access transmission system for power delivery and a separation of generation, transmission, and distribution functions. It was believed that this competition would bring lower cost power to a greater percentage of power users. In fact, restructuring did provide a mechanism in which the benefits of competition could flow through to customers. However, as experience in California and other regions has shown, bringing competition into the power industry brought with it a host of other problems including price volatility, degradation of system reliability, and financial insolvency for some of the nation’s largest utilities. The negative repercussions in California and other areas resulting from the imperfect attempts to provide a fair competitive environment for power have slowed restructuring initiatives in many states including the Southeast. As a low-cost-power region, there was never the motivation that there was in the high-cost regions. Table 5 shows where each state in the Southeast is in the process of restructuring. Movement toward a competitive wholesale power market continues nationally, affecting all regions including the Southeast.

Distributed Generation Opportunities in the Southeast
Energy and Environmental Analysis, Inc. 20
Table 5: Restructuring Status of Southeastern States
Completed studies investigating restructuring investor-owned
utilities. Decided not to pursue further action.
Continuing to study restructuring investor-owned
utilities. Not currently pursuing further action.
Passed legislation repealing the
restructuring process.
Alabama Arkansas X Florida X Georgia X
Kentucky X Mississippi X
North Carolina X Tennessee X
South Carolina X
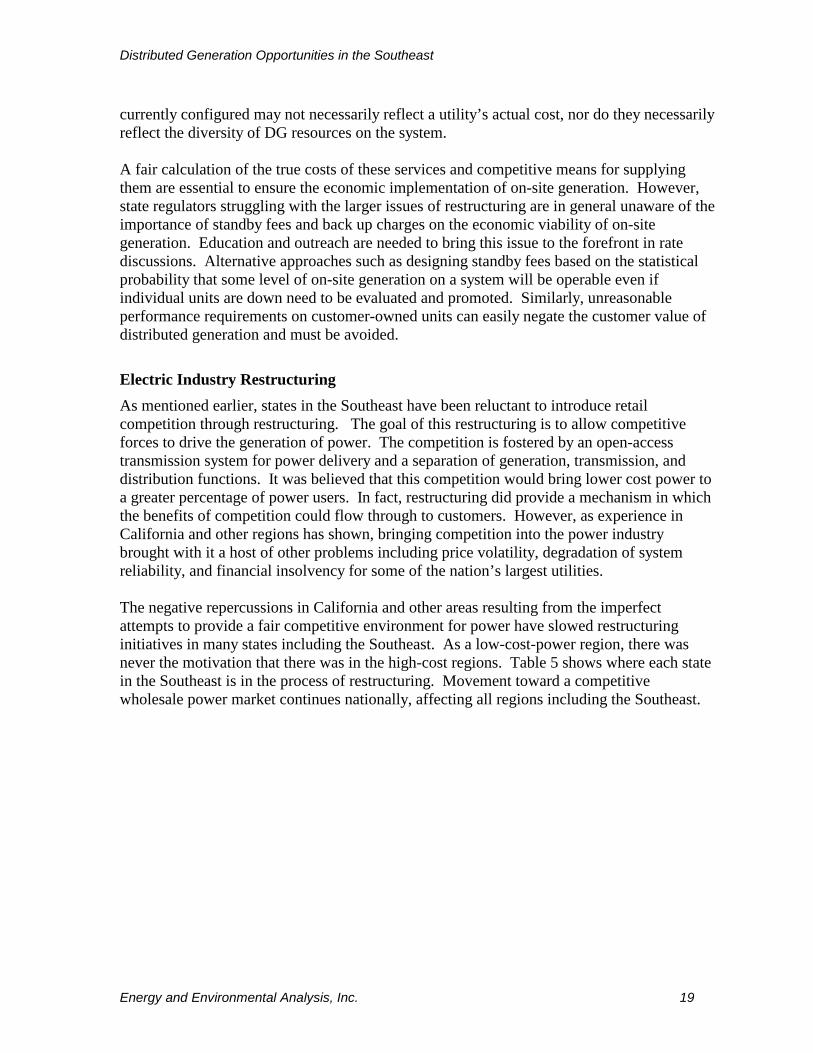
Fuel Availability and Price Natural gas is widely available throughout the Southeast and can easily be used to fuel distributed generation equipment. However, natural gas prices are currently high compared to historical trends and subject to increasing volatility. Most analysts predict that prices and volatility will remain high for the foreseeable future. Figure 6 is DOE’s projection for natural gas prices in the Southeast based on the 2004 Annual Energy Outlook published by the Energy Information Administration. While the projection shows prices moderating in 2006 and beyond from the very high prices of 2004, the long range price projection is still higher than historic gas prices in the Southeast. Other industry projections, including EEA’s, estimate future gas prices in the region to be slightly higher than EIA’s projections. High gas prices, coupled with low regional electricity prices, have further dampened the market for gas-fired DG in the Southeast. Even though efficiency is more critical in times of increased energy prices, the region’s relatively low electric prices make many DG and CHP applications uneconomic.
Distributed Generation Opportunities in the Southeast
Energy and Environmental Analysis, Inc. 21
Source: Energy Information Administration, “2004 Annual Energy Outlook”
Figure 6: Projected Natural Gas Prices in the Southeast
With gas prices high, other fuels are being looked at closely especially opportunity fuels such as biomass, including wood and agricultural wastes. Biomass fuels are highly available in the Southeast in the form of urban wood wastes, mill wastes, forest/agricultural residues, and energy crops. The prevalence of biomass materials in the Southeast has already led the region to generate a high percentage of its existing DG and CHP power from biomass compared to other regions of the country. Since biomass often comes in the form of waste the fuel price is generally low or nonexistent. Several different biomass fuel energy-production technologies are being promoted for their ability to solve the waste-stream problems presented by the agricultural/forestry industries and other business activities in the Southeast. Industrial and agricultural sites can profit by using biomass to fuel power generation equipment rather than merely disposing of it. Figure 7 shows the types and prominence of biomass resources throughout the U.S. and it can be seen that the Southeast has a significant biomass resource base.
0
1
2
3
4
5
6
7
8
9
10
2002
2004
2006
2008
2010
2012
2014
2016
2018
2020
CommercialIndustrialElectric Generators$/
MM
Btu
0
1
2
3
4
5
6
7
8
9
10
2002
2004
2006
2008
2010
2012
2014
2016
2018
2020
CommercialIndustrialElectric Generators$/
MM
Btu

Distributed Generation Opportunities in the Southeast
Energy and Environmental Analysis, Inc. 22
Figure 7: Biomass Resources Throughout the United States
Facility Siting Siting of major power generation facilities has become increasingly difficult. Not-in-my-backyard (NIMBY) is a prevalent attitude. Facilities must address air quality, water quality, water usage, land use, noise, traffic, and economic issues. In order to ensure consistency in the achievement of federal and state regulations and desired social goals, many states have taken the authority away from local government agencies and brought the siting and permitting process for large scale projects under state control. These state-level siting processes were designed to address the large-scale power systems of the regulated power industry. In many states, there are minimum sizes for which state control is taken. For example, in California any power generation facility above 50 MW needs approval be the California Energy Commission. In Oregon, the threshold is 25 MW. A large share of the potential DG market both in the Southeast and in the U.S. as a whole is below 50 MW. For projects below the state siting size threshold, local control of siting remains in force. Many local jurisdictions are ill equipped to handle facility siting. Lack of experience with DG and CHP technologies has led many local permitting agencies to exercise an extreme form of caution and conservatism that makes it difficult for projects to be approved. Contentious, lengthy siting processes have significant economic impact on a project.
Environmental Compliance Environmental permitting is a part of facility siting, but at the same time, it is a different process, reporting to different local, state, and federal agencies. Air permitting requirements
Source: NREL
Distributed Generation Opportunities in the Southeast
Energy and Environmental Analysis, Inc. 23
vary according to the technology and fuel used (and thus emissions produced) as well as location (and thus air quality designation for regulatory purposes). Some DG projects, due to their emissions and/or local air quality rules, can face costly and time-consuming permitting processes to obtain required construction and/or operating permits. The time and analysis required for compliance can delay projects and add to the cost. This is a controversial issue throughout the nation, given the range of technologies, fuels and applications of DG. Nonetheless, efforts are underway to establish model rules and procedures for evaluating and regulating the air quality impacts of DG systems. States that wish to encourage investment in DG systems are examining the ways in which their air quality regulatory systems affect DG development. One approach gaining acceptance is output-based emissions standards. There is growing recognition among the regulatory community nationwide that efficiency is a near-term, cost effective approach to emissions control. The adoption of output-based emissions standards and approaches at the state level will specifically encourage DG applications such as CHP that can demonstrate efficiency benefits.
Market Issues
Financial Barriers
Tax policies can significantly affect the economics of investing in new equipment such as distributed generation. On-site and distributed generation systems do not fall into a specific tax depreciation category. On-site generation equipment can qualify for one of several categories depending on configuration and ownership, so that the resulting depreciation period can range from 5 to 39 years. Existing depreciation policies may foreclose certain ownership arrangements for on-site generation, increasing the difficulty of raising capital and discouraging development. The distributed generation community believes that a 5- to 7-year depreciation schedule more accurately reflects the economic life of on-site generation equipment, and the Administration has recognized the negative impact current policy can have on the development of the market. The Department of Energy (DOE) and Environmental Protection Agency (EPA) have been working with the Administration and the Department of Treasury to review existing depreciation categories for on-site generation equipment and to consider investment tax credits for CHP. Treasury is considering allowing on-site equipment in buildings to qualify for a 15-year depreciation schedule, similar to on-site generation equipment in industrial applications and significantly shorter than the current 25- to 39-year depreciation schedules for building applications.
Customer Needs and Perceptions
While interest in distributed and on-site generation has grown, a number of market-related barriers exist that constrain market acceptance:

Distributed Generation Opportunities in the Southeast
Energy and Environmental Analysis, Inc. 24
• On-site generation is still not considered part of most users’ core business and, as such, is often subject to higher investment hurdle rates than competing internal options.
• Small-distributed generation technologies, in particular microturbines, have improved significantly since the early 1990s and are gaining greater market acceptance. Most users, however, remain unaware of the cost and performance benefits that may be available.
• Customer requirements and needs are yet to be fully analyzed and understood by equipment manufacturers and developers.
The criteria for a customer to implement on-site generation or any energy management strategy are complex and becoming even more complicated as the industry evolves. Very large energy using facilities typically have engineering, marketing, and legal staff devoted solely to energy procurement and energy facility management. For smaller industrial and commercial customers, however, this capability generally does not exist in-house. Businesses may not want to devote their capital and staff resources to an area like owning and operating a DG or CHP facility. Concerns about technology performance, future costs, maintenance issues, noise, and the need to revise environmental operating permits create a difficult environment for DG. Energy service companies help to bridge this gap, but must first overcome the initial resistance of businesses and financial institutions to complicated and “unproven” technology. Consumer education programs and successful technology/application demonstration programs can reduce the general resistance to DG. However, beyond this activity, it will be important to eliminate barriers to streamline the process of siting, permitting, interconnecting, financing, and contracting for DG facilities. Institutional Issues As outlined above, regulatory barriers such as air permitting requirements, and technical barriers such as interconnection standards can represent significant hurdles in the development of DG. There are also a variety of perceived risks by customers and utilities that become barriers to DG development. These perceived risks include DG being uneconomical, capital investment risk in the midst of an uncertain market, fuel price volatility, utilities’ fear of losing revenue and reliability, and cost risks associated with unconventional technologies. At the “Distributed Energy Resources in the Southern Region” workshop in Biloxi, Mississippi, energy and environmental professionals from across the southern region voted on the three largest barriers to DG in the south. The three key barriers were identified as:
• Utilities’ perceived risk of losing revenues due to DG projects, • Customers’ perceived risk of investing in DG in the midst of uncertainty in power
markets and the economy, and • The perceived risk of DG as uneconomical.
Distributed Generation Opportunities in the Southeast
Energy and Environmental Analysis, Inc. 25
The most critical barrier identified by the group is the negative perception of DG by investor owned utilities, which is due to the utilities’ perceived risk of losing revenues when customers install DG. Since utilities usually plan their systems to meet all of the power needs of their customers, they do not encourage the development of DG in their service territory. Utilities are concerned about losing captive load when customers install DG systems on-site, causing them to lose revenue. In attempts to inhibit development of DG, utilities may actively oppose projects or offer customers lower rates or incentives not to install DG. Customers that consider installing DG systems often feel that investing in DG is risky because of uncertainty in the power market. In recent years, there has been increasing volatility in energy prices and regulatory actions that has caused customers to exercise greater caution in making capital investments. These concerns have been coupled with the slow growth of the economy in general and have caused customers in the Southeast and other regions to delay development of DG. Many customers do not realize that DG can be used to reduce market risk and uncertainty. Customers who are not familiar with successful DG systems frequently perceive DG projects as being uneconomical. DG projects are commonly thought to involve complex technologies on an experimental or demonstration basis. Since the Southeast is dominated by conventional methods of power supply, the thought that unconventional DG systems are uneconomical or unreliable is a common misconception. V. Factors Influencing the Outlook for DG in Southeast Development of DG has been slow in the Southeast except for CHP applications in a number of power intensive industries. In many regions of the south where DG could offer benefits to both the user and the grid, the market and regulatory barriers outlined above often block projects. However, many good opportunities exist in the region, and a number of evolving factors may change the outlook for future DG development.
Electric Reliability is a Growing Customer Concern Power quality and reliability are increasing in importance throughout the U.S. as businesses become more dependent on power for communications and operation, as well as the growing use of power sensitive equipment. In many industries power reliability is a key factor in remaining profitable. Industries and individual facilities vary widely in the costs imposed by power quality problems. Measured in terms of costs per kVa per event, costs range from $3-$8 per kVa for the textile industry to $80-$120 per event for sensitive process industries. An hour’s downtime can cost a cellular communications facility $41,000 per hour; a brokerage house would experience several million in damages if it were shut down for an hour. These costs can include:
• Damaged plant equipment • Spoiled or off spec product
Distributed Generation Opportunities in the Southeast
Energy and Environmental Analysis, Inc. 26
• Extra maintenance costs • Cost for repair of failed components • Loss of revenue due to downtime that cannot be made up. • Additional labor costs.
Those customers who cannot afford to be without power for more than a brief period usually have on-site standby generators that can pick up all or a part of their load. There are also customers for which any disruption at all, either in loss of power or variation of power quality, can lead to severe economic loss. These customers generally require uninterruptible power supply (UPS) systems along with associated power control and conditioning equipment to correct surges, sags, harmonics, and noise. Electric reliability for the most part has historically been acceptable in the Southeast due to a steady supply from central station utility power plants and a well developed T&D infrastructure. However, reliability concerns are growing with both industrial and commercial users in the region. Outages from ice storms and hurricanes are not uncommon in the Southeast, and DG can play an important role in minimizing the impact of these events on business operations. Reliability concerns have always been much greater in Puerto Rico and the Virgin Islands where a single utility operates the power system in each location. On these islands the electric grid equates to little more than a loop around the island, which causes it to be highly susceptible to damage that leads to outages. Due to the common occurrence of blackouts in the Virgin Islands, backup generators have become very prevalent. Many hotels and businesses even advertise their backup systems to assure customers that they will not be affected by frequent grid outages. There are a number of ways to utilize an active DG system (i.e., a DG system designed to run for extended hours to provide peaking or baseload generation) in supporting a customer’s power quality and reliability needs. In such cases, the value of distributed generation can be increased by configuring the DG installation to provide emergency power services. Integration of a backup function can reduce the capital costs for peak shaving or CHP installations due to the avoidance of the investment in a diesel standby generator. For a simple, peak shaving system, the incremental investment for providing an environmentally acceptable gas-fired generator in place of the diesel standby unit is little more than half of what it would be in a straight peak shaving project. For a more complicated CHP system, the avoided cost of a diesel generator can reduce capital costs by up to 40%. In addition to this capital cost benefit, a CHP system operating continuously provides a greater level of protection for the customer against external voltage sags and other momentary disruptions. The CHP system essentially serves as the primary feed for the user, with the grid supplying a second feed.
Increase in Gas-Fired Central Station Generation and Escalating Coal Prices in the Southeast will Increase Electricity Prices over the Longer Term Increasing reliance on natural gas for central station generation and rising coal prices will likely exert upward pressure on future electricity prices in the Southeast. Most states in the region will be expanding their power generation assets in the coming decade to meet growing

Distributed Generation Opportunities in the Southeast
Energy and Environmental Analysis, Inc. 27
demand. Much of this new capacity planned throughout the region is projected to use natural gas. The Annual Energy Outlook 2004 published by DOE’s Energy Information Administration projects that natural gas generation in the Southeast region will increase from less than 10% of the region’s total generation in 2005 to over 17% in 2015 and 2020 (Figure 8). The forecast shows natural gas generation increasing from 83 billion kilowatt-hours in 2005 to 195 billion kilowatt-hours in 2020, a 135% increase. The high percentage of new gas-fired generation is being fueled by high efficiency technology, environmental concerns and by the short construction time for these types of plants, even with the outlook for higher gas prices. Increased reliance on natural gas for new generation will result in escalating electricity prices in many areas of the Southeast. Source: DOE Energy Information Administration, “2004 Annual Energy Outlook”
Figure 8: Electricity Generation in the Southeast Florida, in particular, will become much more dependent on gas generation. In the North American Electric Reliability Council’s (NERC) 2004 Long Term Reliability Assessment, the generating mix in Florida is projected to increase its reliance on natural gas from about 25% in 1999 to almost 50% in 2009. Similarly, the Florida Reliability Coordinating Council (FRCC) projects that of the anticipated 16,985 MW net addition to generating capacity in Florida planned over the next decade, 12,829 MW will be gas-fired in either simple or combined cycle configurations. Escalating coal prices are also likely to have an effect on future electricity rates. EIA estimates that 55% of the region’s power will be supplied by coal in 2005. Coal prices have risen dramatically in 2004, particularly in the East. As shown in Figure 9, average spot prices in November 2004 are at record highs for both Illinois Basin ($35 per ton) and Appalachian coal ($66.50 per ton for Central Appalachia and $58.25 for Northern
0
200
400
600
800
1000
1200
2005 2010 2015 2020
OtherNatural GasCoalNuclear
Gen
erat
ion,
bill
ion
kWhs
0
200
400
600
800
1000
1200
2005 2010 2015 2020
OtherNatural GasCoalNuclear
Gen
erat
ion,
bill
ion
kWhs

Distributed Generation Opportunities in the Southeast
Energy and Environmental Analysis, Inc. 28
Appalachia)7. While the immediate impact of higher coal prices will be tempered because of existing long term supply contracts, new contracts will reflect higher prices and will most likely contain reopener provisions tied to future coal market prices and operator cost factors.
Source: DOE Energy Information Administration, “Coal News and Markets”
Figure 9: Coal Commodity Spot Prices
Growing REC/Municipal Utility Interest in DG Electric cooperatives are private, independent electric utilities that are owned by the consumers they serve. Generation and transmission cooperatives generate and transmit electricity to their member distribution co-ops and the locally owned distribution co-ops deliver electricity to the customer. Currently there are 865 distribution and 65 generation/transmission co-ops in the U.S. serving 37 million people in 80 percent of the country’s 3,100 counties. Electric cooperatives currently operate some of the nation’s lowest polluting generating facilities, and they continue to explore new technologies to reduce emissions. Many electric cooperatives are very receptive to DG technologies as an alternative form of generation that can promise economic and environmental benefits, especially in rural areas. 7 U.S DOE Energy Information Administration, “Coal News and Markets”, www.eia.doe.gov/cneaf/coal/coalnews/coalmar.html.

Distributed Generation Opportunities in the Southeast
Energy and Environmental Analysis, Inc. 29
Municipal electric utilities are publicly owned entities that provide electricity to local customers. The choice to provide this service is made by a city or town, so communities choose to purchase or construct their own electric distribution systems in order to locally control the delivery and cost of electricity for their citizens. Multiple municipal utilities in a state or a given region often are a part of a municipal authority that either generates and transmits, or purchases electricity to provide for its member distribution municipals. Since municipal utilities are run to provide for the public good they are not as concerned with risks of losing profit to DG equipment like investor-owned utilities. Therefore, municipal utilities are often more open to innovative DG technologies and tend to be more receptive to customers using DG to save on energy bills. Both utility types are showing increasing interest in DG and CHP as both a customer retention tool and as a tool to moderate their own generation and/or power costs, and represent potential partners for DG activities in the region. Appendices A and B contain a list of co-ops and municipal utilities in the Southeast that currently have relatively high commercial and industrial power prices and significant numbers of commercial and industrial customers in their service areas.
Increased Interest in Opportunity Fuels Interest in opportunity fuels is growing rapidly in the Southeast, which is evidenced by the increasing number of public and private research groups focused on the use of alternative fuels. The southeast region of the U.S. is currently the national leader in the production and use of biomass energy. This is due to good climate conditions, relatively low land costs, tax designs, existing forest product industries, and aggressive state biomass development programs. Many southern states have programs that offer incentives for renewable energy technologies that include wood and biomass projects. These types of projects already provide a significant share of CHP electric capacity in the Southeast. In spite of this existing development, there remains a large biomass potential in the region. There are a number of organizations that are focusing on the dev elopement of this market: • The mission of the Southern States Energy Board (SSEB) is to enhance the quality of life
in the south through energy and environmental programs. The SSEB promotes policies and programs that encourage sustainable development and has been very involved in supporting DG opportunities in the south. The Southern States Biobased Alliance was formed in 2001 and works in an advisory role to the SSEB about the development of biomass projects in the region. The Alliance’s work to increase the use of biomass has helped to generate new income for farmers, create employment opportunities in rural communities, and reduce greenhouse gas emissions. The Alliance also monitors legislation in the southern states that will increase the use of biomass energy so that it can make recommendations to the SSEB. The SSEB is also the host organization of the Southeastern Regional Biomass Energy Program that encourages public/private partnerships to demonstrate biomass technologies in the region through the use of grants.

Distributed Generation Opportunities in the Southeast
Energy and Environmental Analysis, Inc. 30
• The Alabama Department of Economic and Community Affairs (ADECA) runs the Renewable Fuels Interest Subsidy Program to assist businesses installing biomass systems. The program is primarily focused on wood based applications although it is open to non-wood industry applicants, and is targeted at industrial, commercial, institutional, and agricultural entities. Feasibility studies and technical assistance may be provided through the program, which gives up to $75,000 in interest subsidy payments to help pay the interest on loans to install biomass projects. The program has also recently started to expand into switch-grass, municipal solid waste, and landfill gas projects.
• The state of Mississippi has made a large effort to promote biomass energy production in
the state. According the Mississippi Development Authority, biomass (including wood and MSW) is estimated to contribute 7.1% of Mississippi’s total energy consumption, which is about twice the national average8. The Mississippi Biomass Council acts as a catalyst for increased biomass development in the state by hosting workshops on biomass topics and conducting technical assessments of demonstration projects. The council has recognized the opportunities that biomass has for benefiting the local economy by keeping energy dollars in the state and providing jobs in rural areas. Utilities have also started to investigate biomass fuels due to their lack of sulfur, which can be co-fired with coal and other fossil fuels to reduce sulfur emissions and therefore the need for costly emission control devices.
• Methane from animal or landfill sources is beginning to be a widely utilized form of
biomass. The North Carolina State University Animal and Poultry Waste Management Center heads the state research effort to address hog waste problems. The center evaluates technologies for use on hog farms that would reduce methane emissions by using waste methane to generate energy instead of releasing it to the atmosphere. The Florida Department of Environmental Protection is also involved in supporting a methane demonstration project at a dairy that uses an anaerobic digester to simultaneously treat wastewater and produce methane for power generation. The North Carolina State Energy Office is involved in the promotion of landfill gas projects along with several other associations that are hosting a landfill gas conference. The conference is focused on developing the business opportunities that exist for converting landfill gas to energy.
Increasing Recognition on a National Basis of the Effectiveness of Output-Based Emissions Standards There are several different approaches to the format of air emissions including: input-based, concentration, and output-based methods. Historically, electric generators and boilers have been regulated based on heat input (lb/MMBtu heat input) or the mass concentration of substances in the exhaust stream (ppm). Input-based regulations set emissions limits based on the amount of heat input that is supplied to a source. Therefore, a source is allowed to emit a certain amount of pollutants based on how much fuel is combusted. The emissions are usually measured in pounds of pollutant emitted per MMBtu of heat input from the fuel.
8 http://www.mississippi.org/programs/energy/renw_alt_energy.htm

Distributed Generation Opportunities in the Southeast
Energy and Environmental Analysis, Inc. 31
This approach does not take into account differences in efficiency between different sources, and gives no incentive to burn less fuel. Concentration approaches to emissions regulation limit the mass of pollutants that may be emitted in the exhaust stream of a source. This approach commonly measures the concentration of pollutants in parts per million (ppm) of exhaust gas. This measurement is corrected for the oxygen in the exhaust stream so that diluting the pollutants with excess air does not affect the measurement. This approach also does not give any incentive to improve efficiency or combust less fuel. Output-based environmental regulations relate the emissions of a plant to the productive output of the process (e.g., lb emission/unit of product produced). Since this method relates emissions to the output of the system, it recognizes the effect of increased efficiency for the same heat input as a method of reducing emissions. Relating emissions directly to the product gives a clear measure of the environmental impact of producing a product. For electricity generation, the most common output-based measure is lb/MWh generated. When emissions are expressed in these units, all sources can be directly compared on a consistent basis, and determining the actual tons of emissions based on a given level of generation is relatively simple. Although output-based regulation may seem like a new concept, it has been used for some time in many regulatory applications. For example, reciprocating engines are typically regulated in g/bhp-hr, which measures the emissions per unit of mechanical output. Many industrial processes have similar output-based measures, such as lb emission/ton of glass or metal melted or lb emission/ton of cement clinker produced. The automotive emission standards in grams/mile are another form of output-based standard. Output-based regulations produce benefits for the environment, and the regulated community. For plant operators, output-based regulations reduce compliance costs by providing opportunities for more flexible and cost-effective control strategies. For the environment, output-based formats encourage pollution prevention, create multi-pollutant emission reductions and provide more certainty in achieving these reductions. Also, because output-based formats reward and encourage energy efficiency, they promote reduced consumption of fossil fuels.
The increased interest in output-based regulation evolved in the mid 1990s. During this period, air regulators were facing increasing challenges in reaching progressively more stringent Clean Air Act goals. To achieve these goals, states were developing new emission reduction programs that sometimes targeted sizes and types of sources that had not been regulated in the past. Against this backdrop, output-based standards evolved as a way to provide flexibility to sources in achieving emission reductions at the lowest cost. Pollution prevention has focused more attention on energy efficiency as a means of emission control. As these interests converged, policymakers, vendors of high efficiency technologies, and proponents of pollution prevention started to promote the use of output-based regulation as a way to encourage energy efficiency as an emission control strategy. By the mid 1990s,
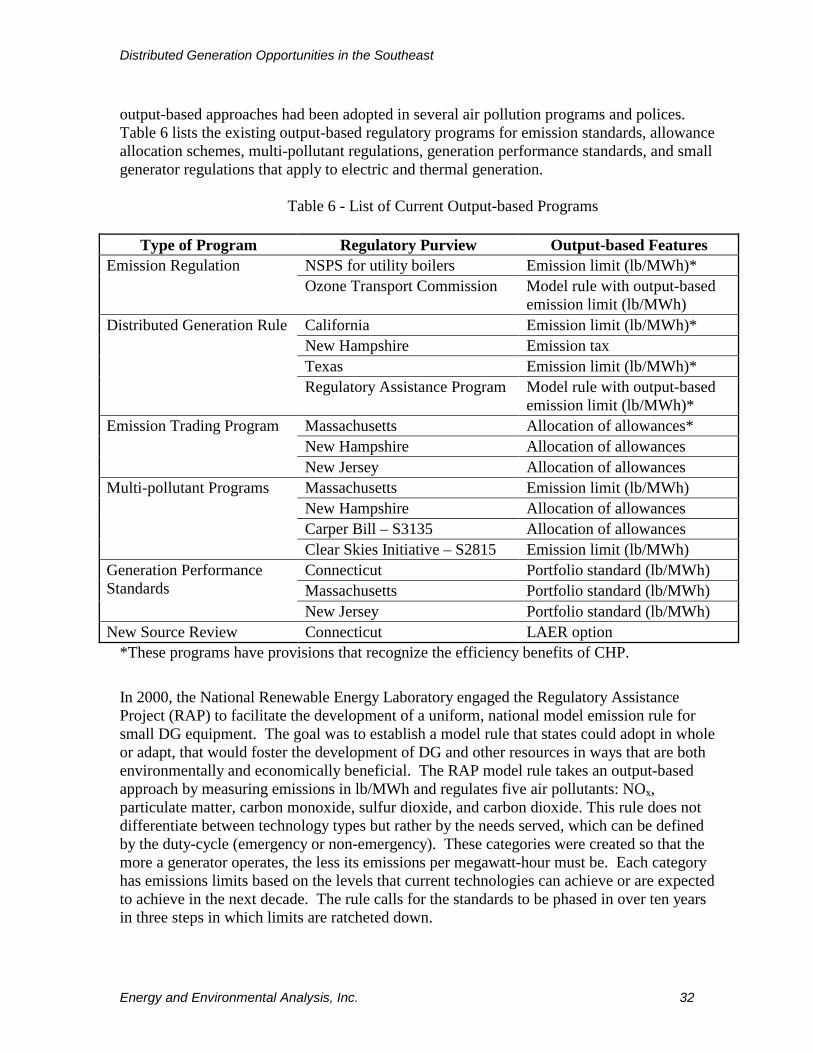
Distributed Generation Opportunities in the Southeast
Energy and Environmental Analysis, Inc. 32
output-based approaches had been adopted in several air pollution programs and polices. Table 6 lists the existing output-based regulatory programs for emission standards, allowance allocation schemes, multi-pollutant regulations, generation performance standards, and small generator regulations that apply to electric and thermal generation.
Table 6 - List of Current Output-based Programs
Type of Program Regulatory Purview Output-based Features
NSPS for utility boilers Emission limit (lb/MWh)* Emission Regulation Ozone Transport Commission Model rule with output-based
emission limit (lb/MWh) California Emission limit (lb/MWh)*
New Hampshire Emission tax Texas Emission limit (lb/MWh)*
Distributed Generation Rule
Regulatory Assistance Program Model rule with output-based emission limit (lb/MWh)*
Massachusetts Allocation of allowances*
New Hampshire Allocation of allowances Emission Trading Program
New Jersey Allocation of allowances Massachusetts Emission limit (lb/MWh) New Hampshire Allocation of allowances Carper Bill – S3135 Allocation of allowances
Multi-pollutant Programs
Clear Skies Initiative – S2815 Emission limit (lb/MWh) Connecticut Portfolio standard (lb/MWh) Massachusetts Portfolio standard (lb/MWh)
Generation Performance Standards
New Jersey Portfolio standard (lb/MWh) New Source Review Connecticut LAER option
*These programs have provisions that recognize the efficiency benefits of CHP.
In 2000, the National Renewable Energy Laboratory engaged the Regulatory Assistance Project (RAP) to facilitate the development of a uniform, national model emission rule for small DG equipment. The goal was to establish a model rule that states could adopt in whole or adapt, that would foster the development of DG and other resources in ways that are both environmentally and economically beneficial. The RAP model rule takes an output-based approach by measuring emissions in lb/MWh and regulates five air pollutants: NOx, particulate matter, carbon monoxide, sulfur dioxide, and carbon dioxide. This rule does not differentiate between technology types but rather by the needs served, which can be defined by the duty-cycle (emergency or non-emergency). These categories were created so that the more a generator operates, the less its emissions per megawatt-hour must be. Each category has emissions limits based on the levels that current technologies can achieve or are expected to achieve in the next decade. The rule calls for the standards to be phased in over ten years in three steps in which limits are ratcheted down.

Distributed Generation Opportunities in the Southeast
Energy and Environmental Analysis, Inc. 33
The RAP model rule also recognizes the efficiency benefits of thermal energy recovered from CHP systems. Since CHP units produce both electrical and thermal output, output-based regulations need to account for the thermal output of a CHP facility in order to give proper credit for the full plant output. Recognition of thermal credit for CHP is part of the output-based approaches utilized by Texas, California, and Connecticut, as well as being included in the RAP model rule.
Development of Thermally Activated Technologies that Extend the Economic Potential for CHP Advances in thermally activated technologies such as absorption chillers, desiccant dehumidification and integrated packages promise to extend the economic application of CHP into a variety of commercial buildings and into regions of the country where space heating loads are limited. Converting building air conditioning and dehumidification electric loads to thermally based loads through the use of absorption chillers or desiccant dehumidification systems offers a number of advantages. First, the most expensive electric load, which is air conditioning during peak hours, is eliminated. Second, the remaining electric load has a better load factor, which reduces electric costs. Finally, the overall thermal load of the building increases, rendering it potentially economic to size a larger CHP system that can contribute to both winter heating and summer cooling. This approach is called an integrated energy system (IES), or building cooling, heating and power (BCHP). Buildings such as retail stores and restaurants may have seasonal heating loads that are fairly substantial, but only a limited year-round water-heating load. Limited thermal load is a factor in supermarkets as well and a general issue for developing commercial CHP in the Southeast. Such applications cannot provide adequate thermal utilization for economic CHP. While hospitals and hotels have a greater year-round thermal load than many of these other applications and have proven that they can be good CHP candidates, even in these applications, an IES can increase the effective size of the CHP installation. Absorption cooling relies on a chemical process to absorb and evaporate refrigerant rather than on the mechanical vapor compression cycle used by electric air conditioning equipment. The basic absorption cycle features two fluids, one refrigerant and one absorbent, that are separated and recombined in different stages of the cycle to produce chilled water. The absorption unit uses heat instead of an electric motor to compress refrigerant vapors to a high pressure level in the compression stage of the refrigeration cycle. The absorption chiller produces cold water that is circulated to air handlers in a building distribution system to provide air conditioning. Because the absorption process is heat-driven, absorption cooling matches well with BCHP-IES. Commercially available indirect-fired absorption machines use hot water, steam, or exhaust gases as the heat source, while direct-fired machines feature natural gas burners. In IES configurations, indirect-fired machines can be used to regenerate desiccant systems or provide hot water, while direct-fired units can use the rejected heat from onsite generation equipment or hot water from a direct-fired absorption chiller.

Distributed Generation Opportunities in the Southeast
Energy and Environmental Analysis, Inc. 34
Desiccant dehumidification systems remove moisture from the air. As the desiccant removes the moisture, the air heats up. Therefore, a desiccant system does not provide cooling per se. Instead, it converts latent heat (moisture) load to sensible heat (temperature) load. The added sensible heat is typically removed by a heat exchanger, heat wheel or heat pipe, using the building exhaust air or outside air. An electric system, evaporative cooler, or absorption system can perform post-cooling of the air downstream of the heat exchanger. The moisture absorbed by the desiccant is removed in a step called regeneration. Regeneration is accomplished by passing heated air over the desiccant bed and exhausting the hot air and moisture to the outside, at temperatures in the 200-350 °F range. Desiccant dehumidification technology is another potential match for a BCHP system because regeneration can be accomplished using a low-grade heat that is available from virtually any prime mover or from a direct-fired absorption chiller. The continuing advancements in both absorption and desiccant technologies promise to expand the economic potential for CHP and BCHP in the Southeast. U.S. DOE is supporting the development and demonstration of a number of packaged BCHP systems that optimize performance, integration, and cost.
Increasing Industry and Government Initiatives to Increase the Deployment of DG in the Southeast In addition to the state and regional initiatives identified above to promote biomass and other renewable fuels, there are an increasing number of organizations and initiatives developing to promote DG within the Southeast. These are very often public-private partnerships where users, developers, and equipment suppliers work with national and regional policymakers to identify specific regional or state barriers to DG and to work towards fair and reasonable solutions. Establishment of such initiatives in the Southeast has lagged behind other areas of the country such as the Midwest and Northeast. However, with the recent award by U.S DOE to establish a Regional CHP Application Center, there is now an opportunity to develop the necessary critical mass and stakeholder participation to enhance the profile of DG and CHP in the region and to begin to address some of the market development challenges. VI. Near-Term Opportunities to Promote DG in the Southeast The principal objective of this effort was to identify near-term actions that the Southeast Regional Office of DOE could pursue within its limited budget and staffing constraints to promote the use of cost effective, environmentally clean DG within the Southeast. Many of the following opportunities were identified by key stakeholders in the region and are focused on outreach and education activities that promote key DG benefits or address critical DG barriers. The audience for these activities varies depending on the specific opportunity, but in general the objectives are to raise the awareness of the availability and effectiveness of DG options among the user community, and to educate the region’s policymakers and regulators on the benefits of DG and the specific market, regulatory and institutional issues that constrain further development in the Southeast.

Distributed Generation Opportunities in the Southeast
Energy and Environmental Analysis, Inc. 35
Work with Electric Cooperatives, Municipal Utilities and TVA to Identify and Demonstrate DG Applications that Provide Benefits to both Users and Utilities The ultimate success of DG will require the acceptance, or at least the neutrality, of the servicing electric utility. The region’s investor owned utilities have not encouraged DG in the past nor are expected to encourage DG in the near future. Many rural electric cooperatives and municipal utilities, on the other hand, may be more open to DG both as a customer retention tool and as a potential option to address their own capacity or power purchasing needs. Examples are available in other regions of the country of CHP projects jointly owned and operated by the user and servicing municipal utility. Cooperatives and municipals in the Southeast also generally have higher electric prices than investor-owned utilities, further improving the potential for successful DG installations. These entities may be particularly interested in biomass opportunities based on available agricultural waste or municipally-owned water and sewer facilities. Initial contacts could be made through discussions with national industry organizations: National Rural Electric Cooperative Association for co-ops and the American Public Power Association for municipal utilities (see Appendix C for contact information). Similarly, there may be opportunities to partner with the TVA to ensure that biomass DG is adequately recognized in their ongoing green credits programs. Build on Existing FEMP Programs in the Southeast Regional Office to Promote the Use of DG/CHP in the Federal Sector DOE’s Southeast Regional Office (SRO) has an active and very effective program to introduce new energy-efficient and renewable energy technologies into federal facilities in the Southeast. Coordinated through the Federal Energy Management Program (FEMP), the SRO program promotes energy saving technologies and practices in the region through technology demonstrations, technical assistance and dissemination of technical information. The program helps both military and non-military agencies develop better designs for their buildings and facilities and assists them in upgrading existing facilities. As part of this effort, the SRO FEMP initiative maintains a set of critical contacts for federal facilities in the region and information on energy use and operation at these facilities. The SRO staff are looked at as a valuable resource by the facilities and trusted to provide unbiased and useful information on energy saving technologies and practices. As such, visibly incorporating DG and CHP into SRO’s FEMP portfolio would provide direct access to energy managers and decision-makers at federal facilities around the region. Promotion of biomass CHP in particular would support the SRO’s existing targets to develop biomass opportunities within the federal sector. The cooling and dehumidification aspects of Integrated Energy Systems and the power reliability enhancements that active DG/CHP systems can provide may be cost-effective options for targeted federal buildings and/or military facilities in the region. Incorporation of these technologies into SRO’s technical assistance and design tool offerings would accelerate the acceptance of DG at federal facilities in the region and help to spur development in the private sector as well.
Distributed Generation Opportunities in the Southeast
Energy and Environmental Analysis, Inc. 36
Target Niche Applications and Technologies that Address Specific Near-Term Economic or Resource Issues in the Southeast While resources are limited, the Southeast Regional Office may be able to serve as a driver and organizing entity to promote new technologies and new applications that address specific customer needs and market requirements in the Southeast. Potential initiatives could include promoting high visibility demonstrations that would verify DG/CHP performance and applicability in the Southeast. Specific near-term opportunities include: • Promote the demonstration of biomass DG systems that address specific regional
environmental issues such as farm waste in North Carolina. Such systems would build off of the region’s existing experience base with biomass and agricultural based fuels and highlight the use of DG to mitigate regional environmental concerns. Opportunities may exist to partner with interested co-ops and municipals.
• Promote the enhanced power reliability aspects of DG/CHP to applications such as hospitals and emergency response centers that require emergency power for critical systems. Opportunities also exist to promote power reliability as a competitive advantage in new office and/or industrial parks in the region. These efforts would be enhanced by quantitative data on the frequency and costs of power outages in the region.
• Specific opportunities exist to promote DG in the U.S. Virgin Islands and Puerto Rico. The islands have the highest electric prices in the region (the state energy office of the Virgin Islands indicated that the average electricity price on the islands is currently around 13 cents/kWh) and also have concerns about grid reliability. The grid on many of these islands equates to little more than a loop around the island, which causes high susceptibility to outages due to storms and accidents. Backup generators have become very prevalent in the Virgin Islands due to the common occurrence of blackouts, and many hotels and businesses advertise their backup systems to customers. Use of active DG systems such as CHP incorporating thermal cooling would enable users to provide emergency power during outages and provide cost-effective energy services during normal operation.
• Promote the demonstration of Integrated Energy Systems that incorporate thermally activated components such as absorption cooling and desiccant dehumidification. These systems fit well with the climate and thermal requirements of the Southeast and promise to expand the economic potential for CHP in the region. DOE developed technologies are now entering the demonstration and commercialization phase and the development of high visibility sites in the Southeast would benefit the region and the suppliers.
Promote the Proven Reliability and Cost Benefits of DG to Users and Policymakers While DG development in the Southeast has been slow, there are many examples of well constructed and economic DG and CHP installations fitting the needs of a variety of users. Publicizing existing success stories, or highlighting demonstrations of new technologies and applications is critical to increasing the awareness of both users and policymakers that DG
Distributed Generation Opportunities in the Southeast
Energy and Environmental Analysis, Inc. 37
and CHP are not risky technologies and that they can be successfully implemented in the region. Particular focus should be given to promoting the use of DG to enhance the reliability of an end-user’s power supplies Promote Output-based Emissions Approaches within the Region Properly designed output-based emissions standards can encourage DG development, particularly high efficiency CHP. There is a growing body of experience with DG and output based standards in other states and at the U.S. EPA that could be brought to the attention of regulators and policymakers in the Southeast. Consistent standards and approach across the region would help equipment suppliers, developers and end-users respond to the need to reduce environmental impact with flexible and cost-effective solutions tailored to their needs. Work with both Regional and National organizations to Address Regional Regulatory Issues and Policies A considerable knowledge and experience base has been developed in national and regional organizations such as the U.S. Combined Heating and Power Association, the regional CHP Initiatives and the Regional Application Centers on issues such as DG emissions standards, standby tariffs, interconnection requirements, and tax treatment. Analyses and testimony has been developed on many of these issues for state and regional proceedings in the Northeast, Midwest and California. This is a body of work and a network of contacts that can be invaluable in addressing similar issues in the Southeast. DOE’s Southeast Regional Office could serve to coordinate various Southeast initiatives with other regional and national information resources.

Distributed Generation Opportunities in the Southeast
Energy and Environmental Analysis, Inc. 38
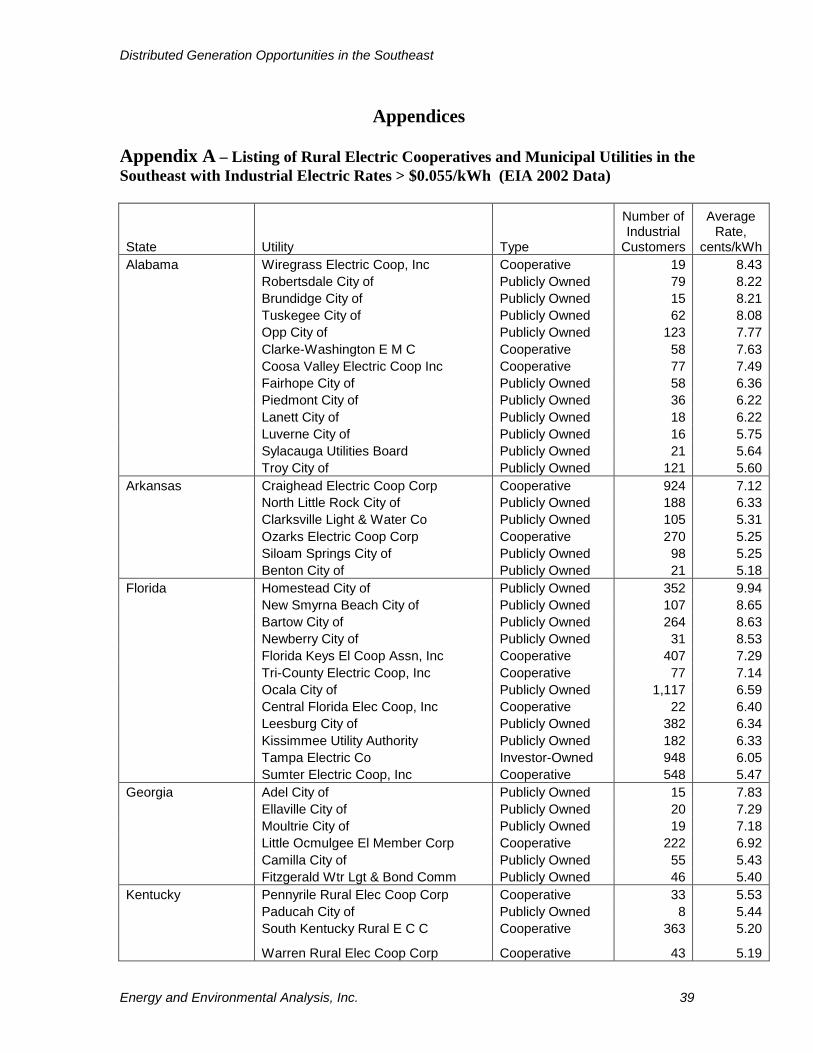
Distributed Generation Opportunities in the Southeast
Energy and Environmental Analysis, Inc. 39
Appendices Appendix A – Listing of Rural Electric Cooperatives and Municipal Utilities in the Southeast with Industrial Electric Rates > $0.055/kWh (EIA 2002 Data)
State Utility Type
Number of Industrial
Customers
Average Rate,
cents/kWhAlabama Wiregrass Electric Coop, Inc Cooperative 19 8.43 Robertsdale City of Publicly Owned 79 8.22 Brundidge City of Publicly Owned 15 8.21 Tuskegee City of Publicly Owned 62 8.08 Opp City of Publicly Owned 123 7.77 Clarke-Washington E M C Cooperative 58 7.63 Coosa Valley Electric Coop Inc Cooperative 77 7.49 Fairhope City of Publicly Owned 58 6.36 Piedmont City of Publicly Owned 36 6.22 Lanett City of Publicly Owned 18 6.22 Luverne City of Publicly Owned 16 5.75 Sylacauga Utilities Board Publicly Owned 21 5.64 Troy City of Publicly Owned 121 5.60Arkansas Craighead Electric Coop Corp Cooperative 924 7.12 North Little Rock City of Publicly Owned 188 6.33 Clarksville Light & Water Co Publicly Owned 105 5.31 Ozarks Electric Coop Corp Cooperative 270 5.25 Siloam Springs City of Publicly Owned 98 5.25 Benton City of Publicly Owned 21 5.18Florida Homestead City of Publicly Owned 352 9.94 New Smyrna Beach City of Publicly Owned 107 8.65 Bartow City of Publicly Owned 264 8.63 Newberry City of Publicly Owned 31 8.53 Florida Keys El Coop Assn, Inc Cooperative 407 7.29 Tri-County Electric Coop, Inc Cooperative 77 7.14 Ocala City of Publicly Owned 1,117 6.59 Central Florida Elec Coop, Inc Cooperative 22 6.40 Leesburg City of Publicly Owned 382 6.34 Kissimmee Utility Authority Publicly Owned 182 6.33 Tampa Electric Co Investor-Owned 948 6.05 Sumter Electric Coop, Inc Cooperative 548 5.47Georgia Adel City of Publicly Owned 15 7.83 Ellaville City of Publicly Owned 20 7.29 Moultrie City of Publicly Owned 19 7.18 Little Ocmulgee El Member Corp Cooperative 222 6.92 Camilla City of Publicly Owned 55 5.43 Fitzgerald Wtr Lgt & Bond Comm Publicly Owned 46 5.40Kentucky Pennyrile Rural Elec Coop Corp Cooperative 33 5.53 Paducah City of Publicly Owned 8 5.44 South Kentucky Rural E C C Cooperative 363 5.20
Warren Rural Elec Coop Corp Cooperative 43 5.19
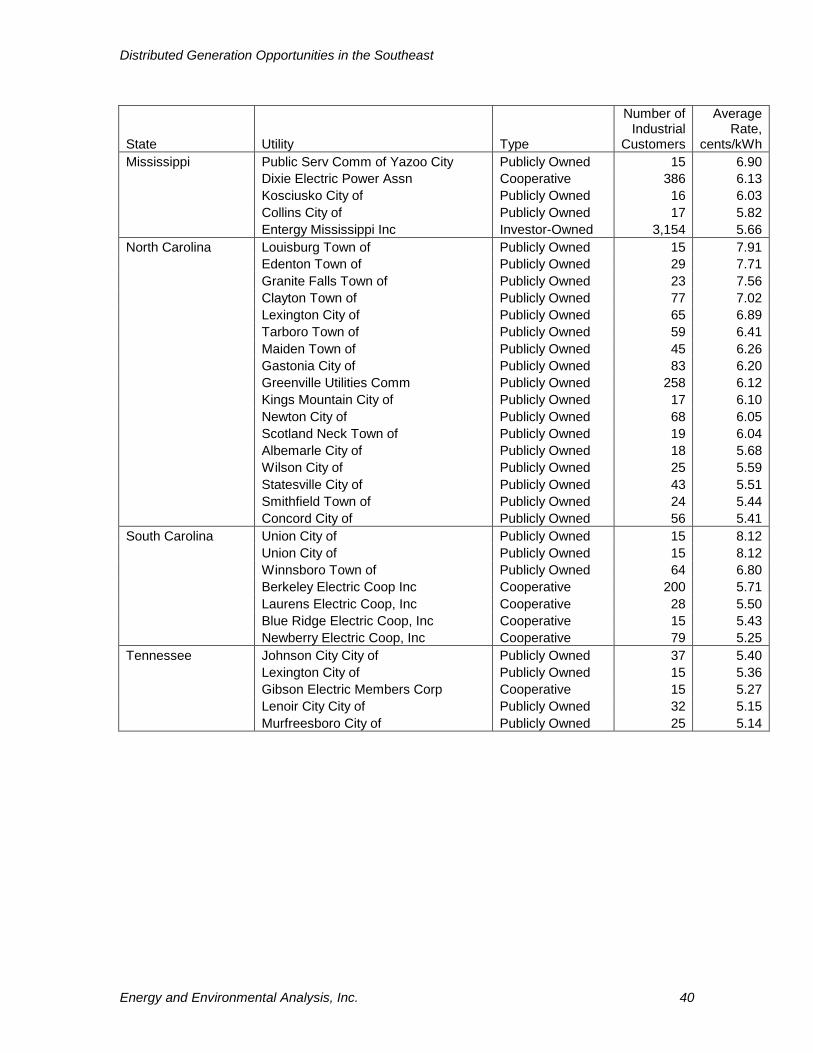
Distributed Generation Opportunities in the Southeast
Energy and Environmental Analysis, Inc. 40
State Utility Type
Number of Industrial
Customers
Average Rate,
cents/kWhMississippi Public Serv Comm of Yazoo City Publicly Owned 15 6.90 Dixie Electric Power Assn Cooperative 386 6.13 Kosciusko City of Publicly Owned 16 6.03 Collins City of Publicly Owned 17 5.82 Entergy Mississippi Inc Investor-Owned 3,154 5.66North Carolina Louisburg Town of Publicly Owned 15 7.91 Edenton Town of Publicly Owned 29 7.71 Granite Falls Town of Publicly Owned 23 7.56 Clayton Town of Publicly Owned 77 7.02 Lexington City of Publicly Owned 65 6.89 Tarboro Town of Publicly Owned 59 6.41 Maiden Town of Publicly Owned 45 6.26 Gastonia City of Publicly Owned 83 6.20 Greenville Utilities Comm Publicly Owned 258 6.12 Kings Mountain City of Publicly Owned 17 6.10 Newton City of Publicly Owned 68 6.05 Scotland Neck Town of Publicly Owned 19 6.04 Albemarle City of Publicly Owned 18 5.68 Wilson City of Publicly Owned 25 5.59 Statesville City of Publicly Owned 43 5.51 Smithfield Town of Publicly Owned 24 5.44 Concord City of Publicly Owned 56 5.41South Carolina Union City of Publicly Owned 15 8.12 Union City of Publicly Owned 15 8.12 Winnsboro Town of Publicly Owned 64 6.80 Berkeley Electric Coop Inc Cooperative 200 5.71 Laurens Electric Coop, Inc Cooperative 28 5.50 Blue Ridge Electric Coop, Inc Cooperative 15 5.43 Newberry Electric Coop, Inc Cooperative 79 5.25Tennessee Johnson City City of Publicly Owned 37 5.40 Lexington City of Publicly Owned 15 5.36 Gibson Electric Members Corp Cooperative 15 5.27 Lenoir City City of Publicly Owned 32 5.15 Murfreesboro City of Publicly Owned 25 5.14
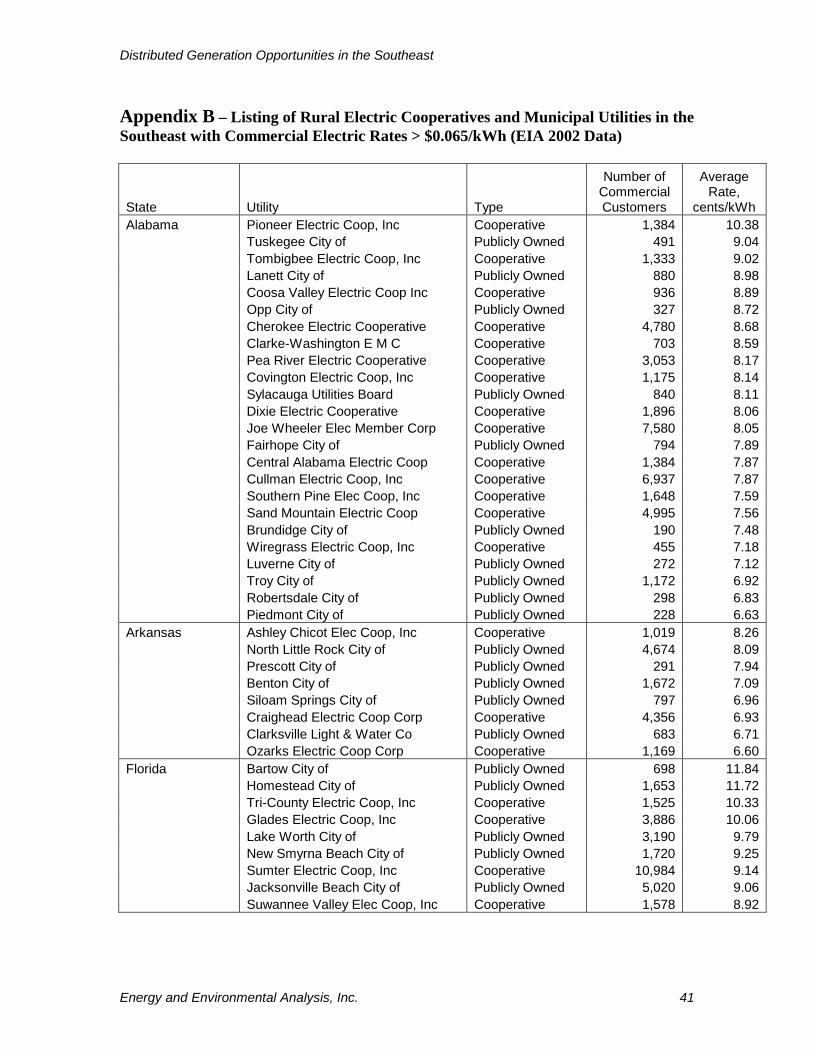
Distributed Generation Opportunities in the Southeast
Energy and Environmental Analysis, Inc. 41
Appendix B – Listing of Rural Electric Cooperatives and Municipal Utilities in the Southeast with Commercial Electric Rates > $0.065/kWh (EIA 2002 Data)
State Utility Type
Number of Commercial Customers
Average Rate,
cents/kWh Alabama Pioneer Electric Coop, Inc Cooperative 1,384 10.38 Tuskegee City of Publicly Owned 491 9.04 Tombigbee Electric Coop, Inc Cooperative 1,333 9.02 Lanett City of Publicly Owned 880 8.98 Coosa Valley Electric Coop Inc Cooperative 936 8.89 Opp City of Publicly Owned 327 8.72 Cherokee Electric Cooperative Cooperative 4,780 8.68 Clarke-Washington E M C Cooperative 703 8.59 Pea River Electric Cooperative Cooperative 3,053 8.17 Covington Electric Coop, Inc Cooperative 1,175 8.14 Sylacauga Utilities Board Publicly Owned 840 8.11 Dixie Electric Cooperative Cooperative 1,896 8.06 Joe Wheeler Elec Member Corp Cooperative 7,580 8.05 Fairhope City of Publicly Owned 794 7.89 Central Alabama Electric Coop Cooperative 1,384 7.87 Cullman Electric Coop, Inc Cooperative 6,937 7.87 Southern Pine Elec Coop, Inc Cooperative 1,648 7.59 Sand Mountain Electric Coop Cooperative 4,995 7.56 Brundidge City of Publicly Owned 190 7.48 Wiregrass Electric Coop, Inc Cooperative 455 7.18 Luverne City of Publicly Owned 272 7.12 Troy City of Publicly Owned 1,172 6.92 Robertsdale City of Publicly Owned 298 6.83 Piedmont City of Publicly Owned 228 6.63Arkansas Ashley Chicot Elec Coop, Inc Cooperative 1,019 8.26 North Little Rock City of Publicly Owned 4,674 8.09 Prescott City of Publicly Owned 291 7.94 Benton City of Publicly Owned 1,672 7.09 Siloam Springs City of Publicly Owned 797 6.96 Craighead Electric Coop Corp Cooperative 4,356 6.93 Clarksville Light & Water Co Publicly Owned 683 6.71 Ozarks Electric Coop Corp Cooperative 1,169 6.60Florida Bartow City of Publicly Owned 698 11.84 Homestead City of Publicly Owned 1,653 11.72 Tri-County Electric Coop, Inc Cooperative 1,525 10.33 Glades Electric Coop, Inc Cooperative 3,886 10.06 Lake Worth City of Publicly Owned 3,190 9.79 New Smyrna Beach City of Publicly Owned 1,720 9.25 Sumter Electric Coop, Inc Cooperative 10,984 9.14 Jacksonville Beach City of Publicly Owned 5,020 9.06 Suwannee Valley Elec Coop, Inc Cooperative 1,578 8.92
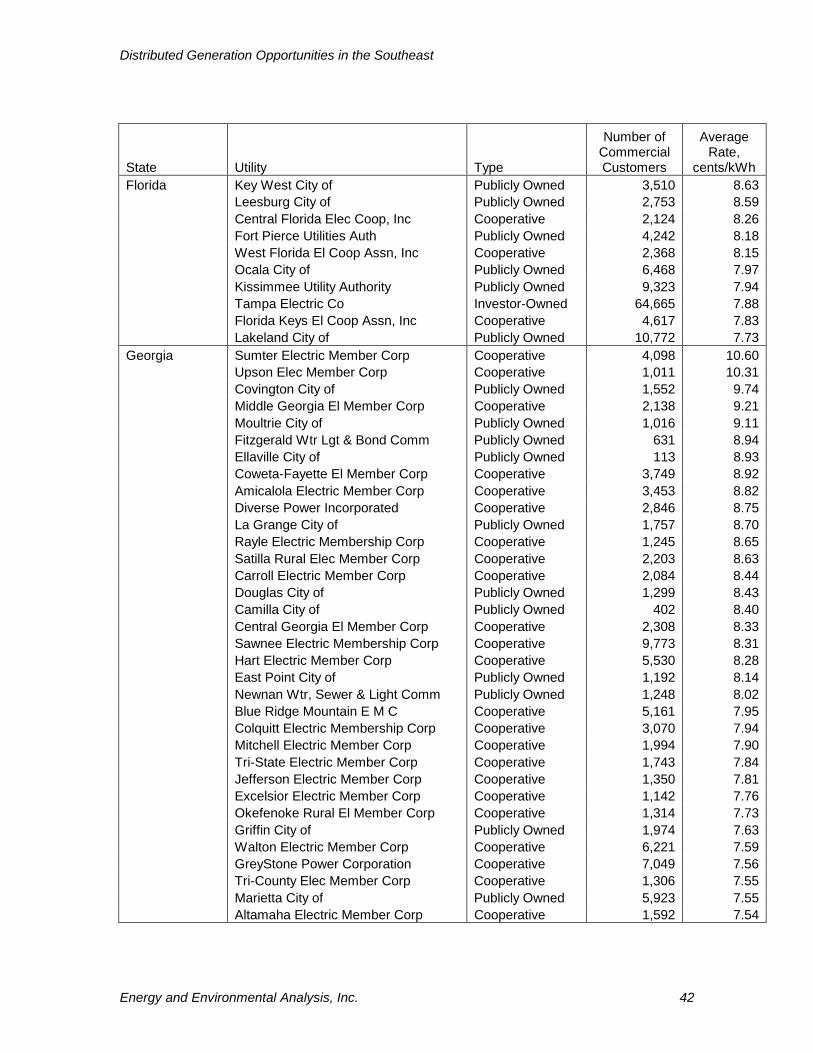
Distributed Generation Opportunities in the Southeast
Energy and Environmental Analysis, Inc. 42
State Utility Type
Number of Commercial Customers
Average Rate,
cents/kWh Florida Key West City of Publicly Owned 3,510 8.63 Leesburg City of Publicly Owned 2,753 8.59 Central Florida Elec Coop, Inc Cooperative 2,124 8.26 Fort Pierce Utilities Auth Publicly Owned 4,242 8.18 West Florida El Coop Assn, Inc Cooperative 2,368 8.15 Ocala City of Publicly Owned 6,468 7.97 Kissimmee Utility Authority Publicly Owned 9,323 7.94 Tampa Electric Co Investor-Owned 64,665 7.88 Florida Keys El Coop Assn, Inc Cooperative 4,617 7.83 Lakeland City of Publicly Owned 10,772 7.73Georgia Sumter Electric Member Corp Cooperative 4,098 10.60 Upson Elec Member Corp Cooperative 1,011 10.31 Covington City of Publicly Owned 1,552 9.74 Middle Georgia El Member Corp Cooperative 2,138 9.21 Moultrie City of Publicly Owned 1,016 9.11 Fitzgerald Wtr Lgt & Bond Comm Publicly Owned 631 8.94 Ellaville City of Publicly Owned 113 8.93 Coweta-Fayette El Member Corp Cooperative 3,749 8.92 Amicalola Electric Member Corp Cooperative 3,453 8.82 Diverse Power Incorporated Cooperative 2,846 8.75 La Grange City of Publicly Owned 1,757 8.70 Rayle Electric Membership Corp Cooperative 1,245 8.65 Satilla Rural Elec Member Corp Cooperative 2,203 8.63 Carroll Electric Member Corp Cooperative 2,084 8.44 Douglas City of Publicly Owned 1,299 8.43 Camilla City of Publicly Owned 402 8.40 Central Georgia El Member Corp Cooperative 2,308 8.33 Sawnee Electric Membership Corp Cooperative 9,773 8.31 Hart Electric Member Corp Cooperative 5,530 8.28 East Point City of Publicly Owned 1,192 8.14 Newnan Wtr, Sewer & Light Comm Publicly Owned 1,248 8.02 Blue Ridge Mountain E M C Cooperative 5,161 7.95 Colquitt Electric Membership Corp Cooperative 3,070 7.94 Mitchell Electric Member Corp Cooperative 1,994 7.90 Tri-State Electric Member Corp Cooperative 1,743 7.84 Jefferson Electric Member Corp Cooperative 1,350 7.81 Excelsior Electric Member Corp Cooperative 1,142 7.76 Okefenoke Rural El Member Corp Cooperative 1,314 7.73 Griffin City of Publicly Owned 1,974 7.63 Walton Electric Member Corp Cooperative 6,221 7.59 GreyStone Power Corporation Cooperative 7,049 7.56 Tri-County Elec Member Corp Cooperative 1,306 7.55 Marietta City of Publicly Owned 5,923 7.55 Altamaha Electric Member Corp Cooperative 1,592 7.54

Distributed Generation Opportunities in the Southeast
Energy and Environmental Analysis, Inc. 43
State Utility Type
Number of Commercial Customers
Average Rate,
cents/kWh Kentucky West Kentucky Rural E C C Cooperative 5,710 8.02 Pennyrile Rural Elec Coop Corp Cooperative 8,955 7.70 Warren Rural Elec Coop Corp Cooperative 7,617 7.24 South Kentucky Rural E C C Cooperative 3,435 6.61 Paducah City of Publicly Owned 3,213 6.53Mississippi Twin County Electric Pwr Assn Cooperative 1,089 9.44 East Mississippi Elec Pwr Assn Cooperative 4,171 8.40 Coahoma Electric Power Assn Cooperative 1,465 8.38 Kosciusko City of Publicly Owned 669 8.22 4-County Electric Power Assn Cooperative 6,364 8.20 Monroe County Elec Power Assn Cooperative 2,444 8.02 Delta Electric Power Assn Cooperative 1,889 7.97 Okolona City of Publicly Owned 1,041 7.97 North East Mississippi E P A Cooperative 1,621 7.78 Central Electric Power Assn Cooperative 5,096 7.63 Tallahatchie Valley E P A Cooperative 4,511 7.60 Public Serv Comm of Yazoo City Publicly Owned 770 7.57 Dixie Electric Power Assn Cooperative 2,102 7.26 Entergy Mississippi Inc Investor-Owned 56,699 6.96 Collins City of Publicly Owned 318 6.91North Carolina Clayton Town of Publicly Owned 508 11.95 Louisburg Town of Publicly Owned 390 10.34 Halifax Electric Member Corp Cooperative 1,201 9.80 Lumberton City of Publicly Owned 2,064 9.64 Blue Ridge Elec Member Corp Cooperative 10,542 9.62 New Bern City of Publicly Owned 2,879 9.29 Wake Electric Membership Corp Cooperative 1,047 9.17 Wilson City of Publicly Owned 3,711 9.12 Smithfield Town of Publicly Owned 1,006 9.11 Lexington City of Publicly Owned 2,691 9.08 Central Electric Membership Corp Cooperative 1,738 8.81 Blue Ridge Mountain E M C Cooperative 2,418 8.80 Edenton Town of Publicly Owned 649 8.79 Maiden Town of Publicly Owned 149 8.71 Washington City of Publicly Owned 2,140 8.70 Piedmont Electric Member Corp Cooperative 2,983 8.66 Tideland Electric Member Corp Cooperative 2,549 8.64 Randolph Electric Member Corp Cooperative 1,723 8.39 Gastonia City of Publicly Owned 3,113 8.37 Rocky Mount City of Publicly Owned 4,181 8.36 Kinston City of Publicly Owned 1,953 8.34

Distributed Generation Opportunities in the Southeast
Energy and Environmental Analysis, Inc. 44
State Utility Type
Number of Commercial Customers
Average Rate,
cents/kWh North Carolina Rutherford Elec Member Corp Cooperative 3,575 8.33 Cape Hatteras Elec Member Corp Cooperative 1,074 8.32 Albemarle City of Publicly Owned 1,929 8.30 Albemarle City of Publicly Owned 1,929 8.30 French Broad Elec Member Corp Cooperative 1,930 8.15 Greenville Utilities Comm Publicly Owned 5,883 8.12 Brunswick Electric Member Corp Cooperative 1,534 8.02 Monroe City of Publicly Owned 1,679 7.97 Pitt & Greene Elec Member Corp Cooperative 1,260 7.96 Elizabeth City City of Publicly Owned 1,626 7.92 Tarboro Town of Publicly Owned 826 7.89 High Point Town of Publicly Owned 5,299 7.85 Carteret-Craven El Member Corp Cooperative 3,371 7.77 Granite Falls Town of Publicly Owned 353 7.76 Kings Mountain City of Publicly Owned 472 7.19 Scotland Neck Town of Publicly Owned 195 7.11 Newton City of Publicly Owned 377 6.93 Statesville City of Publicly Owned 2,254 6.70 Concord City of Publicly Owned 3,312 6.29South Carolina Laurens Electric Coop, Inc Cooperative 3,164 9.17 Union City of Publicly Owned 1,043 8.91 Union City of Publicly Owned 1,043 8.91 Edisto Electric Coop, Inc Cooperative 3,890 8.87 Lockhart Power Co Investor-Owned 1,114 8.71 Little River Electric Coop Inc Cooperative 1,496 8.58 Gaffney City of Publicly Owned 1,163 8.56 York Electric Cooperative, Inc Cooperative 2,495 8.07 Berkeley Electric Coop Inc Cooperative 5,998 8.02 Blue Ridge Electric Coop, Inc Cooperative 3,582 8.01 Rock Hill City of Publicly Owned 3,255 7.94 Horry Electric Cooperative Inc Cooperative 6,048 7.93 Black River Electric Coop, Inc Cooperative 3,217 7.85 Greer Commission of Public Wks Publicly Owned 1,603 7.78 Seneca City of Publicly Owned 1,019 7.75 Pee Dee Electric Coop, Inc Cooperative 1,314 7.71 Georgetown City of Publicly Owned 1,131 7.58 Santee Electric Coop, Inc Cooperative 2,381 7.54 Newberry Electric Coop, Inc Cooperative 573 7.27 Winnsboro Town of Publicly Owned 561 6.99
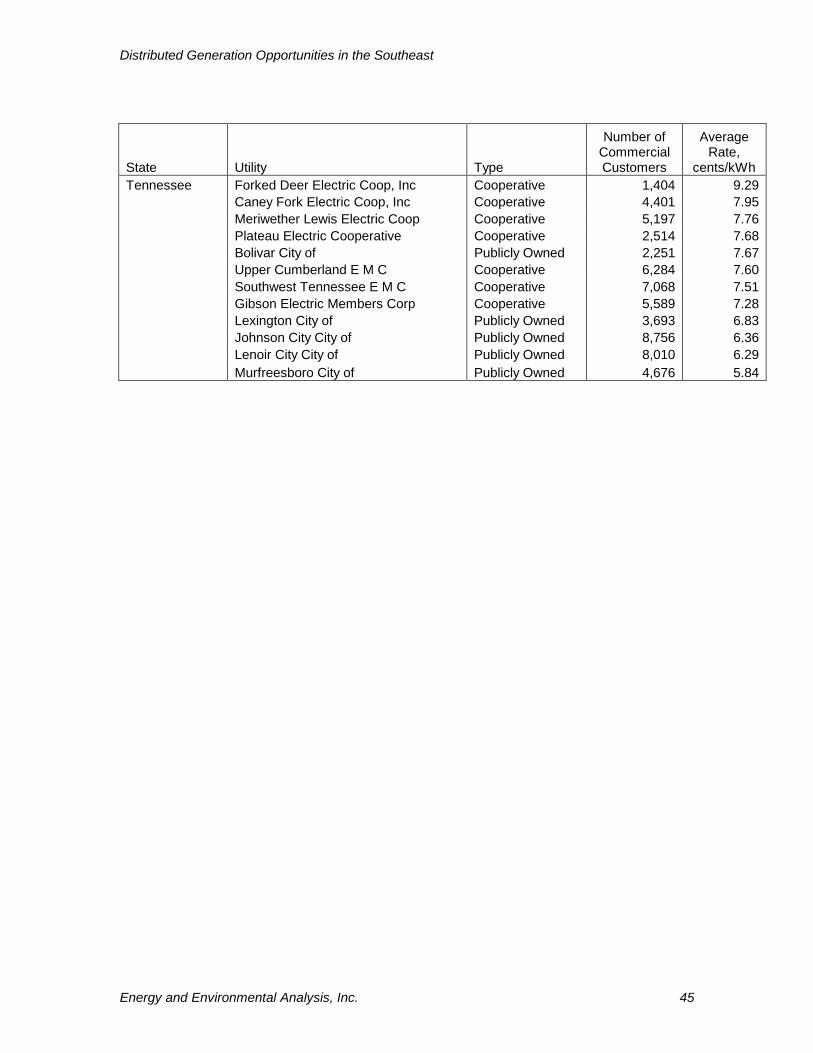
Distributed Generation Opportunities in the Southeast
Energy and Environmental Analysis, Inc. 45
State Utility Type
Number of Commercial Customers
Average Rate,
cents/kWh Tennessee Forked Deer Electric Coop, Inc Cooperative 1,404 9.29 Caney Fork Electric Coop, Inc Cooperative 4,401 7.95 Meriwether Lewis Electric Coop Cooperative 5,197 7.76 Plateau Electric Cooperative Cooperative 2,514 7.68 Bolivar City of Publicly Owned 2,251 7.67 Upper Cumberland E M C Cooperative 6,284 7.60 Southwest Tennessee E M C Cooperative 7,068 7.51 Gibson Electric Members Corp Cooperative 5,589 7.28 Lexington City of Publicly Owned 3,693 6.83 Johnson City City of Publicly Owned 8,756 6.36 Lenoir City City of Publicly Owned 8,010 6.29 Murfreesboro City of Publicly Owned 4,676 5.84
Distributed Generation Opportunities in the Southeast
Energy and Environmental Analysis, Inc. 46
Appendix C: Regional DG-Related Organizations, Initiatives and Incentive Programs
The Southeast CHP Application Center
The US Department of Energy has established regional CHP centers throughout the country. A regional center was recently been created in the Southeast through the efforts of the North Carolina Solar Center and other members of the Southeast CHP Initiative.
The Southeastern Combined Cooling, Heating and Power Regional Application Center (CHPCenterSE), will be directed by the Mississippi Development Authority-Energy Division, Mississippi State University's Micro-CHP Application Center and North Carolina State University's NC+CHP Application Program. The CHPCenterSE will serve Alabama, Arkansas, Florida, Georgia, Kentucky, Mississippi, North Carolina, South Carolina, and Tennessee. The primary responsibilities of the CHPCenterSE will be to provide education and outreach activities, identify and facilitate high impact, high visibility projects, and manage and operate the organization efficiently and progressively. The new regional center seeks to double the installed CHP capacity in the Southeast by the year 2010. They will also coordinate and conduct education and outreach activities to stimulate market development as guided by a CHP Center Roadmap. Contacts at the CHPCenterSE are:
• Louay Chamra, Mississippi State University, [email protected], (662) 325-0618
• Alex Hobbs, NC State University, [email protected], (919) 515-6366
The following information is taken from the DSIRE database of incentives for renewable energy.
Mainstay Energy Rewards Program- Green Tag Purchase Program
Incentive Type: Production Incentive Eligible Technologies: Solar Thermal Electric, Photovoltaics, Wind, Biomass, Geothermal Electric, Small Hydroelectric, Renewable Fuels Applicable Sectors: Commercial, Residential Amount: $1-$100 per MWh total production; Varies by technology and contract length Terms: Any size system, grid tied, new renewable (1/1/99 or later) Effective Date: 2003; systems installed after 1/1/1999 eligible
Mainstay Energy is a private company offering customers who install, or have installed, renewable energy systems the opportunity to sell the green tags (also known as renewable energy credits, or RECs) associated with the energy generated by these systems. These green
Distributed Generation Opportunities in the Southeast
Energy and Environmental Analysis, Inc. 47
tags will be brought to market as Green-e certified products. Through the Mainstay Energy Rewards Program, participating customers receive regular, recurring payments. The amount of the payments depends on the type of renewable energy technology, the production of electricity by that system, and the length of the contract period. Mainstay offers 3-, 5-, and 10-year purchase contracts. The longer the contract period, the greater the incentive payment on a $/kWh basis. Mainstay Energy is the first company in the U.S. to purchase green tags from small-scale renewable producers on a national scale. The Mainstay Rewards Program currently has about 200 participants -- both commercial and residential. Contact:
John King Mainstay Energy 161 E. Chicago Ave. Suite 41B Chicago, IL 60611-2624 Phone: (877) 473-3682 Fax: (312) 896-1515 E-Mail: [email protected]
TVA - Green Power Switch Generation Partners Program
Incentive Type: Production Incentive Eligible Technologies: Photovoltaics, Wind Applicable Sectors: Commercial, Residential Amount: $500 (residential only) plus $0.15 per kWh for 10 years (residential and commercial) Terms: $500 payment available until the program capacity reaches 150 kW
TVA and participating power distributors currently offer a dual-metering option to residential and small-commercial consumers (non-demand-metered) through the Green Power Switch Generation Partners program. The output (green power) generated from this program will be counted as a TVA Green Power Switch resource. Through this program, TVA will purchase the entire output of a qualifying system at $0.15 per kWh through a participating power distributor, and the consumer will receive a credit for the power generated. Participation in this program is entirely up to the discretion of the power distributor. As of June 2004, about a dozen distributors have signed up for the program. Thus far, the program includes several residential solar participants and one 20-kW wind project. Until a total capacity of 150 kW has been reached, the owner of a qualifying residential system will receive a $500 payment when the site is connected to the grid. The goal for the entire program is 5 MW. The credit of $0.15/kWh is available for a minimum of 10 years from the signing of the contract, regardless of the amount produced. Payment is made in the
Distributed Generation Opportunities in the Southeast
Energy and Environmental Analysis, Inc. 48
form of a credit issued by the local power distributor on the monthly power bill for the home or business where the generation system is located. TVA retains sole rights to any renewable energy credits. Qualifying sources include photovoltaic and wind turbine systems with a minimum output of 500 watts AC and a maximum of 50 kW. Qualifying systems must be used primarily to provide all or part of the energy needs at a particular site and must not have previously generated into the grid. Installations must also comply with local codes and adhere to specific interface guidelines established by the program.
Contacts:
Carmen Copeland Gary Harris Tennessee Valley Authority Tennessee Valley Authority Green Power Switch® Green Power Switch® 26 Century Blvd. P.O. Box 292409, OCP- 2E-400 OCP 2-H, NST Nashville, TN 37229-2409 Nashville, TN 37229 Phone: (615) 232-6124 Phone: (615) 232-6724 Fax: (615) 232-6038 Phone 2: (615) 232-6929 E-Mail: [email protected] Fax: (615) 232-6929 E-Mail: [email protected]
North Carolina Renewable Energy Tax Credit – Corporate
Incentive Type: Corporate Tax Credit Eligible Technologies: Passive Solar Space Heat, Solar Water Heat, Solar Space Heat, Solar Thermal Electric, Solar Thermal Process Heat, Photovoltaics, Wind, Biomass, Hydroelectric, Renewable Transportation Fuels, Solar Pool Heating, Daylighting, Ethanol, Methanol, Biodiesel Applicable Sectors: Commercial, Industrial Amount: 35% Max. Limit: $250,000 Terms: Distributed over five years (see summary) Website: http://www.ncsc.ncsu.edu/information_resources/renewable_energy_tax_guidelines.cfm
The revised renewable energy tax statute provides for an expanded tax credit of 35% of the cost of renewable energy property constructed, purchased or leased by a taxpayer and placed into service in North Carolina during the taxable year. The new tax credits became effective January 1, 2000. The credit is subject to various ceilings depending on sector and the type of renewable energy system. Credit limits for the various technologies and sectors are as follows:
Distributed Generation Opportunities in the Southeast
Energy and Environmental Analysis, Inc. 49
• A maximum of $10,500 for residential photovoltaic (solar-electric) systems; • A maximum of $3,500 for residential passive and active solar space heating
systems; • A maximum of $1,400 for solar water heating systems; • A maximum of $250,000 for all solar, wind, hydro and biomass applications
on commercial and industrial facilities, including photovoltaic, daylighting, solar hot water and space heating technologies.
Renewable energy equipment costs eligible for the tax credit include the cost of the equipment and associated design, construction costs and installation costs less any discounts, rebates, advertising, installation assistance credits, name referral allowances or other similar reductions. Contact:
Bob McGuffey North Carolina Solar Center Campus Box 7401 North Carolina State University Raleigh, NC 27695-7401 Phone: (919) 515-3480 Fax: (919) 515-5778 E-Mail: [email protected] Web site: http://www.ncsc.ncsu.edu
North Carolina Energy Improvement Loan Program
Incentive Type: State Loan Program Eligible Technologies: Solar Water Heat, Solar Space Heat, Solar Thermal Electric, Solar Thermal Process Heat, Photovoltaics, Wind, Biomass, Hydroelectric, Energy Efficiency Applicable Sectors: Commercial, Industrial, Nonprofit, Schools, Local Government Amount: Varies Max. Limit: $500,000 Terms: 1% interest rate for renewables; 10-year maximum term
The Energy Improvement Loan Program (EILP) is available to North Carolina businesses, local governments, public schools and nonprofit organizations for projects that include energy efficiency improvements and renewable energy systems. Loans with an interest rate of 1% are available for certain renewable energy and energy recycling projects. Eligible renewable energy projects generally include solar, wind, small hydro (less than 20 megawatts) and biomass. A rate of 3% is available for projects that demonstrate energy efficiency, energy cost-savings or reduced energy demand. In order to qualify for an EILP low-interest loan, a project must (1) be located in North
Distributed Generation Opportunities in the Southeast
Energy and Environmental Analysis, Inc. 50
Carolina; (2) demonstrate energy efficiency, use of renewable-energy resources, energy cost savings or reduced energy demand; (3) use existing, reliable, commercially-available technologies; (4) meet federal and state air and water quality standards; and (5) be able to recover capital costs within the loan's maximum term of 10 years through energy cost savings. Contact:
Rondra McMillan North Carolina Department of Administration State Energy Office 1830 Tillery Place Raleigh, NC 27604 Phone: (919) 733-1919 E-Mail: [email protected] Web site: http://www.energync.net
Tennessee Wind Energy Systems Exemption
Incentive Type: Property Tax Exemption Eligible Technologies: Wind Applicable Sectors: Commercial, Industrial, Utility Amount: 67% exemption Max. Limit: None Website: http://www.state.tn.us/sos/acts/103/pub/pc0377.pdf
Tennessee House Bill 809, passed in June 2003, states that wind energy systems operated by public utilities, businesses or industrial facilities shall not be taxed at more than one-third of their total installed cost. This law applies to the initial appraisal and subsequent appraisals of wind energy systems. Contact:
Taxpayer Assistance - TN DOR Tennessee Department of Revenue Andrew Jackson Building, Room 1200 Nashville, TN 37242-1099 Phone: (800) 342-1003 Phone 2: (615) 253-0600 E-Mail: [email protected] Web site: http://www.state.tn.us/revenue/
Alabama Renewable Fuels Program
Incentive Type: State Grant Program Eligible Technologies: Biomass, Municipal Solid Waste
Distributed Generation Opportunities in the Southeast
Energy and Environmental Analysis, Inc. 51
Applicable Sectors: Commercial, Industrial, Schools, Local Government, State Government, Agricultural Amount: Varies Max. Limit: $75,000 Terms: Interest subsidy varies Website: http://www.adeca.alabama.gov/content/ste/ste_biomass_fuel_dev.aspx
The Renewable Fuels Program assists businesses in installing biomass energy systems. Program participants receive up to $75,000 in interest subsidy payments to help defray the interest expense on loans to install approved biomass projects. Technical assistance and feasibility studies are also available through the program. Industrial, commercial and institutional facilities; agricultural property owners; and city, county, and state government entities are eligible. Interested parties must first obtain loans from commercial lending institutions and then apply to ADECA for interest payment assistance. Assistance is given only for loans with interest rates no greater than 2% above the prime rate. With an initial emphasis on wood waste, the program now also focuses on switchgrass and municipal solid waste (MSW). A pilot project to assess the feasibility of co-firing switchgrass with coal in electricity production has been completed resulting in a switchgrass to coal mix ratio of up to 10%. ADECA is also interested in landfill gas as a potential source of energy for industrial and other uses. Several landfill waste disposal facilities across Alabama have been identified as prime candidates for landfill gas recovery and utilization. Contact:
Clarence Mann Alabama Department of Economic and Community Affairs Science, Technology & Energy Division P.O. Box 5690 401 Adams Avenue Montgomery, AL 36103-5690 Phone: (334) 242-5290 Phone 2: (334) 242-5330 Fax: (334) 242-0552 E-Mail: [email protected] Web site: http://www.adeca.al.gov
Mississippi Energy Investment Program
Incentive Type: State Loan Program Eligible Technologies: Solar Water Heat, Solar Space Heat, Solar Thermal Electric, Solar Thermal Process Heat, Photovoltaics, Biomass, Hydroelectric, Renewable Transportation Fuels, Geothermal Electric, Municipal Solid Waste, Cogeneration Applicable Sectors: Commercial, Industrial
Distributed Generation Opportunities in the Southeast
Energy and Environmental Analysis, Inc. 52
Amount: 85% Max. Limit: $300,000 Terms: 3% below prime rate; 7-year payback Website: http://www.mississippi.org/ programs/energy/comm_ind_efficiency.htm#loan_program
Mississippi offers low-interest loans for renewable energy and energy efficiency projects. Eligible renewable energy technologies include solar thermal, solar space heat, solar process heat, photovoltaics (PV), alternative fuels, geothermal, biomass and hydropower. All projects must demonstrate that they will reduce a facility's energy costs. The interest rate is 3% below the prime rate, with a maximum loan term of seven years. Loans range from $15,000 to $300,000. This program is supported by a revolving loan fund of $7 million, established through federal oil overcharge funds. Contact:
Demetra Foster Mississippi Development Authority Energy Division P.O. Box 850 510 George Street, Suite 300 Jackson, MS 39205-0850 Phone: (601) 359-6621 Fax: (601) 359-6642 E-Mail: [email protected] Web site: http://www.mississippi.org
Florida Solar Energy Center (FSEC)
FSEC's mission is to research and develop energy technologies that enhance Florida's and the nation's economy and environment, and to educate the public, students and practitioners on the results of the research. The Center has gained national and international recognition for its wide range of research, education, training and certification activities. The center focuses on photovoltaic and solar thermal energy systems as well as other energy efficiency measures. FSEC annually receives $3 million in operating funds from the University system of Florida. The institute also performs contracted research and training for external sponsors. (FSEC website http://www.fsec.ucf.edu/)
Florida Department of Environmental Protection The Florida Department of Environmental Protection is the lead agency in the state government for environmental management and stewardship. The department administers regulatory programs and issues permits for air, water and waste management. It oversees the State’s land and water conservation program, Florida Forever, and manages the nationally award-winning Florida Park Service. The department sponsors several biomass energy
Distributed Generation Opportunities in the Southeast
Energy and Environmental Analysis, Inc. 53
projects because it believes that biomass energy is capable of playing a major role in energy economics and security of the state. There is a dairy biomass energy demonstration site that is a typical dairy farm of 1,000 cows in Hague, Florida. The programs objective is to demonstrate the use of a fixed-film anaerobic digester that simultaneously treats dairy wastewater, while producing energy by burning methane gas. The department is also sponsoring a biomass co-firing project, a materials recycling project in Orlando, and a biomass crop plantation demonstration project. (FL DEP website http://www.dep.state.fl.us/) North Carolina State Energy Office The Energy Office supports several programs that utilize biomass, solar, and wind energy sources. Landfill gas, while not strictly a renewable resource, is included here as a biomass resource. The energy office is currently working on projects that use landfill gas, crop wastes and food processing by-products to generate feedstocks for fuels, dedicated energy crops to be converted into energy after harvest, and forestry and municipal wood wastes. In addition, livestock wastes present a large opportunity for energy generation in North Carolina. A significant effort is underway to identify alternatives to traditional hog waste disposal. Through North Carolina State University, the State Energy Office is investigating 18 technologies that offer alternatives to the open hog waste lagoons and spray field application of liquid wastes. (NC Energy Office website http://www.energync.net/)
Larry Shirley State Energy Office Director 1830A Tillery Place Email: [email protected] Raleigh, NC 27604-1376 Phone: 919-733-2230 Fax: 919-733-2953
Mississippi Development Authority- Energy Division
The Energy Division oversees energy management programs for the State of Mississippi, ensuring an environmentally acceptable, adequate and dependable supply of energy. The division helps economic development move forward by providing technical and financial assistance to improve energy efficiency, as well as by promoting recycling. The development authority supports the Biomass Advisory Council, which is designed to organize practitioners, experts and individuals interested in converting renewable organic resources into energy or commercial products. The Council provides information required for future waste-to-energy policy and economic development opportunities through energy development programs. The Council acts as a catalyst for increased biomass activity in the State. Mississippi's Biomass Council is bringing together representatives from throughout the State to explore and create opportunities that will maximize Mississippi's biomass resources.
Contact: Kenneth Calvin [email protected]
Distributed Generation Opportunities in the Southeast
Energy and Environmental Analysis, Inc. 54
American Public Power Association
The American Public Power Association (APPA) is the service organization for the nation's more than 2,000 community-owned electric utilities that serve more than 43 million Americans. It was created in 1940 as a non-profit, non-partisan organization governed by a regionally representative board of directors. Its purpose is to advance the public policy interests of its members and their consumers, and provide member services to ensure adequate, reliable electricity at a reasonable price with the proper protection of the environment. The American Public Power Association's Demonstration of Energy-Efficient Developments (DEED) program helps to advance public power research and development. DEED encourages activities that promote energy innovation, improving efficiencies and lowering costs of providing energy services to public power customers.
(http://www.appanet.org)
Contact: 2301 M Street, NW Washington, DC 20037-1484 Tel: 202.467.2900 National Rural Electric Cooperative Association
The National Rural Electric Cooperative Association (NRECA) is a national service organization dedicated to representing the national interests of cooperative electric utilities and the consumers they serve. The NRECA Board of Directors oversees the association’s activities and consists of 47 members, one from each state in which there is an electric distribution cooperative. NRECA was founded in 1942 and has been an advocate for consumer-owned cooperatives on energy and operational issues as well as rural community and economic development. NRECA’s more than 900 member cooperatives serve 37 million people in 47 states. The association provides national leadership and member assistance through legislative representation before the U.S. Congress and the Executive Branch; representation in legal and regulatory proceedings affecting electric service and the environment; communication; education and consulting for cooperative directors, managers and employees; energy, environmental, and information research and technology; training and conferences; and insurance, employee benefits and financial services. Programs are funded through dues and fees.
(http://www.nreca.org) Contact: 4301 Wilson Blvd. Arlington, VA 22203 Tel: 703.907.5500 [email protected]
Distributed Generation Opportunities in the Southeast
Energy and Environmental Analysis, Inc. 55
Mississippi Biomass Council
The Mississippi Biomass Council (MBC), Inc. offers a forum to share information for the purpose of assessing the biomass energy and fuel resources within the state, facilitating the utilization of biomass technology, and encouraging biomass related economic development. Council membership includes representatives from agriculture, forestry, recycling, power generation, state and local government agencies, higher education, research, and manufacturing and individuals interested in reducing the biomass waste stream or increasing economic opportunities for biomass. MBC was created in 1998 and incorporated in 2000 as a nonprofit corporation. MBC seeks to provide information about biomass resources, research, development, technology, and use. MBC encourages the use of biomass crops and waste for bio-energy bio-fuels, and other bio-based products through; personal contact with members, newsletters, education programs, workshops, and conferences.
(http://ms-biomass.org)
Contact: Wes Miller Alcorn State Univ. 1320 Seven Springs Rd. Raymond, MS 39154 Tel: 601.857.0480 E-mail: [email protected] Southern States Energy Board (SSEB) The Southern States Energy Board (SSEB) is a non-profit interstate compact organization that was created in 1960. The Board’s mission is to enhance economic development and the quality of life in the South through innovations in energy and environmental policies, programs and technologies. SSEB was created by state law and consented to by Congress with a broad mandate to contribute to the economic and community well-being of the southern region. The Board exercises this mandate through the creation of programs in the fields of energy and environmental policy research, development and implementation, science and technology exploration and related areas of concern. SSEB serves its members directly by providing timely assistance designed to develop effective energy and environmental policies and represents its members before governmental agencies at all levels. (http://www.sseb.org) Contact: Southern States Energy Board Southern States Energy Board 6325 Amherst Court P.O. Box 34606 Norcross, Georgia 30092 Washington, DC 20043 Tel: 770.242.7712 Tel: 202.667.7303
Distributed Generation Opportunities in the Southeast
Energy and Environmental Analysis, Inc. 56
Southern States Bio-based Alliance Formed in July 2001, the Southern States Bio-based Alliance works in an advisory capacity to the Southern States Energy Board, addressing the development of biobased products and bioenergy within the southern region. The Alliance has developed a formal mission to provide leadership and develop strategies that will foster a biobased industry and boost rural economies in the southern states. The Alliance members are gubernatorial appointees who are state legislators representing SSEB member states and representatives of the public or private sector who are active in energy, environment and agriculture issues. The Alliance provides regional leadership to the Southern States Energy Board and its member states through:
• Alliance meetings and activities that foster communication, coordination and collaboration among members to enhance development of a biobased industry in the region;
• recommendation of policies and programs that foster development of a biobased industry in the region;
• identification of strategies that stimulate markets for biobased products and technologies;
• providing electronic access to information, public forums and appropriate links to facilitate information transfer on biobased products and bioenergy; and
• advancing research, development and demonstration of biobased technologies and promoting the use of those technologies.
(http://www.sseb.org/currentprograms/cpa_bpbd.htm) Contact: Phillip C. Badger Tel: (256) 740-5634 Email: [email protected] Southeast Regional Biomass Energy Program The Southern States Energy Board has been awarded a cooperative agreement to administer the Southeastern Regional Biomass Energy Program (SERBEP), funded through the Department of Energy’s Southeast Regional Office. Through the use of small, cost-shared grants, the Program encourages economic development through public/private partnerships that demonstrate bioenergy technology applications. The objectives of SERBEP are:
• To improve government and industry capabilities and effectiveness in the production and use of biomass resources,
• To support planning efforts that make these resources available, • To encourage economic development through private and public investment in
biomass technologies, and • To engage in research projects to demonstrate biomass technology applications.

Distributed Generation Opportunities in the Southeast
Energy and Environmental Analysis, Inc. 57
(http://www.serbep.org) Contact: Kathryn A. Baskin Tel: (770) 242-7712 Email: [email protected]
North Carolina State University Animal and Poultry Waste Management Center
The North Carolina State University (NCSU) Animal and Poultry Waste Management Center (APWMC) was established in 1996. The primary goal of the APWMC is to support research, demonstration, and educational efforts related to environmental impacts of livestock and poultry production agriculture. The focus is on technology development and environmental performance verification of technologies that contribute to sustainable agribusiness in the state and nation. Since 1996 the APWMC has leveraged state and USDA special grant funding to build research-based partnerships with land-grant universities in the states of Alabama, Georgia, Iowa, Kentucky, Michigan, Mississippi, Missouri, Ohio, Oklahoma, Oregon, and Virginia, as well as with a number of agribusiness companies, environmental groups, and commodity associations in the pork and poultry industries. (http://www.cals.ncsu.edu/waste_mgt/apwmc.htm) Contact: C.M. "Mike" Williams, Director, or Leonard S. Bull, Associate Director, Campus Box 7608 Raleigh, NC 27695-7608 (919) 515-5387 (phone) e-mail: [email protected] [email protected]
U.S. Combined Heat and Power Association
The U.S. Combined Heat and Power Association (USCHPA) is a private, non-profit association, formed in 1999 to promote the merits of CHP and achieve public policy support. The USCHPA documents the benefits of CHP to the public and decision-makers, creating a new industry focused on CHP. USCHPA sponsors conferences and workshops and prepares reports and releases to educate the public about CHP. USCHPA participates in federal agency programs to promote CHP and clean distributed energy. In particular, the association
Distributed Generation Opportunities in the Southeast
Energy and Environmental Analysis, Inc. 58
is committed to the CHP Program of the U.S. Department of Energy and the CHP Partnership Program of the Environmental Protection Agency. The mission of the USCHPA is to “Create a regulatory, institutional and market environment that fosters the use of clean, efficient CHP as a major source of electric power and thermal energy in the U.S.” The current goal is to double the contribution of CHP to the nation's power supply (46GW in 1998 to 92GW by 2010).
(http://uschpa.admgt.com/)
Contact: John Jimison - Executive Director and General Counsel USCHPA National Headquarters 218 D Street, SE Washington, D.C. 20003 Tel: 202-544-4565 Email: [email protected]
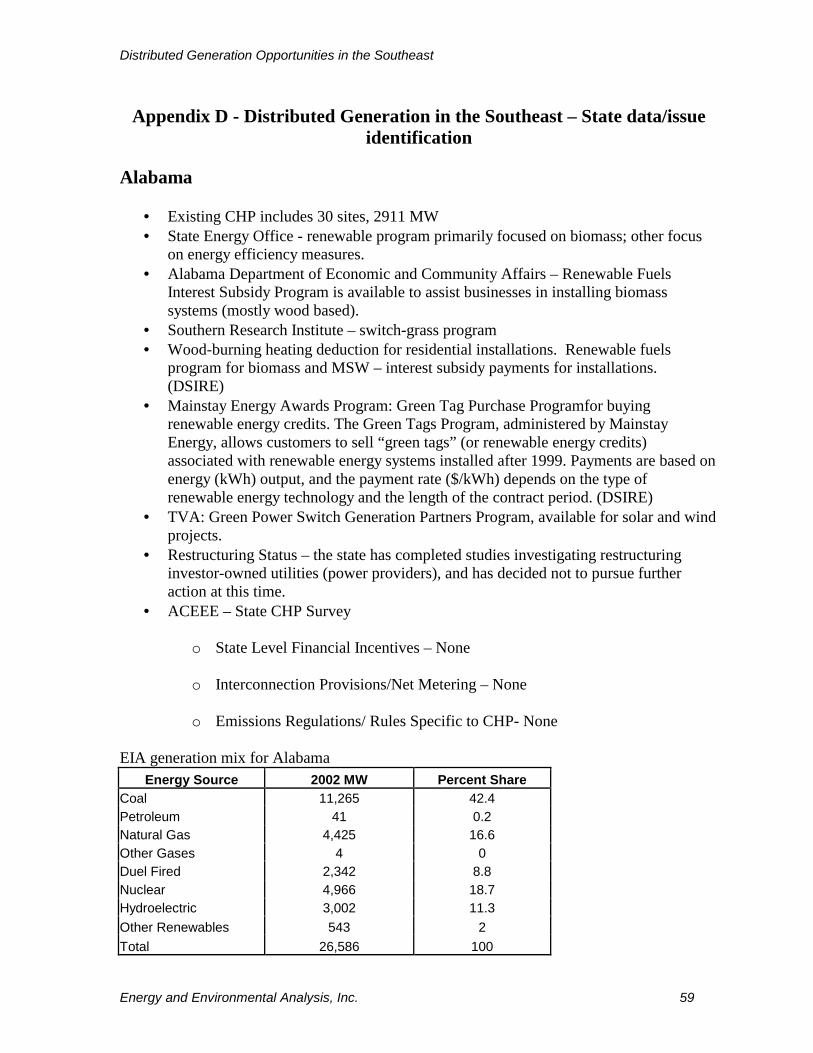
Distributed Generation Opportunities in the Southeast
Energy and Environmental Analysis, Inc. 59
Appendix D - Distributed Generation in the Southeast – State data/issue identification
Alabama
• Existing CHP includes 30 sites, 2911 MW • State Energy Office - renewable program primarily focused on biomass; other focus
on energy efficiency measures. • Alabama Department of Economic and Community Affairs – Renewable Fuels
Interest Subsidy Program is available to assist businesses in installing biomass systems (mostly wood based).
• Southern Research Institute – switch-grass program • Wood-burning heating deduction for residential installations. Renewable fuels
program for biomass and MSW – interest subsidy payments for installations. (DSIRE)
• Mainstay Energy Awards Program: Green Tag Purchase Programfor buying renewable energy credits. The Green Tags Program, administered by Mainstay Energy, allows customers to sell “green tags” (or renewable energy credits) associated with renewable energy systems installed after 1999. Payments are based on energy (kWh) output, and the payment rate ($/kWh) depends on the type of renewable energy technology and the length of the contract period. (DSIRE)
• TVA: Green Power Switch Generation Partners Program, available for solar and wind projects.
• Restructuring Status – the state has completed studies investigating restructuring investor-owned utilities (power providers), and has decided not to pursue further action at this time.
• ACEEE – State CHP Survey
o State Level Financial Incentives – None
o Interconnection Provisions/Net Metering – None
o Emissions Regulations/ Rules Specific to CHP- None EIA generation mix for Alabama
Energy Source 2002 MW Percent Share Coal 11,265 42.4 Petroleum 41 0.2 Natural Gas 4,425 16.6 Other Gases 4 0 Duel Fired 2,342 8.8 Nuclear 4,966 18.7 Hydroelectric 3,002 11.3 Other Renewables 543 2 Total 26,586 100

Distributed Generation Opportunities in the Southeast
Energy and Environmental Analysis, Inc. 60
Arkansas
• Existing CHP includes 13 sites, 512 MW • State Energy Office- has renewable program highlighting solar and wind; biodiesel
program • Mainstay Energy Awards Program: Green Tag Purchase Program (DSIRE), for
buying renewable energy credits. • Restructuring Status - has passed legislation repealing the restructuring process. • ACEEE – State CHP Survey
o State Level Financial Incentives – None
o Interconnection Provisions/Net Metering – 1983 Arkansas RSC published
interconnection rules, http://170.94.29.3/rules/cogeneration_rules.pdf. 2001 net metering rule, simple interconnection and utility must maintain the facility’s original rate structure, 25kW for residential, 100 kW for commercial/agricultural.
o Emissions Regulations/ Rules Specific to CHP – none
EIA generation mix in Arkansas
Energy Source 2002 MW Percent Share Coal 3,757 33.2 Petroleum 18 0.2 Natural Gas 1,490 13.2 Duel Fired 2,542 22.5 Nuclear 1,776 15.7 Hydroelectric 1,416 12.5 Other Renewables 301 2.7 Total 11,300 100
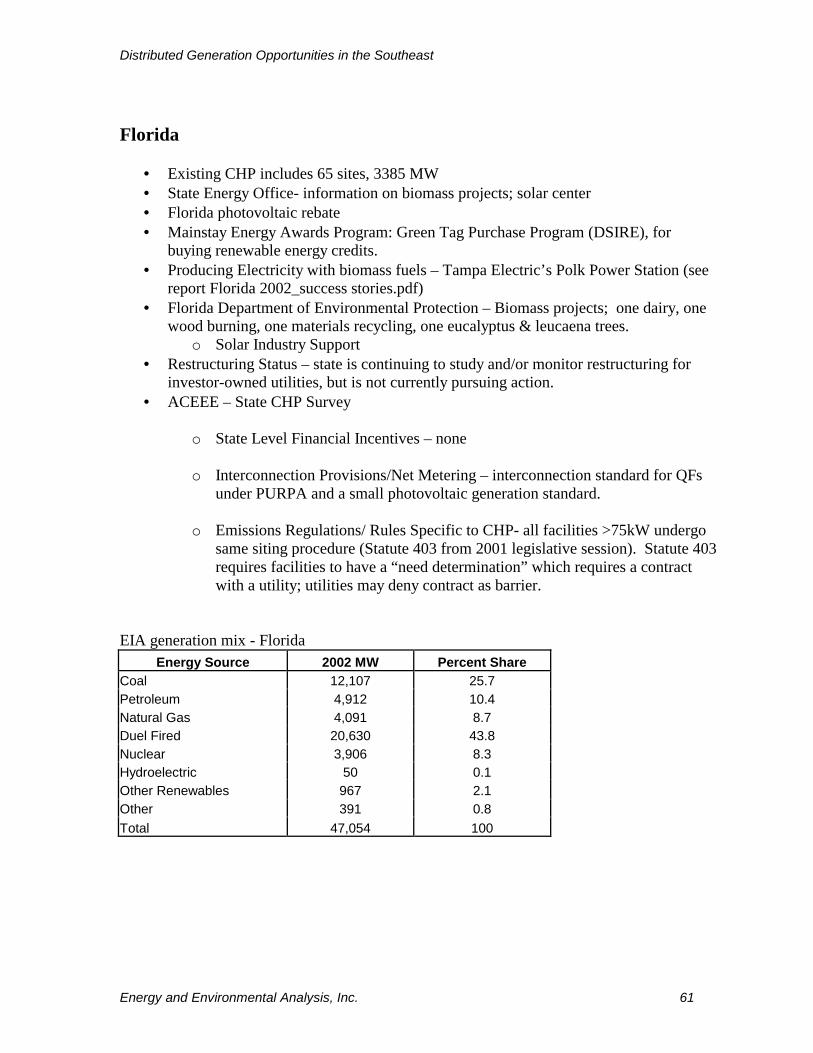
Distributed Generation Opportunities in the Southeast
Energy and Environmental Analysis, Inc. 61
Florida
• Existing CHP includes 65 sites, 3385 MW • State Energy Office- information on biomass projects; solar center • Florida photovoltaic rebate • Mainstay Energy Awards Program: Green Tag Purchase Program (DSIRE), for
buying renewable energy credits. • Producing Electricity with biomass fuels – Tampa Electric’s Polk Power Station (see
report Florida 2002_success stories.pdf) • Florida Department of Environmental Protection – Biomass projects; one dairy, one
wood burning, one materials recycling, one eucalyptus & leucaena trees. o Solar Industry Support
• Restructuring Status – state is continuing to study and/or monitor restructuring for investor-owned utilities, but is not currently pursuing action.
• ACEEE – State CHP Survey
o State Level Financial Incentives – none
o Interconnection Provisions/Net Metering – interconnection standard for QFs under PURPA and a small photovoltaic generation standard.
o Emissions Regulations/ Rules Specific to CHP- all facilities >75kW undergo same siting procedure (Statute 403 from 2001 legislative session). Statute 403 requires facilities to have a “need determination” which requires a contract with a utility; utilities may deny contract as barrier.
EIA generation mix - Florida
Energy Source 2002 MW Percent Share Coal 12,107 25.7 Petroleum 4,912 10.4 Natural Gas 4,091 8.7 Duel Fired 20,630 43.8 Nuclear 3,906 8.3 Hydroelectric 50 0.1 Other Renewables 967 2.1 Other 391 0.8 Total 47,054 100
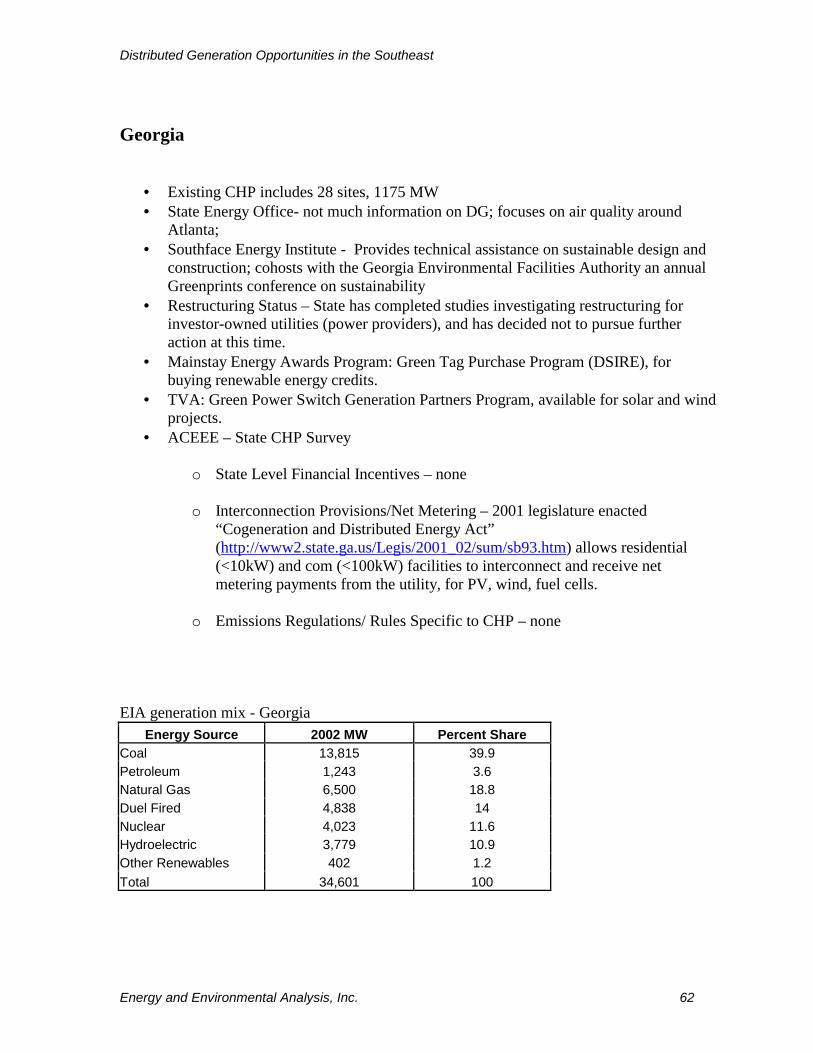
Distributed Generation Opportunities in the Southeast
Energy and Environmental Analysis, Inc. 62
Georgia
• Existing CHP includes 28 sites, 1175 MW • State Energy Office- not much information on DG; focuses on air quality around
Atlanta; • Southface Energy Institute - Provides technical assistance on sustainable design and
construction; cohosts with the Georgia Environmental Facilities Authority an annual Greenprints conference on sustainability
• Restructuring Status – State has completed studies investigating restructuring for investor-owned utilities (power providers), and has decided not to pursue further action at this time.
• Mainstay Energy Awards Program: Green Tag Purchase Program (DSIRE), for buying renewable energy credits.
• TVA: Green Power Switch Generation Partners Program, available for solar and wind projects.
• ACEEE – State CHP Survey
o State Level Financial Incentives – none
o Interconnection Provisions/Net Metering – 2001 legislature enacted “Cogeneration and Distributed Energy Act” (http://www2.state.ga.us/Legis/2001_02/sum/sb93.htm) allows residential (<10kW) and com (<100kW) facilities to interconnect and receive net metering payments from the utility, for PV, wind, fuel cells.
o Emissions Regulations/ Rules Specific to CHP – none EIA generation mix - Georgia
Energy Source 2002 MW Percent Share Coal 13,815 39.9 Petroleum 1,243 3.6 Natural Gas 6,500 18.8 Duel Fired 4,838 14 Nuclear 4,023 11.6 Hydroelectric 3,779 10.9 Other Renewables 402 1.2 Total 34,601 100

Distributed Generation Opportunities in the Southeast
Energy and Environmental Analysis, Inc. 63
Kentucky
• Existing CHP includes 5 sites, 109 MW • State Energy Office- information on biofuels (biodiesel, ethanol) for use on farms;
information on biomass, solar, and wind programs; more focused on demand side management.
• Mainstay Energy Awards Program: Green Tag Purchase Program (DSIRE), for buying renewable energy credits.
• TVA: Green Power Switch Generation Partners Program, available for solar and wind projects.
• Restructuring Status - is continuing to study and/or monitor restructuring investor-owned utilities, but is not currently pursuing further action.
• ACEEE – State CHP Survey
o State Level Financial Incentives – none
o Interconnection Provisions/Net Metering – each utility has tariff for customer generated power, agreements are done on a case-by-case basis. By order of PSC in 2002, utilities must make net metering available for renewable projects for residential (<10kW) or non-residential (<25kW) for up to 25 customers.
o Emissions Regulations/ Rules Specific to CHP - None EIA generation mix in Kentucky
Energy Source 2002 MW Percent Share Coal 14,212 74.3 Petroleum 70 0.4 Natural Gas 2,001 10.5 Duel Fired 1,967 10.3 Hydroelectric 821 4.3 Other Renewables 51 0.3 Total 19,122 100

Distributed Generation Opportunities in the Southeast
Energy and Environmental Analysis, Inc. 64
Mississippi
• Existing CHP includes 21 sites, 1080 MW • State Energy Office- A number of programs and information on biomass energy • Mississippi Biomass Council – goal is to serve as a catalyst for increased biomass
activity in the state; Renewable and Biomass energy database; biomass contributes 7.1% of Miss. total energy consumption (double the national avg)
• Energy Investment Program – low interest loans on renewable installations. (DSIRE) • Mainstay Energy Awards Program: Green Tag Purchase Program (DSIRE), for
buying renewable energy credits. • TVA: Green Power Switch Generation Partners Program, available for solar and wind
projects. • Restructuring Status - is continuing to study and/or monitor restructuring investor-
owned utilities, but is not currently pursuing further action. • ACEEE – State CHP Survey
o State Level Financial Incentives – none
o Interconnection Provisions/Net Metering – individual utilities determine
interconnection guidelines.
o Emissions Regulations/ Rules Specific to CHP – none EIA generation mix Mississippi
Energy Source 2002 MW Percent Share Coal 2,665 19.5 Petroleum 36 0.3 Natural Gas 6,260 45.7 Other Gases 4 0 Duel Fired 3,216 23.5 Nuclear 1,231 9 Other Renewables 279 2 Total 13,691 100

Distributed Generation Opportunities in the Southeast
Energy and Environmental Analysis, Inc. 65
North Carolina
• Existing CHP includes 45 sites, 1466 MW • State Energy Office- co-hosting landfill methane conferences; fuel cell, microturbine,
solar, and wind projects; landfill gas use; alternative cooling methods (absorption chillers etc)
• Restructuring Status – State has completed studies investigating restructuring for investor-owned utilities (power providers), and has decided not to pursue further action at this time.
• Case Studies of Anaerobic digestion projects- 2 NC sites at http://www.biogasworks.com/Goodies/Farm%20Case%20Studies.htm
• NC State Animal and Poultry Waste Management Center – research efforts to address hog waste management.
• Corporate and Personal Renewable Energy tax credits – credit a percentage of renewable installation. Renewable equipment manufacturer credit. Energy Improvement Loan Program. (DSIRE)
• Mainstay Energy Awards Program: Green Tag Purchase Program (DSIRE), for buying renewable energy credits.
• TVA: Green Power Switch Generation Partners Program, available for solar and wind projects.
• ACEEE – State CHP Survey
o State Level Financial Incentives – Avoided Costs Program, Green Power Program
o Interconnection Provisions/Net Metering – individual utilities determine interconnection standards.
o Emissions Regulations/ Rules Specific to CHP - none EIA generation mix for North Carolina
Energy Source 2002 MW Percent Share Coal 13,268 49.7 Petroleum 447 1.7 Natural Gas 2,324 8.7 Duel Fired 3,591 13.5 Nuclear 4,731 17.7 Hydroelectric 2,008 7.5 Other Renewables 268 1 Other 37 0.1 Total 26,674 100
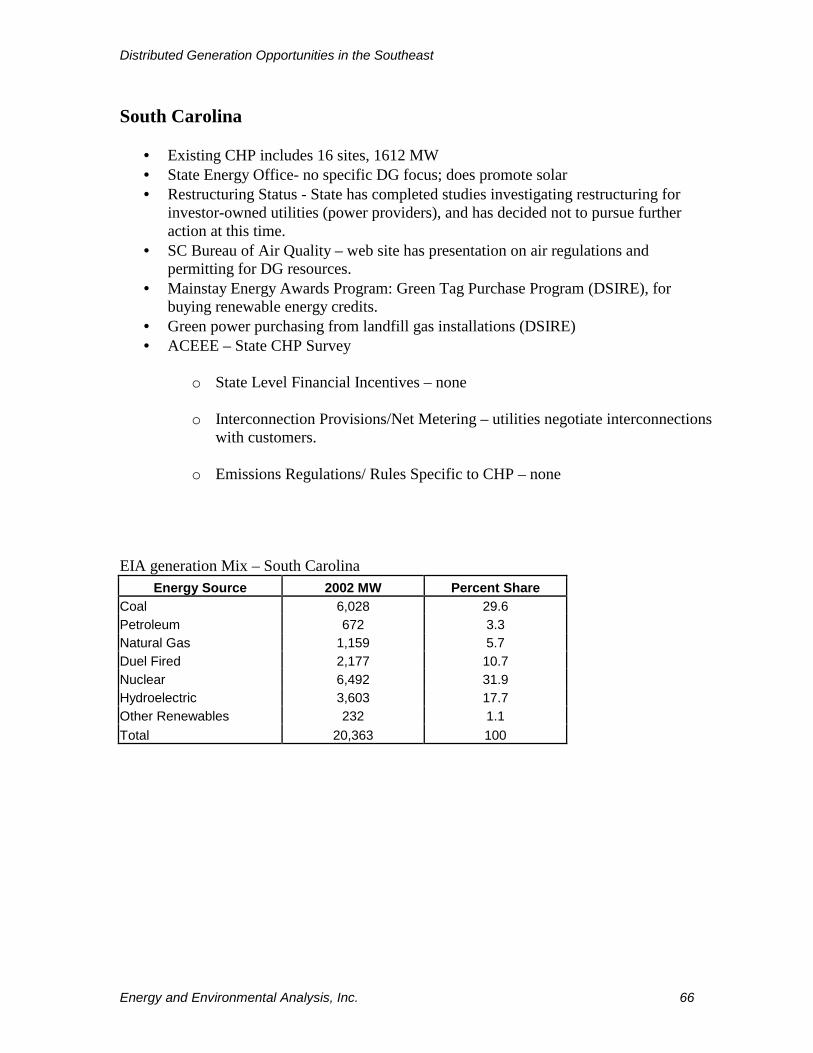
Distributed Generation Opportunities in the Southeast
Energy and Environmental Analysis, Inc. 66
South Carolina
• Existing CHP includes 16 sites, 1612 MW • State Energy Office- no specific DG focus; does promote solar • Restructuring Status - State has completed studies investigating restructuring for
investor-owned utilities (power providers), and has decided not to pursue further action at this time.
• SC Bureau of Air Quality – web site has presentation on air regulations and permitting for DG resources.
• Mainstay Energy Awards Program: Green Tag Purchase Program (DSIRE), for buying renewable energy credits.
• Green power purchasing from landfill gas installations (DSIRE) • ACEEE – State CHP Survey
o State Level Financial Incentives – none
o Interconnection Provisions/Net Metering – utilities negotiate interconnections
with customers.
o Emissions Regulations/ Rules Specific to CHP – none EIA generation Mix – South Carolina
Energy Source 2002 MW Percent Share Coal 6,028 29.6 Petroleum 672 3.3 Natural Gas 1,159 5.7 Duel Fired 2,177 10.7 Nuclear 6,492 31.9 Hydroelectric 3,603 17.7 Other Renewables 232 1.1 Total 20,363 100
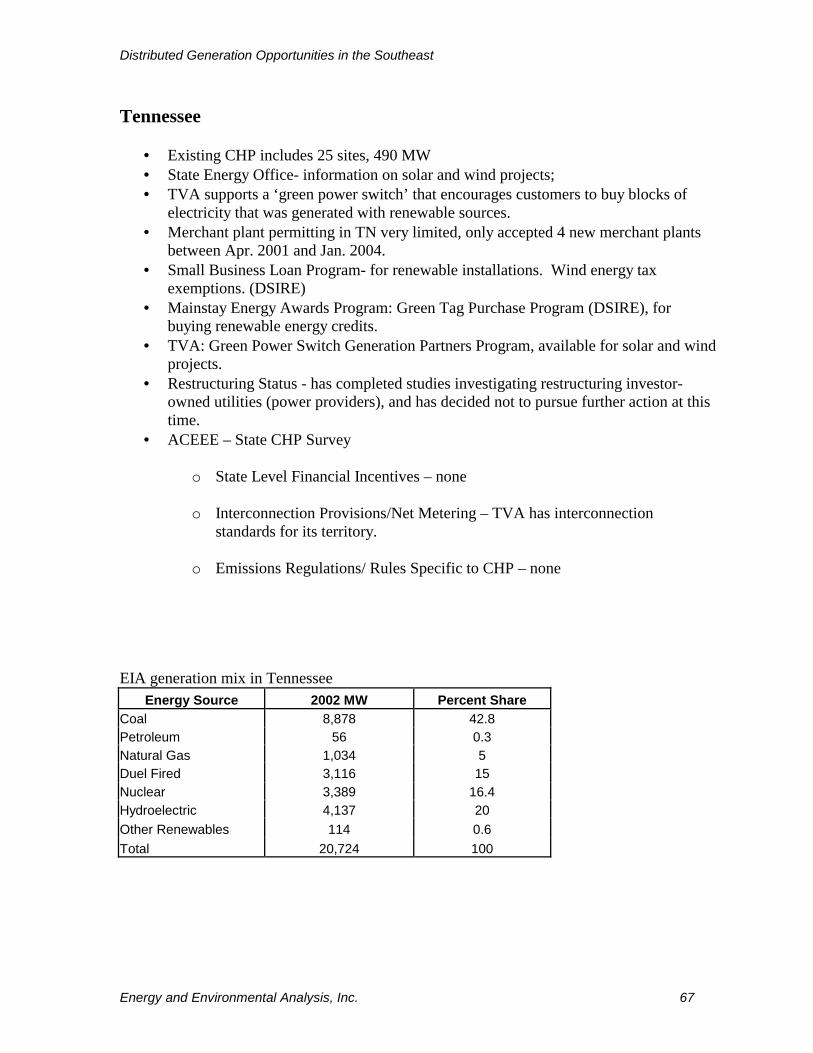
Distributed Generation Opportunities in the Southeast
Energy and Environmental Analysis, Inc. 67
Tennessee
• Existing CHP includes 25 sites, 490 MW • State Energy Office- information on solar and wind projects; • TVA supports a ‘green power switch’ that encourages customers to buy blocks of
electricity that was generated with renewable sources. • Merchant plant permitting in TN very limited, only accepted 4 new merchant plants
between Apr. 2001 and Jan. 2004. • Small Business Loan Program- for renewable installations. Wind energy tax
exemptions. (DSIRE) • Mainstay Energy Awards Program: Green Tag Purchase Program (DSIRE), for
buying renewable energy credits. • TVA: Green Power Switch Generation Partners Program, available for solar and wind
projects. • Restructuring Status - has completed studies investigating restructuring investor-
owned utilities (power providers), and has decided not to pursue further action at this time.
• ACEEE – State CHP Survey
o State Level Financial Incentives – none
o Interconnection Provisions/Net Metering – TVA has interconnection standards for its territory.
o Emissions Regulations/ Rules Specific to CHP – none EIA generation mix in Tennessee
Energy Source 2002 MW Percent Share Coal 8,878 42.8 Petroleum 56 0.3 Natural Gas 1,034 5 Duel Fired 3,116 15 Nuclear 3,389 16.4 Hydroelectric 4,137 20 Other Renewables 114 0.6 Total 20,724 100

Distributed Generation Opportunities in the Southeast
Energy and Environmental Analysis, Inc. 68
U.S. Virgin Islands
• State Energy Office- focus on million solar roofs initiative; energy efficiency and renewable rebate program (wind and solar included, maybe others)
• High cost of electricity, cited at $0.13/kWh on energy office website • Low reliability of utility grid makes backup generation critical, many hotels advertise
their generators. • Host to 2003 DER roadshow • Included in Southern States Energy Board
Puerto Rico
• Wind demonstration installation at Culebra, PR, partially funded by USDOE. • Puerto Rico Electric Power Authority (PREPA), a public corporation, is the sole
electric power distributor for Puerto Rico. PREPA operates five main power plants, primarily fueled by petroleum, with a total capacity of 4,393 megawatts.
• Tax deduction for alternate and renewable energy equipment (solar, wind). • Excise tax exemption for farming businesses – in agriculture sector, no excise tax on
renewable DG equipment. • Included in Southern States Energy Board • Plans to widen and/or diversify the electric power supply through co-generation and
agreements with independent power producers have not progressed due to opposition from environmental groups and labor unions. (EIA)
• Caribe Waste Technologies, in conjunction with Thermoselect, HDR Engineering, Zachry Construction Company, and Montenay Power, is moving forward with development of the first non-incineration waste-to-energy power plant in Puerto Rico. Initially proposed in 2000, the plant, to be built at Caguas, will use a gasification process that will break down approximately 3,300 tons per day of waste into basic elements and electricity. The company hopes to have the plant operational by July 2007.