Distributed Generation and the Impact on a PV Voltage Rise – Dan Harms, La Plata Electric...
33
Distributed Generation and the Impact on a Distribution System Brian Lassiter Technical Sales Engineer
Transcript of Distributed Generation and the Impact on a PV Voltage Rise – Dan Harms, La Plata Electric...

Distributed Generation and the Impact on a Distribution System
Brian LassiterTechnical Sales Engineer

Company Overview• Founded in 1989 in Abilene, TX• Industry leader in Engineering and
Operations Utility Software– WindMil & LightTable – T&D Circuit modeling
and engineering analysis– DisSPatch – Outage Management– Communications IVR
• Over 1,000 utilities, consultants, and universities use Milsoft Applications

Overview• Regulations• Typical DG Interconnections• Impact Studies• Utility Example• Summary


Installed Capacity by StateSolar Wind
State Installed MW State Installed MW
California 4,316 Texas 16,406
North Carolina 396 California 6,022
Nevada 339 Iowa 5,710
Massachusetts 308 Oklahoma 4,300
Alaska Does the sun shine here? Alaska (35th) 62

Regulations• Alaska Regulations – R-09-02
– Applicable to utilities subject to net metering requirements
– Requirements may be developed using, as applicable, standards from IEEE 1547
– Only 9 of 37 regulated utilities meet the criteria
– “some of the economically regulated utilities that do not meet net metering requirements are simply too small to be able to handle the interconnection of a DG of appreciable size”

1547 Series – Applicable Docs• 1547 – 2003 and 2014 Amendment 1-
Standard for Interconnecting Distributed Resources with Electric Power Systems
• 1547.2 – Application Guide for IEEE 1547 Standard for Interconnecting Distributed Resources with Electric Power Systems
• 1547.7 – 2013- Guide to Conducting Distribution Impact Studies for Distributed Resource Interconnection

IEEE 1547 System Impact Study Areas
• DER Grounding cannot cause over voltages on the EPS for ground faults
• Shall not energize the EPS when EPS is de-energized. Shall detect island and disconnect within 2 seconds
• Shall cease to energize the EPS for faults on the connected circuit
• Shall not reconnect until EPS voltage is maintained for 5 minutes within ANSI C84.1 Range B

IEEE 1547 System Impact Study Areas
• DER cannot actively regulate voltage• DER cannot adversely affect EPS
coordination• Shall cease to energize EPS when PCC
voltage falls outside of limits in voltage/clearing time table
• Shall not create objectionable flicker according to IEEE 519 or IEC 6000RDA

Other Resources• UL 1741• NRECA Toolkit• UWIG – library of turbines and analysis
tools available• FERC SGIP – Small Generator
Interconnection Procedure• FERC 661-A - Transmission
Interconnection

Generator Types

DG Types• Rotating Type
– Synchronous Generator (adjust kVAR by field winding)
– Induction(needs external source of excitation)– Wind Turbines Types 1-4 machine based
coupled with grid via converters(Types 3-4)• Inverter based PV

Load Behavior• Negative Load (kw/kVAR)
– kW based on sunshine or wind speed– Constant kVAR– PF Control Mode (Fixed PF) – kVAR adjust
with kW• VAR controlled to maintain voltage
– kVAR increases or decreases to offset voltage rise/drop(Synchronous Generators)

Impact Studies• Regulator Operations – the effect of DG
on the number of equipment operations performed by voltage regulation equipment(LTC, Regulators, Capacitors)
• System Voltage – DG impact on voltage delivered to connected loads
• Voltage Flicker – visible light flicker at end users
• System Protection – effects on OCDs and fault contribution of generators

Typical PV Daily Profiles• Content
0
1
2
3
4
0 6 12 18 24
Average Daily Profile
‐10
‐8
‐6
‐4
‐2
00 6 12 18 24
Average Daily Profile
‐8
‐6
‐4
‐2
0
2
4
0 6 12 18 24
Average Daily Profile

Load Models• Typical system planning studies use peak
loading• DG Interconnection studies require the
analysis of multiple load models– Max Peak– Min Load– Average Load– Different times of year

Load Models• Typical load data in EA systems
– Billing system Monthly kWh, Peak kW– SCADA Control Point Values– Substation Metering
• DG Simulations provide best results if AMI kW values are provided– Ability to analyze all loads at specific points in
time

Shortcomings of Typical Load Data• Traditional static load model is missing
time component• DG Output is highly variable over time• Control systems monitor load constantly,
not just at single instances in time• Time series analysis evaluates the
magnitude and frequency of the impact

AMI Load & Time Series Analysis• Typical intervals 1 hour or 15 mins• DG Interconnection requires shorter
interval to match up in frequency of PV load changes
• Interpolation of data may be required to acquire the desired load data

DG Variability• Estimating plant output requires data from
like systems• Irradiance/wind patterns can also be used
to determine DG estimated output for area being evaluated

Time Series Study Tools• OpenDSS• GridLab-D• Both great for analysis, but difficult to use
for system modeling• Some commercially available options• Milsoft WindMil provides exports of system
models to OpenDSS and GridLabD

Sample Impact Study• La Plata Electric – Durango, Co
– 41,000 Meters (12 per mile)– Winter Night Peaking– 650 DG Installations
• Used Peak and Min Load models• 80 kW Proposed Solar Site
– Single phase tap– 80 %AMI kW– 15% kWh– 5% non-AMI kW

Study Area
80 kW of solar generation

Analysis Voltage Profiles
110
112
114
116
118
120
122
124
126
0 1 2 3 4 5 6 7 8 9 10
Volta
ge
Miles from Source
Peak Loading Min Loading Min Loading w/ Generation

Peak Loading Voltage Profile
109
111
113
115
117
119
121
123
125
0 1 2 3 4 5 6 7 8 9 10
Volta
ge
Distance from Source
Peak Loading Meters ‐ Modeled Meters ‐ Actual

Min Loading with Generation
120
121
122
123
124
125
126
127
128
0 1 2 3 4 5 6 7 8 9 10
Volta
ge
Distance from Source
Min Loading w/ Generation Meters ‐ Modeled Meters ‐ Actual

Considerations• Utility looked at solution options for voltage
– Reconductor area– Installing Line Regulators
• Utility evaluates all interconnection projects
• Continue to evaluate areas with other existing generation in place– Several small DG of same type eventually
add up to larger impact

How much is too much?
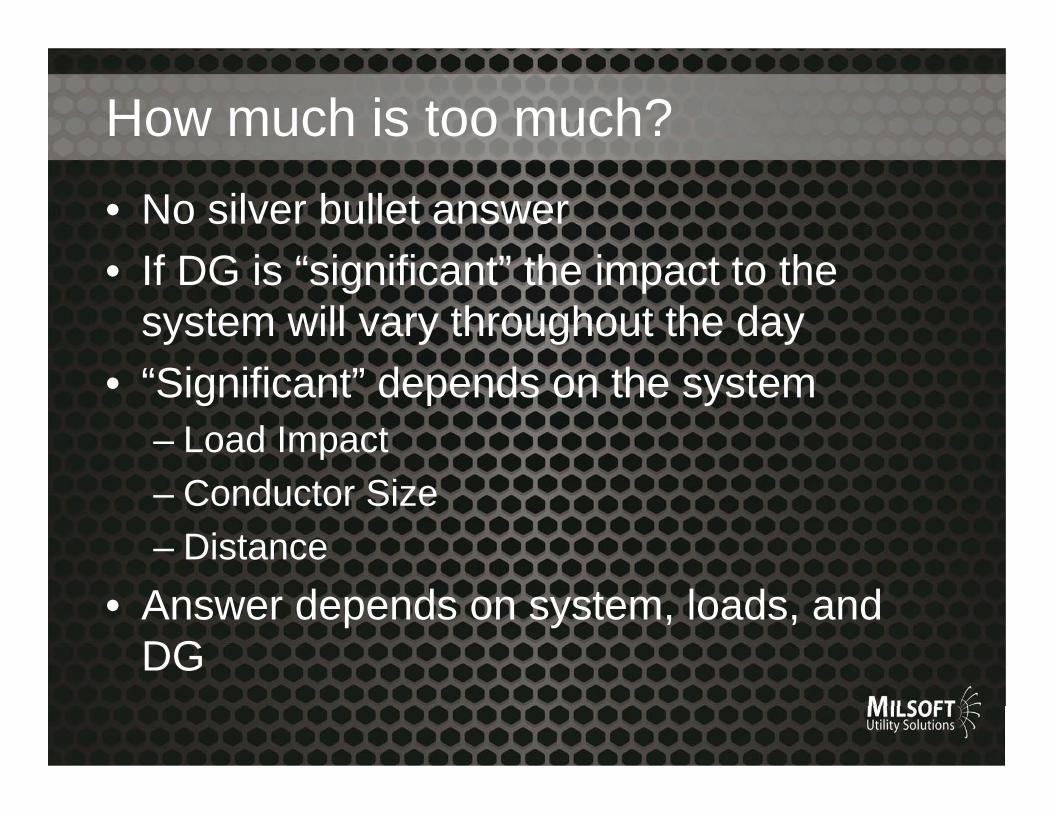
How much is too much?• No silver bullet answer• If DG is “significant” the impact to the
system will vary throughout the day• “Significant” depends on the system
– Load Impact– Conductor Size– Distance
• Answer depends on system, loads, and DG

Utility Hurdles• Interval Load Data
– Not only AMI system to get loads, but system to manage loads for retrieval
• Tracking DG installations(GIS, EA, CIS)– Not only impact of new system– Total impact of installed DG
• Loss of revenue vs. operating costs– System must still be designed as if DG
doesn’t exist

Questions/Comments

References• PV Voltage Rise – Dan Harms, La Plata Electric• DG Impacts on Distribution Systems – Greg Shirek, Milsoft• Sandia Report – Time Series Power Flow Analysis for Distribution
Connected PV Generation• Seia.org• Awea.org