Distributed Energy Resources in Nevada - SolarCity · Distributed Energy Resources in Nevada...
19
May 2016 Executive Summary Rooftop solar photovoltaics (PV) and distributed energy resources can deliver net benefits to Nevadans today and, if thoughtfully utilized, play a significant role in Nevada’s energy future. However, these benefits are not being fully realized in practice today. Narrow accounting of distributed resources’ contribution to the grid, financial disincentives embedded in utility regulatory models, and outdated grid planning procedures are preventing full utilization of these assets. But these obstacles can be readily overcome. Doing so will deliver benefits to all Nevadans, as well as cement Nevada’s position as a leader in the transition to a clean, resilient, and affordable electric grid. Rooftop Solar and Distributed Energy Resources Provide Net Benefits to All Nevadans This report presents an economic analysis of the benefit of harnessing distributed energy resources (DER) – assets like rooftop solar, smart inverters, energy storage, energy efficiency, controllable loads, and electric vehicles – to build and operate a 21 st century power grid. Such cost/benefit analyses are routinely performed across the industry; however, recent DER analyses in Nevada have not accounted for the full set of costs and benefits. Our analysis aims to provide a more complete accounting of the full costs and benefits of rooftop solar and DERs. To perform this cost/benefit analysis, we build on existing industry methodologies to calculate the net benefits of rooftop solar and DERs in Nevada. Specifically, we utilize the Nevada Net Energy Metering Public Tool, a model used to quantify the costs and benefits of distributed generation that Energy+Environmental Economics (E3) developed for the Public Utilities Commission of Nevada (PUCN) in July 2014. 1 Then, we utilize the costs and benefits specified by the PUCN in their December 2015 Order related to net energy metered (NEM) solar deployments, as well as in their April 2016 Procedural Order related to Sierra Pacific Power Company’s Integrated Resource Plan. 2,3 Using the Nevada Public Tool and the PUCN-specified benefit and cost categories, we find that deploying additional NEM rooftop solar would deliver positive net benefits to all Nevadans – whether or not they own solar and DERs. While a net cost would indicate that NEM is providing a subsidy to solar, our results conclude that the opposite is true: rooftop solar provides a net benefit to all Nevadans in the range of 1.6 to 3.4 cents per kilowatt-hour (kWh) of solar production, as depicted in the figure below (and detailed on page 12). 1.6 cents/kWh includes benefits that are directly captured by the utility, while 3.4 cents/kWh includes environmental externalities that benefit all Nevadans at large. Annual Net Benefits of 2017-2019 NEM Rooftop Solar Deployments $0.016 $0.034 $0.00 $0.02 $0.04 $0.06 $0.08 $0.10 $0.12 Benefits Costs Net Benefits (Excl. Environmental) Environmental Externalities Net Benefits + Environmental 2015 Levelized $ / kWh Distributed Energy Resources in Nevada Quantifying the net benefits of distributed energy resources
Transcript of Distributed Energy Resources in Nevada - SolarCity · Distributed Energy Resources in Nevada...

May 2016
Executive Summary
Rooftop solar photovoltaics (PV) and distributed energy resources can deliver net benefits to Nevadans today and, if thoughtfully utilized, play a significant role in Nevada’s energy future. However, these benefits are not being fully realized in practice today. Narrow accounting of distributed resources’ contribution to the grid, financial disincentives embedded in utility regulatory models, and outdated grid planning procedures are preventing full utilization of these assets. But these obstacles can be readily overcome. Doing so will deliver benefits to all Nevadans, as well as cement Nevada’s position as a leader in the transition to a clean, resilient, and affordable electric grid.
Rooftop Solar and Distributed Energy Resources Provide Net Benefits to All Nevadans
This report presents an economic analysis of the benefit of harnessing distributed energy resources (DER) – assets like rooftop solar, smart inverters, energy storage, energy efficiency, controllable loads, and electric vehicles – to build and operate a 21st century power grid. Such cost/benefit analyses are routinely performed across the industry; however, recent DER analyses in Nevada have not accounted for the full set of costs and benefits. Our analysis aims to provide a more complete accounting of the full costs and benefits of rooftop solar and DERs.
To perform this cost/benefit analysis, we build on existing industry methodologies to calculate the net benefits of rooftop solar and DERs in Nevada. Specifically, we utilize the Nevada Net Energy Metering Public Tool, a model used to quantify the costs and benefits of distributed generation that Energy+Environmental Economics (E3) developed for the Public Utilities Commission of Nevada (PUCN) in July 2014.1 Then, we utilize the costs and benefits specified by the PUCN in their December 2015 Order related to net energy metered (NEM) solar deployments, as well as in their April 2016 Procedural Order related to Sierra Pacific Power Company’s Integrated Resource Plan.2,3
Using the Nevada Public Tool and the PUCN-specified benefit and cost categories, we find that deploying additional NEM rooftop solar would deliver positive net benefits to all Nevadans – whether or not they own solar and DERs. While a net cost would indicate that NEM is providing a subsidy to solar, our results conclude that the opposite is true: rooftop solar provides a net benefit to all Nevadans in the range of 1.6 to 3.4 cents per kilowatt-hour (kWh) of solar production, as depicted in the figure below (and detailed on page 12). 1.6 cents/kWh includes benefits that are directly captured by the utility, while 3.4 cents/kWh includes environmental externalities that benefit all Nevadans at large.
Annual Net Benefits of 2017-2019 NEM Rooftop Solar Deployments
$0.016
$0.034
$0.00
$0.02
$0.04
$0.06
$0.08
$0.10
$0.12
Benefits Costs Net Benefits(Excl. Environmental)
EnvironmentalExternalities
Net Benefits+ Environmental
20
15
Le
veliz
ed
$ /
kW
h
Distributed Energy Resources in Nevada Quantifying the net benefits of distributed energy resources

www.solarcity.com/gridx | www.nrdc.org | Page 2
These results are important as they demonstrate that continued deployment of rooftop solar under NEM benefits all Nevadans. Utilizing this same methodology to assess the full set of costs and benefits for the roughly 23,000 existing rooftop solar systems currently deployed in Nevada,4 we calculate a net value of $7-14 million per year to all Nevadans. These benefits will increase over time as storage and load control are deployed alongside rooftop solar in the future.
Full Rooftop Solar and DER Benefits Should Be Accounted for in Cost/Benefit Analyses
While our analysis shows that all utility customers in Nevada benefit from rooftop solar and DERs, these benefits are not being fully captured under current Nevada regulatory cost/benefit analyses. Specifically, in December 2015, the Public Utilities Commission of Nevada stated in their NEM tariff order that “For other than the avoided energy and energy losses/line losses, there is insufficient time or data in this proceeding to assign a value to the other nine [benefit] variables.”5 Going forward, we offer our analysis as a resource to assign values to the “other nine variables” identified by the PUCN. Herein, we detail our methodology, assumptions, data, and sources to facilitate replication of our analysis in hopes that it will inform policy and regulatory discussions on the value of solar and DERs under NEM.
Utility Financial Disincentives are a Barrier to Capturing DER Benefits
Many utilities – including NV Energy (NVE) – earn shareholder profit by building more infrastructure and selling more electricity to customers. Under this paradigm, utilities see a negative financial impact from procuring grid services from resources that they do not own – which includes the vast majority of DERs – even if those assets provide reliable service at a lower cost. This traditional utility model was established at the industry’s start to encourage the expansion of electricity access across the country. However, in this age of customers managing their own energy via DERs, the original regulatory model is outdated. An updated approach should consider the range of services that customers desire, and then form market and procurement structures to provide those services at the lowest total cost to society, irrespective of where the service is derived. Furthermore, the financial disincentive that currently biases utility decision-making against DERs needs to be removed, encouraging grid planning to deploy grid investments that maximize customer benefits regardless of ownership structure.
Grid Planning Should be Modernized in Order to Capture DER Benefits
A second structural impediment to realizing DER benefits is the current grid planning approach, which, by providing little attention to actions on the customer-side-of-the-meter, biases grid design toward traditional infrastructure, even if distributed solutions better meet grid needs. Combined with the utilities’ financial incentive to build more infrastructure and sell more electricity, traditional utility planning can encourage overinvestment in grid infrastructure. Furthermore, outdated planning approaches rely on static assumptions about DERs’ capabilities and focus primarily on mitigating potential integration challenges rather than proactively harnessing these flexible assets. This report recommends modernizing grid planning, calling for the utilization of an Integrated Distribution Planning6 approach that encourages incorporating DERs into every aspect of planning rather than merely accommodating DER interconnection.
Key Takeaways
This analysis performs a more complete accounting of the costs and benefits of rooftop solar deployments under NEM utilizing the cost and benefit categories identified by the Public Utilities Commission of Nevada and methodologies embedded in the Nevada Net Energy Metering Public Tool.
Utilizing the PUCN cost/benefit categories and the Nevada NEM Public Tool, rooftop solar deployments under NEM offer net benefits to all Nevadan utility customers of between 1.6 and 3.4 cents per kilowatt-hour for deployments during 2017-2019.
Utilizing the PUCN cost/benefit categories and the Nevada NEM Public Tool, Nevada’s roughly 23,000 existing NEM rooftop solar customers already provide net benefits to all Nevadans of $7-14 million per year.
Utility financial disincentives should be mitigated and utility planning processes should be modernized in order to remove barriers to capturing the value that distributed energy resources provide to the grid and customers.

www.solarcity.com/gridx | www.nrdc.org | Page 3
Recommendations and Next Steps
Our ultimate goal in performing and disseminating this analysis is to provide a perspective useful for regulators, legislatures, utilities, DER providers, and industry stakeholders to consider as we transition to a cleaner, more affordable and resilient grid. To that end, we offer the following recommendations:
Distributed energy resource cost/benefit analyses and associated regulatory proceedings should utilize the expanded benefit and cost categories identified by the Public Utilities Commission of Nevada at a minimum, and ideally the full list of categories identified in this paper.
Regulators pursue opportunities to remove or mitigate the utility financial disincentive that currently biases decision-making against utilizing distributed energy resources, favoring utility-owned infrastructure instead.
Utilities should modernize grid planning processes and utilize integrated distribution planning to fully leverage distributed energy resources into grid design and operations.
Acknowledgements
We would like to thank the following academics and industry stakeholders who provided their peer review for this paper. While we incorporated their input to every extent possible, we, SolarCity and the Natural Resources Defense Council, are solely responsible for the information presented and the conclusions drawn in the report.
Mark Z. Jacobson, Ph.D. Joshua Eichman, Ph.D. Tim Yeskoo, M.S. Professor of Civil & Environmental Engineering Visiting Scholar Ph.D. Candidate Director of Atmosphere/Energy Program Department of Civil and Department of Civil and Senior Fellow, Precourt Institute for Energy Environmental Engineering Environmental Engineering
Daniel Lashof, Ph.D. Virginia Lacy Michael O’Boyle Chief Operating Officer Principal, Electricity Practice Policy Analyst NextGen Climate America, Inc. Rocky Mountain Institute Energy Innovation

www.solarcity.com/gridx | www.nrdc.org | Page 4
I. Nevada’s Distributed Energy Resources Benefit All Customers
This report first focuses on quantifying the benefits that rooftop solar and DERs can offer to all Nevadans, whether they individually deploy such systems or not. We build upon existing cost/benefit methodologies – which have already been applied by industry leaders in Nevada – while introducing updated methods for hard-to-quantify DER benefit categories that are excluded from traditional analyses. In the following section we define and establish the historical context of our methodology, with more details provided in the Appendix.
The Value of DERs within Nevada In July 2014, the energy consulting firm Energy+Environmental Economics (E3) published a report for the Public Utilities Commission of Nevada that evaluated the impacts of net energy metering in Nevada.8 The results were based upon input from a diverse working group of stakeholders and an avoided cost model that parties used to determine the impact of net energy metering from a range of stakeholder perspectives. This model was codified in a Nevada Public Tool, a spreadsheet-based tool used to quantify the costs and benefits of NEM rooftop solar. While a variety of scenarios and timeframes were explored in their analysis, E3 ultimately estimated a total net present value for 2004-2016 NEM systems to all Nevada utility customers of $36 million during the systems’ lifetimes.9 An E3 scenario focused on 2016 installations alone concluded that a net benefit of 1 cent was transferred to all utility customers for every kWh of energy produced by solar customers. Although the analysis improved the state of cost/benefit analyses in Nevada, the results from E3’s July 2014 report to the PUCN were incomplete. The E3 analysis omitted some categories of avoided costs due to the complexity of valuing them, and rapid changes in DER technologies over the past few years have expanded the set of benefits that DERs are capable of providing. Therefore, in this report we expand upon the prior E3 work by considering a fuller scope of benefits and costs, updating the DER valuation framework to be consistent with the PUCN’s Order,10 and incorporating newer benefit categories that have been overlooked. Furthermore, all underlying assumptions are refreshed with the latest data available to reflect current conditions and expectations of the future, including lower natural gas prices and renewable energy certificate values from utility-scale solar.
Analysis Scope and Assumed Scenarios This report evaluates the electric system and environmental benefits of continued DER deployment, the associated customer costs, and the resulting net cost/benefit to all utility customers in Nevada. This perspective, which is often called the Ratepayer Impact Measure (RIM) calculation, quantifies the impact of DER adoption on all utility customers, including customers who do not own or deploy DERs on their own properties.
Description of Analysis Scope
Net Benefit or Cost = Total Benefits to All Utility Customers – Total Costs to All Utility Customers
Total Benefits The benefits that accrue to all utility customers from DER deployment.
Total Costs The costs that all utility customers incur as a result of DER deployment.
Net Benefits or Costs
The value to DER and non-DER customers of continued deployment of DERs, defined as the benefits less the costs.
The benefits and costs of DERs are dependent on the types and quantities of DERs deployed. This analysis specifies two DER deployment scenarios to illustrate reasonable potential deployments of DERs over the near- and medium-term in Nevada, which are informed by solar deployment statistics to date in Nevada as well as other geographies in the United States. The first scenario focuses on the near-term (2017-2019) period and assumes continued deployment of net energy metered rooftop solar paired with smart inverters, which will become standard with most rooftop solar installations after the forthcoming finalization of the IEEE 1547 standard and accompanying inverter certifications (expected in 2016). For the medium-term (2020-2022), we consider a scenario whereby new DER customers are required to adopt a time-of-use rate as a condition of receiving NEM billing credits. In this second scenario, we assume that customers deploy a suite of DERs, including rooftop solar, smart inverters, batteries, and load control devices.
In July 2014, E3 estimated a total net present value benefit of 2004-2016 NEM systems to non-participating customers of $36 million during the systems’ lifetimes.7

www.solarcity.com/gridx | www.nrdc.org | Page 5
DER Deployment Scenarios
Timeframe DERs Deployed Rate Evaluation
2017-2019 Solar + Smart Inverters Net Energy Metering Quantitative and Qualitative
2020-2022 Solar + Smart Inverters + Storage + Load Control
Net Energy Metering with Mandatory Time-of-Use Rates
Qualitative
DER benefits and costs also depend on overall DER penetration levels. Some benefits – such as capacity value – may exhibit diminishing returns at higher penetration levels, while other benefits – such as resiliency – may be more readily captured at higher penetration levels. Similarly, lower DER penetration generally triggers fewer integration costs, while higher penetration may lead to increased investment. As depicted in the following chart, NEM PV penetration levels vary across the U.S.11 Most states have very low (<5%) penetrations, while only Hawaii experiences medium (10-20%) penetration. Nevada (not pictured in chart) exhibits rooftop solar penetration at roughly 3% of system peak.12 Due to the low existing penetration and moderate adoption forecasts, costs and benefits are not expected to vary materially during the timeframes examined.
NEM Solar Capacity as a Percentage of Total System Peak
In the following sections, these scenarios are evaluated both qualitatively and quantitatively under a cost/benefit framework that is grounded in established methodologies and tools, but enhanced to consider how the electric system would be operated to fully leverage DERs. The study consolidates a range of existing analyses, reports, and methodologies on DERs into one place, supporting a holistic assessment of the energy policy pathways facing Nevada today.
II. Quantifying Costs and Benefits of DERs
There have been a variety of cost and benefit categories considered in Nevada policy and regulatory analyses over the past two years. E3’s Nevada Public Tool and corresponding study incorporated cost and benefit categories generally considered standard across industry programs, including energy efficiency, demand response, and distributed generation programs. In 2015, the Public Utilities Commission of Nevada identified 11 categories of benefits and costs that should be evaluated to “determine the possible value/detriment of [NEM]”. However, in December 2015, the PUCN’s NEM Tariff Order considered only two categories – energy and energy losses – when making its decision, citing “insufficient time or data in this proceeding to assign a value to the other nine variables.”13 More recently in April 2016, the Commission stipulated additional cost/benefit categories to be considered in Sierra Pacific’s upcoming Integrated Resource Plan (IRP).14 In the table below, we depict the evolution of cost/benefit categories considered in various Nevada studies, as well as the list of categories quantified in this paper, each of which we discuss in detail in the following sections.

www.solarcity.com/gridx | www.nrdc.org | Page 6
Quantified Cost/Benefit Categories in Nevada (2014-2016)15
Categories
E3 NEM Study
(July 2014)
PUCN NEM Order
(Fall 2015)
PUCN NEM Decision
(Dec 2015)
PUCN Order: Sierra Pac IRP (April 2016)
Study Scope (May 2016)
Benefits
Energy
Line Losses
Generation Capacity
Ancillary Services
Transmission Capacity
Distribution Capacity
CO2 Regulatory Price
Voltage Support
Criteria Pollutants
Fuel Hedging / Diversity
Environmental Externalities
Costs
Utility Administration
Utility Integration
Participant Bill Savings
To quantify each benefit and cost category, we utilize the Nevada Public Tool to the greatest extent possible. This spreadsheet-based cost/benefit model was created in 2014 by E3 based on input from the multi-stakeholder group convened by the Public Utilities Commission of Nevada. In performing our analysis, we update all relevant assumptions in the E3 tool with the most up-to-date data available. For the few categories that could not be quantified directly with the E3 tool, we make conservative methodological choices in an attempt to estimate all relevant categories identified by the PUCN. Note that we exclude Fuel Hedging/Diversity from our analysis given the lack of fuel hedging data available in Nevada. All data inputs and methodological updates are discussed in the following section and further detailed in the Appendix.
A. Benefits Categories Quantified in This Report
In the following sections, E3's original valuation methodology is discussed alongside our updates to data and assumptions as performed in May 2016, as well as the directional impact of our updates versus the original E3 analysis. While we attempt to ensure that our updates reflect current market dynamics, our ability to update the Nevada Public Tool is sometimes constrained due to lack of access to confidential underlying data. For example, hourly production cost results are not publicly available within the Nevada Public Tool, which limits some of our updates to the original E3 methodology.
Energy The energy category reflects an estimate of the hourly marginal wholesale value of that energy that is avoided by distributed generation. Hourly wholesale values are based on production simulation runs from NV Energy’s 2013 IRP. These simulations produced energy prices for each utility from 2014 through 2043. By default, the energy prices include a carbon price beginning in 2018, but are excluded from this category to drive clarity between energy and CO2 compliance costs. May 2016 Updates: A major market development since the original E3 study is the dramatic drop in natural gas prices. We reflect this drop within the Nevada Public Tool by deriving an annual negative multiplier on the energy avoided cost value. This multiplier is derived by comparing historical gas forwards from the timeframe when the 2014 study was developed to current gas forward curves from NYMEX. These negative multipliers are then applied to the annual energy avoided cost values within the original E3 study. Specific yearly multipliers are shown in the Appendix. Directional Impact of Updates: These changes reduce the forecasted energy cost and thus the value of avoiding those costs. On a levelized basis, this update reduces the energy avoided costs from 5.0 cents per kWh in the original study to 3.7 cents per kWh in our updated analysis.

www.solarcity.com/gridx | www.nrdc.org | Page 7
Energy Line Losses The value of avoided line losses is meant to account for losses between the point where energy is generated and the point where it is consumed. E3 calculates losses as a function of hourly load based on NVE North’s 2013 General Rate Case (GRC) and NVE South’s 2011 GRC. May 2016 Updates: We rely on E3’s methodology, but apply the same set of annual adjustors that we applied to avoided energy value. This adjustment is necessary since the value of avoiding losses is a function of underlying energy prices. Directional Impact of Updates: Similar to the energy category updates, these changes reduce the forecasted cost of energy line losses associated with bulk system generation and thus the value of rooftop solar in avoiding those costs.
Generation Capacity Avoided generation capacity is measured as the contribution of DERs towards meeting system capacity and reliability needs. In years when NV Energy has a capacity surplus, this value is calculated as the fixed O&M cost of a natural gas combustion turbine, which is assumed to be the least cost resource. After the year NVE would otherwise need to build new capacity (also known as the resource balance year), the capacity cost is calculated as the net cost of building new generation capacity above what can be earned in energy and ancillary service markets. After calculating the annual capacity value, the E3 model attributes that value to individual hours using hourly Normalized Loss of Load Probability (LOLP) from NVE’s most recent GRC.
May 2016 Updates: E3’s unmodified values are utilized. However, given the low avoided energy value assumptions, we believe that avoided generation capacity would be higher in practice. Therefore, we contend that utilizing E3’s base values is conservative. See more detailed discussion of the conservative nature of this approach in the Appendix. Directional Impact of Updates: None.
Ancillary Services Ancillary services requirements are often based on forecasted load, and these requirements can be lower to the extent that load is reduced by DERs. E3 used estimates from NVE of total production costs and spinning reserve spending from 2014 to 2018 and found that spinning reserves represented 0.5% to 2% of total energy spending over those years. This percentage of total energy costs is used as an approximation of the value of ancillary services. May 2016 Updates: We rely on the E3 methodology, but apply the same set of annual adjustors that are applied to the avoided energy value. While the value of ancillary services is not as directly tied to the underlying energy prices as line losses, the opportunity cost of not participating in the energy market is often the basis for ancillary service payments. Furthermore, E3’s approximation of ancillary services value is derived based on a percentage of total energy production cost. For this reason, adjusting for gas price in the same way is a reasonable approximation of the value of future ancillary services. Directional Impact of Updates: None.
Transmission Capacity An estimate of the cost of expanding transmission capacity to meet peak system loads drives the value of transmission capacity avoided cost. Transmission cost is allocated to individual hours using the hourly Normalized Probability of Peak (POP) for the transmission system from NV Energy’s most recent GRCs. May 2016 Updates: We relied on the E3 methodology and made no additional changes. Directional Impact of Updates: None.

www.solarcity.com/gridx | www.nrdc.org | Page 8
Distribution Capacity This category is defined as the cost of expanding distribution capacity to meet customer peak loads. For the original E3 study, NV Energy provided average system-wide $/kW cost of distribution upgrades, which were then attributed to individual hours using the Normalized Probability of Peak (POP) for the distribution system from NV Energy’s most recent GRCs. Distribution Capacity was included in the E3 tool in this manner, but was excluded from the base scenario within the study based on input from the multi-stakeholder advisory group. E3’s description below details the rationale of this decision:
“Distribution avoided costs is not included in the base case because NV Energy distribution engineers do not consider the intermittent output of NEM systems reliable enough to avoid the need for distribution system upgrades. In reality, some portion of distribution upgrades could probably reliably defer some distribution upgrades, though distribution planning processes would need to be modified to actually capture the distribution value…based on our assessment, NEM generation could become a net benefit to…Nevada with the inclusion of distribution benefits.”16
May 2016 Updates: In order to capture the avoided distribution costs that can materialize through enhanced planning processes, our analysis includes distribution avoided costs in the same way that E3 did in their sensitivity case. We agree that distribution avoided costs rely on improvements in utility distribution planning so as to properly recognize the potential of DERs to avoid capital investments and operating expenses. That being said, such change in utility planning is feasible and likely over the course of the useful life of these DER assets. Thus, we include distribution capacity benefits in this analysis. Directional Impact of Updates: While there was no change to E3’s quantification of the distribution value category, the inclusion of distribution capacity in the scope of our study increases the value of rooftop solar compared to E3’s Base Case, which excluded distribution capacity for the reasons described above.
CO2 Regulatory Price CO2 emissions include the regulatory price of carbon emissions that are associated with fossil fuel combustion, which is based on NVE’s carbon price forecast and its hourly production-simulation runs from its 2013 IRP. The price forecast for CO2 allowances is based on NVE’s estimate of compliance costs with the Clean Power Plan starting in 2019. The societal cost of carbon is not captured in the regulatory price, and is instead captured as an externality under Environmental Costs. May 2016 Updates: We do not change E3’s underlying methodology based on NVE’s IRP, but report the value separately to remain consistent with the PUCN’s recent Order that separate energy and CO2 emissions into distinct categories. Directional Impact of Updates: None.
Voltage Support While E3 did not consider this category in their 2014 study, we introduce a methodology for calculating its value, which is distinct from the distribution capacity avoided cost described above. Utilities must supply power to end-users within industry-standards power quality standards. The range of allowable voltage, an aspect of power quality, is set by American National Standards Institute (ANSI) standards. In practice, because of losses as power flows to the edge of the distribution system, utilities generally over-supply voltage to customers, using engineering rules-of-thumb to ensure customers at the “end of the line” have acceptable voltage. To address this inefficiency, utilities are increasingly deploying Conservation Voltage Reduction (CVR) programs, a demand reduction and energy efficiency technique that reduces customer service voltages in order to achieve a corresponding reduction in energy consumption. Better-dispersed voltage sensors allow utilities to see voltage in real-time and ensure customers receive the minimum amount of voltage necessary for safe and efficient operation of electricity-consuming devices. These CVR programs are often implemented system-wide or on large portions of a utility’s distribution grid in order to conserve energy, save customers on their energy bills, and reduce greenhouse gas emissions, typically saving up to 4% of energy consumption on any distribution circuit.17 CVR programs typically control distribution voltage regulating equipment, changes to which affect all customers downstream of any specific device. As such, CVR benefits in practice are limited by the lowest customer voltage in any voltage regulation zone (often a portion of a distribution circuit), because dropping the voltage any further would violate ANSI standards. Since smart inverters can increase or decrease the voltage at any individual location, DERs with smart inverters can be used to

www.solarcity.com/gridx | www.nrdc.org | Page 9
more granularly control customer voltages where there are active CVR programs. For example, if the lowest customer voltage in a utility voltage regulation zone were to be increased by 1 Volt via controlling a local smart inverter, the entire voltage regulation zone could then be subsequently lowered another Volt, delivering substantially increased CVR benefits. May 2016 Updates: Voltage and power quality support was not included in the E3 framework, but was included in the PUCN’s most recent directive for Sierra Pacific’s IRP. Thus, we include a modeled result here to drive consistency and recognize there are new value streams from the deployment of the latest technologies. Based on analysis of SolarCity smart inverter field demonstration projects, the utilization of smart inverters in a CVR scheme has the potential to yield another 0.4% of incremental energy consumption savings and greenhouse gas emissions reductions.18 Nevada-specific distribution data would allow more accurate quantification of this category, although none is publicly available. For the purposes of this analysis, we assume the grid operator will be able to realize the benefits of smart inverters in 2017+ within an active CVR program. See the Appendix for a detailed discussion of methodology. Directional Impact of Updates: This category has a positive impact on the net benefit of smart inverter-connected DERs.
Environmental Externalities Environmental costs include externalities that impact land use and water use, among others, but this report only focuses on capturing the social cost of carbon. Environmental cost values are often difficult to quantify but are important from a long-term policy perspective, since all customers are members of society. May 2016 Updates: E3 did not include the social cost of carbon in its CO2 cost, so we include the difference between the social cost of carbon and regulatory price of carbon from NVE’s IRP production cost simulations in Environmental Externalities. The regulatory price of carbon is already reflected in the CO2 cost category. By only capturing the difference between social and regulatory cost of carbon in this category, we ensure there is no double counting of the social benefit of carbon reductions. The social cost of carbon is assumed to be the Environmental Protection Agency’s 2015 social cost of carbon with a 3% average societal discount rate, which is $36/metric ton.19 In reality, the social cost of carbon is unknown and evolving constantly with improved understanding of the impacts of climate change. The latest published numbers for the social cost of carbon are significantly higher. For example, a peer-reviewed study from 2015 in the academic journal Energy & Environmental Science focused on state-level impacts, estimating a social cost of $500/metric ton in Nevada that costs the state $20.9 billion per year in 2050, or approximately 12.9 cents/kWh in 2013 dollars when divided by the state’s end-use energy in all sectors.20 We highlight these peer-reviewed findings to draw attention to the upper range of the academic literature, but do not rely on these numbers in this analysis, opting to use EPA’s more conservative mid-range value. Directional Impact of Updates: In this analysis, we identify Environmental Externalities as societal benefits and separate these benefits from the base avoided costs net benefit quantification. However, including the social cost of carbon associated with fossil fuel combustion increases the value of rooftop solar in the societal benefits perspective.
Criteria Pollutants This category assesses health impacts from criteria pollutants, including premature mortality and respiratory illness costs. May 2016 Updates: We rely on the E3 methodology to quantify this value, which is based directly on NV Energy’s 2013 IRP that included an estimate of the monetary health net benefits of avoiding fossil fuel combustion, which was approximately 0.1 cents/kWh. Similar to the social cost of carbon, however, a recent academic study of the health impacts and costs of criteria pollutants suggests this number is significantly underestimated. While we do not use these higher estimates in our analysis, we note that more up-to-date studies based on detailed costs based on real health impact data for the state of Nevada found significantly higher costs associated with criteria pollutants, estimating an annual cost to the state of $8.3 billion per year, or 5.1 cents/kWh when applied to the state’s end-user energy in all sectors.21 Directional Impact of Updates: None.

www.solarcity.com/gridx | www.nrdc.org | Page 10
B. Costs
As presented above, distributed resources offer significant customer benefits; however, these benefits are not available without incurring incremental costs to enable their deployment. In order to quantify the net societal benefit of DERs, these costs must be subtracted from the benefits. Costs for distributed energy resources include utility integration of variable energy resources, utility program management, and participant bill savings.
Utility Integration and Interconnection Costs
The utility forecasts additional operational costs when it acts to adjust to sudden changes in renewable output, referred to as integration costs. These costs typically fall into increases in regulation reserve requirements, load following reserve requirements, and other ancillary services. E3 conducted a literature review and selected an integration cost adder of $2/MWh, based on the current low penetration of intermittent renewable energy within Nevada compared to other states. May 2016 Updates: We relied on the E3 methodology and made no additional changes. Directional Impact of Updates: None.
Utility Administration Costs Program costs are the costs to the utility of implementing and maintaining the NEM program. NV Energy’s program costs include a one-time cost associated with installing a bi-directional meter, as well as ongoing annual administrative expenses. May 2016 Updates: We relied on the E3 methodology and made no additional changes. Directional Impact of Updates: None.
Participant Bill Savings Given the utility’s regulated guarantee to recover the costs of prudent investments, NEM customer bill savings are treated as a cost in cost/benefit analyses. Bill savings are the difference between what a NEM customer’s bill would have been without PV and the same customer’s bill with PV. E3 developed a calculator to quantify this cost. May 2016 Updates: E3’s bill calculator was updated to reflect 2016 rates, which are lower than 2014 rates. Based on today’s rates, a typical NEM customer would save 9.5 cents per kWh of solar production. Rates were assumed to escalate at 0.5% per year through 2020, as estimated by NVE in their 2013 IRP. Beyond 2020, E3 created two scenarios: one that continued the 0.5% escalation rate for the entire forecast period, and one that increased the rate to 1.4% per year, driven by a gas price forecast which escalated at 3.5%. Given the decrease over the past two years in gas prices and forwards, we use E3’s lower estimate of utility rate escalation through the 2017-2041 period. Directional Impact of Updates: By reducing the participant bill savings, the cost of NEM decreases from the non-participant perspective, increasing the net benefit of rooftop solar under the ratepayer impact measure (RIM) test.
C. Results In this section, we compute the results for the cost and benefit categories, discuss the significance of these results, and identify methodological critiques and areas for future analysis.
Discussion of Results In the table below, we show the results of both a limited scope and full scope sensitivity for rooftop solar deployed today. The full scope includes the societal cost of carbon, an externality not directly reflected in utility rates, and is an appropriate evaluation lens from a policymaker perspective. The limited scope provides a more conservative evaluation that focuses only on categories explicitly in the utility cost function, which are directly passed through to customers in utility rates.
www.solarcity.com/gridx | www.nrdc.org | Page 11
Annual Net Benefits of 2017-2019 NEM Rooftop Solar Deployments
Type Benefit and Cost Category Net Benefits
(Excl. Environmental) Net Benefits
+ Environmental
2015 Levelized cents/kWh
Benefits
Energy 3.7 Same
Line Losses 0.4 Same
Generation Capacity 2.6 Same
Ancillary Services 0.1 Same
Transmission & Distribution Capacity 2.8 Same
CO2 Regulatory Price 0.9 Same
Voltage Support 0.9 Same
Criteria Pollutants Not included 0.1*
Environmental Externalities Not included 1.7*
Total Benefits 11.4 13.2
Costs
Program Costs 0.1 Same
Integration Costs 0.2 Same
Participant Bill Savings 9.5 Same
Total Costs 9.8 9.8
Total Net Benefits 1.6 cents/kWh 3.4 cents/kWh
*More recent academic studies estimate the criteria pollutants cost to be up to 5 cents/kWh22 and the social cost of carbon to be as high as 12 cents/kWh in Nevada.23
Our results demonstrate that there is a net benefit from rooftop solar production. At the low end, the net benefit is 1.6 cents per kWh, which only accounts for values that can be directly realized by the utility. At the high end, we incorporate externalities such as the social cost of carbon and the health impact of criteria pollutants and find a net benefit of 3.4 cents per kWh. Within this framework, a net benefit means that each additional rooftop PV installation in Nevada can provide positive value to all Nevadan utility customers – whether they own rooftop solar and DERs or not. In contrast, a net cost would indicate that NEM customers’ utility bill savings exceed the costs their systems help avoid, effectively shifting responsibility of covering the utility’s revenue requirement to non-participants. These results are significant as they demonstrate that continued deployment of rooftop PV under NEM can benefit all Nevadan customers when the full range of benefits are taken into account. Assessing this full set of ongoing costs and benefits from the roughly 257 megawatts (MW) of existing NEM solar systems already deployed or in the pipeline in Nevada,24 we calculate a net value of $7-14 million per year to all Nevadan utility customers. These benefits will increase over time as additional DER technologies are deployed alongside rooftop solar, a topic explored in the following sections.
Methodological Critiques Net benefit tests provide estimates for policymakers, regulators and other decision makers to evaluate potential policy and their impacts. However, these studies are necessarily simplified given uncertainty about future conditions that are exogenous variables in the models, and variation in location-specific grid benefits and costs. Additionally, some categories are easier to quantify given observable prices and input assumptions (e.g. energy), while others are more difficult as they involve allocating fixed costs to certain times (e.g. capacity). Other categories are difficult to quantify because their values are not precisely known (e.g. environmental externalities). We acknowledge these uncertainties are real and that no model will perfectly predict future benefits and costs. However, while the application of these net benefit tests to organic adoption of DERs requires establishing methodologies for new categories and modifying methodologies for existing categories, the challenge of quantifying costs and benefits of an uncertain future is not new. Since its inception, the power industry has grappled with how to value long-term infrastructure investments in an uncertain and constantly changing grid. Ultimately, the ‘true’ net benefit of any resource can only be determined in hindsight, if at all. This uncertainty is normal and should not be paralyzing. In the face of uncertainty, regulators should rely on transparent analyses that consider all the benefits and costs to provide guideposts on setting policy.
www.solarcity.com/gridx | www.nrdc.org | Page 12
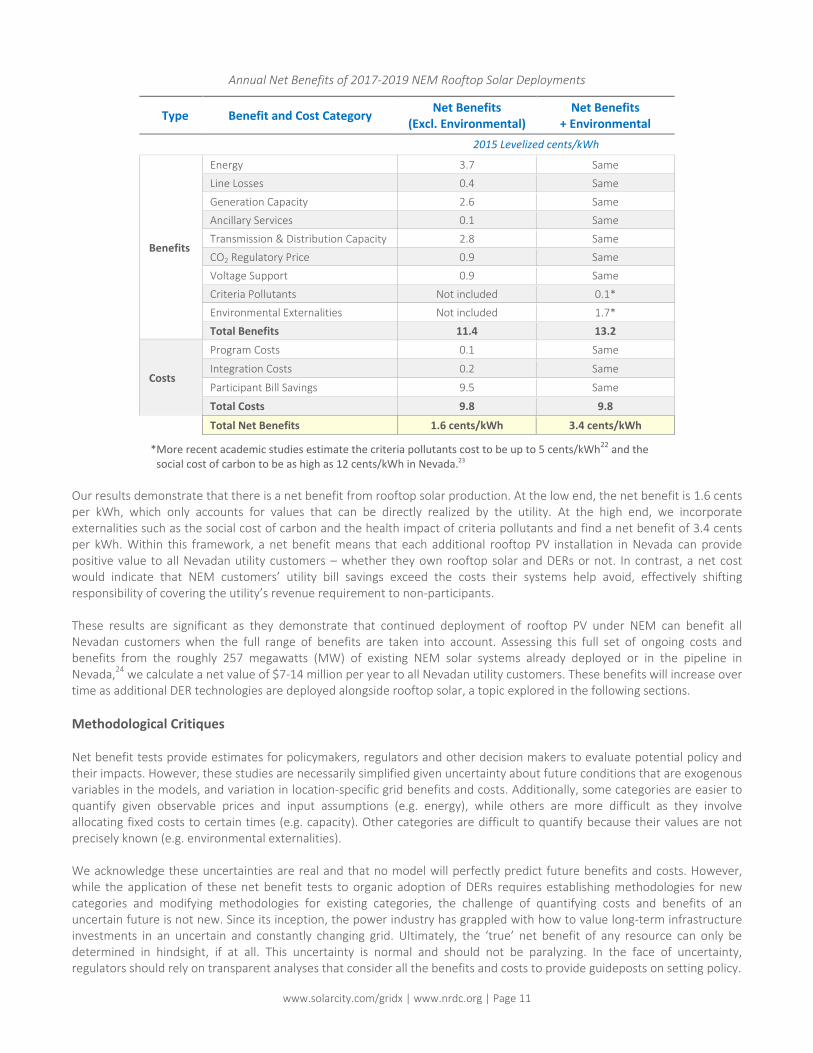
Impact of Storage and Load Control on Results In order to better evaluate the future potential of DERs, we next considered how the net benefit framework would be impacted by a fuller suite of technology deployments in the 2020-2022 period, including solar, smart inverters, energy storage, controllable thermostats and other controllable loads. This scenario would be relevant to policymakers in a future scenario that requires new DER customers to adopt a time-of-use rate as a condition of receiving NEM billing credits. Given the less deterministic nature of operating energy storage and load control devices compared to rooftop solar, we refrain from assigning values to specific categories that would be speculative without access to more granular data on system needs and prices. Instead, we highlight categories of benefits that would be most impacted by the adoption of energy storage, controllable thermostats and other controllable loads by customers. These flexible and dispatchable assets offer incremental benefits to the grid, primarily in the form of capacity to the bulk and distribution systems, by shifting demand and generation to the highest value periods.
Qualitative Impact of Storage and Load Control on Benefits of 2020-2022 NEM Deployments
Benefit Category
Directional Impact*
Description
Energy + Shifting consumption or generation from low value periods to high value periods increases energy value, which would be done when the spread exceeds the efficiency losses of the energy storage technology.
Line Losses + Similar to energy.
Generation Capacity ++ By providing storage capacity or load shift capacity during peak generation periods, the generation capacity value would increase substantially.
Ancillary Services ++ Energy storage and controllable loads provide greater dispatchability than solar and thus could provide ancillary services directly, or be operated in ways to mitigate the need for ancillary services procurement.
Transmission Capacity
++ By providing storage capacity or load shift capacity during peak transmission periods, the transmission capacity value would increase substantially.
Distribution Capacity ++ By providing storage capacity or load shift capacity during peak distribution loading periods, the distribution capacity value would increase substantially.
CO2 Regulatory Price + By reducing demand during peak periods, less energy production from conventional generation is needed and the associated CO2 from fossil fuel combustion is reduced.
Voltage Support + Energy storage and load control could provide additional flexibility to manage voltage at the local level, as well as real and reactive power dispatchability to manage voltage.
Criteria Pollutants + Similar to CO2 Regulatory Price.
Environmental Externalities
+ Similar to CO2 Regulatory Price.
Total Benefits ++ The addition of energy storage and load control will materially increase the level of benefits delivered by DER customers.
*Legend + Positive impact expected, but likely marginal ++ Significant positive impact expected
Based on current forecasts, and with the proper price signals in place, customers choosing to adopt storage and load control in the 2020-2022 timeframe will be able to deliver materially higher levels of benefits to all utility customers than is capable today. Further evaluation of the increased value associated with storage and load control adoption is needed going forward, including analysis that incorporates more granular system level data. While we have not attempted to precisely quantify this additional benefit in this paper, we suggest the capabilities of these technologies paired with the aggressive cost declines forecasted offers a significant opportunity for the state that should not be ignored when setting pathway policies.
State-wide Impact To better understand the potential benefits to Nevada as a whole, we apply these levelized benefits in cents per killowatt-hour to existing NEM PV deployments and a future deployment scenario that assumes NEM is extended through 2019.

www.solarcity.com/gridx | www.nrdc.org | Page 13
Building off of Nevada NEM PV deployment statistics, we assume annual NEM PV installations of 100 MW during this period, resulting in an additional 300 MW of distributed solar across 50,000 Nevada homes.25 This adoption rate would result in roughly 557 MW of capacity installed across the state by the end of 2019.26 Each of the net benefit values described earlier are then applied to the penetration assumption in order to provide a simplified translation of the potential state-wide.
State-wide Impact Sensitivities
Category Existing NEM PV Systems (Q1 2016) Future NEM PV Systems (2017-2019)
Net Benefit
(Excl. Environmental) Net Benefit
+ Environmental Net Benefit
(Excl. Environmental) Net Benefit
+ Environmental
Total MWDC 257 MW27 557 MW
KWh/KWDC-year 1,600
Levelized Benefit 1.6 c/kWh 3.4 c/kWh 1.6 c/kWh 3.4 c/kWh
Annual Net Benefits $7M $14M $14M $30M
Lifetime Present Value $76M $163M $166M $353M
Numbers rounded to million dollars
As expected, the range of levelized net benefits results in a range of state-wide benefits; however, all scenarios demonstrate positive net benefit. When estimating the value of current NEM systems in the ground today, there is a net value shift of $7M per year in direct utility avoided costs to all customers, and conservatively $14M per year when considering externalities. In the future scenario that assumes 300 MW of additional deployment, the limited scope of direct utility avoided costs creates an annual net benefit of $14M/year for customers, equivalent to $166M in lifetime present value using a 7% discount rate and 25 year module production life. The externality scope returns a $30M/year net benefit, suggesting a $353M lifetime net benefit could be generated for Nevada today by encouraging the continued deployment of rooftop solar through NEM. These state-wide estimates, while simplified extrapolations, are significant because they provide an estimate for the public of how much NEM systems can reduce all customer’s utility bills and deliver additional societal benefits. While these additional societal benefits are not directly reflected in utility bills, they impact all customers as members of society. Furthermore, to the extent additional DERs like energy storage and load control can be cost-effectively deployed alongside these systems in the future under TOU rates, the net benefit to the state would be significantly higher for the reasons identified earlier, including greater capacity benefit at the bulk and distribution system level. A more rigorous forward-looking state-wide estimate could be conducted with a dynamic public model that captures the changing levels of benefits and costs as DER penetration increases. This type of modeling would require better access to utility forecasts and cost data, but becomes significant only at higher penetration levels of rooftop solar akin to Hawaii and California.
D. Additional Benefit and Cost Categories Not Quantified in This Report In this section, we qualitatively explore a series of additional benefits and costs that are more difficult to quantify for a variety of reasons. In some cases, utility data required to quantify these categories is not publicly available, or robust methodologies are still emerging. In other cases, the value or cost is known to be non-zero but cannot yet be explicitly quantified. While these categories are not included in our net benefit results, they represent significant, real sources of additional net benefit to Nevadan customers. These categories should continue to be studied to better quantify the potential benefit of DERs.
Benefit Categories
Fuel Diversity and Real-Option Value The PUCN recently identified fuel diversity as a benefit category that should be quantified in Sierra Pacific’s upcoming IRP.28 DERs reduce Nevada’s reliance on fossil fuels and customers’ exposure to the risk of future price spikes. A related and equally important benefit from DERs deployed in smaller building blocks and with shorter lead times is the real-option value they offer planners by delaying deployment of large capital investments until forecast uncertainty is smaller. That is, strategic deployment of DERs effectively buys time for planners and reduces the probability of a mistake due to forecast error. These benefits can be captured by incorporating DERs into planning processes. While the cost of volatility in extreme conditions and the value of real options can be significant, it is difficult to quantify this value without the requisite information, including historical loading data, historical forecasts and forecast error, and the utilities’ long-term project forecasts.

www.solarcity.com/gridx | www.nrdc.org | Page 14
Resiliency and Reliability Some DERs, such as energy storage, can provide backup power to critical loads, improving customer reliability during routine outages and resiliency during major outages. The rapidly growing penetration of batteries combined with PV deployments will reduce the frequency and duration of customer outages and provide sustained power for critical devices. Improved reliability and resiliency have been the goal of significant utility investments, including feeder reconductoring and distribution automation programs such as fault location, isolation, and service restoration (FLISR). Battery deployments throughout the distribution system can eventually reduce utility reliability and resiliency investments.
Market Price Suppression Effect In general, as electric demand increases the market price of electricity increases, as higher marginal cost power plants are “turned on.” DERs can provide value by reducing the electric demand in the market and avoiding higher marginal cost production, leading to a reduction in the market clearing price for all consumers of electricity. Called the Demand-Reduction Induced Price Effect (DRIPE), it is well-recognized in the energy efficiency field,29 and was recently validated in the U.S. Supreme Court’s decision to uphold FERC Order 745, which noted that operators accept demand response bids if and only if they bring the wholesale rate down by displacing higher-priced generation. Notably, the Court emphasized that “when this occurs (most often in peak periods), the easing of pressure on the grid, and the avoidance of service problems, further contributes to lower charges.”30 As a behind-the-meter resource, rooftop solar impacts wholesale markets in a similar way to demand response, effectively reducing demand and thus clearing prices for all resources during solar production hours. While the avoided cost model considers the avoided cost of future energy prices, it does not consider the benefits of reducing market clearing prices from what they would have been in the absence of solar. Shifting that solar production to peak demand periods with storage or load control provides an even greater effect.
Equipment Life Extension Through a combination of local generation, load shifting, and energy efficiency improvements, DERs reduce the net load at individual customer premises. A portfolio of optimized DERs dispersed across a distribution circuit can, in turn, reduce the net load for all equipment along that particular circuit, which has equipment benefits beyond those already discussed. By operating the distribution equipment, such as substation transformers, at reduced loading on the distribution circuits with DERs portfolios, the distribution equipment will benefit from increased equipment life and higher operational efficiency. Traditionally, distribution equipment may operate at very high loading during periods of peak demand, abnormal configuration, or emergency operation. When the nominal rating of equipment is exceeded, the equipment suffers from degradation and reduction in operational life. The more frequently equipment is overloaded, the more degradation occurs. Furthermore, the efficiency of transformers and other grid equipment falls as they are required to perform under increased load: the higher the overload, the larger the losses in efficiency. Utilities can have significant proportions of grid equipment that regularly operate in this overloaded fashion. DERs’ ability to reduce peak and average load on distribution equipment therefore leads to a reduction in the detrimental operation of the equipment and an increase in useful life. The larger the peak load reduction, the larger the life extension and efficiency benefits.
Cost Categories
Change Management Improvements to grid planning to incorporate DERs have been incremental in their progress – but not without reason. The amount of change necessary to capture the full benefits of DERs is significant, and such change can be challenging to implement, both at the regulatory and utility levels. Beyond the technical integration and program administration costs that are explicitly quantified in this report, the cost of implementing change to grid planning and utility processes is unknown yet real. However, while these changes may be difficult, they are necessary in order to modernize the grid and benefit society.

www.solarcity.com/gridx | www.nrdc.org | Page 15
III. Barriers to Realizing the Value of Distributed Energy Resources
The previous section demonstrated how Nevada could generate savings for all utility customers from DER deployments in the 2017-2022 timeperiod. Despite this potential value from embracing DERs, utilities face institutional barriers to realizing these benefits. Reducing the size of a utility’s ratebase – its wires-related investments – cuts directly into shareholder profits. Therefore, expecting utilities to proactively integrate DERs into grid planning, when doing so has the potential to adversely impact shareholder earnings, is a structurally flawed approach. It will be difficult to capture the potential benefits of DERs until the grid planner’s financial disincentive to the deployment of DERs is neutralized. These natural tensions are further explored in this section, culminating in recommended next steps to capture the full potential of DERs.
Utility Financial Disincentives are a Barrier to Capturing DER Benefits
The current utility regulatory model, which was designed around a monopoly utility controlling all aspects of grid design, investment and operation, is outdated and unsuited for today’s reality of consumers installing DERs that can benefit the grid. Therefore, industry fundamentals need to be reexamined, and the utility incentive model is a key place to start. Electric utilities are generally regulated under a “cost plus” model, which compensates utilities with an authorized rate of return on prudent capital investments made to provide electricity services. While this model makes sense when faced with a regulated firm operating in a natural monopoly, it is well known to result in a number of economic inefficiencies, as perhaps best analyzed by Jean Tirole in his Nobel Prize winning work on market power and regulation.31 Additionally, utilities in vertically integrated regulatory environments, such as is the case in Nevada, also earn an authorized rate of return on the amount of energy consumed by their customers. As such, utilities are financially incented to increase the amount of energy consumed by customers, a facet of their business model that is at odds with society’s energy efficiency objectives. One fundamental problem resulting from the utility “cost plus” and vertically integrated regulatory model is that utilities are generally discouraged from utilizing infrastructure resources that are not owned by the utility, even if competitive alternatives could deliver improved levels of service at a lower cost to customers. Beyond regulatory oversight, this model contains no inherent downward economic pressure on the size of the utility rate base, or the cumulative amount of assets upon which the utility earns a rate of return. As customers continue to adopt distributed resources that are capable of providing grid services, the utility’s fundamental financial incentive to build more utility-owned infrastructure in order to profit more may come into conflict with customers’ interests.
Traditional Grid Planning Focuses on Traditional Assets
Grid planning for infrastructure investments has historically focused on installing capital intensive, large physical assets that provide service over a wide geographic region and long time period. This structure evolved naturally from the original electricity industry, characterized by natural monopolies, centralized generation, long infrastructure lead times, high capital costs with significant economies of scale, and a concentration of technical know-how within the utility. Many of these characteristics have changed with the technological and market advancement in physical infrastructure options – such as DER portfolios that can meet grid needs – and increased sophistication of grid design and operational tools. However, grid planning still remains focused on utilizing traditional infrastructure without harnessing the increasing availability of DERs, to the detriment of efficient grid design. Utilizing DER solutions will require a shift from traditional planning approaches, beginning with increased access to the underlying planning and operational data needed to enable DERs to operate most effectively in concert with the grid. Opening the door to DER solutions in grid planning provides the obvious benefit of a new suite of technological options for grid planners. In some cases, DERs may simply be lower cost on a $/kW basis or more effective at meeting the identified grid need than the conventional solutions, making them an obvious choice. DERs, however, also offer an advantage over conventional options due to their targeted and flexible nature, which fundamentally changes the paradigm of grid planning. Status quo grid planning relies on deploying bulky infrastructure solutions to address forecasts of incremental, near-term grid needs. In many cases, conventional solutions are 15X larger than the near-term grid need that is driving the actual deployment of the infrastructure.32 This reality of grid planning creates two major opportunities for DERs to deliver better value to customers than conventional solutions: 1) utilizing small and targeted solutions, and 2) leveraging DER flexibility.

www.solarcity.com/gridx | www.nrdc.org | Page 16
Grid planning can be modernized by utilizing Integrated Distribution Planning, an approach to meeting grid needs while at the same time expanding customer choice to utilize DERs to manage their own energy. Integrated Distribution Planning encourages the incorporation of DERs into every aspect of grid planning. The framework, as depicted in the adjacent figure, expedites DER interconnections, integrates DERs into grid planning, sources DER portfolios to meet grid needs, and ensures data transparency for key planning and grid information. Ultimately, the approach reduces overall system costs, increases grid reliability and resiliency, and fosters customer engagement.
Distributed Solar “Versus” Utility-Scale Solar Obscures the Value of Both
The comparison of DERs to utility-scale resources to deliver benefits has been a topic of recent interest from policymakers considering the relative merits of each. Each type of deployment has its unique benefits and costs, yet both widely facilitate a future focused on decreasing carbon emissions. However, while we understand the tendency to compare rooftop solar to utility-scale solar, we suggest the comparison is often an apples-to-oranges exercise, and therefore can be a distraction. Rooftop solar is sited at the point of customer service, which enables it to deliver a much broader set of benefits than central resources connected to the bulk transmission system. For example, utility-scale resources can provide energy and system capacity, but require significant transmission system infrastructure to enable the transport of energy produced. In contrast, behind-the-meter resources offset bulk system energy production, the associated losses that are associated with transmitting energy, transmission and distribution capacity, and voltage benefits that can increase the efficiency of the grid for all customers. While central generation can deliver significant economies of scale, these fundamental differences in the services being provided by the two resources requires very careful consideration that is beyond the scope of this analysis. More holistically, DERs have the potential to fundamentally change the way the system is planned and operated. DERs can increase the resiliency of the grid by reducing the reliance on centralized, single-point-of-failure assets through the local delivery of power during grid outages. Furthermore, DERs can reduce the heightened risk of stranded assets associated with massive infrastructure bets that are built upon forecasts of a future that is changing rapidly. Utilizing smaller infrastructure building blocks with shorter lead times creates significant real option value that is unavailable to grid planners today. A focus on utility-scale solar “versus” rooftop solar ignores the broader context under which renewables are deployed. Meeting our societal goals to radically decarbonize the electricity sector in order to avoid the catastrophic impacts from climate change will require deploying all cost-effective solutions capable of delivering reductions in carbon emissions.
IV. Conclusion
In this report, we explored the capability of distributed energy resources to provide benefits to all utility customers in Nevada. The opportunity associated with proactively leveraging DERs in the near-term is significant, creating net benefits for all utility customers, both those with DERs and those without. The impediments to capturing these benefits in practice remain significant. Utility incentives must be realigned to ensure that the full potential of DERs can be realized. Shifting the utility’s core financial incentive from its current focus of “build more and sell more to profit more” towards a future state where the utility is financially indifferent between sourcing utility-owned and customer-driven solutions would neutralize bias in the utility decision-making process. In parallel, grid planning must also be updated to incorporate DERs into every aspect of grid design and operations, and the process itself must become radically more transparent with greater access to and standardization of data. The benefits of achieving these changes would be real and large. The greater flexibility that DERs can provide to grid planners and operators can lead to greater reliability and resiliency. Similarly, the more targeted and incremental deployments of DERs can increase efficiency and affordability. Finally, utilities that can successfully modernize planning would be able to fully take advantage of the assets their customers adopt. As articulated in this report, all Nevadans would benefit from continuing this discussion and taking action to fully leverage distributed energy resources to benefit the grid and its customers.

www.solarcity.com/gridx | www.nrdc.org | Page 17
Endnotes 1 E3 / Nevada Public Utilities Commission, Nevada Net Energy Metering Impacts Evaluation, July 2014. 2 Nevada Public Utilities Commission Procedural Order, Docket No. 16-07001, pp. 2-3 (April 8, 2016). 3 Nevada Public Utilities Commission Order, Docket No. 15-07041 and No. 15-07042, pp. 65-66 (December 23, 2016). 4 “Considerations for Managing a NEM 1 Queue”, Jesse Murray, NV Energy, New Energy Task Force: Technical Advisory Committee on Distributed Generation and Storage, May 18, 2016. 5 Ibid. 6 “Integrated Distribution Planning: A holistic approach to meeting grid needs and expanding customer choice by unlocking the benefits of distributed energy resources”, SolarCity, September 2015. 7 E3 / Nevada Public Utilities Commission, Nevada Net Energy Metering Impacts Evaluation, July 2014. 8 Ibid. 9 Ibid. 10 Nevada Public Utilities Commission Order, Docket No. 15-07041 and No. 15-07042 (December 23, 2016). 11 U.S. Energy Information Agency (EIA), July 2015 preliminary data. 12 As of March 31st, 2016, 190 MW of NEM PV were installed and another 67 MW were in the pipeline, for a total of 257 MW (“Overview of Nevada’s Current NEM Customers”, Jesse Murray, NV Energy, New Energy Task Force: Technical Advisory Committee on Distributed Generation and Storage, April 14, 2016). NVE forecasts peak system load of 7,639 MW in its most recent Integrated Resource Plans (Docket No. 13-07 and Docket No. 14-05). As such, NEM capacity as a percentage of peak system load is roughly 3.4%. 13 Nevada Public Utilities Commission Order, Docket No. 15-07041 and No. 15-07042 (December 23, 2016). 14 Nevada Public Utilities Commission Procedural Order, Docket No. 16-07001, pp. 2-3 (April 8, 2016). 15 "The NEM ratepayers' net excess energy is set at a value that captures the variables that make up the possible value/detriment of NEM during each general rate case. The Commission will set a value during each future general rate case by using a methodology that considers both the positive and negative effects of: 1) avoided energy; 2) energy losses/line losses; 3) avoided capacity; 4) ancillary services; 5) transmission and distribution capacity; 6) avoided criteria pollutant costs; 7) avoided carbon dioxide emission cost; 8) fuel hedging; 9) utility integration and interconnection costs; 10) utility administration costs; and 11) environmental costs." 16 E3 / Nevada Public Utilities Commission, Nevada Net Energy Metering Impacts Evaluation, July 2014. 17 “Evaluation of Conservation Voltage Reduction on a National Level”, Schneider, Fuller, Tuffner, and Singh, Pacific Northwest National Laboratory (PNNL) for the US Department of Energy (DOE), July 2010. http://www.pnl.gov/main/publications/external/technical_reports/PNNL-19596.pdf. 18 Results based on analysis of SolarCity field demonstration project that utilized 150 distributed smart inverters to provide reactive power and voltage support in collaboration with an investor-owned utility (2016). 19 https://www3.epa.gov/climatechange/EPAactivities/economics/scc.html. 20 “100% clean and renewable wind, water and sunlight (WWS) all-sector energy roadmaps for the 50 United States”, Mark Z. Jacobson, Mark A. Delucchi, Guillaume Bazouin, Zack A. F. Bauer, Christa C. Heavey, Emma Fisher, Sean B. Morris, Diniana J. Y. Piekutowski, Taylor A. Vencill and Tim W. Yeskoo, Energy & Environmental Science, (May 2015). 21 Ibid. 22 Ibid. 23 Ibid. 24 “Overview of Nevada’s Current NEM Customers”, NV Energy, April 14, 2016. 25 Assuming average solar array size of 6kW per home: 300,000 kW / 6 kW per home = 50,000 homes. 26 As of March 31st, 2016, 190 MW of NEM PV were installed and another 67 MW were in the pipeline, for a total of 257 MW (“Overview of Nevada’s Current NEM Customers”, NV Energy, April 2016). Adding 300 MW of additional PV would result in roughly 557 MW deployed. 27 Ibid. 28 Nevada Public Utilities Commission Procedural Order, Docket No. 16-07001, pp. 2-3 (April 8, 2016). 29 https://www4.eere.energy.gov/seeaction/publication/state-approaches-demand-reduction-induced-price-effects-examining-how-energy-efficiency. 30 Opinion of the U.S. Supreme Court, FERC v. Electric Power Supply Association et al., January 2016, p. 16. 31 “A Theory of Incentives in Procurement and Regulation”, Jean-Jacques Laffont and Jean Tirole, MIT Press, 1993. 32 For example, according to PG&E’s 2017 GRC Workpaper 13-11, 1,400 MWs of capacity expansions could be linked to 114 MW of deficiency.

www.solarcity.com/gridx | www.nrdc.org | Page 18
Appendix A
In an effort to make these results as transparent as possible, we provide the following details to enable other parties to recreate our results themselves. We attempt to stay within the confines of E3’s Nevada Public Tool in order to make our analysis transparent and accessible, but have sought to incorporate the best information available. In some cases, this has required that we distill complicated market effects into assumptions that fit into the model mechanics embedded within the Nevada Public Tool. In cases where we have attempted to distill these complicated effects, we err on the side of utilizing assumptions that we believe result in conservative valuations of DER benefits.
A. Steps To Update E3’s Nevada NEM Bill Calculator:
To estimate bill savings going forward, we updated the rates in the Nevada NEM Bill Calculator based on the currently applicable tariffs:
Sierra Pacific Power (NV Energy North) o https://www.nvenergy.com/company/rates/nnv/electric/schedules/images/Statement_of_Rates_Electric_North.pdf
Nevada Power Company (NV Energy South) o https://www.nvenergy.com/company/rates/snv/schedules/images/StatementofRates.pdf
These tariffs were entered into E3’s Nevada NEM Bill Calculator model on the ‘Rates’ tab. The output from this model (found in column F of the ‘Annual Bill Savings’ tab), is then pasted into the Nevada Public Tool on the ‘Bill Savings Input’ tab in column G.
B. Steps To Update E3’s Nevada Public Tool:
Participant Bill Savings As noted above, one can paste the outputs from the Nevada NEM Bill Calculator into Column G of the ‘Bill Savings Input’ tab in order to incorporate the currently applicable tariffs. The other important assumption with respect to bill savings is the rate at which utility rates are expected to increase. In NVE’s 2013 IRP, rates were estimated to escalate at 0.5% per year through 2020. Past 2020, E3 created two scenarios: one that continued that escalation rate for the entire forecast period, and one that increased the rate to 1.4% per year, driven by a gas price forecast which escalated at 3.5%. Given the dramatic recent decrease in gas prices and gas price forwards, we use E3’s lower estimate of utility rate escalation through the entire 2017-2041 period, which we believe to be a conservative approach in regards to the potential value of DERs. This assumption can be implemented on the ‘User Inputs’ tab in Columns C and D, Rows 43-80. Energy For the remainder of 2016, the current monthly forwards are dramatically lower than the forwards from 2014 (40% lower on average). For 2017, the forwards are about 40% lower, dropping to ~35% lower through 2020, and dropping to ~25% by 2026 (the last year where forwards are available). The following table contains the results of this comparative analysis of gas forward curves:
Avoided Energy Adjustment
Year 2016 2017 2018 2019 2020 2021 2022 2023 2024 2025 2026-2043
Adjustment -41% -30% -33% -35% -35% -34% -32% -31% -29% -27% -26%
These Avoided Energy Adjustment Factors were applied to the hard-coded values on the ‘Avoided Costs’ tab. The appropriate multiplier for each year was applied to ‘Energy With Carbon’, ‘Energy Without Carbon’, ‘Losses’, and ‘Ancillary Services’ in Columns D through O. Because these values are hard-coded in the original model, updating them in this way does not affect the functionality of the model. While E3 did provide functionality on the ‘User Inputs’ tab to apply a multiplier to specific avoided cost values, there is only the option to apply a single value to each year. We sought to more accurately reflect the divergence in gas forward price curves by applying these annual factors. Energy Losses We relied on the E3 methodology, but applied the same set of annual adjustors that were applied to the avoided energy value. This adjustment was necessary since the value of avoiding losses is a function of the underlying energy prices. Generation Capacity There is a feedback loop between energy and capacity avoided cost values. On the margin, capacity prices represent the amount the marginal unit would need to supplement energy market net revenues in order to stay in the market. As energy revenues decrease, the plant would need to recover more through capacity payments to continue operating. While we believe the capacity value should have a positive avoided cost adjustor in the Nevada Public Tool, we do not have sufficient information about the underlying assumptions in the confidential version of E3’s avoided cost model to accurately develop such a

www.solarcity.com/gridx | www.nrdc.org | Page 19
multiplier. These inputs from the confidential version of the model are simply hard coded into the ‘Avoided Costs’ tab in the Nevada Public Tool. Instead, we’ve chosen to keep the unmodified capacity value, but highlight that the generation capacity value under these avoided energy value assumptions could be higher. We believe this approach to be conservative in regards to the potential value of DERs. Note that Sierra Pacific Power’s recently approved 2nd Amendment to its 2014-2016 Action Plan (Docket No. 15-08011) included a new methodology for calculating the avoided cost payments for up to 25 MWs of PURPA QF contracts. This methodology produced monthly average $/MWh rates that NVE indicates will serve as a cap on long-term payments to winning bids in future competitive QF solicitations. We considered replacing the values in the E3 framework with these “Capped Long-Term Avoided Costs” as approved in the docket, but decided against it for the following reasons. First, using these monthly values would lose the hourly granularity that the E3 approach is based on. Hourly granularity is important to properly reflect the coincidence of solar generation with hourly prices, and these values are not publicly available from NVE. Second, we would lose the geographic specificity between SPP and NPC contained within the E3 model. Ancillary Services We relied on the E3 methodology, but applied the same set of annual adjustors that were applied to the avoided energy value. While the value of ancillary services is not directly tied to the underlying energy prices to the same extent as line losses, the opportunity cost of not participating in the energy market is often the basis for ancillary service payments. Furthermore, E3’s approximation of ancillary services value was derived based on a percentage of total energy production cost. For this reason, adjusting for gas price in the same way is a reasonable approximation of the value of future ancillary services. Distribution Capacity Include Distribution Avoided Costs in the E3 Nevada Public Tool by checking the box in cell B25 on the ‘User Inputs’ tab. CO2 Emissions E3 modeled CO2 costs based on NVE’s estimate of carbon allowance prices from its 2013 Integrated Resource Plan. These prices are based on CPP compliance starting in 2019. To implement this, users should check the box in cell B20 on the ‘User Inputs’ tab. Environmental Costs E3 did not provide any functionality to incorporate user-defined values for the social benefits of avoided CO2 within their model. Given that limitation, we calculated the levelized value for social cost of carbon (based on EPA values) outside of the Nevada Public Tool. Renewable Energy Certificates E3 provided several PPA assumptions in their 2014 model: $80/MWh and $100/MWh and $120/MWh. Solar costs have come down significantly since 2014, to the point where the above-market cost under E3’s framework (i.e. the basis for RPS compliance value) is non-existent. To be conservative, we eliminated the RPS compliance value attributable to DG given the low cost utility-scale PPAs recently signed by NVE. Utility Integration, Utility Administration, Transmission Capacity, and Criteria Pollutants No change to base tool assumptions.
C. Extracting Resulting Values To extract the values we used for this analysis, we filtered the results to look only at solar PV for 2016. Since E3’s Nevada Public Tool looks at costs and benefits from PV systems 2004 through 2016, we filter out the results for current systems already installed up to and including 2015 since there are several factors for those systems which won’t be applicable going forward, including receiving incentives and receiving a multiplier on the RPS compliance value. On the ‘Results’ tab, we filtered out wind (B11), existing installations (B17), and 2014/2015 installations (B18). Levelized results for each avoided cost category can be found on the ‘Results’ tab in Rows 221-228, Column E. Levelized costs can be found in Rows 142-146. For costs, we included Participant Bill Savings, Integration Costs, and NEM Program Costs.
D. Non-E3 quantified Values Voltage Support Using substation loading data from Fresno, California, a similar region for which there is publicly available data, the typical low-voltage, secondary system voltage drop is calculated for each hour of the average day. The secondary system consists of a 25 kVA transformer with a X/R ratio near unity and 100 feet of secondary triplex lines of 4/0 AWG aluminum conductor. The average production profile of one smart inverter with active power priority, but capable of providing reactive power outside daylight hours, is used to offset the secondary system’s active and reactive power net load. The reduction in voltage drop is then assessed. Using SolarCity voltage data for Nevada, it is estimated that targeting 3% of customers at the system level would result in the ability to lower the voltage of the other 97% of customers. This performance resulted in an average energy savings of 0.4%. Impacts to the medium-voltage, primary system’s voltage and losses are not assessed. If included, they would result in increased energy savings beyond 0.4%, making this methodology generally conservative.