Distributed Energy Resources (DER) Webinar - Pepco · Welcome to Pepco Holdings’ Distributed...
87
1 Distributed Energy Resources (DER) Webinar Maintaining Reliability & Integrating New Technology Moderated by: Don Hall, Pepco Holdings, Manager Capacity Planning Date: May 3 rd , 2016
Transcript of Distributed Energy Resources (DER) Webinar - Pepco · Welcome to Pepco Holdings’ Distributed...

1
Distributed Energy Resources (DER) Webinar
Maintaining Reliability & Integrating New Technology
Moderated by: Don Hall, Pepco Holdings, Manager Capacity Planning
Date: May 3rd, 2016

II Pepco Holdings. An Exelon Company
Welcome to Pepco Holdings’ Distributed Energy Resources (DER) Webinar
Reason for this Webinar: • Continue PHI’s commitment to provide reliable service to our customers as well as stay on the forefront of the integration of new technology in the power delivery industry
Purpose of this Webinar: • Share information with our customers concerning the implementation of DER and related topics
• Present a comprehensive review of established practices and policies
• Discuss any modifications and clarifications needed to ensure the effectiveness of the formal application process
2
II Pepco Holdings. An Exelon Company
Overview of Webinar Presentation Topics: • Green Power Connection (GPC) Process Update – Discuss the streamlined, online application, review, & approval process
• NREL/EPRI Survey of Utility Practice – Present an overview of the results of the survey of other utilities across the country
• DOE Grant -- "SUNRISE" Report – Review results from Hosting Capacity Study of Pepco Holdings’ feeders – Provide a more thorough understanding of the impact of new technology on Pepco Holdings’ existing system
• DER Modeling Methodology and Tools – Overview of new evaluation methodology and tools being implemented at PHI in order to facilitate the installation of higher levels of DER while maintaining reliability to Pepco Holdings’ customers
– Discuss how these new tools and technology are being accepted in the Power Delivery Industry
3

GPC Team
II Pepco Holdings. An Exelon Company
Introduction to the Organization Presenters Representing Various Departments Involved Include:
– Don Hall, Manager of the Asset Strategy and Planning Department – Evan Hebert, Engineer in Distributed Energy Resource Planning & Analytics – Josh Cadoret, Lead Consultant on Green Power Connection Team – Steve Steffel, Manager of Distributed Energy Resource Planning & Analytics
DER Application And Review Process
Engineering Customer Relations & Programs
Asset Strategy & Planning
Demand Side Management
DER Planning & Analytics
Distribution Planning
Green Power Connection Team
4

II Pepco Holdings. An Exelon Company
Next Steps Question & Answer Session will begin after Presentations
• Please type questions in WebEx during the Q&A session • The moderator will receive questions and the appropriate presenters will respond during the Q&A session if time allows
• Any questions that arise after the Q&A session can be sent to [email protected]
Presentation materials will be available on the WebEx website
Pepco Holdings will complete a final evaluation of criteria and practices and consider any questions and comments received from stakeholders following this webinar to file a report with each of our Public Service Commissions & Board of Public Utilities by end of July
In-person meetings with Commission staffs and various stakeholders will be scheduled to follow up on our filing and to address any questions that arise from today’s presentations or our criteria
5
April 7, 2016
II Pepco Holdings. An Exelon Company
Online Net Energy Metering (NEM) Application Process
Presented by Evan Hebert
6
II Pepco Holdings. An Exelon Company
NEM Application Review Process
• Previously, NEM interconnection applications had to be submitted on paper via mail.
• Recently, all PHI companies transitioned to an online application portal that allows customers and contractors to enter all of the application information online and to submit it directly.
• This streamlining of the application process is resulting in shorter overall review and approval times across all PHI companies.
7

I ~
~
I
~
II II
II ,,
~ V ...
/. ~
/
1/
/ -----
...... _..../
/
___.........v
-,.. ~ --- -
nT I I I I
II Pepco Holdings. An Exelon Company
Interconnection applications continue to accelerate in both volume and aggregate size across Pepco, Delmarva Power and Atlantic City Electric
0
500
1,000
1,500
2,000
2,500
Jan-13
Mar-13
May-13
Jul-13
Sep-13
Nov-13
Jan-14
Mar-14
May-14
Jul-14
Sep-14
Nov-14
Jan-15
Mar-15
May-15
Jul-15
Sep-15
Nov-15
Jan-16
Mar-16
Number Received
NEM Applications Received by Month
0
5
10
15
20
25
30
Jan-13
Mar-13
May-13
Jul-13
Sep-13
Nov-13
Jan-14
Mar-14
May-14
Jul-14
Sep-14
Nov-14
Jan-15
Mar-15
May-15
Jul-15
Sep-15
Nov-15
Jan-16
Mar-16
MW Received
NEM Applications Received by Month (MW)
8

April 4, 2016
April 4, 2016
greenpo'!"er c~nnect1on1
.. II Pepco Holdings.
An Exelon Company
Benefits to Customers and Contractors
Automation quickly moves the application along to the next step in the process
Automated data validation reduces application errors and missing information
Allows customers to monitor your application’s status 24/7 in near-real-time through a personalized dashboard
Ability to see aggregated reports for all pending applications submitted online by contractor
New online contractor account includes ability to designate access to multiple users
Online application portal is accessible from any internet connection, including tablets in the field
9

April 4, 2016
April 4, 2016
green po'!'fer c~nnect1on, .. II Pepco Holdings.
An Exelon Company
Benefits to Customers and Contractors
Improves the quality, speed and effectiveness of the Net Energy Metering (NEM) Application process
Intuitive and interactive process guides you step by step to complete the application
Many pull-down lists and field validations for easy input Online signature feature eliminates the need for physical signatures
Upload attachments online — no need to e-mail or mail supporting documents
Save paper and postage from printing and mailing hard-copy applications
Self-service provides immediate updates on missing or inaccurate information — no need to wait for returned emails or phone calls
10

April 14, 2016
II Pepco Holdings. An Exelon Company
Interconnection Education Tools Available Online
11
~-- ., - .. ----~---.. _ .. ___ ,._"'"'' ________ ..,_
green po'!'fer ce nnect1on··
RESTRICTED CIRCUIT MAP We suppcrt , enew,ab&e ener9Y :and pa,,ir,erWltft owa.u:lfflen ia ,.... .. ., .,f,o and reli:at>le
irrtetconned:ion of,en...,..bte .,..~ .. toble elednc:gnd.
lnl0fflere9,o.,.,wem:.iyn<>ll'l-=<>pen0mnt at,..,..1ocabor!.,.._,,1:,ngaddib0..al
irrtetconned:ion1 una a.ble. The~ bebw ,nows g,,M a ru , wne"' cira,its an, ,,.,bided to
1i:u. Clid:nes-e t.c,.aae,. a ... an::nable vem<>n. t-Jpe an addn!nintotM uaroi b,nto loca~ a
speafic k>abon. for,,_.. mfon..a~n, -c-oo,-!.ad ""' GPC !e,a,.._
II Pepco Holdings. An Exelon Company
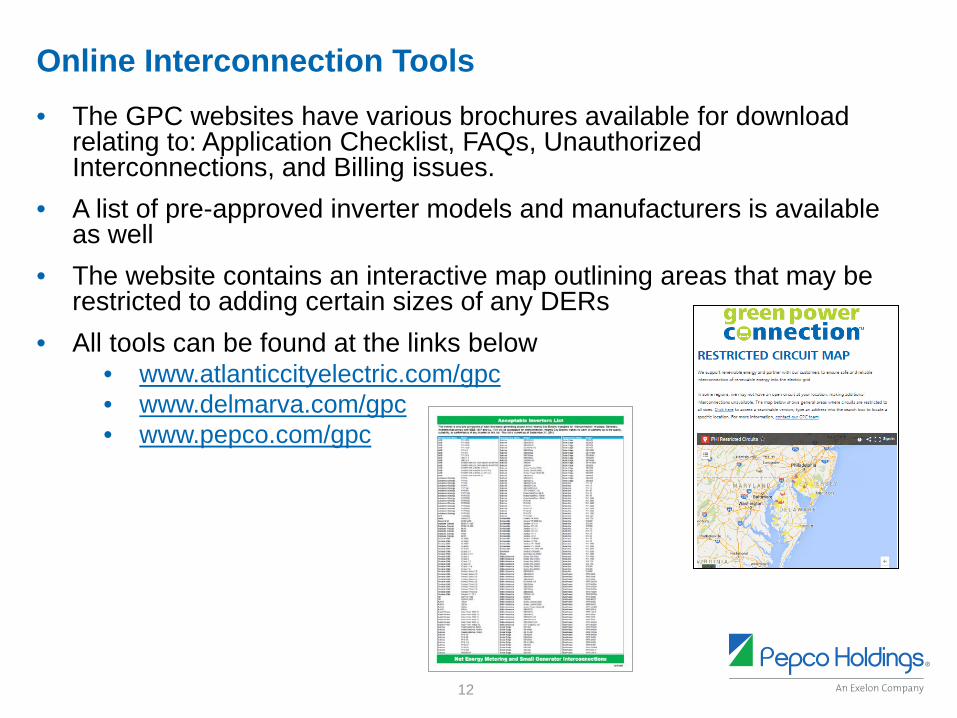
Online Interconnection Tools • The GPC websites have various brochures available for download relating to: Application Checklist, FAQs, Unauthorized Interconnections, and Billing issues.
• A list of pre-approved inverter models and manufacturers is availableas well
• The website contains an interactive map outlining areas that may berestricted to adding certain sizes of any DERs
• All tools can be found at the links below • www.atlanticcityelectric.com/gpc • www.delmarva.com/gpc • www.pepco.com/gpc
12

April 14, 2016
II Pepco Holdings. An Exelon Company
What is PHI Doing to Speed Up the Application Process?
13
April 14, 2016
greenpo'!"er c@nnect1on™
NEW INTERCONNECTION REQUESTS
l;uALPI.Al.lt;A...,_) IMl,JNfJAUUJtt;Slji I .. AH ll«;W,l,IUAL,U~t; ..NO'Vl\(IAI '?ii NAM ..
1---...
~t.,_· ~•---·--~t I · I c:::J
II Pepco Holdings. An Exelon Company
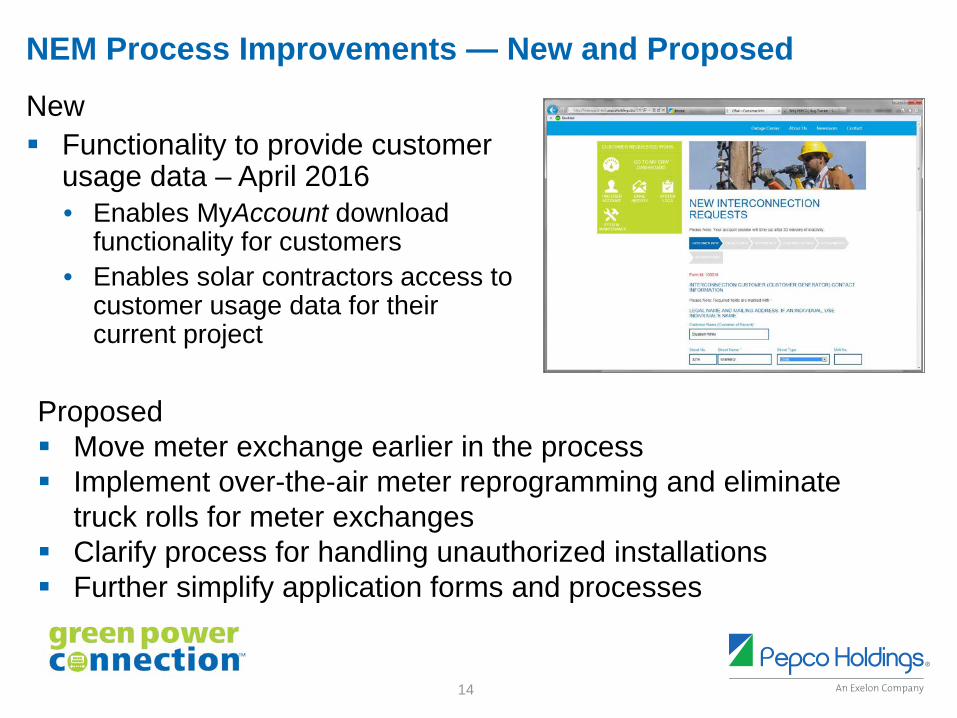
NEM Process Improvements — New and Proposed
New Functionality to provide customerusage data – April 2016 • Enables MyAccount download functionality for customers
• Enables solar contractors access to customer usage data for theircurrent project
Proposed Move meter exchange earlier in the process Implement over-the-air meter reprogramming and eliminate truck rolls for meter exchanges
Clarify process for handling unauthorized installations Further simplify application forms and processes
14

April 14, 2016
II Pepco Holdings. An Exelon Company
Level 1 Engineering Review Process
15

II Pepco Holdings. An Exelon Company
Technical Review of PV Applications
To qualify for the streamlined process, applications: • Must be rated 10kW or less • Must not be on a restricted or network circuit • Inverter must be IEEE/UL Certified • Must not share a distribution transformer with an existing PV system
16
-
II Pepco Holdings. An Exelon Company
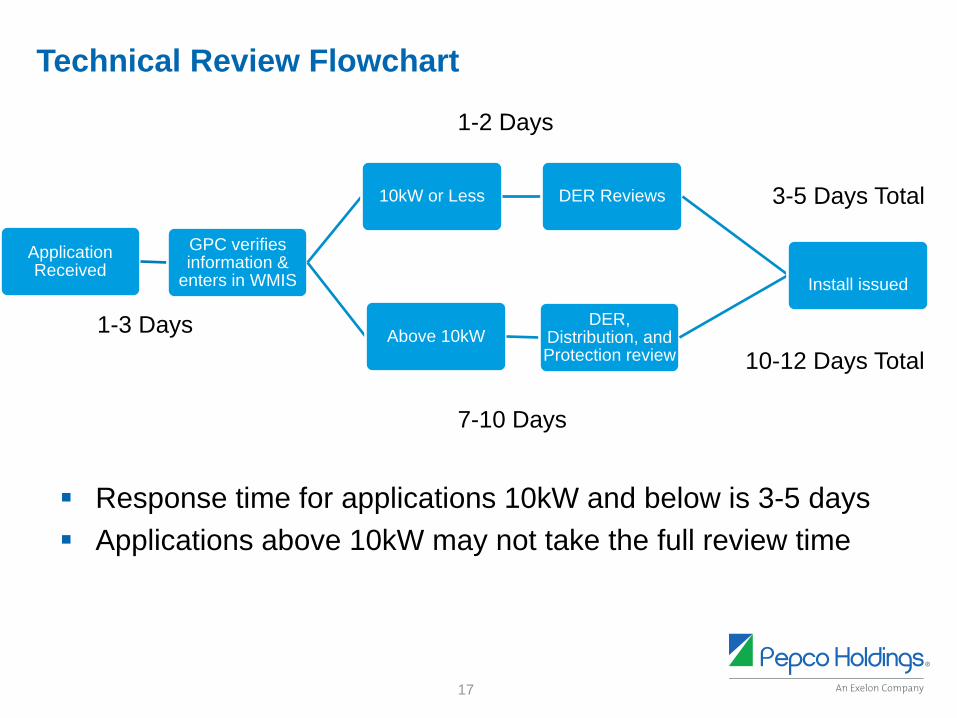
Technical Review Flowchart
1-2 Days
3-5 Days Total
1-3 Days 10-12 Days Total
Application Received
GPC verifies information & enters in WMIS
10kW or Less DER Reviews
Above 10kW DER,
Distribution, and
Approval to
Protection review
Install issued
7-10 Days
Response time for applications 10kW and below is 3-5 days Applications above 10kW may not take the full review time
17
• •
II Pepco Holdings. An Exelon Company
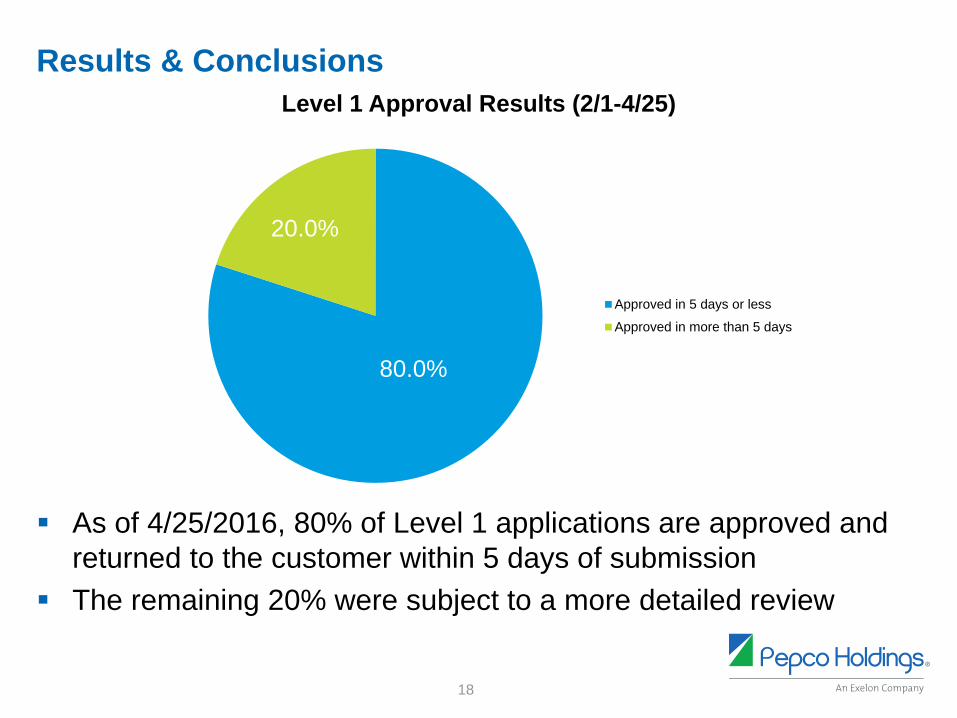
Results & Conclusions Level 1 Approval Results (2/1-4/25)
80.0%
20.0%
Approved in 5 days or less
Approved in more than 5 days
As of 4/25/2016, 80% of Level 1 applications are approved and returned to the customer within 5 days of submission
The remaining 20% were subject to a more detailed review
18

February 1, 2016
II Pepco Holdings. An Exelon Company
NREL/EPRI Survey of Practice
Presented by Michael Coddington
19

Interconnection Processes and Procedures in 21 U.S. Utilities
Michael Coddington Principal Engineer
National Renewable Energy Laboratory
GO
CALIFORNIA
Pacific Gas and Electric Company®
llronCSIRD&O Program Manager
NATIONAL RENEWABLE ENERGY LABORATORY
Energy Systems Integration
EPl21 ELECTRIC POWER RESEARCH INSTITUTE
An EDISON INTER ATIO AL Company an Onofre uclear Generating tat ion
Sandia National Laboratories
soG,. .....,/~ )
A ~ Sempra Energy utility"'
U.S. Department of Energy
Alternative Screening Methods
21
II Califormia
NATIONAL RENEWABLE ENERGY LABORATORY
Energy Systems Integration
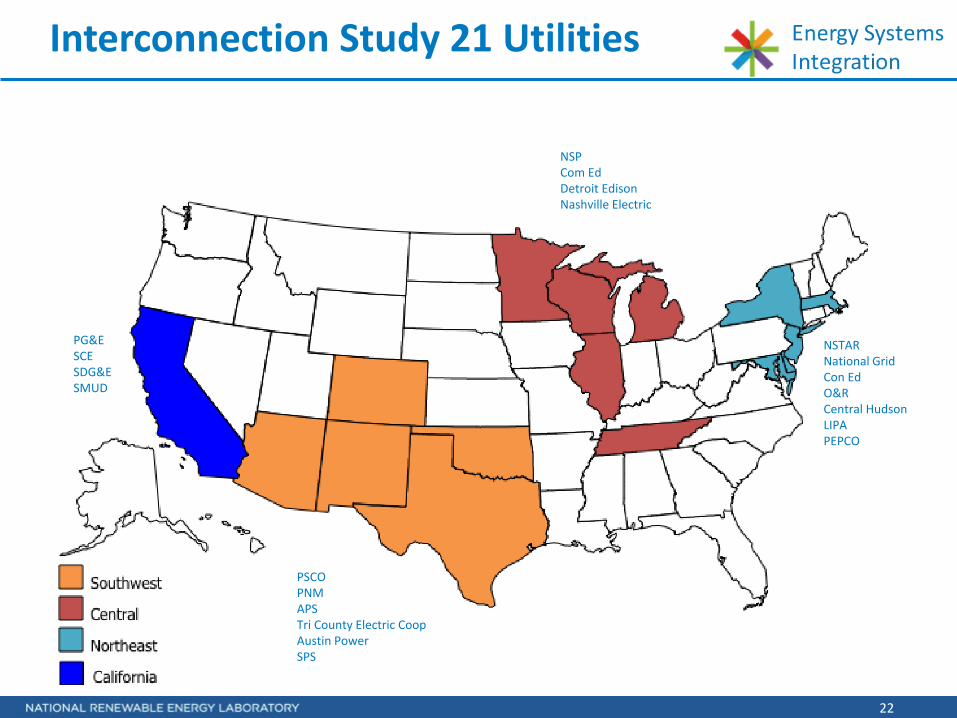
Interconnection Study 21 Utilities
NSP Com Ed Detroit Edison Nashville Electric
PG&E SCE SDG&E SMUD
NSTAR National Grid Con Ed O&R Central Hudson LIPA PEPCO
PSCO PNM APS Tri County Electric Coop Austin Power SPS
22

NATIONAL RENEWABLE ENERGY LABORATORY
Energy Systems Integration
23
Questionnaire Areas of Focus
• Application Process • Screening procedures • Supplemental screening procedures • Utility concerns related to interconnection • Impact study approach & software used • Mitigation strategies

NATIONAL RENEWABLE ENERGY LABORATORY
Energy Systems Integration
Classic Interconnection Process
There are significant differences amongst U.S. Electric utilities in processes, tools, modeling platforms, and mitigation strategies
Complete Application
Fast-Track Screens
Supplemental Review Screens
Feasibility & Facility Studies
Model PV on
Feeder
Mitigate Grid
Impacts
System Approval
Expedited Review Process
$ Supplemental study Process
$$$ Detailed Study Process (Slower, Expensive, Time-Consuming)
Fail Fail
Bypass Expedited Review
24

NATIONAL RENEWABLE ENERGY LABORATORY
Energy Systems Integration
25
Application Processes
Most utilities; • Follow time constraints with applications • Have state mandates for applications • Have multiple tier applications • Have an inverter-based PV application • Interconnection applications are
available online

NATIONAL RENEWABLE ENERGY LABORATORY
Energy Systems Integration
26
Screening Procedures
Most utilities follow a version of FERC SGIP screens
Some used a minimum daytime load for penetration screen (prior to FERC SGIP 2013 order)
1. Aggregated DG <15% of peak load on 5. DG interface is compatible with type of line section primary distribution line (wye/Delta)
2. For connection to a spot network: DG 6. For a single-phase shared secondary, is inverter-based, aggregated DG Aggregated DG capacity <20kW capacity is <5% of peak load & <50 kW 7. Resulting imbalance <20% of service
3. Aggregated DG contribution to transformer rating of 240 V service maximum short circuit current is <10% 8. Aggregated transmission connected DG
4. Aggregated DG does not cause capacity <10 MW for stability-limited protective device to exceed 87.5% of area short circuit interrupting capability 9. Construction not required for
interconnection

NATIONAL RENEWABLE ENERGY LABORATORY
Energy Systems Integration
27
Supplemental Screening
• Used to pass some interconnection applications when fast-track screens are failed (e.g. replace service transformer, secondary, loop)
• Typically quick and inexpensive solutions rather than conducting a detailed impact study
• Implemented only by some utilities • Now part of the FERC SGIP

NATIONAL RENEWABLE ENERGY LABORATORY
Energy Systems Integration
28
Major Utility Concerns
• Voltage Regulation 16 • Reverse power flow 11 • Protection system coordination 10 • Increased duty of line regulation equipment 8 • Unintentional islanding 8 • Secondary network protection 6 • Variability due to clouds 5 • Increased switching of capacitors 4

NATIONAL RENEWABLE ENERGY LABORATORY
Energy Systems Integration
29
Minor Utility Concerns
• Flicker 4 • Reactive power control 3 • Balancing resources and demand response 3 • Overvoltage due to faults 2 • Multiple inverter stability 1 • Harmonics 1 • Relay desensitization 1 • Exporting power through network protectors 1

NATIONAL RENEWABLE ENERGY LABORATORY
Energy Systems Integration
30
Detailed Impact Studies
Most utilities employ one or more of the following study types
• Feasibility • Facility • Power Flow (common) • Short Circuit (common) • Voltage (common) • Flicker • Power Quality
(these are uncommon) • Dynamic/Transient Stability • Electromagnetic Transient
Common software
• SynerGEE • CymDist • Milsoft Windmil • DEW • ASPEN
Research Software* • OpenDSS* • GridLabD*
NATIONAL RENEWABLE ENERGY LABORATORY
Energy Systems Integration
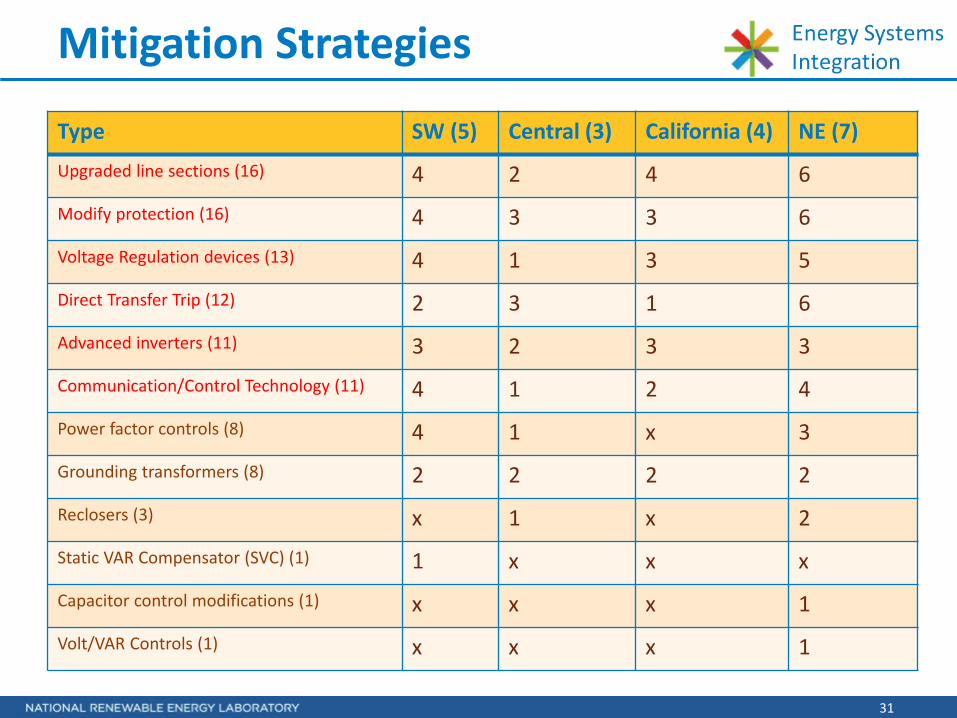
Mitigation Strategies
Type SW (5) Central (3) California (4) NE (7)
Upgraded line sections (16) 4 2 4 6
Modify protection (16) 4 3 3 6
Voltage Regulation devices (13) 4 1 3 5
Direct Transfer Trip (12) 2 3 1 6
Advanced inverters (11) 3 2 3 3
Communication/Control Technology (11) 4 1 2 4
Power factor controls (8) 4 1 x 3
Grounding transformers (8) 2 2 2 2
Reclosers (3) x 1 x 2
Static VAR Compensator (SVC) (1) 1 x x x
Capacitor control modifications (1) x x x 1
Volt/VAR Controls (1) x x x 1
31
NATIONAL RENEWABLE ENERGY LABORATORY
Energy Systems Integration
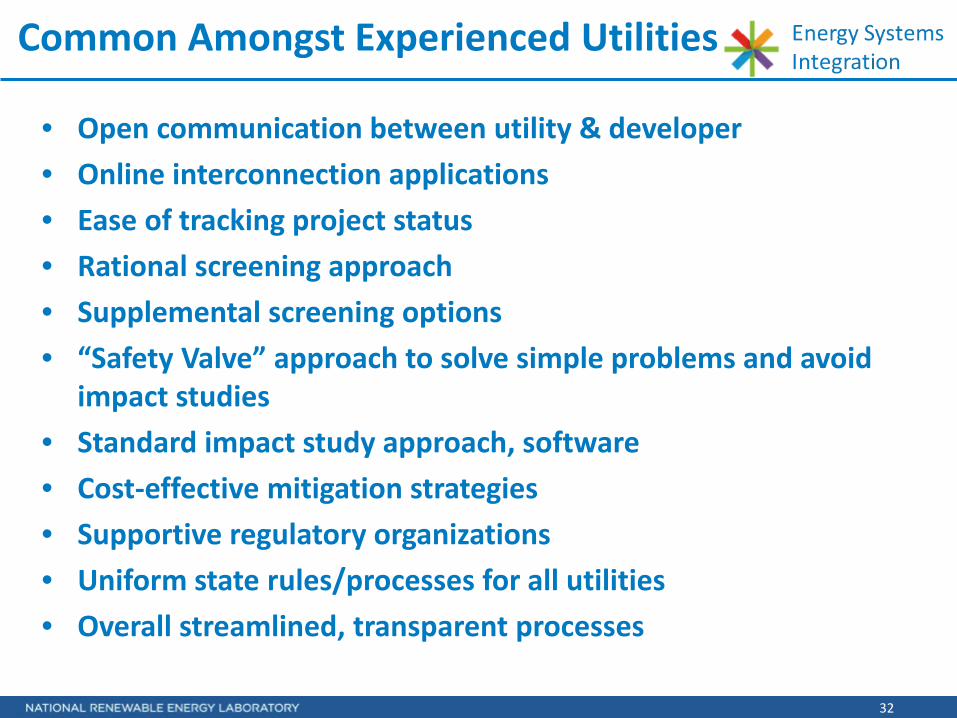
Common Amongst Experienced Utilities
• Open communication between utility & developer • Online interconnection applications • Ease of tracking project status • Rational screening approach • Supplemental screening options • “Safety Valve” approach to solve simple problems and avoid
impact studies • Standard impact study approach, software • Cost-effective mitigation strategies • Supportive regulatory organizations • Uniform state rules/processes for all utilities • Overall streamlined, transparent processes
32

February 1, 2016
II Pepco Holdings. An Exelon Company
DOE Grant “Sunrise” Report
Presented by Steve Steffel
33

!,_) Clean Power Researc "
Edward J Blaustein Sdmol of Planning and Public Policy
-/Ji §~partm~t~P.t II Pepco Holdings.
An Exelon Company
Model-Based Integrated High Penetration Renewables Planning and Control Analysis
34

par,2,~9.t II Pepco Holdings.
An Exelon Company
SUNRISE Department of Energy Grant
Model-Based Integrated High Penetration Renewables Planning and Control Analysis
Award # DE-EE0006328 Contributors
Pepco Holdings Electrical Distribution Design, Inc Clean Power Research Center for Energy, Economic & Environmental Policy (CEEEP), Rutgers University
New Jersey Board of Public Utilities
35
II Pepco Holdings. An Exelon Company
SUNRISE Department of Energy Grant
Acknowledgement: This material is based upon work supported by the Department of Energy Award Number DE-OE0006328.
Disclosure: “This report was prepared as an account of work sponsored by an agency of the United Sates Government. Neither the United States Government nor any agency thereof, nor any of their employees, makes any warranty, express or implied, or assumes any legal liability or responsibility for the accuracy, completeness, or usefulness of any information, apparatus, product, or process disclosed, or represents that its use would not infringe privately owned rights. Reference herein to any specific commercial product, process, or service by trade, name trademark, manufacturer , or otherwise does not necessarily constitute or imply its endorsement , recommendation, or favoring by the United States Government or any agency thereof . The views and opinions of authors expressed herein do not necessarily state or reflect those of the United States Government or any agency thereof .”
Solar Utility Networks: Replicable Innovations in Solar Energy (SUNRISE)
36

II Pepco Holdings. An Exelon Company
Introduction
The proposal was put together to address several identified industry needs : • Many customers with PV, tend to export during times of low native load and can raise voltage at their premise, sometimes over 126V on a 120V base, and now need “Voltage Headroom”.
• High penetration feeders and feeder sections are starting to exhibit violations such as high voltage. There are a number of optimization and control setting changes that could provide the means to increase hosting capacity at a reasonable cost. These needed to be studied and the cost/benefit of using these approaches published.
• Real time optimized control of feeder equipment can impact Hosting Capacity, so one goal was to test dynamically adjusting Voltage Regulator and Inverter settings to see the impact on Hosting Capacity.
• A voltage drop/rise tool is needed for reviewing voltage rise between the feeder and meter, especially when multiple PV systems are attached to a single line transformer.
37

II Pepco Holdings. An Exelon Company
Hosting Capacity Study Overview
Twenty radial distribution feeders selected from ACE, DPL and Pepco service territories
A hosting capacity study was performed on each feeder to determine how much additional PV it could support in its current configuration
Several improvements were performed on these circuits. After each improvement or combination, the hosting capacity of the circuit was reevaluated in order to determine the impact on the amount of PV that could be hosted
A cost-benefit analysis was performed in order to evaluate the expected costs of each feeder improvement and how each one was able to increase the hosting capacity of each feeder
It is hoped that these results can be generalized by PHI and other distribution utilities in order to understand how they can improve the hosting capacity of their feeders and facilitate the deployment of more PV generation at the distribution level
38
stem existing
Pen Lev --------.
L/ ___ E_n_d_P_•n_L_•_v~/ ··················.i.
End lte ration Number
N j- j+l
N
Start
rL/ ___ Pv_s;_,._~/ ~---G_•_t_in_p_u_t ~pa_r_a_m_e_te_,_' --~•--··7
t._
Run DER Impact to check system violat ions under existing Penlev
Update next penetration level as
Pe nlev_i = Penlev_i-1 + StepSize
Randomly place new PVs into syst em until reach Penlev_i
Run DER Impact to check system
violations
Remove placed new PVs from system
y
y )'
( _____ End____,)
Penetration Step Size
Violation
Reports Database
Algorithm Flow
Data Flow ............... ,.
II Pepco Holdings. An Exelon Company
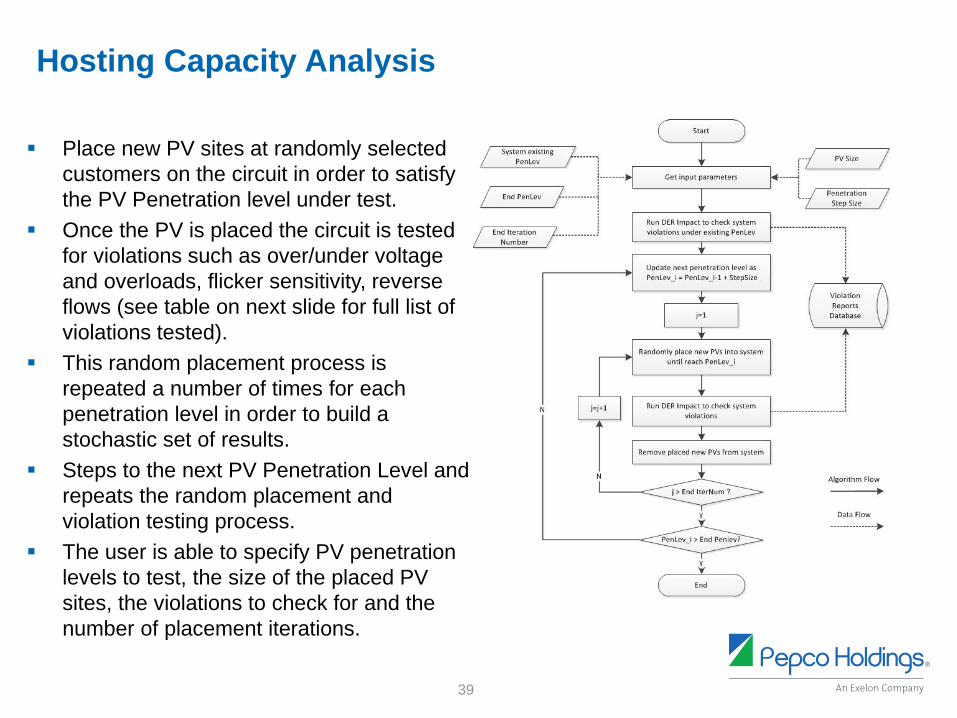
Hosting Capacity Analysis
Place new PV sites at randomly selected customers on the circuit in order to satisfy the PV Penetration level under test.
Once the PV is placed the circuit is tested for violations such as over/under voltage and overloads, flicker sensitivity, reverse flows (see table on next slide for full list of violations tested).
This random placement process is repeated a number of times for each penetration level in order to build a stochastic set of results.
Steps to the next PV Penetration Level and repeats the random placement and violation testing process.
The user is able to specify PV penetration levels to test, the size of the placed PV sites, the violations to check for and the number of placement iterations.
39

I
:.---------------------------------------------------------------------------------------- (> I I I I I I
--'-1 I .J
II Pepco Holdings. An Exelon Company
Typical PV System Impacts on a Distribution Circuit
–
–
reduction of protective reach
B R R R
R
POI
SOURCE IMPEDANCE
(TRANSMISSION AND
GENERATION SYSTEM)
OTHER CUSTOMERS
OTHER OTHER OTHER
ACE BANK
CUSTOMERS CUSTOMERS CUSTOMERS OTHER
CUSTOMERS OTHER
SUBSTATION
VOLTAGE REGULATOR
VOLTAGE REGULATOR
CUSTOMERS
CAPACITOR CAPACITOR BANK
2 MW SOLAR INSTALLATION
Impacts: Voltage – Steady state and fluctuations forcustomers and automatic line equipment Safety/Protection – Increased available fault currents, sympathetic tripping, reverse flow,
– Loading – Increases in unbalance, masking ofdemand, capacity overloads
– Control Equipment – potential for increased operations for voltage regulators, capacitors and under load tap changers
– Power Quality – potential for harmonic issues 40

Variable Comparison Threshold
Customer Level Overvo lt age (Steady-State) > 123.5
Customer Leve l Undervo ltage (Steady-State) < 116.5
Line Transformer Overvo ltage (Steady-State) > 123.5
Line Transformer Undervo lt age (Steady-State) < 116.5
Line Transformer Temporary Overvo ltage (Du ring PV output Change) > 126
Line Transformer Temporary Undervo lt age (During PV outp ut Change) < 114
Generator PO I Overvo lt age (Stead y-State) > 126
Generator PO I Undervo ltage (Steady-State) < 114
Generator PO I Temporary Overvo ltage (Du ring PV output Cha nge) > 126
Generator PO I Tempora ry Undervo ltage (During PVo utput Change) < 114
Generator PO I Flicker Sens it ivity (Irr itabi lity - PV St ep Up) > 2
Generator PO I Flicker Sensit ivity (Irritabi lity - PV Step Dow n) > 2
Vo ltage Change at Vo lt age Co ntro ller (During PV outp ut Change) > 1/ 2 BW
Vo ltage Regu lator Reverse Flow < -0.1
Protective Device Reverse Flow < -0.1
Feeder Reverse Flow < -0.1
Feeder Current Im balance > 20
Component Vo ltage Imba lance > 3
Component Over load > 100
PV output step change used for analysis: 100% - 20% on all PV sites (% of clear sky output)
Analysis performed at t ime point w ith maximum generation/ load ratio
Units Comment
Vo lts Seconda ry
Vo lts Seconda ry
Vo lts Primary
Vo lts Primary
Vo lts Primary
Vo lts Primary
Vo lts at PO I
Vo lts at PO I
Vo lts at PO I
Vo lts at PO I
Vo lts at PO I
Vo lts at PO I
Vo lts at Vreg or Cap
kW Reverse Pow er
kW Reverse Pow er
kW Reverse Pow er
%
%
%
II Pepco Holdings. An Exelon Company
Hosting Capacity Violations
41

.0 ct!
·;::
~ C 0
".j:i ct!
0
>
Strict Penetration
Limit
Maximum Penetration
Limit
PV can be added anywhere in feeder, no
issues expected
PV can be added to feeder but only in certain locations, interconnection study required
PV Penetration
•
•
PV can't be added anywhere on feeder.
Feeder is closed to additional PV
Violation Threshold
II Pepco Holdings. An Exelon Company
PV Penetration Limits
• Each point corresponds to one random placement of PV satisfying the PV Penetration on the horizontal axis
• Vertical position of each point is the highest observed violation value forthat placement of PV
• If the point falls above the violation threshold, it represents a placementof PV which results in an issue on the circuit
• The Strict Penetration Limit occurs at the point below which all tested random placements are under the violation threshold
• The Maximum Penetration Limit occurs at the point past which alltested random placements are above the violation threshold
42

II Pepco Holdings. An Exelon Company
Feeder Improvements
Base: circuit as-is (existing PV included) Balanced: phase balancing performed on the base case Capacitor Design: moves existing or places additional capacitors in order to flatten feeder voltage profile and optimize the capacitor placement
Reduced Voltage Settings: voltage regulation and LTC set-points are lowered as far as possible while still maintaining acceptable customer voltages at peak load
Dynamic Voltage Control: voltage regulation and LTC set-points are adjusted over time to be as low as possible while still maintaining acceptable customer voltages at each time point (i.e. using FSMA tool to determine optimal Vreg settings over time)
Fixed PF: power factor of randomly placed inverters are set to a fixed, absorbing power factor of 0.98. Existing PV sites are unmodified (i.e. all new PV on feeder required to operate at 0.98 absorbing)
Battery Storage: battery storage in a daily charge/discharge schedule is added to circuit in order to add effective load at peak PV production times
43
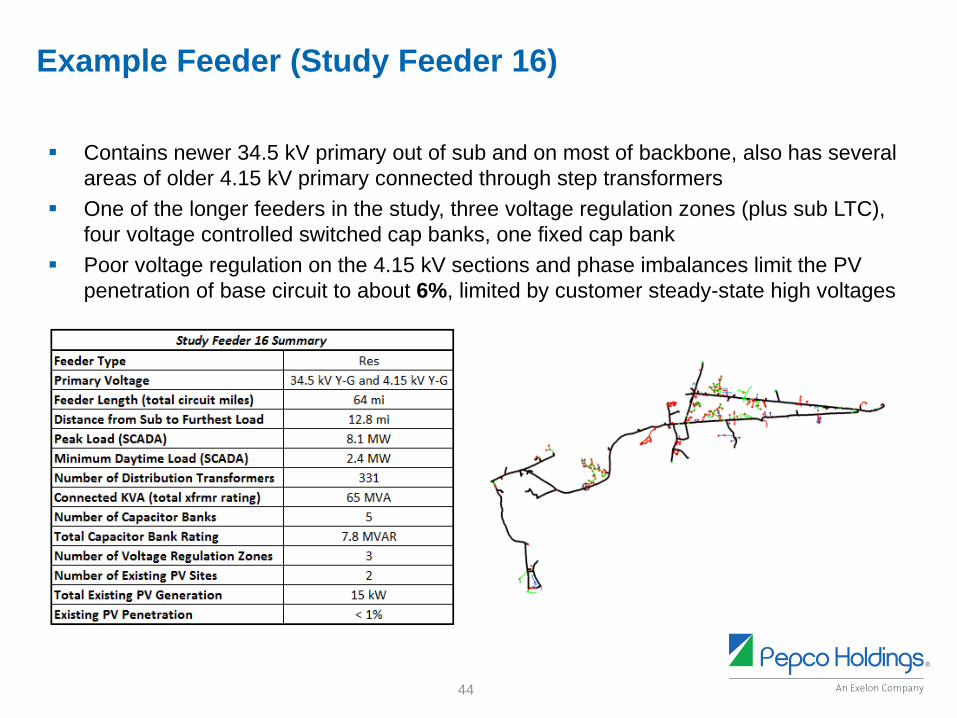
tudy Feeder 16 Sum m ary
Fe,eder Type Res
Primary Voltage 34.5 kV Y-G an d 4.15 kV Y-G
Feeder l ength (total circuit miles) 64 mi
Dist ance from Sub t o Furthest l oad 12.8 mi
Pea k Load (SCADA) 8.1 MW
Minimum Daytime Load (SCADA) 2.4 MW
Number of Distribution Transformers 331
Connected KVA (tot al xfrmr rating) 65 MVA
Number of Capacitor Banks 5
Tot al Capacitor Bank Rating 7.8 MVAR
Number of Voltage Regulation Zones 3
Number of Exi sting PV Sites 2
Tot al Existing PV Generation 15 kW
Exi sting PV Penetration < 1%
II Pepco Holdings. An Exelon Company
Example Feeder (Study Feeder 16)
Contains newer 34.5 kV primary out of sub and on most of backbone, also has several areas of older 4.15 kV primary connected through step transformers
One of the longer feeders in the study, three voltage regulation zones (plus sub LTC), four voltage controlled switched cap banks, one fixed cap bank
Poor voltage regulation on the 4.15 kV sections and phase imbalances limit the PV penetration of base circuit to about 6%, limited by customer steady-state high voltages
44
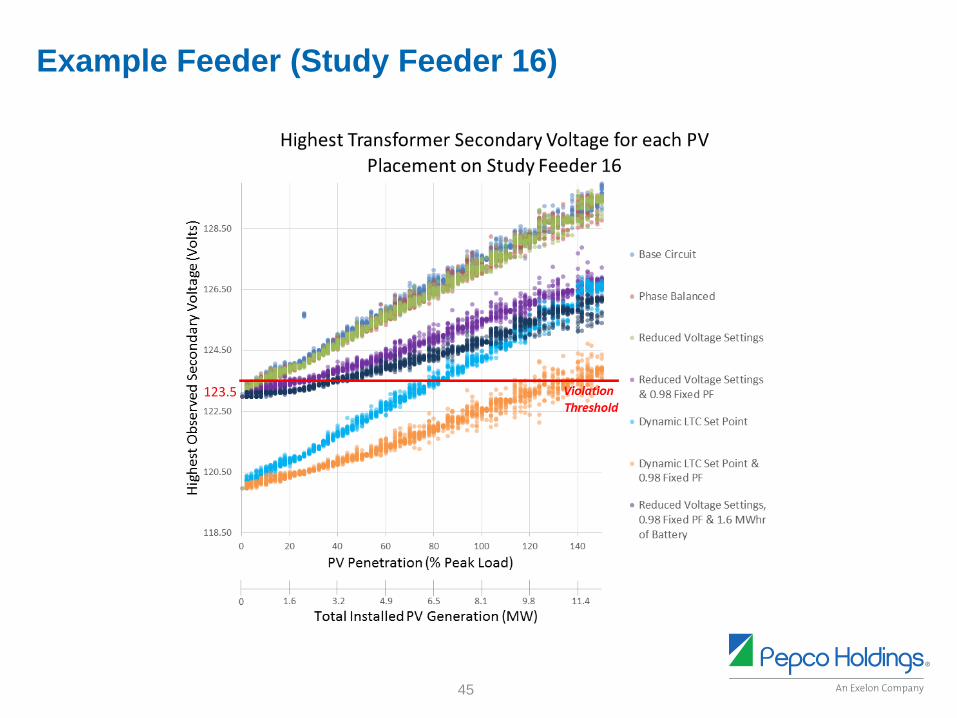
tJ 128.50
0 2:.
Q) tl.0 ro
.:!= 126.50 0 > >-.... ro
"U 5 124.50 u Q)
V)
"U Q) > <ij 122.50 VI
..0 0 ~ Q)
""SJi 120.50
I
118.50
0
0
Highest Transformer Secondary Voltage for each PV Placement on Study Feeder 16
20 40 60 80 100
PV Penetration{% Peak Load)
t---
120
1.6 3.2 4.9 6.5 8.1 9.8
Total Installed PV Generation {MW)
140
11.4
• Base Circuit
• Phase Balanced
Reduced Voltage Settings
• Reduced Voltage Settings
& 0.98 Fixed PF
• Dynamic LTC Set Point
Dynamic LTC Set Point & 0.98 Fixed PF
• Reduced Voltage Settings,
0.98 Fixed PF & 1.6 MWhr
of Battery
I Pepco Holdings. An Exelon Company
Example Feeder (Study Feeder 16)
123.5
45

II Pepco Holdings. An Exelon Company
Strict Penetration Limit Increase for Each Feeder
Strict Penetration Limit (Before and After)
Feeder Base Case Max. Penetration w/ Upgrades PV (%) PV (MW) Cost (k$) PV(%) PV(MW) Cost(k$)
1 29.7 1.0 0.0 167.9 5.9 60.2 2 29.7 1.5 0.0 197.1 10.4 32.5 3 53.6 2.2 67.9 264.7 10.9 149.3 4 34.9 1.2 0.0 134.5 4.8 22.0 5 43.7 2.0 67.3 193.7 8.7 96.8 6 38.9 2.6 0.0 219.6 14.5 78.5 7 36.9 1.9 0.0 92.7 4.7 131.4 8 23.8 1.4 0.0 129.2 7.6 2.0 9 1.9 0.1 0.0 161.3 8.1 21.0 10 12.8 0.3 0.0 62.9 1.6 27.5 11 39.0 2.0 37.2 61.0 3.1 178.3 12 8.0 0.7 37.2 11.9 1.0 118.7 13 2.9 0.2 0.0 104.9 5.8 150.2 14 15.9 1.5 0.0 18.0 1.7 33.0 15 20.0 1.6 0.0 76.0 6.2 21.5 16 5.9 0.5 59.7 63.9 5.2 167.1 17 17.0 2.0 0.0 104.9 12.1 31.0 18 42.9 2.8 0.0 336.7 22.2 25.0 19 25.9 1.6 74.0 67.8 4.1 80.0 20 44.9 2.7 0.0 184.6 11.0 2.5
AVERAGE 26.4 1.5 17.2 132.7 7.5 71.4
Minimum Increase
Maximum Increase
Notes: The above feeders do not include battery deployment. The above feeders represent different voltage levels.
46

3PhZOFA (A ) 3PhZOFA (B) 3PhZOFA (C) lPhZOFA (A ) lPhZOFA (B,) lPhZOFA (C)
PV off 932.7 '932.7 '932.7 '9159 9159 '915'9
PV on 9,431 9'4'61 9,44-5 '92:65 92.9'4 92.77
Ch ange 104 134 119 105 135 118
% 1.1 1.4 1.3 1.2. 15 1.3
II Pepco Holdings. An Exelon Company
Protection and Coordination
Protection and coordination studies were performed on feeders 6 and 13
These studies were performed at the maximum penetration limit forthe battery storage cases, representing worst case scenarios forinverter fault contributions (maximum amount of allowable PV andinverter battery storage)
Even at these worst case scenarios the inverter fault current was not enough to interfere with existing protection. From these results it canbe expected that protection issues will not limit PV deployment lowerthan the penetration levels determined in the hosting capacity studies.
Study Feeder 6 - Maximum Fault Currents
47
.. ,oou2
Holr.,o'lil'lW/Lotd
'51'1110 Pv:1'14kW
75n•2 HQuse 112 1 St\'i L°'O
_,_ ,_ .,,.._ ,.. ... - 0,..,, °""' - .. _ ' , .... ~ t,
'ie"""'Soia" Hl:luw.r31.0twtaao HfNM•)IJ)~NlOld t::lul "" - - .. . "'" "'"' Jtl.jll UI Pffl ...... 4/ll101 11~ PM VOh'9'$cill(l iH1W1Cr.tl.01Wl~ HouM:tll..O~Nl,Old to,llt.u. .... ,..,. ,.., 1~, ~
,t,im\ t lW~M "eli.,gcSowc lHo,1,!M.t•Jtwload ~UJ~Nlo,11 , ...... ~'t' IQ USJ6 '" --+----, ...,
''" ,. .f.llnoUl.lmoPM Veh.")'Swlo H-.QJ~hld 1-iwJt.tlJW/lo,ad lo1il!.,J lMV Ul.M ""' tm ... .fi'lfl[IUl2:00P~1Vohto)c~elkKM~2t.Wload Housc~ZiW'lotd Load~ KghV ,,.., l!5.'1 ,.,, ...
1001'14.'D eon1112 4ll/2D:U IZMPM Vohl')CSwll:e lio!M~2t.WlOAo~ tiwM:~.:,:Wl!Hd loadlul lMV u,.o, "'" lll,l ... 4flll[IU llro PM Vall-,eScvi:e llouw•2151Wlot~ Hw$.t.-Zl.5fflla.d Loadb ..,.. uom LU.DI LDI .. F1~
~it310WJLoed mnD.l.Hl.OO=PM Vob,;cSouKt lkKM•21.SlWL.c.d Hww •21.5lWlDld Loadka LMV ltUXl IDJll llDl ... PVM3'1WJ Ul/2llH 12.:NPM V;h~*i(t Blc\'A.lX ~WATX St«aWfl, __ 0.-W.d ,,. lJl ,., ., M
l® f'l-,.0 SK~CW-0.llfo.d ""' lOOI ""' ... 75ntr IIQfl .. 2 ~(fflll_ Omi:iad lllJO ... "'"' ·~ ?~ ltlAI ~Cond..~ ,.,,. 'ii;- .... ...
eon02 l!iO tt•l" ~ConoL~~ "" '"" ·~ Housc,it43kWl.OW :!01\1/0 $it,:..,.,~- U>Ol - uua ...
PVUSkW O tWO ~(on4-~ ,.,,. "'
,.,. ... 100!1~ Stt~(Clftct_ ()mfaad ,n.,o au """ ... nu1 St(ONSay(Clllct- Omload ""' '"' - Pffl
"""" 15'1,:MdFb,r,1
II Pepco Holdings. An Exelon Company
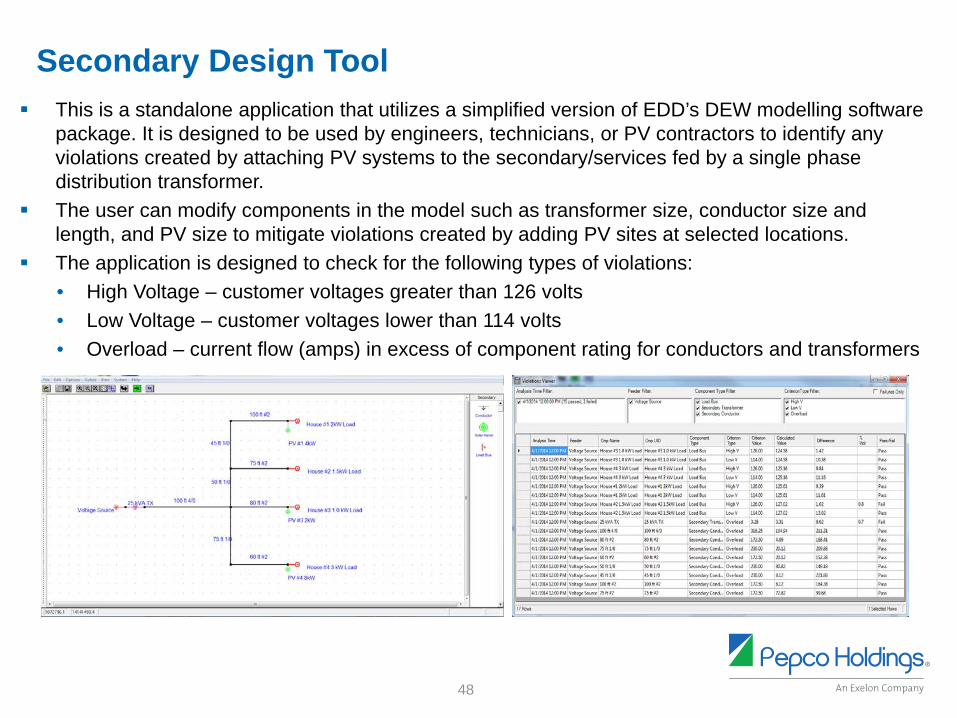
Secondary Design Tool This is a standalone application that utilizes a simplified version of EDD’s DEW modelling software
package. It is designed to be used by engineers, technicians, or PV contractors to identify any violations created by attaching PV systems to the secondary/services fed by a single phase distribution transformer.
The user can modify components in the model such as transformer size, conductor size and length, and PV size to mitigate violations created by adding PV sites at selected locations.
The application is designed to check for the following types of violations: • High Voltage – customer voltages greater than 126 volts • Low Voltage – customer voltages lower than 114 volts • Overload – current flow (amps) in excess of component rating for conductors and transformers
48

House#7
House#8
House#9
House#10
House#1
II Pepco Holdings. An Exelon Company
Secondary Design Tool (Example) 10 Homes on a single transformer, 5 homes with PV systems totaling 54.6 kW
49

Feeder I Component Name I Component U ID I Component Type I Phase I kW I kVAR I kVA I Voltage . .. . 50 kVA TX 50 kVATX Second ary T ra n_sform er AB -47 .09 2.97 47 126 .0
Voltage Sourc e 209 ft 209 ft Seconda ry Conductor AB -11.05 0 .13 11 130 .6
V olta ge Sourc e PV #6 PV #6 Inv e rte r Ty pe DR AB -12.00 0 .00 12 130 .6
Voltag e Sourc e Hou.se #S Hou s.e #8 Lo ad Bu s. AB 0 .54 0 .11 1 130 .6
Vo ltage Sourc e 281 ft 281 ft Seconda ry Condu ct or AB -12.36 0 .15 12 133 .0
Voltage Sou rce PV#4 PV#4 Inv e rte r Ty pe DR AB -7 .60 0 .00 8 133 .0
Voltage Sourc e PV # 5 PV#5 Inv e rte r Ty pe DR AB -6 .00 0 .00 6 133 .0
V olt age Sou rce H o us.e -#6 Hous.e -#6 Load Bus. AB 0 .55 0 .11 1 133 .0
Volta ge Sourc e 80 ft 80 ft Second ary Conduct or AB -10.33 0 .12 10 127 .6
Volt ag e Sou rce PV#3 PV#3 Inv e rte r Ty pe DR AB -11.00 0 .00 11 127 .6
Voltag e Source Hous.e # 4 Hous.e # 4 Load Bu s AB 0 .53 0 .11 1 127 .6
Volt age Sourc e 47 ft 47 ft Second ary Condu ctor AB 0 .52 0 .11 1 125 .9
Voltag e Sourc e H ou.se # 3 Hou s.e #3 Lo ad Bu s. AB 0 .52 0 .11 1 125.9
Vo ltage Sourc e 175 ft 175 ft Second ary Conductor AB 0 .52 0 .11 1 125 .8
Volt ag e Sou rce House # 5 Hou se # 5 Lo ad Bus AB 0 .52 0 .11 1 125 .8
Volt age Sourc e 131ft 131 ft Second ary Conductor AB 0 .52 0 .11 1 125 .8
Volt age Sourc e H o us.e #2 Hou s.e #2 Load Bus. AB 0 .52 0 .11 1 125 .8
V olta ge Sourc e 209 ft 209 ft Secondary Conduct or AB -11.98 0 .14 12 131.0
Vo lt ag e So u rce PV #l PV #l Inv e rte r Ty pe DR AB -10.00 0 .00 10 131.0
Volta ge Source PV#2 PV#2 Inv e rte r Ty pe DR AB -3 .00 0 .00 3 131.0
Volt age Sourc e H o us.e #l Hou s.e #l Lo ad Bu s. AB 0 .55 0 .11 1 131.0
Volta ge Source 306 ft 306 ft Sec ond ary Conduct or AB 0 .52 0 .11 1 125 .7
Vo lt ag e Sourc e Ho use #7 Hou ; e #7 Lo ad Bu s AB 0 .52 0 .11 1 125 .7
Vo lt ag e Sou rce 130ft 130 ft Seconda ry Conductor AB -4.45 0 .11 4 126 .7
Voltage Source PV #7 PV#7 Inv e rte r Ty pe DR AB -5 .00 0 .00 5 126 .7
Volt age Sourc e H o u.se #9 Hou s.e #9 Lo ad Bu s. AB 0 .53 0 .11 1 126 .7
V olta ge Sourc e 118 ft 118 ft Seconda ry Conductor AB 0 .52 0 .11 1 125 .9
Volt ag e So u rce House #l0 Hou se #l0 Lo ad Bus AB 0 .52 0 .11 1 125 .9
II Pepco Holdings. An Exelon Company
Secondary Design Tool (Example cont.)
Based on the assumptions used in this analysis, there are some premises with high voltage.
High Voltage
Voltage OK
50

9DkW- solar 2&5kW- Solar 11.1 kW - Solar 14.5kW - Solar B4877 B49D9
P" Freeze Controllers After Rurmirig
rTo3 Max VReg Step lmbalaooe: [2"3
P" Check Secondary Cu,s!V
Max Cu,st V (120V Base): 1126 D ~ Min Cu,st V (120V Base): 1114 Djj
Min Avail Capaoiti/ (.11.mps): [o:B Max Flicker (120V Base): [20"3
Min Voll Viol Improvement (120V Base): [o.s3 Min Overloa<l lmprovemenl (.11.mps): µo"3
Min Efficiency In provemenl (kW) : [o.G"3 Min Load Reduction (kW): fmo3
Min Flicker Re<luction (120V Base): !023 Min Pl/ To Attempt P.F. Cllartg.e (k\li/) : 1750 :B
Capacitor Step Cost: rTo3 VReg Step Cost: !023
Cost Per Curtailed Pl/ kW lo.04 :B r Ignore Flioker Constrai nts
OK Canoel
II Pepco Holdings. An Exelon Company
Forecast, Schedule, Monitor, Adjust (FSMA) Tool Application within EDD’s DEW modelling
software package, it is designed to be used for operations monitoring using real-time measurements
Also can be used for detailed planning analysis using time step simulation that will allow planners to evaluate control device interactions with PV and load changes using historical load measurements, historical PV output data from CPR and NREL, and historical measurements from SCADA
Inputs all of these measurement sources, attaches the measurement values to a distribution feeder model and to determines optimal voltage regulator, capacitor bank and inverter controller settings in order to maximize a set of user defined objectives while minimizing control costs
Uses a tabular search to determine the optimal control positions for capacitors, voltage regulating transformers, and solar panel supplying inverters with user-configurable weighting factors
51

SCADA Communications on Regulator
j
I
PY Systems.With 480V
Pole-Mount Monitors
1EOO.O
1,*XLO
1:D:1..0
1COO.O
= 0.0
=
____.... ..--
Power f low
~
~.?"' -,,r /
-- ,AC
fti,Y,\i-Wln!lE':llm!!!E!lllml:!l.ll.lm!lllllll!lE!lllll!E!I 1§4-!·f.- ~ 1117..0 1~ 1 174$..6 1™ 1761.1 IHA.PGitM ~ ,..s 11 10. 1 15 11-6 1741-7 17S L':I 1677.3
fu.!11, Q.97$ 0..6:.""':f.i 11~ 03~ .=..~ 4.7~
,~, ,~(I
,;g..~
12:l-.O
12t.5
12?.0
121.5
12H)
120.~
,ao 11t.~
Vol!age Profile
---
;i~,;u )07.,. no ou :i.~ PU i~ "'-' ·~- • Ii""' or»- .... ..., !$-(Ki ou , D ..,_.
cu,t 'II IC! .,.,. rgko
- o.- ... ,~
1:::::: 1 .....
o..-1-1$1
1:~
1:.:3 '-·
1~= 1~ .0
1 ,L:3;
1:'.1
1....: 0.€<;
0-6~ om ·
II Pepco Holdings. An Exelon Company
FSMA Demonstration • Study Feeder 11 - Industrial/Residential circuit with
1.9 MW of PV • Input real time SCADA data and voltage readings to
program (FSMA), implement forecasted values in the field
• Solar output forecast using Clean Power Research data
• Testing was done on relatively sunny days with moderate temperatures
52

II Pepco Holdings. An Exelon Company
Conclusions
Every feeder is unique and can have a different hosting capacity There are a number of methods to leverage existing equipment to increase Hosting Capacity and provide Voltage Head Room
Phase Balancing shows little direct impact, but it is important to keep the circuit balanced as PV penetration increases
Dynamic Volt/VAR will take new controls, communications and central logic to run (some utilities have already implemented Volt/VAR control, may need some new logic)
Smart Inverters have promise but modeling and operation at high penetration levels still poses some unknowns
Even after dealing with Voltage issues, reverse power on V. Regs., on Power transformers, Distribution Automation Schemes, loading and protection issues will make analysis more complex
For higher penetration levels on the distribution system, it will be important to keep an eye on the Transmission system
53

February 1, 2016
II Pepco Holdings. An Exelon Company
DER Interconnection Review Process
Presented by Steve Steffel and Evan Hebert
54

II Pepco Holdings. An Exelon Company
Interconnection Review Processes
• Due to an increased volume of applications, PHI implemented a comprehensive review process for DERs applying to interconnect to the grid
• As PV penetration increases, in general, operating issues also increase
• This review process was put in place to ensure safe and reliable interconnection for both the grid and the DER
55

0 Grid-tied Solar Rooftop
Industrial, Commercia l, Residential
·· =€)· ·· ·- @ ·
Inverter
. .. .. · .... ...
Sun Light
~ -. ,
Transmiss ion
.===-:::~ ~ ~! l --------------------------------1
: Typical Distribution Feeder
~ ~-M j,---------- ,
. .:=. i : . . ~- • ' ~~ ~,: j . .
• I .-.et: , •• 1 $1,19,S TATl(llli :
• • • L____J -- ---
i \:{ 1
i G i ::~: ·--------·
'··. ·· .... ········· .....
DER Affects the Entire Electric System • Voltage challenges at low load
• Near term, it will reduce losses, on high penetration losses may increase
• Increase phase unbalance for three phase circuits
• Capacity spikes may overload equipment
Voltage Safety
Feeder & Substation
Transmission
POI
Generation
• Scheduling changes required to meet volatile load
• May increase need for ancillary services
• Steep ramp rate when sun goes down affects capacity needs
Home Power Quality
• Higher voltage caused by generation reduces efficiency of appliances and HVAC
• Can stress appliances or motors
Interconnection Pt.
• Inverters trip or cloud shear can create volatility
• Must maintain voltage within mandated bands
• Net metering masks true load demand
Dist. Automation
• Every POI requires study to determine impacts to the system and other customers
• The customer is required to pay for the upgrades
• DER can prevent DA schemes from locating fault
• True load to be transferred not easy to calculate
• High or low voltage can result in mis-operation, damage, or reduced equipment life – both on the grid or at premises
• Can increase fault current level
• Trip of breaker or recloser may result in inverter out of synchronization
• Reduction of protective reach
56

February 1, 2016
II Pepco Holdings. An Exelon Company
System Reliability – Interconnection Requirements
Reliability of the electric system requires criteria that can be used to assess the impact of DER on the grid. Criteria includes: Accurate single-line drawing of the proposed generator system submitted with each application
UL 1741-certified inverters System passes electrical inspection Systems shall not overload line transformers or cause high voltage for themselves or adjacent customers (otherwise upgrades would be required)
Single Phase Limit — the largest capacity single phase generator or DER (battery) operating in parallel with the grid is 100 kW. Above that size, a balanced 3-phase system is required
57
February 1, 2016
green po'!"e c~ nnect1on·M II Pepco Holdings.
An Exelon Company
Levels of Engineering Review
Pre-screen Screen Advanced Study
58
February 1, 2016
II Pepco Holdings. An Exelon Company
Engineering Pre-screens
Required for systems between 50-250 kW Option 1: Determine distance from substation, radial or lateral connection and voltage level • Main radial connections typically have larger wires, allowing systems further away to interconnect without problems
• Higher tolerance for larger voltage levels (25 kV vs 12 kV) Option 2: Calculate impedance at point of interconnection (POI) Failed Pre-screen
• Distance from substation and size of system are not in the allowable range to pass the pre-screen or impedance is too high
• Screen is required • Operating requirements must be signed by customer (not required if application passes pre-screen)
59
February 1, 2016
II Pepco Holdings. An Exelon Company
Engineering Screens
Required for systems > 250 kW or failed the pre-screen High level power flow analysis required Screening Criteria
• Voltage fluctuation is not greater than 2% at the POI or half the deadband at any capacitor or regulator
• Reverse power-generation does not exceed 80% of the daytime minimum load at voltage regulators, feeder terminals and/or substation transformer without proper mitigation
• DER does not cause high voltage anywhere on the circuit
60

February 1, 2016
II Pepco Holdings. An Exelon Company
Engineering Screens
Step 1: Ensure accurate model • Power flow (MVA, MW, MVAR) at peak and minimum load (typically use SCADA at feeder terminal to verify load)
• Capacitor, voltage regulator and LTC settings • Power factor at feeder terminal • Large customer loads • Nearby PV installations (systems within ~2,000 ft. of proposed system will act as one system during cloud passing)
Additional Information • Back-up feeders • Distribution automation schemes
61
February 1, 2016
II Pepco Holdings. An Exelon Company
Engineering Screens
Step 2: Peak Load Voltage Study • Run power flow at peak load with generators on • Lock capacitors and voltage regulators to prevent from operating • Turn generation on/off and record voltage at POI and closest capacitor or voltage regulator
• Calculate difference to determine voltage fluctuation – If fluctuation is greater than 2%, apply absorbing power factors from 0.99 to 0.95 until criterion is met
– If above method fails, reduce the size of system until violation no longer occurs
62
February 1, 2016
II Pepco Holdings. An Exelon Company
Engineering Screens
Step 3: Minimum Circuit Load Voltage Rise Study • Run power flow at minimum load with generators on and capacitors and voltage regulators unlocked
• Record highest voltage on feeder – If voltage exceeds upper limit, apply power factor from 0.99 to 0.95 absorbing power factor until criterion is met
– If power factor mitigation does not work, reduce size of system until high voltage no longer occurs
• Lock capacitors and voltage regulators to evaluate voltage fluctuation (similar to peak load study)
63

February 1, 2016
II Pepco Holdings. An Exelon Company
Engineering Screens
Step 4: Reverse Power • If the aggregate generation exceeds 80% of the daytime minimum load at a specified location, the following mitigation techniques are required: – Feeder Terminal – Relay package as determined by Atlantic City Electric System Protection
– Voltage Regulator – Install Beckwith controller with co-generation mode
– Substation Transformer – Transfer trip
64
February 1, 2016
II Pepco Holdings. An Exelon Company
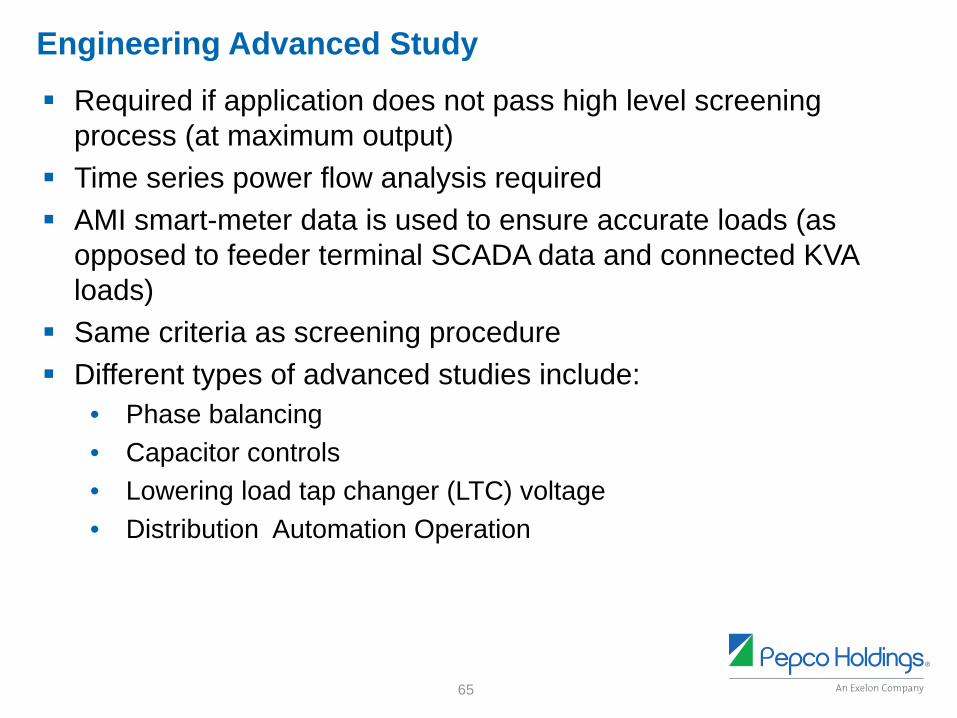
Engineering Advanced Study
Required if application does not pass high level screening process (at maximum output)
Time series power flow analysis required AMI smart-meter data is used to ensure accurate loads (as opposed to feeder terminal SCADA data and connected KVA loads)
Same criteria as screening procedure Different types of advanced studies include:
• Phase balancing • Capacitor controls • Lowering load tap changer (LTC) voltage • Distribution Automation Operation
65
February 1, 2016
II Pepco Holdings. An Exelon Company
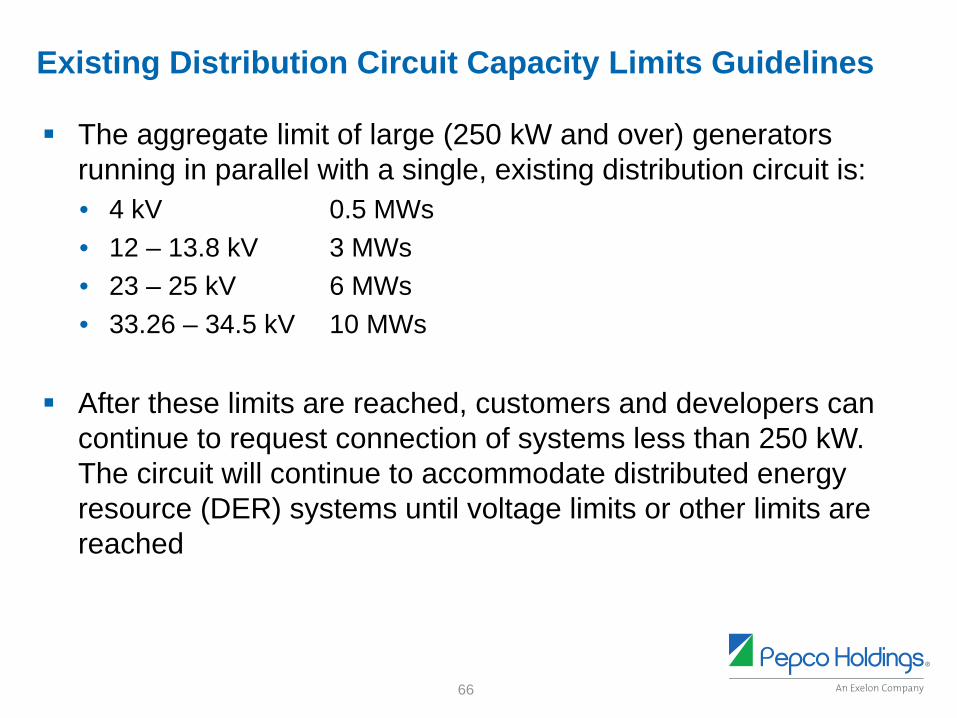
Existing Distribution Circuit Capacity Limits Guidelines
The aggregate limit of large (250 kW and over) generators running in parallel with a single, existing distribution circuit is: • 4 kV 0.5 MWs • 12 – 13.8 kV 3 MWs • 23 – 25 kV 6 MWs • 33.26 – 34.5 kV 10 MWs
After these limits are reached, customers and developers can continue to request connection of systems less than 250 kW. The circuit will continue to accommodate distributed energy resource (DER) systems until voltage limits or other limits are reached
66

February 1, 2016
II Pepco Holdings. An Exelon Company
Express Circuit Capacity Limits
Distributed generation installations which exceed the limit for an existing circuit require an express circuit. The maximum generator size for express circuits is:
• 4 kV 0.5 MWs • 12 – 13.8 kV 10 MWs • 23 – 25 kV 10 MWs • 33.26 – 34.5 kV 15 MWs
The maximum length of an express feeder shall be 5 miles and must have demand and energy losses less than 3%
67

February 1, 2016
II Pepco Holdings. An Exelon Company
Distribution Power Transformer Limit
The aggregate limit of large (250 kW and over) generator injection to a single distribution transformer of 22.5 MVA nameplate or larger is 10 MWs. Transformers with nameplate ratings lower than 22.5 MVA may be given lower generation limits.
We will consider adding a new transformer if there is no availability on any of the existing transformers and space is available in an existing substation. Any proposed transformers would be PHI’s standard distribution transformer (37 MVA nameplate rating).
68

February 1, 2016
II Pepco Holdings. An Exelon Company
Network Solutions
Spot and Area Networks — to ensure a safe level of import, if Pepco Holdings determines that the proposed system could export or cause the network protector to operate, the following control scheme will be required: • Customer shall install a monitoring system on the service(s) to the facility and install inverters that can receive a control signal and curtail output to maintain the target level of import on each phase
• Customer system shall provide a web link and access to PHI to have read-only access to view the electrical parameters and operation of the system
• Customer shall provide an alert to PHI via email or text if the import goes below a set point
• Customer shall send a trip signal to the inverters if the import level falls to another set point
69
February 1, 2016
II Pepco Holdings. An Exelon Company
DER Advanced Modeling Tools and Results
70

II Pepco Holdings. An Exelon Company
Purpose for Pursuing Advanced Modeling Tools
• The need to do detailed time series studies for the interconnection of DER
• The ability to assess aggregate impact of DER continuing impact on the PHI electrical grid
• The need to quickly screen whether PV adoption will cause a violation
• The ability to assess the hosting capacity of radial distribution circuits or the secondary network
• The ability to model smart inverters along with other new types of DERs
• The need to understand gross load, net load and generation on each feeder
71

II Pepco Holdings. An Exelon Company
Advanced Modeling Software and Data Distribution Engineering Workstation Three-phase Unbalanced Circuit Model • Build circuit maps from GIS system and models are geospatial • Simulates the movement of Voltage Regulators, Capacitors, etc. • Automatically maps all DERs to the correct location in the model • Brings in hourly load – customer load and SCADA • Interfaces and brings in historical irradiance for the specific location
Time Series Analysis • Hourly interval is standard • Finds the critical points looking at all hours of year
Measurement data (time synchronized) • Start of circuit (SCADA) • Customer load data (from AMI or profiled consumption data) • Generation measurements
72

II Pepco Holdings. An Exelon Company
DEW’s Advanced Modeling Tools to Complete High-Pen PV Integration Studies
Generation Time Series Analysis • Determines the most critical time points for analysis by analyzing all intervals
Minimum Daytime Load (MDL) Max Load Point Low Load Point Max PV Point Max PV/Load Ratio Max Difference Point
• Movement of utility control equipment
Generation Impact Analysis (Hourly data for critical days) • Detail Studies covering the periods of worst case circuit conditions • Analyze the loss and return of generation with and without regulation • Analyze PV power factor settings if needed
Generation Fault Analysis • Screening & fault studies
73
Generator , Database
Sky/lrradia nee Web Based Database
Monthly Query
I DEW Monthly
Update
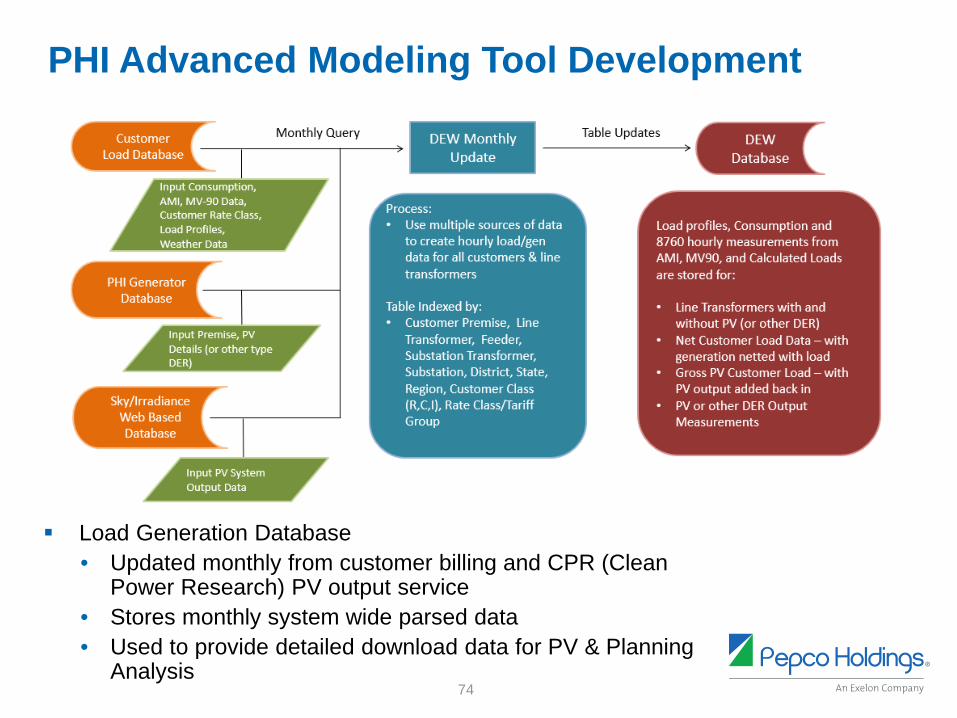
Process: • Use multiple sources of data
to create hourly load/gen data for all customers & line transformers
Table Indexed by: Customer Premise, Line Transformer, Feeder, Substation Transformer, Substation, District, State, Region, Customer Class (R,C,I), Rate Class/Tariff Group
Table Updates -- ,,i
, DEW / I
Database . "!,
y ···
Load profiles, Consumption and 8760 hourly measurements from AMI, MV90, and Calculated Loads are stored for:
Line Transformers with and without PV (or other DER) Net Customer Load Data - with generation netted with load Gross PV Customer Load - with PV output added back in PV or other DER Output Measurements
II Pepco Holdings. An Exelon Company
PHI Advanced Modeling Tool Development
Load Generation Database • Updated monthly from customer billing and CPR (Clean Power Research) PV output service
• Stores monthly system wide parsed data • Used to provide detailed download data for PV & PlanningAnalysis
74

1----------------------------------~ I S1'Tiulat1or Data Inputs I
I ----~-------------~ . I PV Array Obstru ction/Shading PV System 1 Location I Geometry Information Spec. I
L-------~-- -- -~ ~~~~-~- ~---- -- ---- --- -- ---~-~-- -- ----~J
1 I ----------------- ----------------~
Simulation Data Outputs I I ~----------------------------------
II Pepco Holdings. An Exelon Company
Clean Power Research Data
CPR provides irradiance based generation modelling for PV systems
System output is applied to DEWcomponent and used in Power Flowcalculations
Minimum input requirements:
• Array Size, • Inverter Make/Model or Efficiency • Module Make/Model or Efficiency • Tracking Type (Fixed or Axis-Based) • Tilt Angle • Azimuth Angle • Azimuthal Obstructions
75
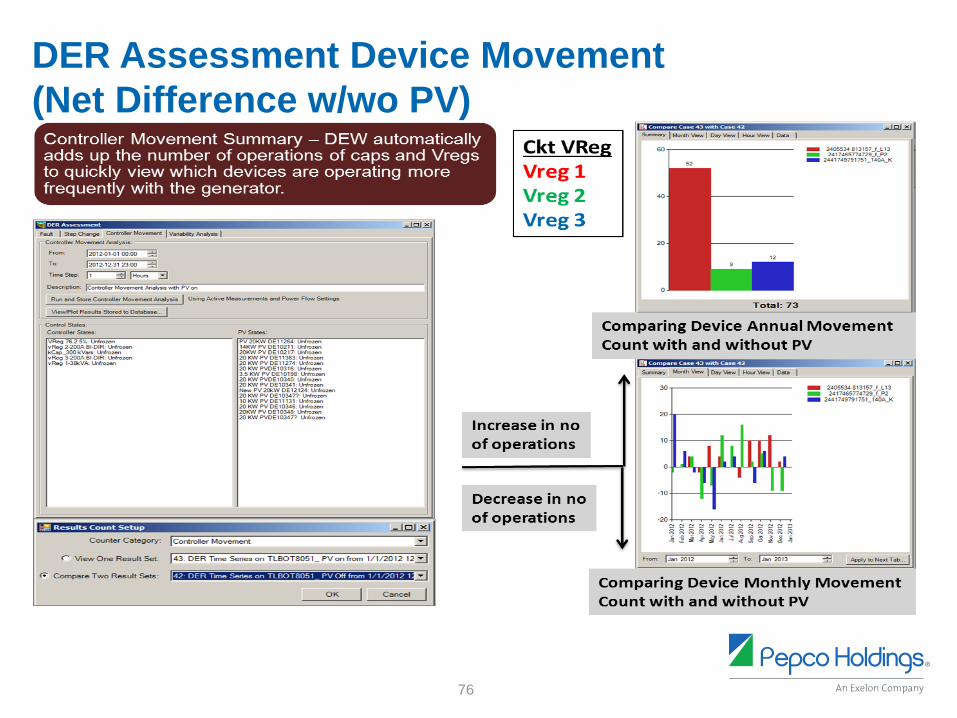
Controller Movement Summary - DEW automatically adds up the number of operations of caps and Vregs to quickly view which devices are operating more frequently with the generator.
From 12012-01-01 0000 ::::3 To: 12012 12-31 2300 ...a.J
T,_ 5-c ~ ~
Oese.-1ptaon ~ Movement ~ Yrith PVon
[
Cont,oll~ Movomont Anoly.,•
Rur, oriel Stofo Controlle, Movement Anoly.s,s I Ue1ng Acbve M&asurernenta •nd ~ FJorN Settings
Vi01NJPlot Rosults Storod 10 Database
Control Slates Controllet" Scates PV Scates . ~~~~,.~.2~S~¼c~· ~ .... ~~-,-------------- ~P'V=20KW==o~E~11~26a~. ~LW~~-,-------------vR.eg 2-200A 81-0IA. l.Wrozen 1,KW PV 0E1021 1. Unfrozen kCeQ_300kVars. l.Wroan 20KW PV 0Et0217. Unfrozen vR.eg 3-200A 81-0IA. Ur-lrozen 20 KW PV OE l 13$3; t.W,-oz,en vRog 1-38kVA t.WroMn 20KW PV0E t 1274; 1.WroHl"I
20 KW PVOE10316 Unfrozen 3 5 t<:W PV OE10198: Urlroten 20 KW PVOEt0,340- Unfrozen 20 KW PV OE 10341 ; l.n'rozen New PV 20<W OE12 124: lknozen 20 KW PV 0E l 034n: l.Wrozen 10KW PV 0El11 31 : l.Wl'O.ten 20KW PV OE 10346: Unfroz.en 20KW PV OE 10348: Unfrozen 20KW PVDE1034n: l.Wrozen
CktVReg Vreg1 Vreg2 Vreg3
~ ,~V\ew) o..,.v..wl Hourv..wl o. ..
60~------------
20
0
Tota l : 73
- 2405"'4 81:l157_I_ Ll3 - 2A1 7.c65n • 729_f_P2 - 2"1749791 7 51_ 1"'°"-J(
Comparing Device Annual Movement Count with and without PV
....._,, --l0ev""'"l"""""'"l""• I 30~----------- - 2405534 813157_f_L 13
- 2-41 746Sn -4729_f_P2 - 2441 7-49791751_140A_K
Increase in no of operations
_J ~ R esults Count Set-up
CCM.Jnter Categc:xy: )Controller- Movement
< View One Result Set: 143: DER Tome Series on TLBOT805 1_ PVon from 1/ 1/20 12123
r. Compare T"""'° Resul t Sets : IE,t-M•J:l;tnftd4%,i4J·l,+il=t•iim1.1w=t1•:;1mmwNri"1t1t.a,3
OK Cancel
Decrease in no of operations
F rom IJan 2012 To: iJan 20 13 Appty1oNex1Tab.
Comparing Device Monthly Movement Count with and without PV
II Pepco Holdings. An Exelon Company
DER Assessment Device Movement (Net Difference w/wo PV)
76

Filo Edit Data Analysis Options Tools Viow Systom Holp
Ill
Integrated System Model • PHI has over 2,000 distribution circuits, and all can map into the model from the GIS system.
• All the DERs map onto those circuits in the correct location from a DER database which now has over 26,000 systems.
77

Rewl _ ri
" ppli«:1
f-,------\ ;
Peril. ing ( ) \ I
I I
\ I \J
II Pepco Holdings. An Exelon Company
Transformer With Reverse Flow due to PV
78
II Pepco Holdings. An Exelon Company
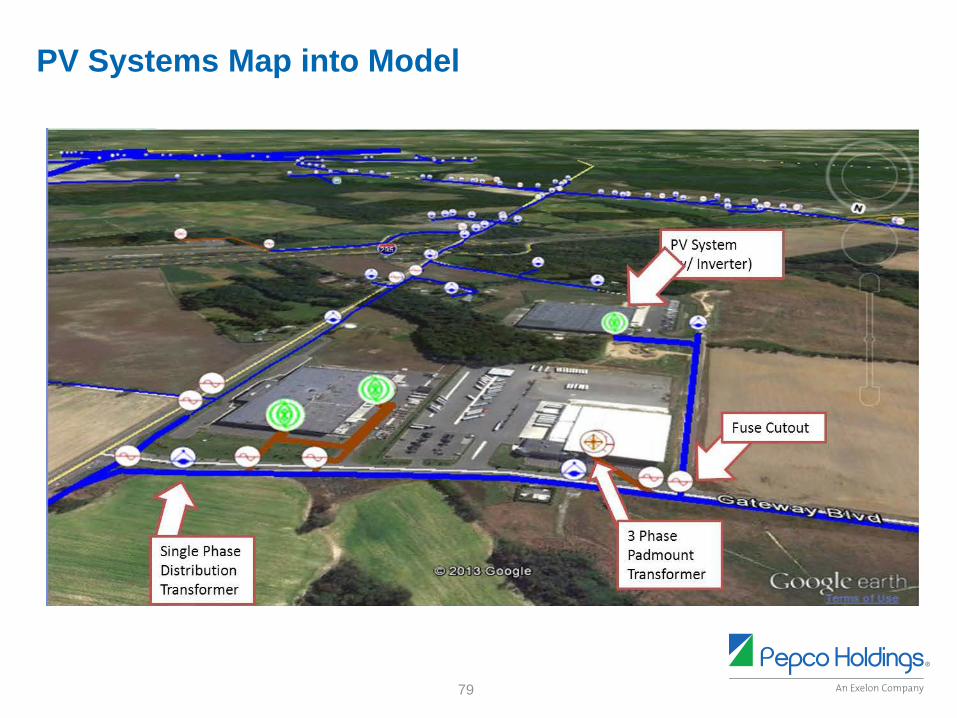
PV Systems Map into Model
79
II Pepco Holdings. An Exelon Company
DER Semi-Automated Impact Assessment
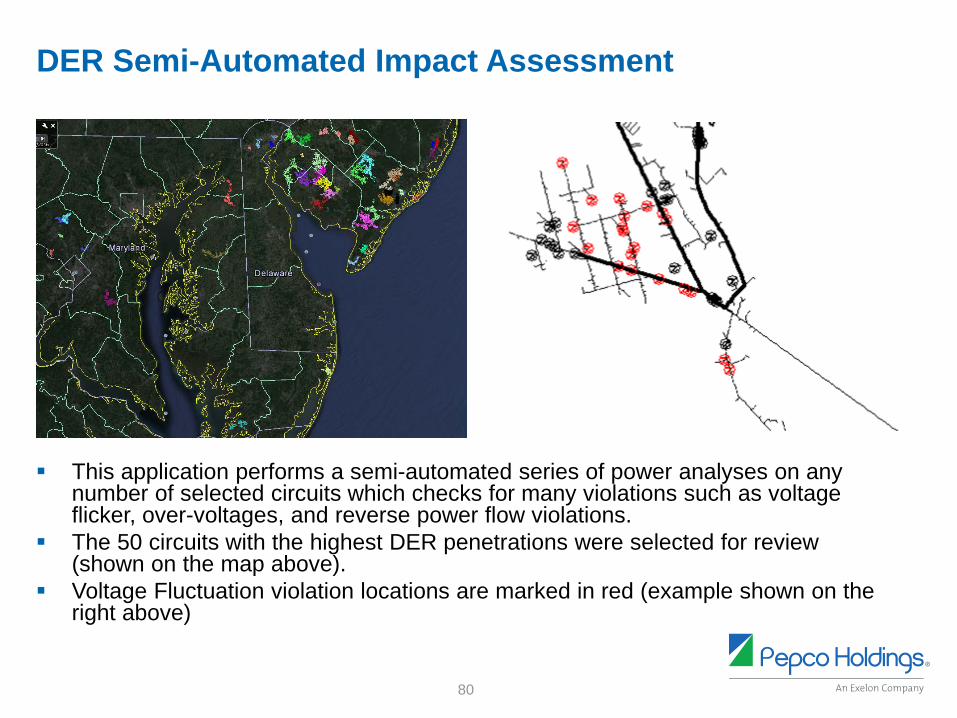
This application performs a semi-automated series of power analyses on anynumber of selected circuits which checks for many violations such as voltage flicker, over-voltages, and reverse power flow violations.
The 50 circuits with the highest DER penetrations were selected for review (shown on the map above).
Voltage Fluctuation violation locations are marked in red (example shown on the right above)
80
~"'
" ~ ~
' ~ ...... ~
II Pepco Holdings. An Exelon Company
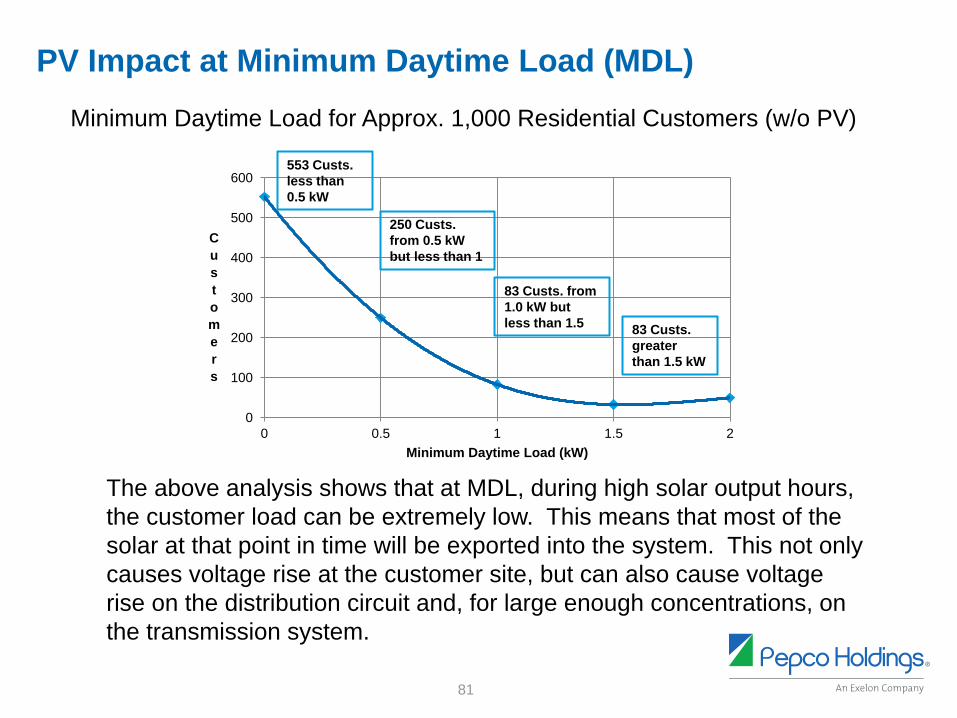
PV Impact at Minimum Daytime Load (MDL) Minimum Daytime Load for Approx. 1,000 Residential Customers (w/o PV)
600
500 C u 400 s t 300 o m
200 e r s 100
0 0 0.5 1 1.5 2
553 Custs. less than 0.5 kW
250 Custs. from 0.5 kW but less than 1
83 Custs. greater than 1.5 kW
83 Custs. from 1.0 kW but less than 1.5
Minimum Daytime Load (kW)
The above analysis shows that at MDL, during high solar output hours, the customer load can be extremely low. This means that most of the solar at that point in time will be exported into the system. This not only causes voltage rise at the customer site, but can also cause voltage rise on the distribution circuit and, for large enough concentrations, on the transmission system.
81
201S Ne1. PV Generation. and Gross l oads - i.t,10tU11 »11-0III -M'U"'°'1-
..... ) .. .., {l,W'
9/3/2015 Net, PV Generation, and Gross Loads - »IU'"'lif" - »1\11(1 -Xll~Ql,)';1,
tr,,,~ ...... , ... ,.,
ZOl.5 Net, PV Generation, and Gross Loads
- :tOl~S..-fof"I - .1111\lof"f -KIi\<".-:,,,.,. ~ l•'W'I ,.....,
, l/29/2015 Net, PV Generation, and Gross Load.s - .1111.)J«l -m1!lc,,ou ,., """
--;=:::=: ~==-------
6 0
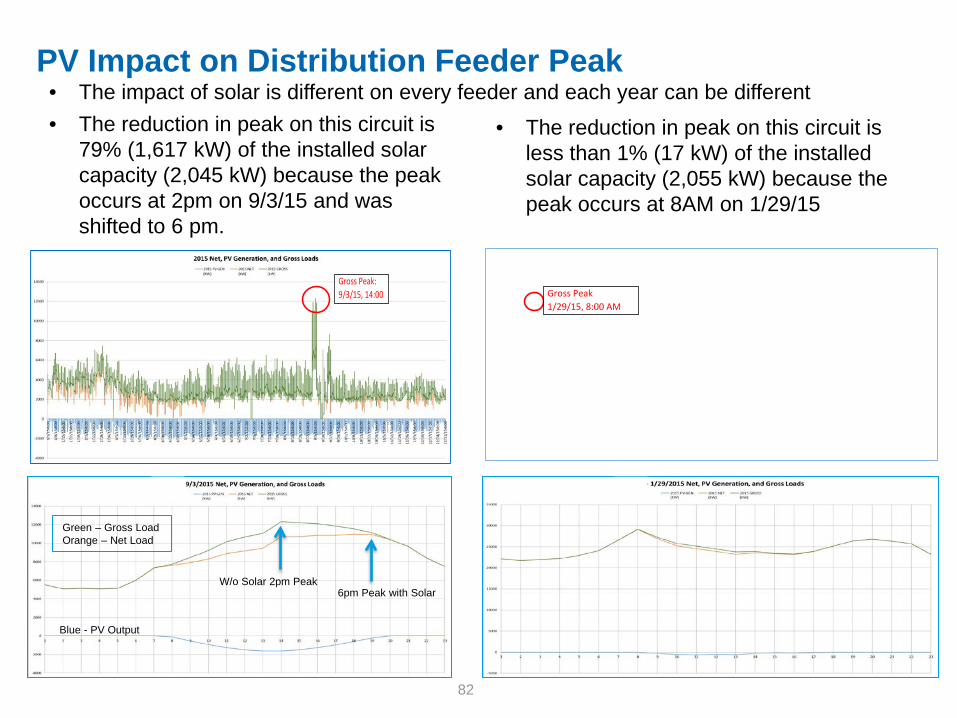
PV Impact on Distribution Feeder Peak • The impact of solar is different on every feeder and each year can be different • The reduction in peak on this circuit is • The reduction in peak on this circuit is 79% (1,617 kW) of the installed solar less than 1% (17 kW) of the installed capacity (2,045 kW) because the peak solar capacity (2,055 kW) because the occurs at 2pm on 9/3/15 and was peak occurs at 8AM on 1/29/15 shifted to 6 pm.
Gross Peak 1/29/15, 8:00 AM
Gross Peak: 9/3/15, 14:00
Blue - PV Output
W/o Solar 2pm Peak 6pm Peak with Solar
Green – Gross Load Orange – Net Load
82

Network Hosting Capacity The Hosting capacity tool in DEW is designed to quantify how much DER generation can be reliably added to the Pepco secondary network without violating established criteria, which is preventing reverse power through the network transformer.
The results will help provide the approximate amount of solar PV that can be installed on a grid or spot network.
In general, primary circuits dedicated to feeding secondary network groups will not experience violations if the hosting capacity on the secondary network is adhered to.
These results only verify there will be no reverse flow from the customer through the network protector. That will be the only violation being analyzed in this secondary network hosting capacity study.
83
l Secondary PV Hosting Summary
286,2
107.8 109A
3 7784117l1528 + 12 othln 169.9 674.6
4 775410968593 + 2 otl'lefs 472.0 342.5
5 775409687896 + 1 othen 212.8 152.5
6 775410780050 • 1 othen 336.9 273.5
7 262.5 220.9
8 775410714250 + 2 othen 719J 587.5
9 345.0 288.2
10 775410762097 + 1 othen 156.4 129.0
II Pepco Holdings. An Exelon Company
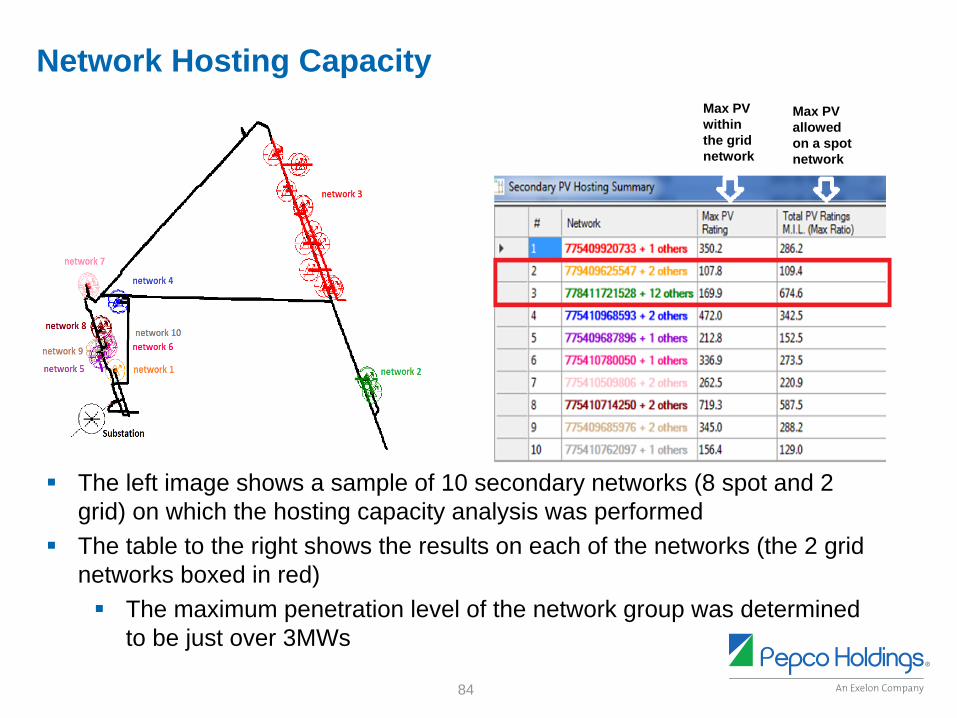
Network Hosting Capacity Max PV Max PV within allowed the grid on a spot network network
The left image shows a sample of 10 secondary networks (8 spot and 2 grid) on which the hosting capacity analysis was performed
The table to the right shows the results on each of the networks (the 2 grid networks boxed in red) The maximum penetration level of the network group was determined to be just over 3MWs
84

February 1, 2016
II Pepco Holdings. An Exelon Company
Advanced Studies and Demonstrations
85
II Pepco Holdings. An Exelon Company
Advanced Studies and Demonstrations
• Department of Energy “SUNRISE” Grant – PHI just completed thisstudy with other collaborators, investigating cost effective ways to increase hosting capacity, and developed a tool that analyzessecondary voltage rise.
• Advanced Distribution Control and Communications – PHI is collaborating with Chesapeake College, Solar City, A F Mensah and others to do a demonstration project that will control smart inverters,battery storage, flexible load, along with substation and feederequipment in an integrated system. This along with development oflow cost, secure communications will prepare PHI to maintain a robust, reliable Grid of the future.
• Monitoring and Control of Smart Inverters via the AMI or alternatecommunication system for the LVAC – PHI is collaborating with theUniversity of Hawaii and others to develop this functionality which willallow for more DER to be deployed. Additional testing anddemonstration of PV and other new technology is taking place at the Water Shed facility in Rockville, MD.
86

February 1, 2016
II Pepco Holdings. An Exelon Company
QUESTIONS
87