DISTRIBUTED BY: National Technical U. S. … OF IRON IN CREVICES INTRODUCTION Localized corrosion is...
39
AD-786 348 CORROSION OF IRON IN CREVICES E. McCafferty Naval Re'scarch Laboratory Prepared for: Office of Naval Research 15 August 1)74 DISTRIBUTED BY: National Technical Information Service U. S. DEPARTMENT OF COMMERCE 5285 Port Royal Road, Springfield Va. 22151
-
Upload
nguyenlien -
Category
Documents
-
view
213 -
download
0
Transcript of DISTRIBUTED BY: National Technical U. S. … OF IRON IN CREVICES INTRODUCTION Localized corrosion is...
AD-786 348
CORROSION OF IRON IN CREVICES
E. McCafferty
Naval Re'scarch Laboratory
Prepared for:
Office of Naval Research
15 August 1)74
DISTRIBUTED BY:
National Technical Information ServiceU. S. DEPARTMENT OF COMMERCE5285 Port Royal Road, Springfield Va. 22151

SECURI fY CLASSIFICATIONI .j,: Tm.S PAGE (Whon D.to Entrordi
REPOT DCUMNTATON AGEREAD INSTRUCTIONSREPOT DCUIANTAION AGEBEFORE COMPLETING FORM
IREPORT NUMBER 2.GOVT ACCESSION NO. 3. RECIPIENT'$ CATALOG NUMBER
NRL Report 7781 AD -7 94 317-4 TITLE (e d S.httl.( S' TYPE OF REPORT & PERIOD COVERED
Final report on one phase of theCORROSION OF IRON IN CREVICES NRI Problem.
6. PERFORMING OR41. REPORT NUMDER
7. AUTHORfs) S. CONTRACT OR GRANT NUMBER(&)
E. McCafferty
9 PERFORMING ORGANIZATION NAME AND ADDRESS 10. PROGRAM ELEMENT. PROJECT, TASK
^ 01EA & WORK UNIT NUMBERSNaval Research Laboratory NRL Problem M04-09;Washington, D.C. 20C7.Z Task RR 022-08-44-5513
11 CONTROLLING OFFICE NAME AND ADDRESS 12. REPORT DATE
Department of the Navy August 15, 1974Office of Naval Research 13. NUMBER OF PAGES
Aiiigtofl, Va. 22217 3?IA4 MONITORING AGENCY NAME & ADDRESSWI difl.,.,,r fvt'o Co~Ittmling Office) IS. SECURITY7CLASS. (of this ftiof)
Unclassified
1S.. DECLASSIFICATION. DOWNGRIADINGSCHEDULE
1 6 DISTRIBUTION STATEMENT
(of this Report)
Approved for public release; distribution unlimited.
17- DISTRIBUTION STATEMENT (of the oattect .flteedin Block 20. It differenfrIom Repoif)
1S. SUPPLEMENTARY NOTES
1S. KEY WORDS fContinu* on revers. aide 1f .,ceseary .,fdontily by block notbet)
Crevice corrosion Oxygen reductionIron Chloride ionElectrode behavior Chromate ionPolarization
20. ABSTRPACT (Conmtin.. - ieveroee side If necamewy and Idoetlfy by block eaobog)
The crevice corrosion of iron has been studied in quiescent sodium chloride solutions withand without chromate inhibitor. Polarization curves have beer, obtained using a special devicewhich features an adjustable crevice width and provides for measurement of electrode potentialwithin the crevice. L f~(.
..... (Continues)rh*VA
Do N, 1473 EDITION OF I NOV691 IS OBSOLIETS
S/N 102014-601SECURITY CLASSIFICATION OF T041 PAGE (wna 0e6. bre

- ITY CL AShIFICA tION OF THIS PAGE(Whon Daa &n f**re
20. Abstract
In crevices where the internal iron was not short-circuit d to external metal, the corrosionrate was determined by the limiting cathodic current for oxygen reduction. This limitingc, rrent, and accordingly the corrosion rate, was independ nt of pH and chloride ion concentra-tion but was suppressed to a constant value when the height of the crevice was less than thethickness of the oxygen diffusion layer. When iron in the crevice was short-circuited to external,open platinum and chromate inhibitor was not used, the initial crevice corrosion rate wasindependent of crevice height but increased with increasing concentration of chloride ion andarea of external electrode. At constant concentration of chloride ion, the crevice corrosionrate of internal iron short-circuited to open external iron decreased with increasing concentrationof chromate ion. When a constant chromate-ion concentration was used which did not giveprotection, at short times the crevice corrosion rate was greater the greater the chloride ionconcentration, but at longer times the rates were essentially independent of bulk chloride-ionconcentration.
Surfaces which pitted when open did not necessarily corrode under crevices. When crevicecorrosion did occur, the electrode potential within the crevice was not related to the criticalpitting potential for the open sample.
iiS6C(UI'Y CLASSIIlCATION OF THIS PAGE(Ir~al D.I Enet.e)

CONTENTS
INTRODUCTION............................................1
BACKGROUND ............................................. 1
EXPERIMENTAL MATERIALS AND PROCEDURE................2
C)Electrode .............................................Crevice Assembly ........................................ 3Reference Electrodes.....................................3Solutions .......................................... .... 5Procedures.............................................6
RESULTS AND DISCUSSION FOR INHIBITOR-FREESOLUTIONS..............................................7
Polarization of Isolated Crevices ............................. 7Effect of Crevice Height .................................. 10Coupled Crevices ........................................ 11Direct Short-Circuiting of Crevice and Open Metal ............. 16Crevice pH............................................ 17
RESULTS AND DISCUSSION FOR SOLUTIONS CONTAININGCH-ROMATE INHIBITOR.................................. 20
Effect of Coupling...................................... 20Crevice Corrosion Rates .................................. 20Potential Difference Between inner and Outer Surfaces .......... 25Potential Difference and Corrosion Rate.....................28Distribution of Crevice Attack ............................. 29Comparison of Crevice Corrosion and Pitting .................. 30
SUMMARY ................................................ 33
ACKNOWLEDGMENT.......................................34
REFERENCES ............................................. 34

CORROSION OF IRON IN CREVICES
INTRODUCTION
Localized corrosion is a serious problem because the attack is highly intensified atcertain areas on the metal surface, with other areas remaining unaffected. Examplesinclude stress-corrosion cracking, pitting corrosion, and ,.evice corrosion. Crevice corrosioncan occur between two overlapping metal sheets, within the strands of wire rope, in screwthreads, or even under barnacles in a ship's hull.
In all such cases of localized attack, a special restrictive geometry forms an active"occluded corrosion cell" [11 by limiting the exchange of the bulk and local electrolytes.In the case of pitting corrosion a porous cap of corrosion products acts as the barrier;within stress-corrosion cracks and crevices the lc:.g narrow diffusion pabh limits the accessto bulk electrolyte. The localized attack is electrochemical, but the restrictive geometrymakes access to and study of the internal corroding areas difficult. Adding to the difficultycaused by this restrictive geometry is that the chemical composition of the local corrodentchanges as the corrosion reaction proceeds.
The purpose of this study was to investigate the fundamental aspects of crevicecorrosion in a well-defined system. Iron was chosen, partly because of the attentiongiven this metal in a wide variety of open systems and partly to simplify compositionchanges in the electrolyte within the crevice. Emphasis was placed on the electrode kineticbehavior of iron confined under a flat crevice. The effect of variable crevice height, chlorideion concentration, and chromate inhibitor was considered. Some aspects of this study havebeen reported elsewhere 12].
BACKGROUND
Rosenfeld and Marshakov [3,41 have shown that crevice corrosion usually proceedsin two main stages as depicted in Fig. 1: initiation by differential aeration and propaga-tion by crevice acidification. Initially the metal within the crevice is in contact with arestricted oxygen supply compared to external metal and becomes anodic relative to theexternal metal to which it is coupled* [5]. At longer times corrosion products accumulatewithin the crevice so as to change the local solution composition and pH.
Reports that not only crevices [3,4,61 but also stress-corrosion cracks [7,81 and pits[9-11] acidify locally have led to the view that all three forms of localized corrosionshare the unifying feature of being "occluded corrosion cells" [11 having restricted exchange
Note: Manuscript submitted June 6, 1974*This follows from application of the Nernst equation, namely, E f 8 - (RT/nF n([products]/[reactants]),to the oxygen reduction reaction: 02 + 2H 20 + 4e- -+ 40H-. The electrode in contact with the smalleroxygen concentration will have the less positive electrode potential (anode upon coupling).
!1

E. McCAFFERTY
1. INITIATION 2. CONTINUATION
----- Dfferential aeration cell .... -1 Changes in local solution chemistry
air air air
- 2 Ci- .C. .
* ~ OW L Rust!~.
low in 02 e- FeF/ Fe Fe + H2 0 - - FeOH* + H
[02+ 2H 2 0+ 4e---40H or Fe+ ++2H 20 -Fe(OH) 2 - 2W
Fig. 1 - Progression of crevice corrosion
with bulk Plectrolyte and thus have common solution chemistries. Hence most recentstudies have used the thermodynamic rather than kinetic approach, with emphasis onfactors such as resuitant crevice solution chemistry, pH, and electrode potential [12-151.Little recent work has been done on the electrode kinetic behavior of metals under crevices.One exception has been the correlation between the shape of cyclic anodic polarizationcurves for various engineering alloys in 3-1/2% NaCl with their longer range performancesin natural seawater 116). Polarization curves have been reported in some well-definedbut synthetic, generalized "occluded corrosion cells" sans crevices, in which the "internal"metal was activated by anodic polarization 1171 or by deaeration [18]. Other investigatorshave reported current-vs-time (191 and potential-vs-time [14,20], but not current-vs-potentialrelationships.
The purpose in this study therefore was to take up the systematic method of Rosenfeldand Marshakov 13] in order to investigate in an organized manner the 'inetic aspects of amodel crevice.
EXPERIMENTAL MATERIALS AND PROCEDURF
Electrode
Ferrovac E high-purity iron (Tabl 1) was used in this study. An iron electrode(3.18 cm in diameter) was encased in a Teflon holder by pressing the cylindrical iron barthrough an undersized opening in the Teflon. The uppermost rim of Teflon was machinedaway, and the electrode edge was masked with alkyd varnish, a material found suitablein preventing the formation of unintentional, microscopic crevices [211. Before use, theexposed iron face (7.9 cm 2 projected area) was dry-polished through 3/0 emery papers,washed with ethanol, and dried in a stream of nitrogen.
2

NRL REPORT 7781
Table 1Analysis of Ferrovac E
High-Purity Iron
Impurity I Content___purity (%)
C 0.007Mn 0.01P 0.002S 0.007Si 0.006Ni 0.025Cr 0.007V <0.01W 0.02Mo <0.01Cn <0.001Co G.01
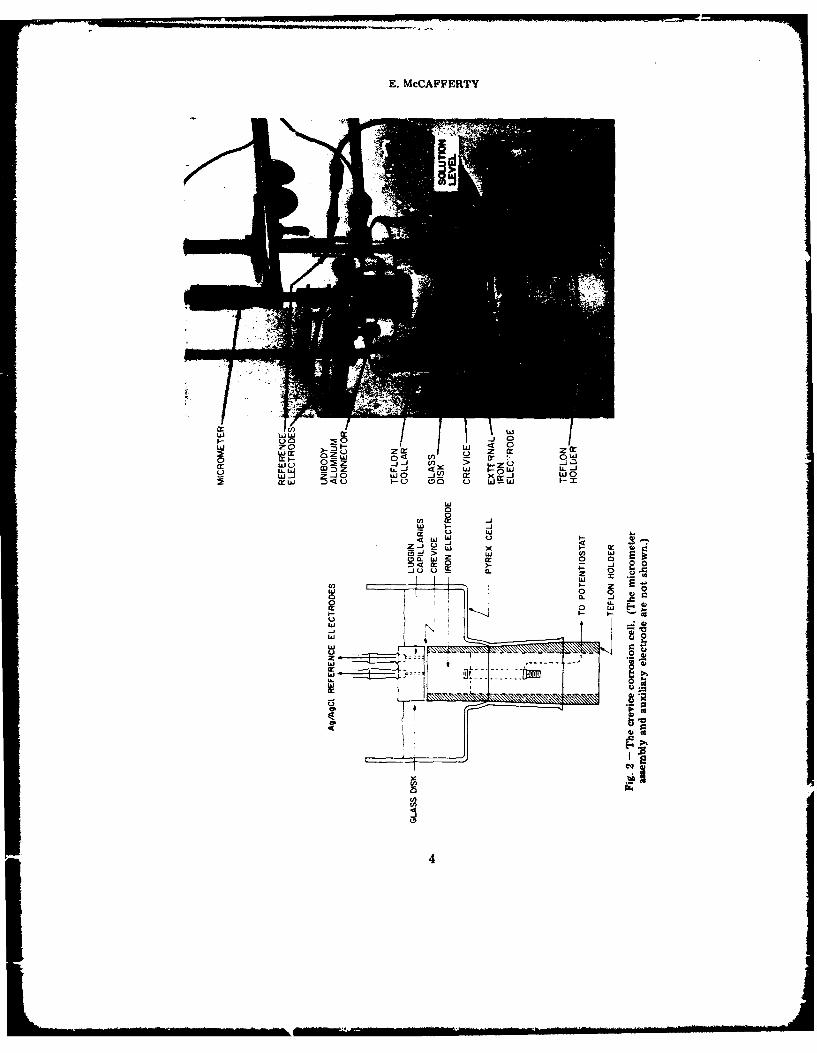
Crevice Assembly
The eletrode holder was machined to fit into the cell as shown in Fig. 2. Theassembled device is shown in Fig. 3. A central feature of the assembly is the adjustablecrevice height. The crevice was formed by positioning the optically polished bottomsurface of a glass disk a measured distance from the iron surface by means of a micrometerattached to the disk top. Two small holes (<1 mm in diameter) through the glass diskled to Ag/AgCI reference electrodes. These Luggin capillaries enabled measurement of theelectrode potential at two locations in the crevice: the center and near the edge. Thuselectrochemical processes within the crevice could be monitored.
Reference Electrodes
The Ag/AgCI electrodes were prepared by anodizirg Ag wire in 0.1N HCI for 30minutes at a current density of 0.4 mA/cm 2 [22]. The electrodes to be located at thetwo locations within the crevice were always checked against each other before use. Thesolution in the capillary section was the same as the bulk electrolyte and was kept fromdraining into the crevice by filter-paper plugs packed into the capillary bottom. Electrodepotentials were thus measured versus Ag/AgCl in the test solution but were converted topotentials versus a standard Ag/AgCI reference electrode housed in the usual mixture ofKCI (4M) and AgCI (saturated). These conversions were made using the data in Fig. 4,which shows that the potential of the chlorodized silver wire depended primarily on theCl- concentration. For example, with [CrO4 ] < 0.006N,*
*Normalities of CrO4= are given in terma of 2 equivalenta/mole.
3
i~~~
E. McCAFFERTY
uL 0~~w Z w0 ~ mzL I-C. J ~ fn > ... W j
Z) ~ ~ ~ U L) )- DO L -
C) W
W x
zz
w 0
w~C)
Oi -----
tbu

NRL REPORT 7781
200 CONC. OF CrO4=
o O.ONo 0.006 N0 0.06 N* 0.6N
E
U
1 100
50
0001 0.01 0.1 1NORMALITY OF Cl-
Fig. 4 Potential of chlorodized silver wire invarious CI-/Cr04 = solutions
a E =55 mVa log (C-]) [CrO4 =] (1)
compared to the theoretical value of 59 mV (based on activities rather than concentrations).For the more dilute Cl- concentrations, there was a slight dependence of measuredpotential on the Cr0 4 = concentration, but the appropriate corrections were made for eachsolution used.
Solutions
Sodium chloride solutions were used:
* with sodium chromate inhibitor (pH = 8.4), to study the crevice corrosion ofpassive iron,
5

E. McCAFFERTY
0 without inhibitor (pH = 5.5), to study active crevices.
The 3-1/2% NaCl solution (wt/vol) was of particular interest because the Cl- concentration(0.6N) is the same as in natural seawater. All solutions were prepared from reagent gradechemicals and double-distilled water prepared in a quartz still. During all experimentsthe cell electrolyte was open to the air and unstirred.
Procedures
For the Cr0 4 -/CI- solutions an iron ring (area - 50 cm2 ) cut from the same bar asthe crevice iron was used as the external open electrode. This split-electrode arrangementallowed measurement of current between active internal and passive external electrodes.After 15 minutes immersion in a given solution, the two parts were short-circuited througha Wenking potentiostat used in a two-electrode configuration [231 (Fig. 5). This arrange-ment essentially uses the potentiostat as a zero-resistance ammeter and short-circuits thetwo electrodes by setting a zero potential difference between them. Electrode potentialsof internal iron and crevice iron were measured on the same digital electrometer (Keithley615). The CrO4 and Cr- concentrations were varied, but the crevice height was fixedat 10 mils (0.25 mm) for this set of experiments.
1!ELECTROEER
Hr Low W C R
SWffCH.BOX
S (CfWuw V~omryrot sMow)
Fig. 5 - Schematic diagram of theexperimental set up
6

NRL REPORT 7781
Two types of crevices were investigated for the chromate-free solutions:
0 icolated crevices, in which internal iron was not connected to external metal, and
* coupled crevices, in which internal iron was short-circuited to external metal.
The former configuration allowed study uf local cell activity within a crevice, and thelatter simulated the more practical case hi an overlapping joint, for example, where metalwithin the creviLe is in electrical contact with metal outside the crevice.
The effect of crevice width, pH, and CI- concentration was studied for the isolatedcrevice. The narrower isolated crevices were polarized galvanostatically using a number o'variable resistors in series with a 45-V battery (Rext > Rcel ). (Use of the potentiostatin the normal three-electrode configuration yielded oscillations in current for the narrowercrevices, but there were no problems with thicker crevices or with the two-electrodeconfiguration for coupled crevices.)
For coupled crevices in the chromate-free solutions, a platinum gauze electrode wasused as the open, external electrode in order to confine corrosion to the internal iron.Crevice iron and external platinum were immersed (uncoupled) for 24 hours to reachqtewiy-state potentials prior to ceupling througl; the potentiostat a dhe two-electrodeconfiguration. Evans polarization diagrams were determined for different crevice heightsCl- concentrations, and external areas.
RESULTS AND DISCUSSION FOR INHIBITOR-FREE SOLUTIONS
Polarization of Isolated Crevices
Polarization curves were determined after 24 hours immersion in 0.6N and 0.06NNaCl solutions. Steady-state open-circuit potentials were established in about 10 hours(Fig. 6). In all cases open-circuit potentials measured at the crevice center were identicalwith potentials measured near the crevice edge.
Figure 7 shows typical polarization curves in 0.6N NaCI for both the open sampleand for isolated crevices (crevice metal not coupled to open external metal). In all casesthe cathodic branch was determined first, open circuit was reestablished, and the anodicbranch was then determined. For cathodic polarization, electrode potentials measured viathe Luggin capillary at the crevice center were the same as those near the edge. For anodicpolarization, in a few cases there were slight differences between the two locations (5 tc20 mV), but only at high anodic overvoltages.
The shape of the cathodic curves in Fig. 7 is characteristic of a diffusion -controlledprocess. The overall cathodic reaction in nearly neutral solutions is the reduction ofoxygen [241:
02 + 2H 2 0 + 4e- 4OH-. (2)
7

E. McCAFFERTY
-550c,] .O.N
575
-600
DUPLICATEU)C6T5
-, -650 OEN RON
W
675-mi CREVICE 0-m CREVICE,,20-
-700 L- I
725 -F
TIME (HOURS)
Fig. 6 - Establishment of steady-state open-circuit potentials foropen iron and crevice iron in O.6N NaCI
The anodic branches are activation controlled, with Tafel slopes of 40 to 60 mV/decade.All anodic curves were well behaved, and none displayed the peculiar property observedby Rosenfeld and Marshakov [3,41, in which some anodic curves started out in thedirection of more negative potentials before turning back toward more positive potentials.
For both the crevices and the open sample the corrosion rate at open-circuit potentialis equal t)o thc limiting cathodic current for oxygen reduction, according to
ir.et = iFe + io2 = 0. (3)
With these isolated crevices the limiting cathodic current density for oxygen reduction isless than that for the open sample, and correspondingly so is the iron corrosion rate (Fig. 7).This same effect has been seen by Rosenfeld and Marshakov [3,41.
At more negative potentials than in . the predominant cathodic reaction 'shydrogen evolution [251,
4H 2 0 + 4e- - 40H- + 2H2 (gas), (4)
rather than oxygen reduction. With extensive cathodic polarization the shape of thepolarization curve changed from diffusion control to activation control and exhibited aTafel slope of 120 mV/decade, characteristic of hydiogei evolution [261. Figure 8 showsthe change in shape of the cathodic polarization curve w;.h extensive cathodic polariza ion(20-ril crevice; 0.06N NaCI). In the oxygen reduction region the polarization behavior
8

NRL REPOR r 7781
10
>*
E~
inF
* 1
o 2To
10i
4C
02 2: E-
(S383dV4V IN3..
1.AUM 113imn-

E. McCAFFERTY
was independent of pH and l- ion concentration, as reqired by Eq. (3); this is shownin Fig. 9 for a 10-mil crevice.
Effect of Crevice Height
The effect of the isolated crevice is thus to stifle the oxygen reduction reaction, evenfor a relatively wide opening of 125 mils (3.18 mm), as seen in Fig. 10 for 0.06N NaCI.The limiting cathodic rate is further suppressed to a constant value for crevice heights from5 to 20 mils (0.13 to 0.51 mm). The crevice height of 20 mils (0.51 mm) is significantin that it is approximately the thickness 6 of the oxygen diffusion layer near the electrodesgrface calculated [271 from
iI.c = nF C, (5)
where ii , is the mass-transfer limited cathodic current density for the open sample (0.20mA/7.9 'cm2 ), n = 4 electrons transferred per mole 02 according to Eq. (2), and D and Care the diffusion coefficient and concentration respectively of oxygen. With D = 1.65 X10 - 5 cm 2 /s 128] for 3.05N NaCI at 25*C and C = 8.2 mg/1 [29], Eq. (5) gives 6 = 0.063cm or 25 mils. This value agrees with that of Rosenfeld and Vashkov [301, who calculatedthe thickness of the diffusion layer to be 0.50 mm (20 mils) for iron in 0.5N NaCI.Experiments by Rosenfeld and Marshakov [41 with variable crevices gave 8 = 0.25 to0.50 mm.
J0-3 [ l0-MIL CREVICES j
[Cl-] pH E m, (Ag/A9CI
o 0.06 N 3.7 -6710 0.06 5.5 -685
10-4 a 0.6 5.5 -672
I-,-
W
0 0 _,+ 100 0 -I00 -200
OVERVOLTAGE (MILLIVOLTS)
Fig. 9 - Effect of pH and C- Ion concentration on the polarize-tion of iron in 10-al (0.25-mm) iaolated crevices
10

NRL REPORT 7781
10-3
q 0PEN IRON
1210-4
u 5s 'O ")T- 20 n lIs
0 '0 5 milsa & I0mils0 20mils
'I
IO., . . . . . . . .,
Q -100 -200 -300
OVERVOLTAGE (MILLIVOLTS)
Fig. 10 - Effect of crevice height on the cathodic polar-ization of iron in 0.06N NaCI. (Duplicate runs are in-dicated by open and solid symbols.)
Thus in crevices not coupled to outside open metal, when the crevice height iscomparable to or less than the thickness of the oxygen diffusion layer, diffusion ofoxygen into the crevice is impeded and hence the corrosion rate is reduced, according toEq. (3).
All polarization curves reported were steady-state curves. Figure 11 shows potential-vs-time dependence for the galvanostatic cathodic polarization of a 20-mU crevice in 0.06NNaC1. For the lowest applied currents, only a few minutes were necessary to establish asteady potential, but several hours were necessary to reach a steady potential near thelimiting cathodic current for oxygen reduction.
Coupled Crevices
The effect of activating the crevice iron was studied by coupling it to external, openplatinum. This arrangement simulates practical cases, such as in an overlapping joint,where metal within the crevice is in electrical contact with passive metal outside the crevice.The iron in the crevice was connected to the external platinum gauze using the potentiostatin the two-electrode configuration [231 shown in Fig. 5. This arrangement forces thecathodic reaction (oxygen reduction) to continue outside the crevice at the platinumsurface after the oxygen within the crevice has been consumed. Thus the anodic reaction(iron dissolution) is confined to the crevice.
11

E. McCAFFERTY
-680O Open- Circuit Potential
-690i 1.9 x I0 -6 amperes
- : i - 2.5 x 0- 6
-700 5 0 15 20
MINUTES
-1-710
-T720
oJ-T30 i-5xI "
-740
,o 20 30 40 50 6007
-870MIUE
I~~ I I I1i I -5I
-80 2 3 4 5 6 7 8 9 10
HOURS
Fig. 11 - Establishment of equilibrium potentials durine the galvanostaticpolarization of iron in a 20-mil (0.51-mm) crevice in 0.06N NaCI
Evans polarization diagrams are shown in Fig. 12 for 0.06N NaCI. Initially the ironand platinum were uncoupled for 24 hours so that each electrode reached its own steadypotential. These open-circuit potentials for uncoupled iron and uncoupled platinum tendtoward the bottom of the diagram (toward zero current flow). A fixed potential differencewas set between the inner iron and outer platinum. Within 5 to 20 minutes there resulteda constant current and steady electrode potentials for the crevice iron and open platinum.Those are the points plotted in Fig. 12. With increased current flow between the ironcrevice and open platinum, the two electrode potentials approached each other. At thepoint of direct-coupling (zero set potential difference) there was an IR drop between thecrevice center and the open outer electrode. However this IR drop at the point of directcoupling occurs on the flat portion of the oxygen-reduction curve for platinum. Thusthe corrosion current for the short-circuited couple is essentially given by the intersectionof the anodic and cathodic polarization curves.
In all cases, the short-circuited corrosion current became steady after 5 to 20 min.Longer range behavior was not followed in this set of experiments.
Table 2 lists the value of the IR drops for the various experiments. With 0.6N NaClthe IR drop was about 50 mV. For 0.06N NaCI the IR drop increased from 20 mV forthe open sample to nearly 200 mV for the thinnest crevice studied (3 mils).
12

NRL REPORT 7781
10-2
DIRECT COUPLING o(ZERO SET POTENTIAL DIFFERENCE),
,' .,,.7'
LU'a
S" i/ "- 5il CREVICE10- 4 -,
OPEN..,
U/ ./// CREVICES
D a 3 milso 10mils <-'*OPEN
1O-5 // ": .
T Ccihodic Curve
Fg12- Evn oaiaindiagrams for iron coupled to platinum in 0.06N NaCI. (Duplicate
Figure 12 shows that the short-circuit corrosion current for the crevices is increasedslihtl copard t th vaue or heopen sample (1.8 mA vs 1.5 mA respectively). Thus
crevice once the iron has been activated by coupling to an external cathode. Howeverthe attack s concentrated near the crevice edge.
As was found for the isolated crevices, the electrode potentials of iron at the crevicecenter and near the crevice edge were either identical or displayed only small differences(5 to 15 mV).
Figure 12 also compares the crevice corrosion current for the isolated (uncoupled)crevices to that for the iron/platinum couples. In the former case the crevice corrosioncurrent is only 1 X 10⁻⁵ amps (Fig. 9) and is determined by the rate of oxygen reductionwithin the crevice. As seen in Fig. 12, the corrosion rate of the coupled crevices is alsounder cathodic control. Here however the corrosion rate is determined by the rate ofoxygen reduction at the open electrode outside the crevice.
13

E. McCAFFERTY
Table 2IR Drop Between the Crevice Center and External
Platinum (Gauze) Electrode When Coupled
Height E vs Ag/AgCIof the Run (mV) IR
Crevice N DropOpening Crevice Open (mV)(mils) _ Fe Pt
0.06N NaCI
3 30 -593 -398 19510 27 -608 -510 98
29 --617 -460 15700 28 -611 -- 590 21
0.6N NaCI
10 41 --579 -537 4242 -581 -528 5345 -588 --539 49
20 44 -592 --541 51
Figure 13 shows the effect of the bulk CI- concentration and of external cathodearea on the polarization behavior of the couple iron (crevice)/pla'inum (open). The resultsof the various experiments are summarized in Tables 3a and 3b.
Figure 13 and Table 3a show that for a given crevice height and chloride content anincrease in area of the external cathode causes an increase in crevice corrosion current.The ratio of open to sheltered metal has been shown to be important in longer range,more practical immersion tests. For example, Ellis and LaQue [311 have reported a linearincrease in weight loss with increasing external area for stainless steel in flowing seawater.
Table 3a also shows that increasing the bulk concentration of chloride ion increasesthe corrosion current for a given external area and crevice height. However a change increvice height for a given external area and chloride content (either 0.06N or 0.6N) hasno effect on the crevice corrosion rate. The explanation may be that the concentrationof chloride ions entering the crevice is not sLrongly dependent on the crevice height. Workby Ulanovskii and Korovin [32,331 has shown that the increase in C- concentrationduring the anodic polarization of graphite is about the same for 0.2-mm (8-mil) as for0.6-mm (24-mil) crevices.
Table 3a also shows that the measured crevice corrosion current was not affected byvariations in the experimental procedure. With 0.6N NaC1 the short-circuit current was
14

NRL REPORT 7781
10-2:
Pt gauze, 0.6 N cr-
.~Pt gauze
0-4 .*00 l
410-5
/-Pt wire, 0 6 NCi
300 200 100 0 -100 -200 -300 -400 -500 -600 -700 -800 -900 -1000E vs Ag /Ag C I (mV)
of hecouleiron (1-mil crevice)Iplatinum (open). (Duplicate runs are indicatebyonadsli
External Cathode Short-Circuit Current (mA)
Conc Ara.Con. Tp Arexa 3-nil 10-mil j 0mil Open
____ ____ (cm2 ) Crevice Crevice Crvice Iron
0.06N Wires 3 - 0.20 -0.17
Gauze 175 2.1 1.8,2.1 -1.5
0.6N Gauze 175 - 2.9,2.8,2.5* 3.2t, 3.0 -
*Ilorizonta11y positioned platinum cathode.t~alvanostatic run.

E. McCAFFERTY
Table 3bEffect of Various Parameters on the
Short-Circuit Current isc
Parameter Increased Effect on
Crevice height None
C1- concentration Increase
Area of external electrode Increase
the same for galvanostatic polarization as for potentiostatic polarization. Also it made nodifference if the platinum external electrode were positioned horizontally or \'ertically(same area in each case).
Direct Short-Circuiting of Crevice andOpen Metal
In additional experiments crevice iron and open platinum were short-circuited directlywith a copper wire instead of using the potentiostat in the usual two-electrode mode (asa zero-resistance ammeter). Figure 14 shows the electrode potential behavior of iron ina 10-mil crevice when short-circuited directly to open platinum in 0.06N NaCI. After3 hours of coupling the electrode potentials of the two components were constant. Valueswere: E(crevice Fe) = -621 mV vs Ag/AgC1, and E(open Pt) = -520 mV. These valuescompare well with those obtained for the potentiostatic experiment for the same system:-617 and -460 mV respectively. Data for various experiments in which the two methodswere compared are listed in Table 4. Agreement is quite good: variation between thetwo methods is about the same as variations in the coupled potentials for repeat runs withthe polarization technique.
In a few experiments the crevice corrosion current for the direct short circuit wasmeasured using a simple zero-resistance ammeter 1341 shown schematically in Fig. 15.As shown in Table 4, results were in good agreement with the potentiostatic results.
Thus the potentiostatic method, in which inner and outer electrodes are eventuallyshort-circuited after a series of potential steps, gives the same results as immediate anddirect short-circuiting. The potentiostatic technique has the advantages of (a) givinginformation on the kinetic behavior of each member of the couple and (b) giving theshort-circuit current directly, without the need of balancing a galvanometer.
16

NRL REPORT 7781
II"
OPNPATNM(GAUZE)10100 -
-EDGE
3400-
TIME (MINUTES)
Fig. 14 -- Electrode potential behavior of crevice iron and open platinumbefore and after coupling (run 29; 10-mai crevice)
Crevice pH
The average pH within the crevice was measured after completion of each potentiostaticexperiment with 0.06N NaCI. Bulk electrolyte from the cell was slowly pipetted off belowthe crevice level, and the crevice was opened carefully. A thin slurry of electrolyte pluscorrosion products remained on the iron surface. The average pH of the crevice wasmeasured either by touching a micro-pH electrode to this thin layer or by using narrow-range pH papers. Results are given in Table 5. The average crevice pH for crevice ironin 0.06N NaCI was 4.7 -+ 0.3. The initial pH of the bulk solution was 5.5, but the finalpH was higher (6.5 to 8.5) due to production of hydroxyl ions at the outer electrode bythe reduction of oxygen:
02 + 2H2 0 + 4e- - 40H-. (2)
The crevice pH of 4.7 for iron in 0.06N NaCI is the same value as measured for ironcrevices in 0.6N NaCI by Bogar [13], who sampled crevice electrolytes with a micro-capillary and touched the extracted drops to narrow-range pH papers. Pourbaix 1101predicted the pH within an iron corrosion pit to be 4.8, assuming that at equilibrium thepit contents are a mixture of Fe, Fe3 0 4 , and Fe Cl2 •4H2 0 in the presence of anelectroneutral solution.
17
i~ ~ ~ ~ ~~~+0 ....... ... .. li
E. McCAFFERTY
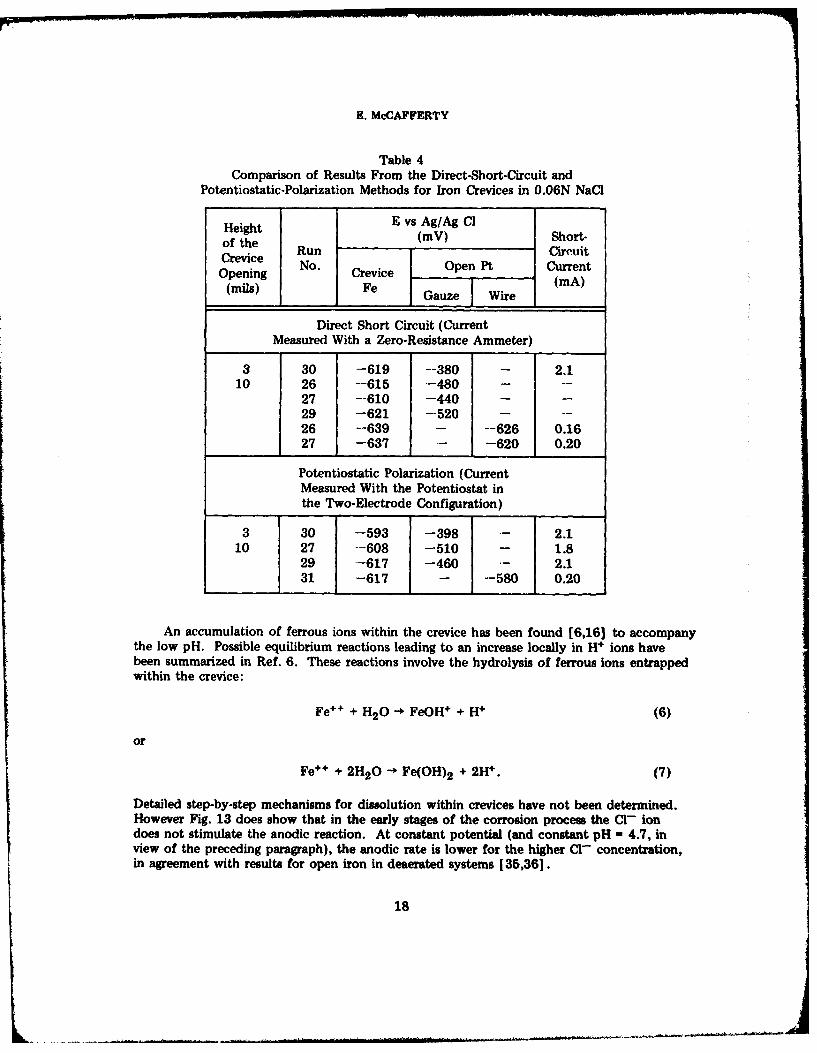
Table 4Comparison of Results From the Direct-Short-Circuit and
Potentiostatic-Polarization Methods for Iron Crevices in 0.06N NaCi
Height E vs Ag/Ag Clof the (mV) Short-
Crevice Run CircuitNo. Open Pt CurrentOpening Crevice (A
(mils) Fe Gauze Wire
Direct Short Circuit (CurrentMeasured With a Zero-Resistance Ammeter)
3 30 -619 --380 - 2.110 26 -615 -480 - --
27 --610 -440 - -
29 -621 -- 520 - --
26 --639 - --626 0.1627 -637 -620 0.20
Potentiostatic Polarization (CurrentMeasured With the Potentiostat inthe Two-Electrode Configuration)
3 30 -593 -398 - 2.110 27 --608 -510 - 1.8
29 -617 -460 2.131 -617 - -580 0.20
An accumulation of ferrous ions within the crevice has been found [6,16] to accompanythe low pH. Possible equilibrium reactions leading to an increase locally in H* ions havebeen summarized in Ref. 6. These reactions involve the hydrolysis of ferrous ions entrappedwithin the crevice:
Fe' + + H2 0 -+ FeOH + + H+ (6)
or
Fe+ + 2H 20 - Fe(OH) 2 + 2H+ . (7)
Detailed step-by-step mechanisms for dissolution within crevices have not been determined.However Fig. 13 does show that in the early stages of the corrosion process the C- iondoes not stimulate the anodic reaction. At constant potential (and constant pH - 4.7, inview of the preceding paragraph), the anodic rate is lower for the higher C- concentration,in agreement with results for open iron in deaerated systems [35,361.
18

NRL REPORT 7781
Fig. 15 Zero resistance ammreter (ZRA)
Table 5Measured pH Within Iron Crevices After
Polarization in 0.06N NaCI
Crevice Run Outer MeasuredHeight No. Electrode Crevice pH Technique(inils) _ _ _ _ _ _ _ _ _ _ _ _ _
3 30 Pt gauze 4.5 to 5.0 pH papers; microelectrode
10 27 Pt gauze 4.6 pH papers
29 Pt gauze 4.6 pH papers
31 Pt wire 4.5 Microelectrode4.7 pH papers
Range of Crevice pH 4.7 ± 0.3Initial pH of Bulk Solution 5.5Final pH of Bulk Solution 6.5 to 8.7
19

E. McCA FERTY
RESULTS AND DISCUSSION FOR SOLUTIONSCONTAINING CHROMATE INHIBITOR
Sodium chromate was added to the chloride solutions to study the crevice corrosionof iron initially pasbive. In these experiments the outer electrode was the disk of ironcut from the same bar as the crevice iron sample. These experiments also investigatedthe longer term behavior of the couple iron(internal)/iron(external), though it is recognizedthat the duration of the experiment is decidedly less than the time of practical immersiontests with commercial alloys.
Effect of Coupling
Results for a typical experiment in which iron within the crevice (7.9-cm 2 area) wascoupled to open, external iron (950-cm2 area) are shown in Fig. 16a. For the first 15minutes the crevice iron and external iron were uncoupled (each at its own open-circuitpotential). At 15 minutes the electrodes were short-circuited by using the potentiostatin the two-electrode configuration. Upon coupling, the potentials of the crevice iron andexternal iron shifted toward each other but were not identical due to an IR drop betweenthe crevice interior and the outer electrode. In all experiments the initial shift in potentialupon coupling was larger for the crevice iron than for external iron. At the end of theexperiment shown in Fig. 16a (48 hours) the potential difference between crevice iron(laden with corrosion products) and passive external iron was only 7 mV. The maximumpotential difference for this experiment was 34 mV at 30 minutes.
Figure 16a shows that there was no difference in electrode potential between thecrevice center and crevice edge before coupling. After coupling, the potential of thecrevice edge was usually intermediate to that of the crevice center and external iron. Butat the end of every experiment there again was no difference in potential between the twolocations in the crevice.
Results for two additional chloride concentrations are shown in Figs. 16b and 16c.The general appearance of these curves is similar to those in Fig. 16a.
Crevice Corrosion Rates
Figures 16 also show the crevice corrosion current between inner and outer ironsurfaces when coupled. In each case the current reached a maximum and then graduallydecreased with time.
The decrease in crevice corrosion current with time is due to changes in the composi-tion of the internal crevice electrolyte. First, as the crevice iron becomes active, theaccumulation of ferrous ions within the crevice causes a decrease in local pH, as discussedearlier. (For all cases except 0.6N CI-/0.6N CrO 4 ", where there was little crevicecorrosion, the measured crevice pH after 48 hours was in the range 4.5 to 6.0, as comparedto the bulk pH of 8.4.) In going from neutral to acidic solutions the anodic polarizationcurve for active iron is shifted to lower current density values at constant potential for
20

NRL REPORT 7781
TIME (HOURS)
500-1 21 24 8
_400-
30
a:200D
100
TIME (MINUTES)
ELECTRODES ELECTRODES COUPLEDUNCOUPLED
>-650-Crevice Iron--,CrvceIo
E
Na2rO4+ O6N aCIto penexte Ironeofcviein 7.cm;raof externalironn50 cmn
> 55021

E. McCAFFERTY
____________________TIMEM(OURS)
500- I 2 1O 24 48
_400-
I300z
a: 200
100
0 1 k*~ 1 k
TIME (MINUTES)
-70 ELECTRODES ELCRDE-OPLD~-70 UNCOUPLEDELCRDSOUE -
- TIME OF-COUPLING Crevice Center
o r Crevice Edge-6O-Crevice Iron-,,
Center< ~ g External Iron
Lu - 5 0 0
TIME (HOURS)-1-210 24 48
-40 I1 L fimL110 100 1000 10,000
TIME ( INUTES)
Fig. 16b - Effect of coupling iron within a 10rnil (0.25-mm) crevice in 0.006NNa2CrO4 + 0.06 NaCl to open external iron (area of crevice iron =7.9 cm 2 ; areaof external iron =50 cm 2)
22

NRL REPORT 7781
TIME (HOURS)500o T1_ I +
5 2 10 24 48
_400-
l- 300-WIC: 200-V
100
1 0O 100 1000 I0,00TIME (MINUTES)
- ELECTRODES - -ELECTRODES COUPLEDUNCOUPLED
-600
-500- Crevice Iron--< TIME OF o Center
N, COUPLING Edge
1 400 - External Iron TIME(HOURS)
1 210 24O: 48
1I0 100 1000 10,000TIME (MINUTES)
Fig. 16c - Effect of coupling iron within a 10-mil (0.25-mm) crevice in 0.006N Na 2 CrO4 +0.006N NaCI to open external iron (area of crevice iron = 7.9 cmn2 , area of external iron=50 eM2
)
open iron in deaerated 1N chloride [37,38] (Fig. 17). If open iron in bulk solutions
deaerated by intentional degassing is used as a scaled-up model for crevice iron in smallvolumes deaerated by oxygen consumption, then the anodic partial curve for crevice ironwill intersect the cathodic curve for open iron at a decreased current. As shown in Figs. 16,the electrode potential of the crevice iron was essentially constant after the maximum increvice corrosion current had been reached.
An increase in Cl- content within the crevice, as predicted [101 or observed withartificial crevices [12,17,39,40] could also cause a decrease in anodic current, accordingto the "halide-inhibited" mechanism of iron dissolution [351. Only if there is a drasticincrease in Cl concentration (approximately 3M to 6M) coupled with an intense acidity
23

E. McCAFFERTY
[ [c,-] -,.o
100-
PH u7.0
10
0.I
0.0: -
E vs S.CE. (my) -0
Fig. 17 - Effect of acidity on the anodic current density of ironin LON chloride (data replotted from Nobe and coworkers [37,383)
(pH < 0) will there be acceleration of the anodic reaction caused by the conjoint actionof C1- and H* ions [36,411. Figure 1S shows the anodic current for open iron as afunction of acidity for a fixed chloride concentration of 6N.
In addition, insoluble corrosion products which accumulate within the crevice forma resistive barrier, which also serves to decrease the crevice corrosion current. For theexperiment in Fig. 16a, gross bleeding of rust out of the crevice was first noticed atabout 10 hours. All crevices which underwent corrosion were heavily laden with corrosionproducts after termination of the 48-hour runs.
The effect of the CrO4= ion is seen in Fig. 19a, which shows the crevice corrosioncurrent at a constant Cr- concentration of 0.6N. The crevice corrosion current decreases
24

NRL REPORT 7781
!0
E
-400mV
-425mVoUS2
0.4 1.0 10 40
ACTIVITY OF H4
Fig. 18 - Effect of acidity on the anodic cur-rent density of iron in 6N chloride (McCaffertyand Hackerman [33])
with increasing amounts of chromate inhibitor. Duplicate runs in Fig. 19a show that thetrends are clear though the exact shapes of the curves are not identically reproducible.
Sodium chromate is an effective inhibitor of crevice corrosion if present in a suffi-ciently large concentration. The amount required appears to depend on the Cl- concentra-tion, as shown in Table 6. The minimum amount of CrO4 required lies somewherebetween 1 and 10 times the CI- concentration,
The effect of the C- ion is shown in Fig. 19b, which plots the crevice corrosioncurrent for a constant CrO4 concentration of 0.006N. In the early stages of the processthe corrosion current is greater the greater the C1- ion concentration. However at longertimes all the crevices exhibit essentially the same rate. This suggests that the long-termcrevice corrosion rate is controlled by the common local chemistry set up in each of theoccluded cavities. In each case the band of rust around the crevice mouth serves torestrict exchange of the local and bulk electrolytes.
Potential Difference Between Inner andOuter Surfaces
Table 7 compares the electrode potentials between internal active iron and externalpassive iron when coupled in Cr0 4 solutions. The potential of the crevice center wasmeasured with the reference electrode within the crevice top (Fig. 2). The potential ofthe open, external iron was measured with a similar reference electrode outside the crevice.
25

E. McCAFFERTY
500
[C1]z 0.6 NCREVICE WIDTH z 10 mils
400- EXTERNAL AREA= 50 cm2
S300 -0.006 N Cr0 4
za: ACr200f
10-0.06 N Cr0 47
1000
0610 20 30 40 50T IME (HOURS)
Fig. 19a - Effect of Cr04 = concentration on the crevice corrosion
of iron at constant C1- concentration
Table 6Inhibition of Crevice Corrosion by Sodium Chromate
Crevice Corrosion for Given CrO4 = Concentration? Rai of [CrO4 J1 C1J1010.006N 0.06N O.-06N Which Gives Protection
0.6N Yes Yes No 1:1
0.06N Yes -No 10:1
0.006N Yes No 10:1
26

NRL REPORT 7781
500
[Cro- 0.006 N
I 0_6 N l-. CREVICE WIDTH - 10 MILS400 . 1 EXTERNAL AREA 50cm2
300 0.06N Cr \
/ 0.006 H C100-0
0L t0 200 40 50TIME (HOURS)
Fig. 19b - Effect of CI- concentration on the crevice corrosionof iron at constant Cr0 4
= concentration
Table 7Potential Difference Between Crevice Center
and Open Iron When Coupled
Conc. Conc. Run. Eten -- E©eice, center (mV)
Cf0 4 = CI- No. First After jAfter After After After(N) (N) jCoupled 1lhr- 6hr 12 hr 24 hr 48 hr max AE
0.006 0.006 61 -21 28 63 87 71 58 99 (14 hr)
78 22 74 100 105 106 87 106 (24 hy)
0.006 0.06 80 62 71 57 45 44 57 73 (7 hr)
0.006 0.6 60 26 29 15 11 9 7 34 (0.5 hr)76 17 25 16 14 - - 30 (0.5 hr)79 5 17 17 - 14 17 21 (1.5 hr)
0.06 0.6 58 3 1 19 21 12 15 24 (4.5 hr)
0.6 0.6 57 13 14 14 11 5 - 14 (1 hr)66 3 3 4 1 -- 5 (2 hr)
27
: - .... . .. . .. .. / 1 l li~i I i Im . ............. ....

E. McCAFFERTY
The electrode potential of the crevice was always more negative than that of the openmetal (except for the first 30 minutes in Fig. 16c) due to a restricted oxygen supply tothe crevice [3,4,9,421, but the potential difference between the two was fairly small:10 to 100 mV for the active crevices (excluding the O.6N C1-/0.6N CrO4 - solution,which showed little crevice corrosion). Data for repeat runs in Table 7 show the maximumpotential difference between the crevice center and the open iron was reproducible towithin 15 mV.
Steady-state potential differences between inner and outer stainless steel surfaces in3-1/2% NaCl have been recently reported to be 50 to 150 mV [14,201. According toKorovin and Ulanovskii [421, when the oxygen concentration in seawater is lowered from9 to 1 mg/l, the change in potential of a 13% chromium steel coupled to platinum isshifted only 85 mV in the negative direction. This information as well as the data reportedhere shows that neither the initiation nor continuation of crevice corrosion requires alarge potential difference between inner and outer metal surfaces. As noted by Karlbergand Wranglen [141, the concept of a large potential difference between the crevice andexternal metal is based on potential measurements of uncoupled, unpolarized componentsin solutions of differing oxygen content. As shown in Figs. 16, the potential differencebetween the inner and outer iron surface is much larger before coupling than after.
Potential Difference and Corrosion Rate
Figure 20 shows the crevice corrosion current as a function of potential differencebetween *the crevice center and open, external iron. The data in the figure are for afixed CrO4= concentration of 0.006N with varying C1- content. In each case the openiron and crevice iron were coupled after 15 minutes, as in Figs. 16. The arrows in Fig. 20show the direction of increasing time.
It can be seen that there is no simple relationship between the potential differenceand the crevice corrosion rate over the entire process (48 hours). However the plots doexhibit some general features:
" Initially, each plot has a region in which the corrosion rate increases withincreasing potential difference. This region was complete in 0.5 hour for0.6N NaCI, 1.0 hour for 0.06N NaCl, and 2.5 hours for 0.006N NaCl. Thisregion corresponds to initiation of crevice corrosion by oxygen depletion andpassivity breakdown. Here the driving force for the corrosion reaction isthe development of a potential difference between outer and inner metal byoxygen depletion within the crevice.
" The maximum crevice corrosion rate does not necessarily occur at the maximumpotential difference. For 0.6N and 0.06N C- the maximum corrosion rateoccurred following a region in which the rate increased though the potentialdifference was decreasing. For 0.006N CF- however (and in a duplicate run)the maximum rate did occur at the maximum potential difference.
28

NRL REPORT 7781
2.5 hr500 - 2hr
5hr400-
1-RUN 80
P~hr300 10.06N C Ie-o .5hr
z 0.5 hrr hr
a Ihr RUN 61D 200 - I pcJ
24hr k24hr hr];~0h 8 ,, h,
_[ START 4h ' o
100- 4hr . 57hw START2.hr
I Ihr
30:min
0 I0 20 30 40 50 60 70 80 90 100 I10[Eexterncl - Ecrevice,cenev] (mV)
Fig. 20 - Sequential mapping of the potential difference between internal and externaliron in 0.006N CrO4= solutions (10-mi! crevices)
0 After the maximum crevice corrosion rate was reached, both the current andpotential difference decreased with time. The decrease in current is caused bychanges in the composition of the crevice and the appearance of resistive films,as discussed earlier.
Thus the potential difference between inner and outer parts which results due to oxygendepletion within the crevice is rate determining for the initiation, but not the propagation,of crevice corrosion.
Distribution of Crevice Attack
Attack in the crevice was not uniform. In all cases, attack was most severe aroundthe edges of the iron surface near the crevice opening. This observation is consistent with
29

E. McCAFFERTY
that of Karlberg and Wranglen [141, who noted that attack with 13% and 17% chromiumsteels always started near the mouth of the crevice. Preferential edge attack is alsoobserved in many practical immersion tests 1431.
A mathematical analysis of the distribution of current within a circular crevice hasbeen completed. The current distribution was found to be a complicated function ofcrevice geometry and polarization behavior. For small crevice openings and appropriatepolarization parameters the anodic current was calculated [441 to be largest near thecrevice edges, as was observed experimentally. Details will be given elsewhere.
Comparison of Crevice Corrosion and Pitting
As discussed earlier, with ferrous metals stress-corrosion cracks, corrosion pits, anderev ,es all develop local internal acidities even when the bulk electrolyte is neutral orbasic. In all three cases a special restrictive geometry produces an active local corrosioncell by limiting the exchange of the bulk and local electrolytes. In the case of pittingcorrosion a porous cap of corrosion products acts as the barrier; within crevices andstress-corrosion cracks the long narrow diffusion path limits the access to bulk electrolyte.Thus the common features of restrictive geometry and local acidity have led to the pointof view that all three forms of localized corrosion are different geometrical manifestationsof the same general phenomenon of "occluded cell corrosion" [1). That is, corrosionpits are micro-crevices, or crevices are macro-pits. However, though there are similarities,there also remain major differences between crevice corrosion and pitting.
Accordingly the pitting corrosion of iron was investigated in several of the Cr0 4 _/Cl -
solutions used in the crevice corrosion work. Pitting was studied by anodic polarizationof the same iron electrode (7.9 cm 2 ) used in the crevice corrosion experiments exceptthat the electrode was kept open to the solution. The open iron electrode was preparedas before and immersed in the solution until a steady-state open-circuit potential wasestablished (usually 72 hours). The electrode potential of the open iron was measuredwith a chlorodized silver wire immersed directly in the solution near the electrode surface.The potential was adjusted to the Ag/AgCI standard electrode using the data from Fig. 4.
The anodic polarization curve for the open iron was then determined. Potentialswere increased in the positive direction in discrete steps. In the absence of pitting, thecurrent decreased to a steady value in 0.5 to 2 hours. But when pitting first occurred,the current increased steadily with time at that given potential. This potential at whichpitting is first observed is called the pitting potential. At potentials above (more positivethan) the pitting potential the current also increased with time.
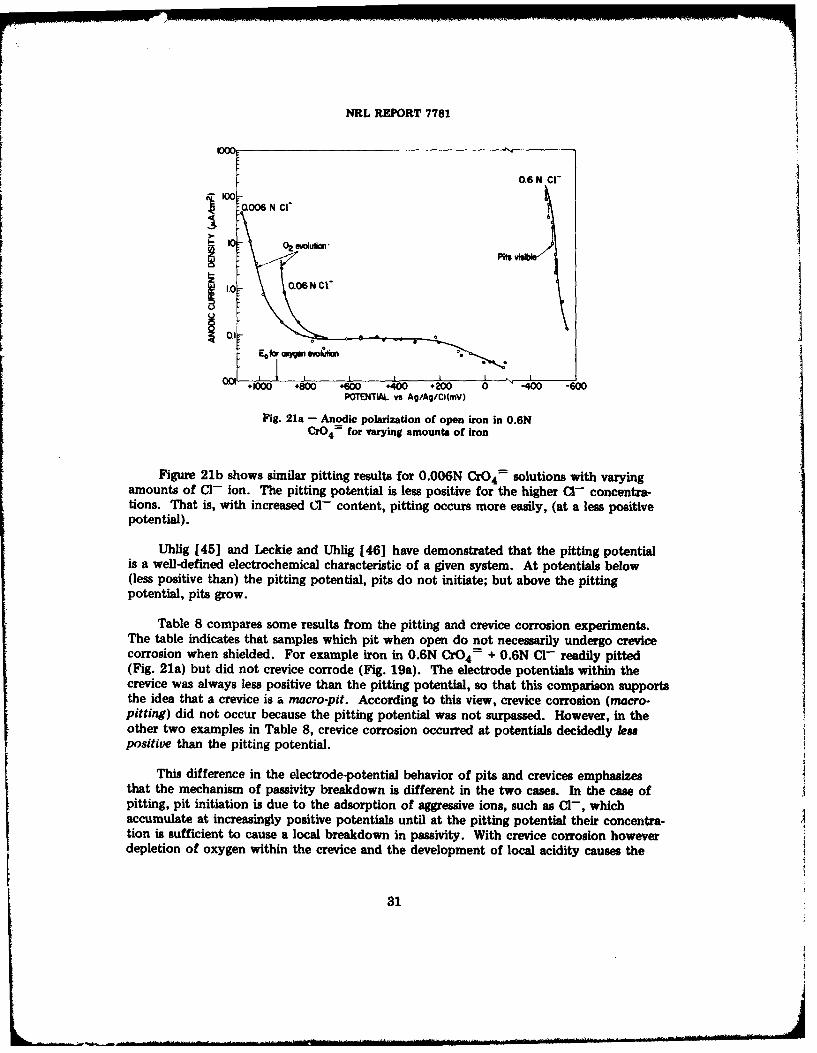
Figure 21a shows anodic polarization curves for iron in 0.6N Cr0 4 with varyingamounts of C- ion. Additions of 0.006N C- and 0.06N C1- caused no pitting, andboth solutions maintained passivity over the potential regions from open circuit to oxygenevolution. However with 0.6N C- pitting started at a potential of -450 mV. Theincrease in current with time after the onset of pitting is shown by dashed lines whichconnect the initial current at a given potential with the value after 5 to 10 minutes atthat same potential.
30
NRL REPORT 7781
1000: .
0.6 N Cl"
E 00am6 N C|"
000 .00 60 40 .0 0 -40 60
POTE0TIAL vs Ag/Ag/C)(mV)
Fig. 21a - Anodic polarization of open iron in O.6NCr04= for varying amounts of iron
Figure 21b shows similar pitting results for 0.006N Cr0 4 - solutions with varyingamounts of C- ion. The pitting potential is less positive for the higher C- concentra-tions. That is, with increased 0- content, pitting occurs more easily, (at a less positivepotential).
Uhlig [45] and Leckie and Uhlig [46] have demonstrated that the pitting potentialis a well-defined electrochemical characteristic of a given system. At potentials below(less positive than) the pitting potential, pits do not initiate; but above the pittingpotential, pits grow.
Table 8 compares some results from the pitting and crevice corrosion experiments.The table indicates that samples which pit when open do not necessarily undergo crevicecorrosion when shielded. For example iron in 0.6N CrO4 = + O.6N Cl- readily pitted(Fig. 21a) but did not crevice corrode (Fig. 19a). The electrode potentials within thecrevice was always less positive than the pitting potential, so that this comparison supportsthe idea that a crevice is a macro-pit. According to this view, crevice corrosion (macro-pitting) did not occur because the pitting potential was not surpassed. However, in theother two examples in Table 8, crevice corrosion occurred at potentials decidedly lesspositive than the pitting potential.
This difference in the electrode-potential behavior of pits and crevices emphasizesthat the mechanism of passivity breakdown is different in the two cases. In the case ofpitting, pit initiation is due to the adsorption of aggressive ions, such as Cl-, whichaccumulate at increasingly positive potentials until at the pitting potential their concentra-tion is sufficient to cause a local breakdown in passivity. With crevice corrosion howeverdepletion of oxygen within the crevice and the development of local acidity causes the
31

E. McCAFFERTY
N r0.06 NC17
E 00-OONt0O2C
S6 PITTG
1
ITTNG
00I
POTENTAL vs Ag/AgCI(MV)- -40 60
Fig. 21b - Anodic polarization of open iron in 0.006NCr04 for varying amounts of iron
Table 8Comparison of Pitting Corrosion and CreviceCorrosion of Iron in Cr0 4 =/Cl- Solutions
Crevice Potential
Pitting Potential vs Ag/AgClExample Potential (MV)vs Ag/AgCI Run Location - T
(MV) At I AfterI I I_ 1_ hbr IGiven Time
Pitting Corrosion on Open Iron; No Crevice Corrosion on Shielded Iron
0.6N Cr0 4 + 0.6N CF ' -450 57 Center -450 1--532 (28 hr)IEdge -446 j-533 (28hr
j _______Edge -454 -- 527 (21 hr)~
Pitting Corrosion on Open Iron; Crevice Corrosion on Shielded Iron
0.006N Cr04= + 0.006N CF- -140 61 Center --353 -621 (48 hr)Edge -357 -624 (48 hr)
78 Center -372 --626 (44 hr)Edge -413 -626 (44 hr)
0.006N Cr0 + 0.06N CF- ---420 80 Center --600 -653 (55 hr)Edge -570 -650 (55 hr)
32

NRL REPORT 7781
breakdown in passivity, without the necessity of Cl- participation. Thus there appearsto be no well-defined critical potential for crevice corrosion, and the internal electrodepotential need not be related to the critical potential which causes pitting on opensamples.
SUMMARY
For isolated crevices (internal iron not short-circuited to external iron):
* The anodic corrosion rate was determined by the limiting current for oxygenreduction.
* The limiting cathodic current, and hence the corrosion rate, was less than thatfor the open sample.
* For crevice heights less than the thickness of the oxygen diffusion layer thelimiting cathodic current, and hence the corrosion rate, was suppressed to aconstant value.
* The limiting cathodic current for oxygen reduction was not dependent on pH
or Cl- concentration.
For coupled crevices (internal iron short-circuited to external iron or platinum):
* The initial current increased with an increase in the C- concentration or in thearea of the external electrode but did not depend on the crevice height.
* In the Cr0 4 =/C - solutions the crevice corrosion currents increased with timeto maxima but then decreased.
* At constant C1- concentration the crevice corrosion current decreased withincreasing Cr0 4
= concentration.
* At constant Cr04= concentrations which are not protective the crevice corrosioncurrent was greater the greater the C17 concentration for the early stages of theprocess, but at longer times the corrosion rates for all CI- concentrations werethe same.
" Attack within the crevice was not uniform and was most severe near the crevicemouth.
" The electrode potential within the crevice is not related to the critical potentialof pitting for the open sample.
33

E. McCAFFERTY
ACKNOWLEDGMENT
This work was supported in full by the Office of Naval Research.
REFERENCES
1. B.F. Brown, Corrosion 26, 249 (1970).
2. E. McCafferty, J. Electrochem. Soc. 121, 1007 (1974).
3. I.L. Rosenfeld and I.K. Marshakov, Corrosion 20, 115t (1964).
4. I.L. Rosenfeld and I.K. Marshakov, Zh. Fiz. Khim. 30, 2724 (1956).
5. H.H. Uhlig, Corrosion and Corrosion Control, John Wiley, New York, 1971, p. 26.
6. M.H. Peterson, TJ. Lennox, Jr., and R.E. Groover, Materials Protection 9 (No. 1),23 (1970).
7. B.F. Brown, C.T. Fujii, and E.P. Dahlberg, J. Electrochem. Soc. 116, 218 (1969).
8. J.A. Smith, M.H. Peterson, and B.F. Brown, Corrosion 26, 539 (1970).
9. M. Pourbaix, Corrosion 26, 431 (1970).
10. M. Pourbaix, p. 17 in The Theory of Stress Corrosion Cracking in Alloys, J.C.Scully, editor, NATO, Brussels, 1971.
11. G. Butler, P. Stretton, and J.G. Beynon, Br. Corros. J. 7, 168 (1972).
12. T. Suzuki, M. Yamabe, and Y. Kitamura, Corrosion 29, 18 (1973).
13. F.D. Bogar and C.T. Fujii, "Solution Chemistry in Crevices on Fe-Cr Binary Alloys,"NRL Report 7690, Mar. 1974.
14. G. Karlberg and G. Wranglen, Corrosion Sci. 11, 499 (1971).
15. M.H. Peterson and T.J. Lennox, Jr., Corrosion 29, 406 (1973).
16. B.E. Wilde and E. Williams, Electrochim. Acta 16, 1971 (1971).
17. Y. Kitamura and T. Suzuki, p. 716 in Proceedings of the 4th International Congresson Metallic Corrosion, Amsterdam, 1969, published by the National Association ofCorrosion Engineers, 1972.
18. A. Pourbaix, Corrosion 27, 449 (1971).
19. E.A. Lizlovs, J. Electrochem. Soc. 117, 1335 (1970).
20. J.F. Bates, Corrosion, 29, 28 (1973).
21. N.D. Greene, W.D. France, Jr., and B.E. Wilde, Corrosion 21, 275 (1965).
22. DJ.G. Ives and G.J. Janz, editors, Reference Electrodes, Academic Press, NewYork, 1961, p. 205.
23. J. Dvay, B. Lengyel, Jr., and L. Meiziros, Acta Chimica Academiae ScientiarumHungaricae 62, 157 (1969).
34

NRL REPORT 7781
24. Z.A. lofa and M.A. Makhbuba, Protection of Metals (USSR) 3, 329 (1967).25. G. Kar, 1. Cornet, and D.W. Fuerstenau, J. Electrochem. Soc. 119, 33 (1972).
26. E.J. Kelly, J. Electrochem. Soc. 112, 124 (1965).
27. J.J. Lingane, Electroanalytical Chemistry, 2nd edition, Interscience, New York, 1958,p. 227.
28. "International Critical Tables," Vol. V, 1929, p. 64.
29. Standard Methods for the Examination of Water and Wastewater, 13th edition,American Public Health Association, Washington, D.C., 1971, p. 480.
30. I.L. Rozenfeld and 0.1. Vashkov, Protection of Metals (USSR) 1, 56 (1965).
31. O.B. Ellis and F.L. LaQue, Corrosion 7, 362 (1951).
32. I.B. Ulanovskii and Yu.M. Korovin, J. Appi. Chem. (USSR), 35, 1683 (1962).[English translation of Zh. Prikl. Khim.]
33. I.B. Ulanovskii, J. Appl. Chem. (USSR), 39, 768 (1966). [English translation ofZh. Pril. Khim.)
34. J.M. Fouts and C.W. Bergerson, Corrosion 13, 12t (1957).
35. W.J. Lorenz, Corrosion Sci. 5, 121 (1965).
36. E. McCafferty and N. Hackerman, J. Electrochem. Soc. 119, 999 (1972).
37. 5. Asakura and K. Nobe, J. Electrochem. Soc. 118, 13 (1971).
38. R.J. Chin and K. Nobe, J. Electrochem. Soc. 119, 1457 (1972).
39. E.D. Parsons, H.H. Cudd, and H.L. Lochte, J. Phys. Chem. 45, 1339 (1941).
40. M.J. Pryor, Corrosion 9, 467 (1953).
41. N.A. Darwish, F. Hilbert, W.J. Lorenz, and H. Rossway, Electrochim. Acta 18,421 (1973).
42. Yu.M. Korovin and I.B. Ulanovskii, Corrosion 22, 16 (1966).
43. K.D. Efird, International Nickel Co., Wrightsville Beach, N.C., personal communication, June, 197.44. E. McCafferty, Report of NRL Progress, Sept. 1973, pp. 66-69.
45. H.H. Uhlig, Materials Protection and Performance 12 (No. 2, Pt 1), 42 (1973).46. H.P. Leckie and H.H. Uhlig, J. Electrochem. Soc. 113, 1262 (1966).
35