Distributed Bio-Oil Reforming - Energy
23
S. Czernik 1 , R. French 1 , M. M. Penev 1 , J. Marda 2 , A. M. Dean 2 1 National Renewable Energy Laboratory 2 Colorado School of Mines May 12, 2009 1 Project ID# PDP_15_Czernik NREL is a national laboratory of the U.S. Department of Energy Office of Energy Efficiency and Renewable Energy operated by the Alliance for Sustainable Energy, LLC THIS PRESENTATION DOES NOT CONTAIN ANY PROPRIETARY, CONFIDENTIAL OR OTHERWISE RESTRICTED INFORMATION Distributed Bio-Oil Reforming
Transcript of Distributed Bio-Oil Reforming - Energy
S. Czernik1, R. French1, M. M. Penev1, J. Marda2, A. M. Dean2
1National Renewable Energy Laboratory2Colorado School of MinesMay 12, 2009
1
Project ID#PDP_15_Czernik
NREL is a national laboratory of the U.S. Department of Energy Office of Energy Efficiency and Renewable Energy operated by the Alliance for Sustainable Energy, LLCTHIS PRESENTATION DOES NOT CONTAIN ANY PROPRIETARY, CONFIDENTIAL OR OTHERWISE RESTRICTED INFORMATION
Distributed Bio-Oil Reforming

National Renewable Energy Laboratory Innovation for Our Energy Future2
• Start date: 2005
• End date: 2012
• Percent complete: 60%
TIMELINE
BUDGET
BARRIERS
PARTNERS
• FY 2005: $100K• FY 2006: $300K• FY 2007: $350K• FY 2008: $700K• FY 2009: $0K
Production BarriersA. Fuel processor capital C. Operation & maintenanceD. Feedstock issues F. Control & safety
2012 Targets• $3.80/gallon gasoline equivalent• 72% energy efficiency (bio-oil to
H2)
• Colorado School of Mines -Oxidative cracking
• University of Minnesota -Catalyst Development
• Chevron – Feedstock Effects (3 year CRADA)
Overview

National Renewable Energy Laboratory Innovation for Our Energy Future
Distributed Production of Hydrogen via Biomass Pyrolysis
Biomass fast pyrolysisproduces high yields of liquid product, bio-oil, which can be stored and shipped to a site for renewable hydrogen production.
NREL is investigating the low-temperature, partial oxidation, and catalytic autothermal reforming of bio-oil for this application.

National Renewable Energy Laboratory Innovation for Our Energy Future
Pyrolysis:CH1.46O0.67→0.71CH1.98O0.76 + 0.21CH0.1O0.15 + 0.08CH0.44O1.23
Biomass Bio-Oil (75%) Char (13%) Gas (12%)
Catalytic Steam Reforming of Bio-oil:Bio-oil (74 wt% CH1.28O0.41, 26 wt % H2O) - 90 wt% of feedCH3OH - 10 wt% of feedH2O (2 mole ratio steam to carbon)
Overall Reaction:CH2.18O0.78 + 0.51O2 + 0.19 H2O → CO2 + 1.28 H2
Estimated Practical Yield: 9.3 wt %Energy Efficiency Estimates are in Progress based on Aspen Modeling

National Renewable Energy Laboratory Innovation for Our Energy Future
Distributed Bio-Oil Reforming Approach
Atomization Oxidative Cracking
Bio- Oil (+MEOH) O2
Catalytic Auto-Thermal H2
Enabling Research:
Process Integration:
H2O
Oxidative Cracking Kinetics and Mechanisms
Process Optimization
Catalyst Screening
Low-Temperature Catalytic Oxidation Mechanisms
Engineering Testing
AirIndirect Heat
Heat and Mass Balance
H2O, CO, CH4 CO2,
Separation
H2O + CO2
~400 oC ~650 oC
Q

National Renewable Energy Laboratory Innovation for Our Energy Future
Objectives
• Overall Develop the necessary understanding of the process chemistry, compositional effects, catalyst chemistry, deactivation, and regeneration strategy as a basis for process definition for automated distributed reforming; demonstrate the process
• FY 2009Improve bio-oil atomization with less MeOH addition,
Demonstrate non-catalytic partial oxidation of bio-oil at bench scale
Demonstrate catalytic conversion of bio-oil to syngas at bench scale
Provide mass balance data for H2A

National Renewable Energy Laboratory Innovation for Our Energy Future
Technical Accomplishments
• FY 2006– Bio-oil volatilization method developed– Oxidative cracking to CO with minimal CO2
• FY 2007 – Demonstrated equilibrium catalytic conversion to syngas at low
temperature and low H2O/C
• FY2008– Demonstrated catalyst performance– Designed and built a bench scale reactor system
• FY2009– Demonstrated operation of a bench-scale reactor system using 90
wt% bio-oil/10 wt% methanol mixture

National Renewable Energy Laboratory Innovation for Our Energy Future
Progress in Process Development 1. Bio-Oil Volatilization
• The new ultrasonic nozzle can produce a fine mist even from high-viscosity liquids.
• Successful tests with 90 wt% bio-oil/10 wt% methanol mixture.
• Promising attempts of feeding neat bio-oil though 10 wt% methanol addition will likely be used to homogenize and stabilize bio-oil.
• Ultrasonic nozzle will likely be replaced by a high-pressure injector in larger-scale units.

National Renewable Energy Laboratory Innovation for Our Energy Future
Progress in Process Development 2. Oxidative Cracking
Overall H2 Yield
Hydrogen yields are 25-30% of the stoichiometric potential;Those yields will significantly increase after completion of water-gas shift.
0
5
10
15
20
25
30
35
40
0.7 1.2 1.4 1.5 1.6
Effective O:C ratio (m olar)
Y H2,
Ove
rall
(wt%
)
625650675700725750800850

National Renewable Energy Laboratory Innovation for Our Energy Future
Progress in Process Development 2. Oxidative Cracking
Overall CO Yield
>70% carbon can be converted to CO by non-catalytic POX;O:C ratio has much stronger effect than temperature on CO yields
0
10
20
30
40
50
60
70
80
90
0 .7 1 .2 1 .4 1 .5 1 .6
E ffe c tiv e O :C ra tio (m o la r )
Y CO
,Ove
rall (w
t%)
625650675700725750800850

National Renewable Energy Laboratory Innovation for Our Energy Future
Progress in Process Development 2. Oxidative Cracking
Benzene Yield
At O:C>1.4 temperature has little effect on benzene (aromatics) formation
0 .0
0 .5
1 .0
1 .5
2 .0
2 .5
3 .0
3 .5
4 .0
4 .5
5 .0
0 .7 1 .2 1 .4 1 .5 1 .6
E ffe c tiv e O :C r a tio (m o la r )
Y Ben
zene
,Bio
-Oil,
max
(wt%
)
6 2 56 5 06 7 57 0 07 2 57 5 08 0 08 5 0

National Renewable Energy Laboratory Innovation for Our Energy Future
Progress in Process Development3. Catalytic Conversion
University of Minnesota catalyst (Lanny Schmidt’s group): 1 wt % Rh and 1 wt % ceria on alumina
0%
20%
40%
60%
80%
100%
0.5 1 1.5 2 2.5 3
% C
onve
rsio
n to
CO
+H2
O/C ratio
Catalytic Partial Oxidation of Hardwood Bio-oilHydrogen Yield
Oxidizing Region
Flammable
1 – 1.5 is the optimal range of O/C for catalytic POX of bio-oil

National Renewable Energy Laboratory Innovation for Our Energy Future
Progress in Process Development3. Catalytic Conversion
University of Minnesota catalyst (Lanny Schmidt’s group): 1 wt % Rh and 1 wt % ceria on alumina
65%
75%
85%
95%
105%
115%
0 0.5 1 1.5 2 2.5 3 3.5 4 4.5
% Stoichiom
etricPo
tential
S/C Ratio
Catalytic Steam Reforming of Hardwood Bio‐oil Hydrogen Yield
O/C = 0.73
80-90% of stoichiometric yield of hydrogen was produced by catalytic steam reforming of bio-oil for the whole S/C range
National Renewable Energy Laboratory Innovation for Our Energy Future
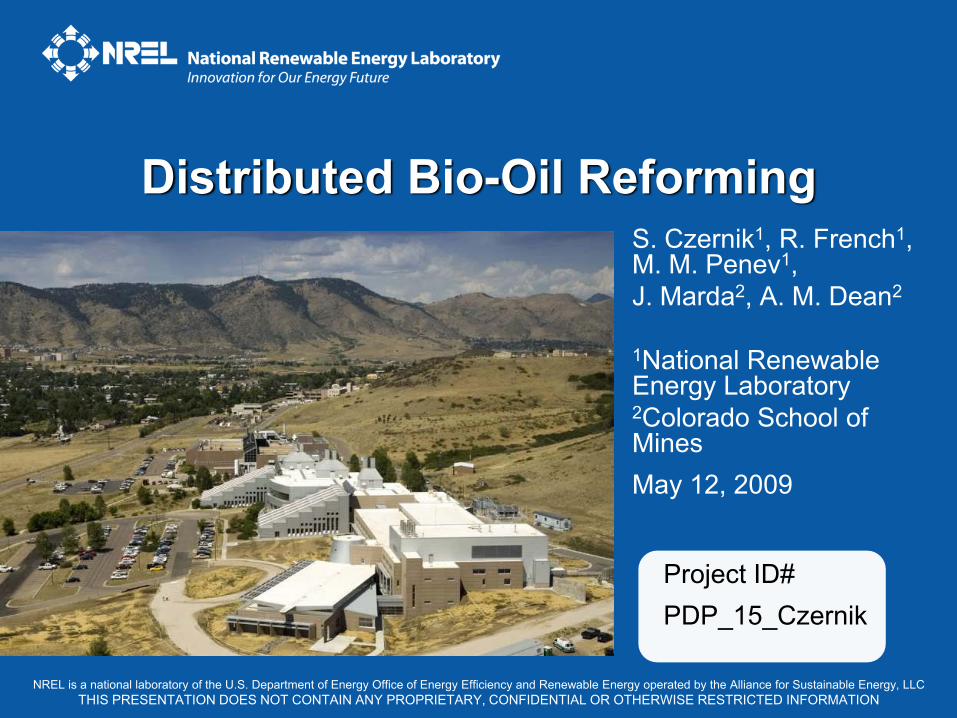
Progress in Process Development 3. Catalytic Conversion
Product Gas Composition from Different Feedstocks
0.0
10.0
20.0
30.0
40.0
50.0
60.0
70.0
80.0
H2 CO CO2 H2O
% m
ol
Syn-gas Composition650 C; O/C=1.3; S/C=2.5
Avicel
K-Avicel
Bagasse
Oak
Hardwood

National Renewable Energy Laboratory Innovation for Our Energy Future
Progress in Process Development 4. Bench-scale Reactor
• Built out of quartz: d = 30 mm; h = 450 mm
• Connected to the feeding and condensation systems
• Feed rate 1-2 g/min 90 wt% bio-oil/10 wt% methanol solution
• On-line product gas composition monitoring
• 1-4 hour runs• Detailed product analysis• Improved mass balance

National Renewable Energy Laboratory Innovation for Our Energy Future
Progress in Process Development 4. Bench Scale Reactor System
National Renewable Energy Laboratory Innovation for Our Energy Future
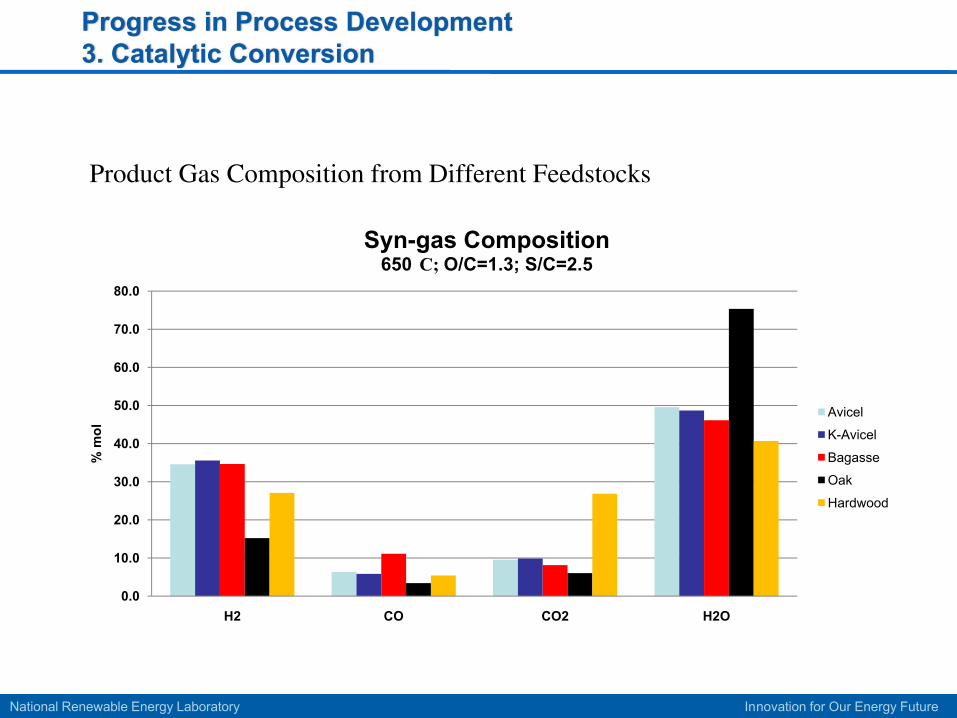
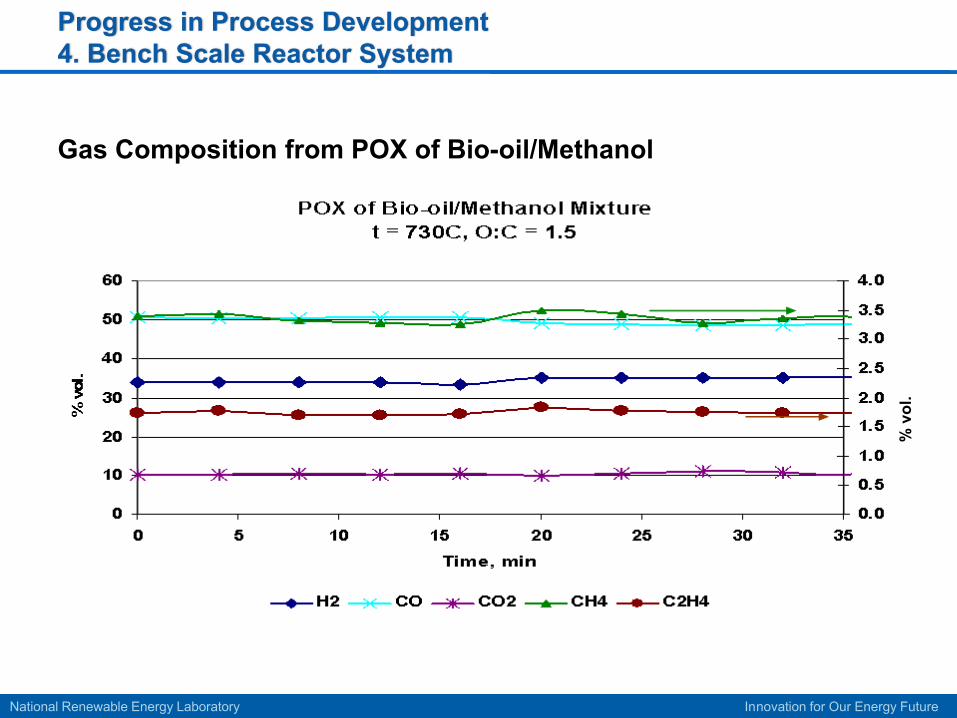
Progress in Process Development 4. Bench Scale Reactor System
Gas Composition from POX of Bio-oil/Methanol
% v
ol.
National Renewable Energy Laboratory Innovation for Our Energy Future
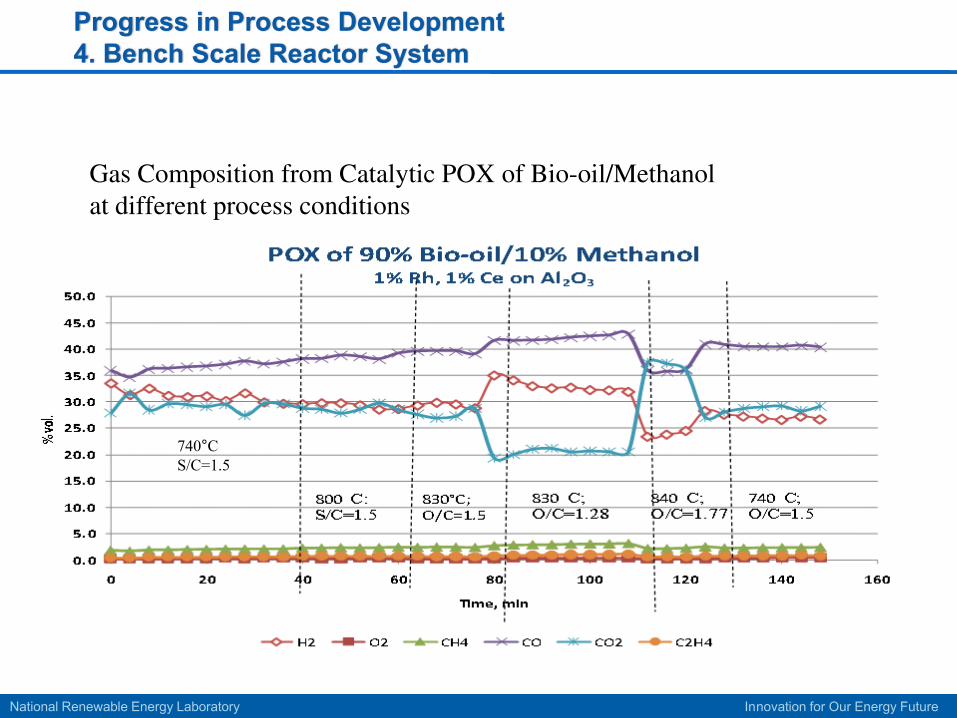
Progress in Process Development 4. Bench Scale Reactor System
740°CS/C=1.5
Gas Composition from Catalytic POX of Bio-oil/Methanol at different process conditions

National Renewable Energy Laboratory Innovation for Our Energy Future
Progress in Process Development 5. Process Analysis
Hydrogen Cost 1500 kg/day station used for H2A analysis.
Capital Costs $1,660,000 ($2.03/gge).
Total cost of delivered hydrogen $4.48/gge$2.59/gge for the production $1.88/gge for compression, distribution, and dispensing.

National Renewable Energy Laboratory Innovation for Our Energy Future
Process Subsystems Outline
Hydrogen
Feed Conditioning
PSA
Bio Oil
Water
Methanol
Steam Gen. Condensate
Heat
Burner
Ref. (CPOX+ATR)
W.G. SHIFT
COMPRESSION
Exhaust
Air
NREL- lead design
Industry - available subsystems
NOMINALLY
• Steam / Carbon = 3.0• O2/Carbon = 0.7• Methanol / Bio Oil= 10 wt%

National Renewable Energy Laboratory Innovation for Our Energy Future
Summary
• Bench-scale reactor system tests of non-catalytic and catalytic partial oxidation of bio-oil were performed using 90 wt% bio-oil/10 wt% methanol mixtures
• Carbon-to-gas conversion at bench-scale was slightly less than that achieved in micro scale system
• Rhodium catalyst enhanced bio-oil to syngas conversion by POX with and without added steam
• Bio-oils from herbaceous feedstock were more difficult to process and left more deposits than wood bio-oils
• Experimental results from bench-scale system will be used as to validate ASPEN simulations based on micro-scale data.

National Renewable Energy Laboratory Innovation for Our Energy Future
Project Timeline
ID Task Name
1 Bio-Oil Volatilization2 Processing Options3 Modification and Characterization4 Injector Development5 Coking Studies6 Go / No Go on Bio-Oil performance7 Oxidative Cracking8 Proof of Concept9 Reduce Catalyst Loading by 50%10 Partial Oxidation Database11 Modeling and Optimization12 Jon Marda Thesis13 Catalytic Auto-Thermal Reforming14 Catalyst Screening15 Catalyst Process optimization16 Demonstrate catalyst performance consistent with $3.80/gge h17 Catalyst Mechanistic Studies18 Integrated Separation19 Concept Evaluation20 Materials Evaluation21 Integrated Laboratory System Experiment22 Go / No Go on Conceptual Design23 Systems Engineering 24 Oxygen, Steam and Heat Integration25 Engineering Design and Construction26 Prototype System Developed27 Heat and Mass Balances28 Process Upsets29 Long Duration Runs30 Demonstrate Distributed Hydrogen Production from
Bio-Oil for $3.8/gge31 Safety Analysis32 Review and Analysis of Pressure, O2, H233 Systems Integration
5/31
6/30
12/31
5/30
8/31
5/31
9/
2005 2006 2007 2008 2009 2010 2011 2012

National Renewable Energy Laboratory Innovation for Our Energy Future
Future Work
• FY 2009: Produce process performance data as a function of process conditions (temperature, catalyst, O/C, S/C) using the bench-scale system – Integrated laboratory experiment– Optimization work– Long-term catalyst performance test– Assess the impact of the bench-scale results on
the process design and on hydrogen production cost
• FY 2010: “Go/no-go” on conceptual design• FY 2011: Prototype system • FY 2012: Long duration runs to validate the process