Distinct functional networks within the cerebellum and - FreeSurfer
13
Distinct functional networks within the cerebellum and their relation to cortical systems assessed with independent component analysis Vitaly I. Dobromyslin a , David H. Salat a, b, c , Catherine B. Fortier d, e , Elizabeth C. Leritz b, c, d, f , Christian F. Beckmann g, h, i , William P. Milberg d, e , Regina E. McGlinchey d, e, ⁎ a Neuroimaging Research Center for Veterans, VA Boston Healthcare System, Boston, MA, USA b Athinoula A. Martinos Center for Biomedical Imaging, Massachusetts General Hospital, Boston, MA, USA c Harvard Medical School, Boston, MA, USA d Geriatric Research, Education, and Clinical Center, VA Boston Healthcare System Boston, MA, USA e Department of Psychiatry, Harvard Medical School, USA f Division of Aging, Brigham & Women's Hospital, Boston, MA, USA g Donders Institute, Centre for Cognitive Neuroimaging, Radboud University Nijmegen, Netherlands h MIRA Institute, University of Twente, Netherlands i Oxford Centre for Functional MRI of the Brain (FMRIB), UK abstract article info Article history: Received 20 October 2011 Revised 25 January 2012 Accepted 31 January 2012 Available online 9 February 2012 Keywords: Cerebellar networks Functional connectivity fcMRI ICA Cerebellar functional circuitry has been examined in several prior studies using resting fMRI data and seed- based procedures, as well as whole-brain independent component analysis (ICA). Here, we hypothesized that ICA applied to functional data from the cerebellum exclusively would provide increased sensitivity for detecting cerebellar networks compared to previous approaches. Consistency of group-level networks was assessed in two age- and sex-matched groups of twenty-five subjects each. Cerebellum-only ICA was compared to the traditional whole-brain ICA procedure to examine the potential gain in sensitivity of the novel method. In addition to rep- licating a number of previously identified cerebellar networks, the current approach revealed at least one net- work component that was not apparent with the application of whole brain ICA. These results demonstrate the gain in sensitivity attained through specifying the cerebellum as a target structure with regard to the identi- fication of robust and reliable networks. The use of similar procedures could be important in further expanding on previously defined patterns of cerebellar functional anatomy, as well as provide information about unique networks that have not been explored in prior work. Such information may prove crucial for understanding the cognitive and behavioral importance of the cerebellum in health and disease. Published by Elsevier Inc. Introduction Traditionally, the cerebellum was viewed as a region of the brain that is concerned principally with motor control and motor learning (Ito, 1984; Kheradmand and Zee, 2011). More recently, the cerebellum has been acknowledged to contribute to a range of cogni- tive and behavioral processes. Importantly, reciprocal connections between cerebellum and association cortices, including prefrontal cortex (Middleton and Strick, 1994, 2001) and parietal lobe (Clower et al., 2001), provide the anatomical connectivity that may support cerebellum's role in higher cortical functions, including cognition and emotion (Allen and Courchesne, 1998; Ivry et al., 2002; Leiner et al., 1993; Schmahmann and Pandya, 1997). Clinical evidence of the cerebellum's contribution to cognitive and emotional functioning comes from neuropsychological studies demonstrating deficits in patients with cerebellar compromise due to damage or disease. In particular, lesions of the cerebellar posterior lobe (lobes VI–IX) can result in impairment in executive, visuo- spatial, linguistic, and affective functions. Collectively, this constella- tion of clinical symptoms has been termed the Cerebellar Cognitive Affective Syndrome or CCAS (Schmahmann and Sherman, 1998) and, importantly, can occur in the absence of motor impairment (Paulus et al., 2004) or impairment in simple motor learning (Fortier et al., 2000). There is also some evidence of laterality in the presentation of symptoms occurring with cerebellar lesions. For example, language deficits have been reported with damage to the right cerebellar hemisphere (Murdoch, 2010), and this could be expected given the decussation of cerebellar projections at the level of the superior cerebellar peduncle prior to communicating with the rest of the brain (Brodal, 1979). Classical tract tracing and dissection procedures provided the basis of cerebellar connectivity until recently (Kelly and Strick, 2003; Middleton and Strick, 1994, 2001; O'Reilly et al., 2009; Schmahmann, 1991; Stoodley and Schmahmann, 2009), when NeuroImage 60 (2012) 2073–2085 ⁎ Corresponding author at: 150 South Huntington Avenue, GRECC 182 (JP), Boston, MA 02130, USA. Fax: +1 857 364 4544. E-mail address: [email protected] (R.E. McGlinchey). 1053-8119/$ – see front matter. Published by Elsevier Inc. doi:10.1016/j.neuroimage.2012.01.139 Contents lists available at SciVerse ScienceDirect NeuroImage journal homepage: www.elsevier.com/locate/ynimg
Transcript of Distinct functional networks within the cerebellum and - FreeSurfer

NeuroImage 60 (2012) 2073–2085
Contents lists available at SciVerse ScienceDirect
NeuroImage
j ourna l homepage: www.e lsev ie r .com/ locate /yn img
Distinct functional networks within the cerebellum and their relation to corticalsystems assessed with independent component analysis
Vitaly I. Dobromyslin a, David H. Salat a,b,c, Catherine B. Fortier d,e, Elizabeth C. Leritz b,c,d,f,Christian F. Beckmann g,h,i, William P. Milberg d,e, Regina E. McGlinchey d,e,⁎a Neuroimaging Research Center for Veterans, VA Boston Healthcare System, Boston, MA, USAb Athinoula A. Martinos Center for Biomedical Imaging, Massachusetts General Hospital, Boston, MA, USAc Harvard Medical School, Boston, MA, USAd Geriatric Research, Education, and Clinical Center, VA Boston Healthcare System Boston, MA, USAe Department of Psychiatry, Harvard Medical School, USAf Division of Aging, Brigham & Women's Hospital, Boston, MA, USAg Donders Institute, Centre for Cognitive Neuroimaging, Radboud University Nijmegen, Netherlandsh MIRA Institute, University of Twente, Netherlandsi Oxford Centre for Functional MRI of the Brain (FMRIB), UK
⁎ Corresponding author at: 150 South Huntington AvMA 02130, USA. Fax: +1 857 364 4544.
E-mail address: [email protected]
1053-8119/$ – see front matter. Published by Elsevier Idoi:10.1016/j.neuroimage.2012.01.139
a b s t r a c t
a r t i c l e i n f oArticle history:Received 20 October 2011Revised 25 January 2012Accepted 31 January 2012Available online 9 February 2012
Keywords:Cerebellar networksFunctional connectivityfcMRIICA
Cerebellar functional circuitry has been examined in several prior studies using resting fMRI data and seed-based procedures, as well as whole-brain independent component analysis (ICA). Here, we hypothesized thatICA applied to functional data from the cerebellum exclusively would provide increased sensitivity for detectingcerebellar networks compared to previous approaches. Consistency of group-level networkswas assessed in twoage- and sex-matched groups of twenty-five subjects each. Cerebellum-only ICAwas compared to the traditionalwhole-brain ICA procedure to examine the potential gain in sensitivity of the novel method. In addition to rep-licating a number of previously identified cerebellar networks, the current approach revealed at least one net-work component that was not apparent with the application of whole brain ICA. These results demonstratethe gain in sensitivity attained through specifying the cerebellum as a target structure with regard to the identi-fication of robust and reliable networks. The use of similar procedures could be important in further expandingon previously defined patterns of cerebellar functional anatomy, as well as provide information about uniquenetworks that have not been explored in prior work. Such information may prove crucial for understandingthe cognitive and behavioral importance of the cerebellum in health and disease.
Published by Elsevier Inc.
Introduction
Traditionally, the cerebellum was viewed as a region of thebrain that is concerned principally with motor control and motorlearning (Ito, 1984; Kheradmand and Zee, 2011). More recently, thecerebellum has been acknowledged to contribute to a range of cogni-tive and behavioral processes. Importantly, reciprocal connectionsbetween cerebellum and association cortices, including prefrontalcortex (Middleton and Strick, 1994, 2001) and parietal lobe (Cloweret al., 2001), provide the anatomical connectivity that may supportcerebellum's role in higher cortical functions, including cognitionand emotion (Allen and Courchesne, 1998; Ivry et al., 2002; Leineret al., 1993; Schmahmann and Pandya, 1997).
Clinical evidence of the cerebellum's contribution to cognitive andemotional functioning comes from neuropsychological studies
enue, GRECC 182 (JP), Boston,
u (R.E. McGlinchey).
nc.
demonstrating deficits in patients with cerebellar compromise dueto damage or disease. In particular, lesions of the cerebellar posteriorlobe (lobes VI–IX) can result in impairment in executive, visuo-spatial, linguistic, and affective functions. Collectively, this constella-tion of clinical symptoms has been termed the Cerebellar CognitiveAffective Syndrome or CCAS (Schmahmann and Sherman, 1998)and, importantly, can occur in the absence of motor impairment(Paulus et al., 2004) or impairment in simple motor learning(Fortier et al., 2000). There is also some evidence of laterality in thepresentation of symptoms occurring with cerebellar lesions. Forexample, language deficits have been reported with damage to theright cerebellar hemisphere (Murdoch, 2010), and this could beexpected given the decussation of cerebellar projections at the levelof the superior cerebellar peduncle prior to communicating with therest of the brain (Brodal, 1979).
Classical tract tracing and dissection procedures provided thebasis of cerebellar connectivity until recently (Kelly and Strick,2003; Middleton and Strick, 1994, 2001; O'Reilly et al., 2009;Schmahmann, 1991; Stoodley and Schmahmann, 2009), when

Fig. 1. Flowchart highlighting the processing steps involved in crbl-ICA. The first foursteps are the same as for the whbr-ICA.
2074 V.I. Dobromyslin et al. / NeuroImage 60 (2012) 2073–2085
neuroimaging was applied to the study of connective anatomy. Twoprominent techniques are diffusion tensor imaging (DTI), which pro-vides information about anatomical connectivity, and functional con-nectivity, which provides information about covariation in functionalbrain activity. DTI has provided great insights into the connectiveanatomy of the cerebellum due to the unique contrast within thisimage to detect major white matter fascicles. For example, Ramnani etal. (2006) used DTI to identify white matter tract projections from theprefrontal cortex to the pontine nuclei in the cortico-ponto-cerebellarsystem. Unfortunately, DTI data can be limited in areas with complexanatomy, such as with the crossing white matter fibers that are promi-nentwithin the cerebellum. Considering the relatively low resolution ofthe diffusion-weighted images, the exact fiber direction of the whitematter tracts at a single voxel can be difficult to resolve using themost common procedures. Functional connectivity methods, by focus-ing on the time course and covariation of the BOLD signal across theremote areas of the brain, can provide additional insights.
Recently, the analysis of the spatially distributed nature of regionalbrain activity, measured by blood oxygenation level dependent(BOLD) fMRI during rest, has proven to be a useful technique to discoverthe “functional connectivity” within and between various cortical andsub-cortical structures. Although for years the primary use of fMRI hasbeen studying stimulus driven or task-related activity, a rapidly accu-mulating body of literature has demonstrated the utility of restingstate neural activity fluctuations for understanding neural organization(Buckner et al., 2008). Coherent fluctuations in BOLD signal acrosslarge-scale spatial areas are interpreted to reflect communication acrossthose regions, potentially driven by sensory or motor activity, or toachieve a cognitive or behavioral goal (Biswal et al., 1995; Lowe et al.,1998). Maps of network activity assessed by functional connectivityanalysis have been demonstrated to have a basis in anatomical connec-tivity between associated regions (Krienen and Buckner, 2009; Smithet al., 2009; Sporns et al., 2002).
Current approaches to studying coherence of functional networksof cerebellar activity include seed-based correlational analyses andwhole-brain independent component analysis (ICA). Using a seed inthe anterior prefrontal cortex (aPFC), Vincent et al. (2008) identifiedlateral cerebellar involvement in the frontoparietal control system.This system, consisting of anterior prefrontal, dorsolateral prefrontal,dorsomedial superior frontal/anterior cingulate, anterior inferior pa-rietal lobule, and anterior insular cortex, was hypothesized to inte-grate information from the dorsal attention and hippocampal–cortical memory systems. Recent work has mapped the resting-stateconnectivity voxel-wise across the cerebellar cortex for a specifiedset of cortical regions or “masks” (O'Reilly et al., 2009). For example,O'Reilly et al. (2009) identified cortical masks covering prefrontal,motor, somatosensory, posterior parietal, visual and auditory cortices.This analysis revealed two primary zones in the cerebellum: a prima-ry sensory motor zone (lobules V–VII) and a supramodal zone(lobules VIIa, Crus I and Crus II). The latter zone contained overlappingfunctional connectivity maps for prefrontal and posterior–parietal cor-tex, suggesting that they could be involved in nonmotor, cognitive andaffective function. Buckner et al. (2011) present functional connectivityMRI (fcMRI) evidence demonstrating that almost half of the humancerebellum, including all of Crus I and Crus II, is functionally connectedto cerebral association areas involved in the default network (includingposterior cingulate, lateral temporal cortex, inferior parietal lobe andmedial prefrontal regions) and a cognitive control network (includingdorsolateral prefrontal cortex, rostral portion of inferior parietal cortexand a frontal midline area). They further indicate that there is a roughlylinear relationship between the extent of cerebral representation of anetwork and its size (volume) in the cerebellum.
The use of ICA to study resting state connectivity in the brain isgaining momentum (Damoiseaux et al., 2006; De Luca et al., 2006;Habas et al., 2009). Unlike the seed correlation-based approach, ICAis inherently exploratory and data-driven (Beckmann and Smith,
2005; Beckmann et al., 2005). In most cases, implementation of anICA consists of an iterative algorithm that attempts to explain theBOLD signal with a number of spatially distributed components andtheir characteristic time courses. Based on the idea that a randommixing results in a more Gaussian-like distribution, the ICA approxi-mates maximally non-Gaussian sources that when combined togeth-er explain the observed BOLD signal. In this way, the ICA addresses alimitation of a seed-based correlation analysis that concerns indepen-dence of the signals.
Using whole-brain ICA (whbr-ICA) procedures, a system resem-bling frontoparietal control system was split by Damoiseaux et al.(2006) into left and right hemisphere components (their Fig. 1C and1D), as would be expected given the anatomy. Habas et al. (2009),applied ICA to whole-brain resting state data from two independentdatasets to determine their contribution to a-priori defined connectiv-ity networks in the cortex. The cortical networks had been previouslyidentified as involved in such processes as executive control, episodicmemory, salience detection and sensorymotor function. Their analysisindicated an association between cerebellar Crus I and Crus II with theexecutive control networks (bilaterally), lobule VI with the saliencenetwork, and lobule IX with the default network. They concludedthat the largest portions of the most recently developed neocerebel-lum, Crus I and Crus II, are involved in the executive control networkand are therefore possibly implicated in complex cognitive function.
In the current study, we examined whether further elucidation ofcerebellar connectivity might be achieved using an ICA approach toresting state fMRI data using a “cerebellum only” approach. Consideringthat the cerebellum, on average, amounts to only about ten percent ofthe whole brain volume (Llinas et al., 2003), the sensitivity of ICA pro-cedures for detecting information within the cerebellum may be over-powered by cortical or nuisance signals throughout the rest of thebrain that may drive estimation across whole-brain networks. Thegoal of the current study was to expand on prior data driven approachfor the analysis by using ICA restricted to the cerebellum. Itwas hypoth-esized that the use of data from the cerebellumexclusively in ICAwouldprovide increased sensitivity for detecting cerebellar networks com-pared to whole-brain approaches. We examined the consistency ofthese cerebellar networks in two groups of 25 age-and sex-matchedparticipants. We explored consistency of the cerebellar networks by

2075V.I. Dobromyslin et al. / NeuroImage 60 (2012) 2073–2085
applying our analysis across the two independent samples, as well asthe associated activity in the rest of the brain. We hypothesized thatthe cerebellum-only approach would provide better sensitivity fordetecting cerebellar resting state networks (cRSN) by accounting forthe signal variations only in the cerebellum, as opposed to the signalsin the entire brain. Even though the ICA detection was originally re-stricted to the cerebellar volume, the correlated variation in the rest ofthe brain identified the cerebro-cerebellar functional interactions. Wefound that the use of the current procedure provided increased sensitivityas well as the potential identification of novel networks not availablethrough whole-brain analysis.
Materials and methods
Participants
The data for this study were obtained from the 1000 FunctionalConnectomes Project (http://www.nitrc.org/projects/fcon_1000/).All subjects in the present study (n=50, 29 women/21 men,age=21.5±2.9) were young healthy adults pseudo-randomlygrouped into two sex- and age- matched samples: Group 1(n=25, 15 women/10 men, age=21.6±3.2) and Group 2 (n=25,14 women/11 men, age=21.4±2.7), see Table 1. All imaging wasperformed on a 3 T scanner with anatomical scans acquired at1.2×1.2×1.2 mm voxel size and functional scans acquired at3.0×3.0×3.0 mm voxel size, TR=3 s.
Preprocessing
Data processing was carried out using tools from the FMRIB Soft-ware Library, FSL (Smith et al., 2004). The raw BOLD data was motioncorrected with Motion Correction using FMRIB's Linear Image Regis-tration Tool (MCFLIRT) (Jenkinson and Smith, 2001) and the brainwas extracted using Brain Extraction Tool (BET) (Smith, 2002). Ana-tomical labels in native space were created using the automated seg-mentation procedures distributed with the FreeSurfer data processingsuite (http://surfer.nmr.mgh.harvard.edu) to isolate cerebellum inthe structural scans (Fischl et al., 2002). Fig. 1 shows a detailed flow-chart highlighting the steps involved in processing the cerebellarBOLD signal.
Functional volumes were linearly registered to the MPRAGE datawith FLIRT (Jenkinson and Smith, 2001). The cerebellar anatomiclabel was applied as a mask to the BOLD volumes. The MPRAGE datawas then transformed to the MNI152 space with a nonlinear trans-form computed by FNIRT. While the whole brain non-linear registra-tion to the MNI space performed well on the major cortical regions, insome cases it proved sub-optimal for the cerebellar regions. To ac-count for significant subject variability in cerebellar registration, weperformed an additional linear co-registration for every subject'sMNI space cerebellum to a single template subject. Hence, throughoutthe current paper the results of running cerebellar analyses are dis-played on the individual MNI space template cerebellum. Registra-tions used a cerebellum only atlas for the cerebellum-only timeconcatenated group ICA (crbl-ICA), and whole brain atlas for whole-brain time concatenated group ICA (whbr-ICA). The same transformwas applied to the functional data to bring it into the standard space.
Table 1The “1000 Functional Connectomes” project data for current study.
Center PI N Subgroups Age Sex Handedness
Cambridge,MA, USA
Randy L.Buckner
50 Group 1,n=25
21.6±3.2 15 f/10 m 4 left handed
Group 2,n=25
21.4±2.7 14 f/11 m 4 left handed
Performing ICA on the cerebellum exclusively (crbl-ICA)For each replication group independently, group ICA was per-
formed for cerebellum-only data by time-concatenation of each parti-cipant's 4D data. Variance normalization (Beckmann and Smith,2004), spatial smoothing with a 5 mm filter, resampling to 2 mm spa-tial resolution, and temporal high-pass filtering with a cut-off fre-quency of 0.01 Hz were all applied as standard processing for ICA.The data decomposition into Independent Component (IC) mapswas achieved using the MELODIC software tool (Beckmann andSmith, 2005; Software Library (FSL); http://www.fmrib.ox.ac.uk/fsl).Instead of limiting the number of components to a fixed number,we used automatic estimation of the number of components availablewithin the MELODIC framework. To further test the consistency of thecrbl-ICA networks we performed a bootstrapping procedure where1000 random groups of 25 subjects each were generated from theoriginal 50 subject dataset and ran through the group crbl-ICA.
Performing ICA on the whole brain (whbr-ICA)Identical preprocessing and processing steps were used as for the
cerebellum-only approach, with the exception of performing thegroup time-concatenated ICA on the whole brain (i.e. the first foursteps outlined in Fig. 1). Network projections from crbl-ICA datawere compared to the whbr-ICA results.
Determining consistent cerebellar networksIdentification of consistent resting state networks within the cere-
bellum required three major steps: (1) matching the cerebellar net-works across the two groups following the cerebellum-only ICA(crbl-ICA), (2) elimination of noisy cerebro-cerebellar networksusing autocorrelation and frequency spectrum analysis (3) projectingthe time series from the crbl-ICA to the rest of the brain, and elimina-tion of noisy cRSNs based on the spatial distribution of the projectedcRSNs in the brain.
Cerebellum networks from ICA analysis were assessed for consis-tency by selecting the components across the two independentgroups with the greatest Jaccard index, indicating the greatest over-lap in voxels determined to be part of the group level IC networkthresholded at z>3 and binarized. The Jaccard index was defined as:
J A;Bð Þ ¼ A∩Bj jA∪Bj j ; ð1Þ
where A and B represent the matching group level ICs in Group 1 andGroup 2, respectively. J(A,B) ranged from 0.77 to 0.02 for all group-level matches across the two samples.
Due to the exploratory nature of ICA, it was expected that some ICswould represent physiological noise. Taking advantage of the low au-tocorrelation characteristic of white noise, we eliminated ICs withfirst-order auto-correlation of less than 0.30. This threshold conserva-tively separated a single matching noise IC component across the twogroups from the other IC's possessing higher autocorrelations, Fig. 2.
Additionally, we computed a metric that was derived from theratio of signal power within a low-frequency range (0.01 Hz–0.1 Hz)and signal power outside of that range; any ICs with this ratio not ex-ceeding 1.0 were discarded. While the exact frequency range of theresting state BOLD signal has not been defined, previously reportedfindings by other groups support the frequency range criteria usedin the present paper: 0.01–0.08 Hz (Cole et al., 2010) and b0.1 Hz(Zuo et al., 2010), although this procedure limits detection ofpotentially important networks outside of this range.
Cortical networks derived from cerebellum-only ICA and whole-brain ICAAccording to the probabilistic ICA model, the observed BOLD sig-
nal represents the linear mixture of hidden sources in the presenceof Gaussian noise. Within the general linear model (GLM) framework,the hidden sources correspond to the functional resting state
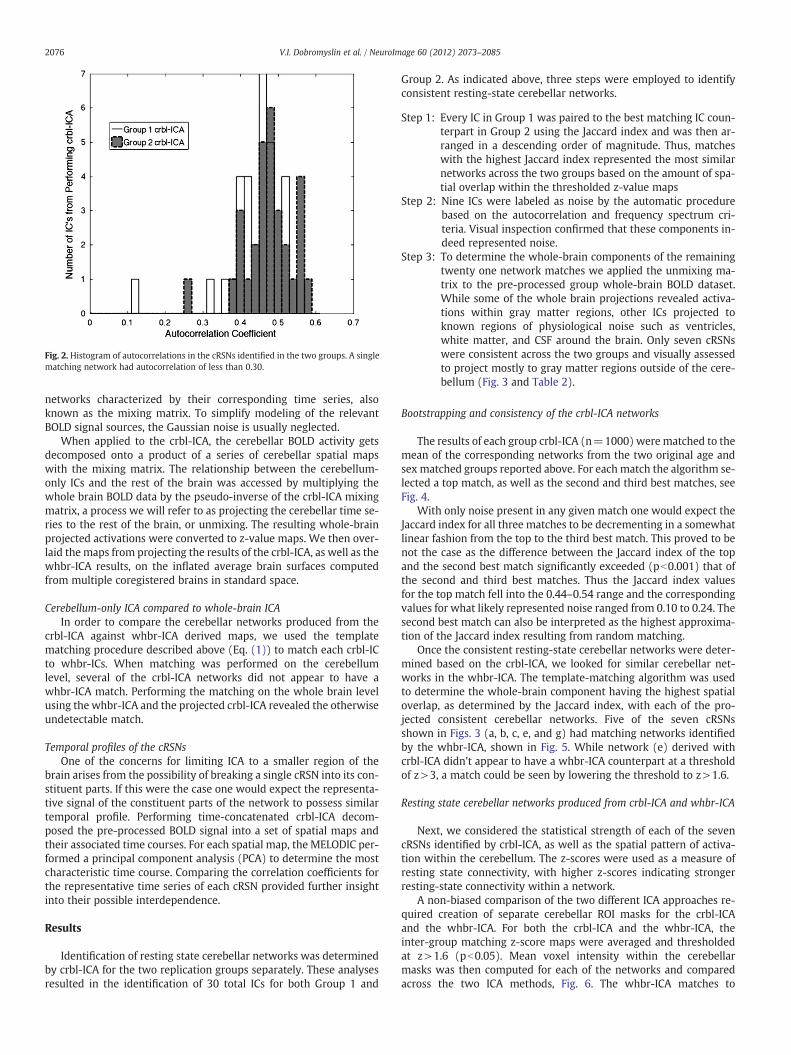
Fig. 2. Histogram of autocorrelations in the cRSNs identified in the two groups. A singlematching network had autocorrelation of less than 0.30.
2076 V.I. Dobromyslin et al. / NeuroImage 60 (2012) 2073–2085
networks characterized by their corresponding time series, alsoknown as the mixing matrix. To simplify modeling of the relevantBOLD signal sources, the Gaussian noise is usually neglected.
When applied to the crbl-ICA, the cerebellar BOLD activity getsdecomposed onto a product of a series of cerebellar spatial mapswith the mixing matrix. The relationship between the cerebellum-only ICs and the rest of the brain was accessed by multiplying thewhole brain BOLD data by the pseudo-inverse of the crbl-ICA mixingmatrix, a process we will refer to as projecting the cerebellar time se-ries to the rest of the brain, or unmixing. The resulting whole-brainprojected activations were converted to z-value maps. We then over-laid the maps from projecting the results of the crbl-ICA, as well as thewhbr-ICA results, on the inflated average brain surfaces computedfrom multiple coregistered brains in standard space.
Cerebellum-only ICA compared to whole-brain ICAIn order to compare the cerebellar networks produced from the
crbl-ICA against whbr-ICA derived maps, we used the templatematching procedure described above (Eq. (1)) to match each crbl-ICto whbr-ICs. When matching was performed on the cerebellumlevel, several of the crbl-ICA networks did not appear to have awhbr-ICA match. Performing the matching on the whole brain levelusing the whbr-ICA and the projected crbl-ICA revealed the otherwiseundetectable match.
Temporal profiles of the cRSNsOne of the concerns for limiting ICA to a smaller region of the
brain arises from the possibility of breaking a single cRSN into its con-stituent parts. If this were the case one would expect the representa-tive signal of the constituent parts of the network to possess similartemporal profile. Performing time-concatenated crbl-ICA decom-posed the pre-processed BOLD signal into a set of spatial maps andtheir associated time courses. For each spatial map, the MELODIC per-formed a principal component analysis (PCA) to determine the mostcharacteristic time course. Comparing the correlation coefficients forthe representative time series of each cRSN provided further insightinto their possible interdependence.
Results
Identification of resting state cerebellar networks was determinedby crbl-ICA for the two replication groups separately. These analysesresulted in the identification of 30 total ICs for both Group 1 and
Group 2. As indicated above, three steps were employed to identifyconsistent resting-state cerebellar networks.
Step 1: Every IC in Group 1 was paired to the best matching IC coun-terpart in Group 2 using the Jaccard index and was then ar-ranged in a descending order of magnitude. Thus, matcheswith the highest Jaccard index represented the most similarnetworks across the two groups based on the amount of spa-tial overlap within the thresholded z-value maps
Step 2: Nine ICs were labeled as noise by the automatic procedurebased on the autocorrelation and frequency spectrum cri-teria. Visual inspection confirmed that these components in-deed represented noise.
Step 3: To determine the whole-brain components of the remainingtwenty one network matches we applied the unmixing ma-trix to the pre-processed group whole-brain BOLD dataset.While some of the whole brain projections revealed activa-tions within gray matter regions, other ICs projected toknown regions of physiological noise such as ventricles,white matter, and CSF around the brain. Only seven cRSNswere consistent across the two groups and visually assessedto project mostly to gray matter regions outside of the cere-bellum (Fig. 3 and Table 2).
Bootstrapping and consistency of the crbl-ICA networks
The results of each group crbl-ICA (n=1000) were matched to themean of the corresponding networks from the two original age andsex matched groups reported above. For each match the algorithm se-lected a top match, as well as the second and third best matches, seeFig. 4.
With only noise present in any given match one would expect theJaccard index for all three matches to be decrementing in a somewhatlinear fashion from the top to the third best match. This proved to benot the case as the difference between the Jaccard index of the topand the second best match significantly exceeded (pb0.001) that ofthe second and third best matches. Thus the Jaccard index valuesfor the top match fell into the 0.44–0.54 range and the correspondingvalues for what likely represented noise ranged from 0.10 to 0.24. Thesecond best match can also be interpreted as the highest approxima-tion of the Jaccard index resulting from random matching.
Once the consistent resting-state cerebellar networks were deter-mined based on the crbl-ICA, we looked for similar cerebellar net-works in the whbr-ICA. The template-matching algorithm was usedto determine the whole-brain component having the highest spatialoverlap, as determined by the Jaccard index, with each of the pro-jected consistent cerebellar networks. Five of the seven cRSNsshown in Figs. 3 (a, b, c, e, and g) had matching networks identifiedby the whbr-ICA, shown in Fig. 5. While network (e) derived withcrbl-ICA didn't appear to have a whbr-ICA counterpart at a thresholdof z>3, a match could be seen by lowering the threshold to z>1.6.
Resting state cerebellar networks produced from crbl-ICA and whbr-ICA
Next, we considered the statistical strength of each of the sevencRSNs identified by crbl-ICA, as well as the spatial pattern of activa-tion within the cerebellum. The z-scores were used as a measure ofresting state connectivity, with higher z-scores indicating strongerresting-state connectivity within a network.
A non-biased comparison of the two different ICA approaches re-quired creation of separate cerebellar ROI masks for the crbl-ICAand the whbr-ICA. For both the crbl-ICA and the whbr-ICA, theinter-group matching z-score maps were averaged and thresholdedat z>1.6 (pb0.05). Mean voxel intensity within the cerebellarmasks was then computed for each of the networks and comparedacross the two ICA methods, Fig. 6. The whbr-ICA matches to

Fig. 3. Consistent group-level independent components in the cerebellum for replication Group 1 and Group 2 using crbl-ICA. Panels (a1–g1) display Group 1 cerebellar networks.Panels (a2–g2) display matching Group 2 cerebellar networks. Maps are thresholded at z>3 (equivalent of pb0.01 uncorrected) and presented with the left cerebellar hemisphereto the right of the image. All data is shown in standard space. Networks are labeled with correspondence to the letters in Table 2.
2077V.I. Dobromyslin et al. / NeuroImage 60 (2012) 2073–2085
networks (d) and (f) were not used in Fig. 6 as they failed to showinter-group consistency.
We used the spatially unbiased atlas template of the cerebellumand brainstem (SUIT) (Diedrichsen et al., 2009) to divide the activevoxels into region specific bins (see Table 2). This step required an ad-ditional linear registration from the MNI space to the SUIT.
Although the cerebellar networks showed regional overlap, therewere differences in the number of supra-threshold voxels betweenthe crbl-ICA and whbr-ICA. For example, Fig. 7, Network (a) showsthat in the most consistent cRSN, which encompassed primarilyCrus I and II, the crbl-ICA detected approximately 3000 more voxelsin the left cerebellar hemisphere than did the whbr-ICA. These voxelswere in SUIT space and had a spatial resolution of 1.0×1.0×1.0 mm,resulting from up-sampling the original fMRI data to match the SUITtemplate. In other networks, for example Fig. 7, Network (c) and
Table 2Seven cerebellar regions corresponding to consistent resting-state networks, as deter-mined by cerebellum-only ICA. Regional delineations were determined based on theSUITE probabilistic atlas.
Network Right hemisphere Left hemisphere Vermis
a Crus I and Crus II VI, Crus I, Crus II, and VIIb –
b V and VI I–IV, V, and VI VIc Crus I, Crus II, VIIb, and IX – –
d V and VI V and VI –
e VIIIa, VIIIb, and IX VIIIb, and IX –
f V and VI I–IV, V, and VI VIg – Crus I, Crus II, VI, VIIb –
Fig. 7, Network (g), the whbr-ICA detected more active voxels thanthe crbl-ICA, suggesting that, overall, the whbr-ICA networks hadgreater activation compared to crbl-ICA networks but were alsomore diffuse and less regionally specific. In the two of the seven
Fig. 4. Mean Jaccard index and standard error were computed for performing a boot-strapping group crbl-ICA (n=1000) and subsequent template matching. Top matchesproved to be significantly more accurate (pb0.001) than what could be expected byrandom chance.

Fig. 5. Consistent group-level independent components in the cerebellum identified with the crbl-ICA and the whbr-ICA in Groups 1 and 2. Panels a1-g1 represent cerebellar ICsfrom Group 1 and panels a2-g2 correspond to matching cerebellar networks from Group 2. For every panel the top row shows the results from running the crbl-ICA and the bottomrow corresponds to the results from the whbr-ICA.
2078 V.I. Dobromyslin et al. / NeuroImage 60 (2012) 2073–2085

Fig. 6.Mean z-value intensity within the cerebellar networks identified using the crbl-ICAand whbr-ICA. Networks a–g here, represent the same networks as shown in Fig. 3. Theresults from running the crbl-ICA are shown in dark colors, while the whbr-ICA resultsare shown in lighter colors.
2079V.I. Dobromyslin et al. / NeuroImage 60 (2012) 2073–2085
networks, (d) and (f), whbr-ICA failed to consistently detect anycerebellar counterpart to crbl-ICA identified networks.
In summary, both crbl-ICA and whbr-ICA produced varying num-ber of active voxels within the matching networks. With a thresholdof z>3 (pb0.001), the seven cRSNs identified in the current studywith the crbl-ICA accounted for 43.9% of the cerebellar gray matterand 30.2% of the cerebellar white matter. A less conservative thresh-old of z>1.6 (pb0.05) dilated areas covered by the cerebellar net-works to 64.7% of gray matter and 52.7% of white matter.
Using a threshold of z>3 (pb0.001), the five cerebellar networksidentified with the whbr-ICA accounted for 34.0% of the cerebellargray matter and 12.4% of the cerebellar white matter. Decreasingthe threshold to z>1.6 (pb0.05), resulted in accounting for the57.3% of gray matter voxels and 28.5% of white matter voxels in thecerebellum.
Comparison of cerebellar-cortical networks derived from crbl-and whbr-ICA
In Fig. 8 we compare the cortical connectivity derived by the crbl-ICA and whbr-ICA approaches to show the spatial similarity betweenthe two methods and to demonstrate the reproducibility across thetwo replication groups. However, due to the different techniquesemployed, the apparent differences in activation magnitude maynot reflect true differences. We further investigated cortical involve-ment with the cRSNs by averaging the projected cRSNs and perform-ing cortical segmentation with the cortical labels supplied withFreeSurfer, Table 3. As an intermediate step, the functional data hadto be re-sampled into the FreeSurfer average template space. We onlyincluded regions spatially exceeding 216 mm3, or a cube of tissue2×2×2 functional voxels in size. The within network connectivitycould roughly be characterized by the volume of each region as wellas its mean z-value displayed in Table 3. For example, regions withhigher mean z-values could be interpreted as stronger sources of theobserved functional connectivity.
Overall, we found matching whbr-ICA networks for six of theseven crblr-ICA projected networks. However, in the case of network(d) as identified with the crbl-ICA projected methodology, we did notobserve a corresponding cortical network using the whbr-ICA ap-proach with a threshold of z>3.
It is also evident in Fig. 8 that using the whbr-ICA approach weidentified a cortical network (f) that does not appear to have a cere-bellar component, as we did not find a match for crbl-ICA network(f). This did not appear to be simply due to a threshold limitation
because, as shown in Fig. 9, neither Group 1 nor Group 2 showedclear evidence of a matching whbr-ICA network (f).
We examined connectivity of the cRSNs with pontine and red nucleiby visually inspecting the mean of the matching cortical projectionsfrom the two groups. Out of the seven cRSNs only network (b) appearedto have activation in the red nucleus. The involvement of the red nucleusas the relay for transferring cerebellar output suggests that network(b) plays a role in the feedback loop.
Temporal profiles of the cRSNs
The seven cRSNs identified in the current analysis showed varyingdegree of correlation as seen in Table 4. While none of the cRSNsshowed strong temporal correlation, networks (a) and (b) wereeach weakly correlated to several networks. Network (a) positivelycorrelated with networks (c) and (g), and negatively with network(b). On the other hand network (b) positively correlated with net-work (d) and negatively correlated with network (c).
Discussion
The current study applied independent component analysis pro-cedures to MRI resting state functional data derived exclusivelyfrom the cerebellum to identify consistent resting-state cerebellarnetworks and their functional connectivity with the rest of thebrain. In addition, we investigated, the extent to which sensitivityin detecting cerebellum functional connectivity was increased usinga cerebellum only ICA approach. The existence of resting statecerebro-cerebellar connectivity was confirmed by finding similar net-works across the two independent samples, both with regard to activ-ity within cerebellum as well as to the remainder of the brain. Thecerebellum-only procedure produced seven resting state networkswithin cerebellum that were reliable across the two independentgroups. Five of the seven networks were apparent using the whole-brain analysis (networks a, b, c, e, and g). These findings suggestthat the novel procedure may be an important step towards under-standing the functional neuroanatomy of the cerebellum and its con-tribution to behavior and cognition in health and disease.
Consistent resting state-cerebellar networks in the current study
This study identified sevendistinct resting-state cerebellar networksusing cerebellum-only ICA shown in Fig. 3. The identified networkswere spatially localized to a small set of cerebellar regions, as confirmedby the probabilistic cerebellar atlas (Table 2).
Network (a)Network (a) encompassed primarily Crus I and Crus II, bilaterally,
with greater activation in left cerebellum hemisphere that extendedto VI and VIIb. In a previous study, Fransson (2005) observed rightcerebellar involvement in the default mode network (Figure 4 in hispaper). His finding is somewhat consistent with the network (a) inthe present study. One of the key differences is the bilateral cerebellarinvolvement in the default mode network identified in the presentstudy and in Buckner et al. (2011) but not in the Fransson (2005)study.
Krienen and Buckner (2009) have identified prefrontal cortex(PFC) connectivity with the Crus I cerebellar region by placing theseed in the cerebellum and computing the correlation map with therest of the brain. Their approach is limited by the size and shape ofthe seed, as well as its placement. In the comparison of the default-mode network (DMN) connectivity identified by performing seed-based correlation analysis at different seed voxel locations proposedin the literature, Cole et al. (2010) observed large non-overlappingactivation regions varying based on the placement of the seed. Intheir Figure 2, Cole et al. (2010) showed that the ICA-derived DMN

Fig. 7. Mean number of active voxels detected within the cerebellar networks differed between the crbl-ICA and the whbr-ICA approaches. Networks (a), (c) and (g) show varyingregion specific cerebellar activity as detected by the crbl-ICA and the whbr-ICA.
2080 V.I. Dobromyslin et al. / NeuroImage 60 (2012) 2073–2085
had highest mean spatial correlation with the other three estimates ofthe DMN, and thus benefited from the lack of bias inherent in the seedbased analyses. However, recent whole brain seed analysis of thecortex may reduce such limitations (Buckner et al., 2011).
To the best of our knowledge, the exact cerebro-cerebellarconnectivity revealed as network (a) here has not been reportedbefore in the functional neuroimaging literature.
Network (b)Network (b) covered cerebellar lobules V and VI bilaterally, left
cerebellar lobules I–IV, as well as vermis region VI.On the cerebellar level, the network (b) shared similar spatial
features with the sensorimotor network in Habas et al. (2009; theirFig. 2). The similarity did not extend to the cerebral regions, as the
network (b) involved primarily occipital cortex, superior parietal andto a lesser degree precentral and postcentral cortices. The sensorimotornetwork discussed in Habas et al. (2009) covered mostly sensorimotorcortex, premotor cortex, supplementary motor area, anterior cingulatecortex, temporal cortex, insula, and to a lesser degree the occipitalcortex.
Cerebellar bilateral activation in regions V and VI corresponded topart of the visual network identified by O'Reilly et al. (2009). Activityin the lower part of the cerebellar visual network identified in O'Reillyet al. was not replicated in the present study. Krienen and Buckner(2009) and Buckner et al. (2011) did not detect cerebellar connectiv-ity with primary auditory and visual cortices. Also of note, althoughnetwork (b) in the current study shows strong overall connectivitywith regions within occipital cortex, it is highly likely that these

Fig. 8. Comparison of the unmixing results from crbl-ICA to the whbr-ICA. Each cerebellar map shown in the first column represents a thresholded mean of the matching networksfrom Group 1 and Group 2. The second and third columns show the projected components of the crbl-ICA in Group 1. Similarly, columns 4–5 show the projected components of thecrbl-ICA in Group 2. Activation maps in the columns 6–9 correspond to the results of running the whbr-ICA on both Group 1 and Group 2, and were matched to the crbl-ICA results.There was not a suitable cortical match for the crbl-ICA component (d) from the whbr-ICA analysis, suggesting that this network may be uniquely visible using the crbl-only ICAapproach. Whole brain activations are shown on the inflated average surface of multiple brains co-registered in standard space, available as part of the FreeSurfer data processingsuite (http://surfer.nmr.mgh.harvard.edu).
2081V.I. Dobromyslin et al. / NeuroImage 60 (2012) 2073–2085
associated regions are, to some degree, the overlapping signal fromthe immediately adjacent occipital cortex, as described by Buckneret al. (2011). Future high resolution studies of the cerebellum will benecessary to tease apart these effects.
The spatial distribution of network (b) on the cortical level some-what resembled the networks previously identified by Beckmannet al. (2005), Damoiseaux et al. (2006; their Figure 2E), andZuo et al. (2010; their Figure 1E). Comparison on the cerebellarlevel with the above mentioned studies could not be performed as
they did not discuss any cerebellar activation for the network ofinterest.
Network (c) and network (g)The cerebellar areas identified as network (c) were limited to the
right cerebellar hemisphere, and consisted primarily of Crus I–II, andto a lesser degree, lobules VIIb and IX. The cerebellar areas identifiedas network (g) were mostly limited to the left cerebellar hemisphere,and consisted of Crus I–II, and lobules VI and VIIB.

Table 3Cortical areas involved in the cRSNs and identified by projecting the crbl-ICA time series onto the whole brain BOLD data.
Left cortical hemisphere Right cortical hemisphere
Anatomicallabel
Activevolumemm3
Mean z-value Anatomicallabel
Activevolumemm3
Meanz-value
Network (a) Inf. parietal 562 2.21 Inf. parietal 400 2.22Isthmuscingulate
331 2.22 Isthmus cingulate 569 2.54
Med. orbitofrontal 299 1.94 Med. orbitofrontal 861 2.08Mid. temporal 1104 1.91 Mid. temporal 2407 2.45Parsorbitalis 317 2.28 Parsorbitalis 328 2.19Precuneus 518 2.15 Precuneus 1300 2.39Ros. ant.cingulate
327 2.09 Lat. obitofrontal 439 1.94
Ros. mid.frontal
418 2.05 Ros. mid. frontal 910 2.45
Sup. frontal 4109 2.23 Sup. frontal 7788 2.67Sup. temporal 267 2.15 Sup. temporal 731 2.21
Supramarginal 1215 2.93Network (b) Cuneus 1517 2.63 Cuneus 1785 3.45
Fusiform 387 2.12 Fusiform 680 2.47Inf. parietal 445 1.98 Inf. parietal 491 1.80Lat. occipital 675 1.91 Precuneus 650 2.22Lingual 3412 3.06 Lingual 3434 3.28Pericalcarine 1288 2.98 Pericalcarine 1192 2.67Postcentral 515 2.23 Postcentral 706 2.47Precentral 216 1.96 Precentral 590 2.04Sup. parietal 1590 2.72 Sup. parietal 2136 2.89
Supramarginal 545 2.14Network (c) Cau. mid. frontal 1441 2.35 Left-hippocampus 257 1.77
Inf. parietal 2576 3.03 Inf. parietal 629 2.45Inf. temporal 519 1.89 Pos. cingulate cortex 244 2.08Isthmus cingulate 1231 2.87 Isthmus cingulate 1229 2.44Med. orbitofrontal 2409 2.32 Med. orbitofrontal 934 2.02Mid. temporal 764 1.90 Lateraloccipital 291 2.03Precuneus 1573 2.44 Precuneus 1472 2.32Ros. ant. cingulate 268 1.87Ros. mid. frontal 2534 2.32Sup. frontal 5970 2.70 Sup. frontal 894 2.04Frontalpole 450 2.23
Network (d) Hippocampus 508 1.93 Hippocampus 522 1.94Amygdala 523 2.25 Amygdala 423 2.14Cuneus 267 2.11Entorhinal 459 2.05 Entorhinal 347 1.92Fusiform 3031 2.54 Fusiform 1174 2.24Inf. parietal 1449 2.49 Inf. parietal 697 1.89Inf. temporal 1129 2.10 Inf. temporal 841 1.99Isthmus cingulate 482 2.15 Isthmus cingulate 528 2.38Lat. occipital 1098 2.03 Lat. occipital 314 1.84Lat. orbitofrontal 246 1.74Med. orbitofrontal 1864 2.14 Med. orbitofrontal 1071 2.01Mid. temporal 340 1.89Parahippocampal 337 1.95 Parahippocampal 331 1.96Postcentral 357 1.99 Postcentral 217 1.80Precuneus 1162 2.17 Precuneus 954 2.22Sup. frontal 1224 2.14 Precentral 234 1.90Sup. parietal 1459 2.47 Temporalpole 456 2.02Frontalpole 433 2.07
Network (e) Inf. parietal 606 2.06 Inf. parietal 410 1.83Lingual 817 2.04 Lingual 843 2.03Pericalcarine 251 1.84 Pericalcarine 547 1.91Precuneus 759 2.56 Precuneus 1382 2.67Ros. mid. frontal 637 1.90 Ros. mid. frontal 261 1.93Sup. frontal 977 1.97 Sup. frontal 1101 1.85Sup. parietal 1345 2.52 Sup. parietal 2197 2.64
Cuneus 383 1.80Isthmus cingulate 230 1.83Paracentral 242 2.35
Network (f) Postcentral 3573 2.24 Postcentral 3041 2.25Precentral 2879 2.32 Precentral 3626 2.45Sup. frontal 1693 2.23 Sup. frontal 1023 1.92Sup. temporal 611 1.79 Sup. temporal 785 2.26Supramarginal 349 1.82 Sup. parietal 342 2.40Insula 573 1.87
Network (g) Inf. parietal 1022 1.98 Inf. parietal 1804 3.29Ros. mid. frontal 606 1.99 Ros. mid. frontal 3520 2.27
Pos. cingulate cortex 266 2.07
2082 V.I. Dobromyslin et al. / NeuroImage 60 (2012) 2073–2085

Table 3 (continued)
Left cortical hemisphere Right cortical hemisphere
Anatomicallabel
Activevolumemm3
Mean z-value Anatomicallabel
Activevolumemm3
Meanz-value
Cau. mid. frontal 1212 2.07Inf. temporal 287 2.09Isthmus cingulate 382 1.90Parsorbitalis 312 2.73Pos. cingulate 399 1.96Sup. frontal 902 1.92Supramarginal 1686 2.70
2083V.I. Dobromyslin et al. / NeuroImage 60 (2012) 2073–2085
Cerebro-cerebellar connectivity reported as networks (c) and(g) here was previously identified in Krienen and Buckner (2009)by placing a seed in the right dorsolateral prefrontal cortex and leftdorsolateral prefrontal cortex respectively. Parts of these two net-works were identified in Beckmann et al. (2005) as dorsal visualstream. Damoiseaux et al. (2006) identified similar networks (theirFigure 2C and Figure 2D) using tensor probabilistic ICA. Networks(c) and (g) reported in the present paper strongly resembled theright executive control network (ECN) and left ECN respectively,reported in Habas et al. (2009). Network (g) reported in the presentpapermatched the parietal network involved in cognition and languageidentified in Zuo et al. (2010; their IC 07, Figure 2). Importantly, as de-scribed by Krienen and Buckner (2009), these networks were latera-lized and projected to the contra-lateral associated cortical regions.
Network (d)The spatial distribution of network (d) encompassed bilateral
cerebellar lobules V and VI.Network (d) links bilateral cerebellar regions V and IV, as well as
vermis region VI to parietal, frontal, temporal, and occipital lobes.Judging by the spatial extent and mean z-value, the following regionsappear to drive the cerebro-cerebellar connectivity of the network(d): bilateral fusiform gyri, inferior parietal cortices, inferior temporalcortices, medial orbitofrontal cortices, precuneus, and left lateral oc-cipital cortex, superior frontal cortex, and left superior parietal cortex.To the best of our knowledge, cerebro-cerebellar connectivity identi-fied by network (d) has not been reported in the fMRI literature. Ifthis connectivity proves to be neurologically relevant then it wouldfurther support cerebellar involvement in higher order cognitivefunction.
Network (e)Cerebellar areas covered by network (e) consisted of bilateral lobules
VIIIb and IX in addition to a minor activation of the right lobule VIIIa.The connectivity between the cerebellar lobule IX bilaterally with
the dorsomedial prefrontal cortex and the posterior cingulate cortex
Fig. 9. Crbl-ICA and whbr-ICA were performed and the projected cortical network forthe crbl-ICA was matched to the corresponding whbr-ICA. In Group 1, the whbr-ICAcerebellar activations could only be detected when decreasing the threshold of the net-work to a low value. The whbr-ICA failed to detect any matching cerebellar activity inGroup 2. With the crbl-ICA the network described above was identified in both Group 1and Group 2.
was previously reported by Habas et al. (2009) and Damoiseauxet al. (2006) as part of the default mode network. In the currentstudy, the cerebellar component of network (e) also included lobuleVIIIb bilaterally and a minor activation in the right hemisphere of lobuleVIIIa. On the other hand,we did notfind any cerebellar lobule VIIb activityreported in Habas et al. (2009).
The cortical part of network (e) overlapped significantly with thecortical part of network (a). The similarity between the two networkspoints to the possibility of separate cerebellar networks projecting tothe same cortical regions involved in the “default mode” system, yetperforming different tasks.While cerebellummay participate in several“default mode” subsystems, it is likely that it has a varying strength ofparticipation in each. The current approach intrinsically focuses ondetecting the most consistent cerebellar networks and therefore ismore likely to detect the strongest cerebellar contribution to therelevant “default mode” subsystem.
Network (f)Network (f) consisted of bilateral cerebellar lobules V and VI, and
included left lobules I–VI.Habas et al. (2009) reported connectivity of the cerebellar region
VI with the sensorimotor areas in the brain. In the current study, weidentified that left and right cerebellar region V, as well as vermis re-gion VI were part of the sensorimotor network. We speculate that thistype of increased sensitivity may represent an advantage of the crbl-ICA over the whbr-ICA. However, the utility of these procedures fordefining functional and anatomical principles of the cerebellum isyet to be elucidated and the use of these procedures to understanddiseases that affect the cerebellum such as alcoholism is ongoing.
The combined networks occupied 43.9–64.7% of the cerebellargray matter and 30.2–52.7% of the cerebellar white matter, dependingon setting the threshold either to zb3 (pb0.001) or to 1.6bz(pb0.05), respectively. Topography of the cerebellar networks fol-lowed a previously observed separation into medial and lateralareas and a portion of these networks showed laterality. Four of theseven networks, (b), (d), (e) and (f), mainly consisted of the medialregions and the other three networks, (a), (c), and (g), were mainlydistributed in the lateral cerebellar regions. With the exception ofthe left ECN and right ECN, the rest of the cRSNs were bilateral.
Table 4Time course correlation coefficients for the seven crbl-ICA networks. Five strongestcorrelation coefficients are shown in gray.

2084 V.I. Dobromyslin et al. / NeuroImage 60 (2012) 2073–2085
Confirmation of previously identified functional connectivity networks
The cerebro-cerebellar connectivity identified by network (a) sup-ports previous findings by O'Reilly et al. (2009) that the Crus I and theCrus II cerebellar regions projected to the prefrontal and parietalareas of the brain. However, the exact pattern of cerebro-cerebellarconnectivity in network (a), reminiscent of the “default mode”, hasnot been reported previously.
Networks (b) and (f) in the current study support the previouslyreported connectivity between the cerebellar regions V and VI, withthe visual and the sensorimotor cortices (O'Reilly et al., 2009).While the template matching algorithm found a whbr-ICA match tothe projection of the network shown in Fig. 8f, the matching whbr-IC did not have any voxels in the cerebellum surviving 3bzb10. Theeffect of lowering the threshold is discussed shortly.
We visually inspected the output of the crbl-ICA for any networksmatching the five cRSNs (sensorimotor network, default mode net-work, left ECN, right ECN, and the salience network) mentioned byHabas et al. (2009). Four of the five networks that they reportedwere identified in the current study: (c) right ECN, (e) default modenetwork (f) sensorimotor network, and (g) left ECN, Fig. 8. To confirmthe whbr-ICA match to the crbl-ICA network (e), we loweredthe threshold from z>3 (pb0.001) to z>1.6 (pb0.05). With thewhbr-ICA, the sensorimotor cerebellar network was identified inGroup 1 after lowering the threshold to 1.6bzb5, as seen in Fig. 9.No sensorimotor cerebellar network was identified in Group 2 usingthe whbr-ICA. Possible factors that may account for the difference infindings include the following procedures performed by Habas et al.and not performed in the present study: low-pass filtering at 2.8 s,fixing the number of group-level ICs to 30, and including only righthanded subjects. Also, in the present study we focused on the identi-fication of the consistent cRSNs between the two age and sexmatched subject groups, without considering the subject level ICAresults.
Cerebellum-only ICA vs. whole-brain ICA
One of the key features of the current study was that the analysiscentered on the cerebellum. Overall, whole brain and cerebellar ICAproduced similar networks. When compared with the whole brainprocedure, the cerebellum only procedure generally demonstratedstronger connectivity within the cerebellum. In addition, a portionof the cerebellar only networks were not apparent in the wholebrain analysis.
We compared this technique to whole brain procedures applied inprior work and found an obvious trade-off between the cerebellumand the cortex. While the cerebellar networks identified with thecrbl-ICA were in general visually similar to the results of the whbr-ICA, a closer analysis revealed some detectable and quantifiable dif-ferences as seen in Figs. 6 and 7. The most accurate replication ofthe crbl-ICA with the whbr-ICA was observed in network (a), Fig. 7.The mean z-value intensity within the cerebellar networks indicatedthe relative connectivity strength of the detected networks. In mostcases, the connectivity within the networks detected by the crbl-ICAexceeded that of the networks detected by the whbr-ICA, Fig. 6.Two of the networks, (d) and (f), detected by the crbl-ICA failed tobe consistently identified by the whbr-ICA.
Of particular interest are the two networks (a) and (c) where thecrbl-ICA detected more voxels than the whole-brain ICA, Fig. 7, Net-work (a), bottom panel, and vice versa, Fig. 7, Network (c). In theCrus II region of the left cerebellar hemisphere of network (a), crbl-ICA detected more than 3000 active voxels than the whbr-ICA. Con-sidering the 1.0×1.0×1.0 mm spatial resolution of the SUIT template,this difference translates into a cube of cerebellar tissue with a sidegreater than 14 mm. Even more puzzling evidence comes from thedifference of more than 6000 active voxels detected by the whbr-
ICA in the right Crus I region of network (c) in Group 2, and notdetected by the crbl-ICA. This difference translates into a cube of cer-ebellar tissue with ~18 mm side. The fact that in one case crbl-ICAdetected more cerebellar activity than the whbr-ICA and in theother case less, excludes the possibility of threshold bias accountingfor such a different result. The correspondence of the cerebellar net-works detected by the two methods is also confirmed by the notice-ably similar region-specific pattern of cerebellar activity seen inFigs. 5a and c. When projected to the rest of the brain, these two cer-ebellar networks also match the results from the whbr-ICA as seen inFigs. 8a and c, further ruling out the possibility that the cerebellum-only ICs were not properly matched to the whole-brain ICs. Thebasic interpretation here is that the two procedures produce differentresults, and further work will need to expand on the differentialbenefits of each technique.
Neuroanatomic significance
Most of the cerebro-cerebellar connectivity described in the cur-rent study is in agreement with earlier neuroanatomical literature.Connectivity of the cerebellar lobules IV and VI with motor cortexand the cerebellar Crus II with dorsolateral prefrontal cortex hasbeen previously reported using transneural transport of neurotropicviruses by Kelly and Strick (2003). While this doesn't necessarilyimply the exact topographic correspondence with networks (f), (c),and (g) in the current study, it nevertheless provides potential neuro-anatomic basis for such connections. Our findings only partially over-lap with previous report from Schmahmann (1991). Their approachinvolved injecting tritiated amino acids into lateral, medial, and ven-tral prefrontal cortices of 15 rhesus monkeys and thus tracing thecerebro-ponto-cerebellar neuronal pathway. Networks (c) and (g)in the current study correspond well with the dorsolateral andmedial prefrontal cortex connectivity with the pons reported bySchmahmann (1991). However we found cerebellar connectivitywith orbitofrontal cortex and the adjacent ventral prefrontal cortexidentified in the current study as networks (d) and (e) and notreported by Schmahmann (1991). Projections to the basis pontisfrom the superior temporal region identified by Schmahmann(1991) support temporal lobe counterparts of the crbl-ICA networks(a), (c), (d), (f) and (g) in the current study. Earlier neuroanatomicalstudies have also identified cerebellar connectivity with various re-gions of the parietal cortex (May and Andersen, 1986). In the currentstudy we confirmed parietal region contributions to whole brain pro-jections of all seven crbl-ICA networks. The existence of such extensiveinter-connectivity emphasizes the variety of functions the cerebellummay participate in, ranging frommotor planning to higher order cogni-tive tasks. Additional evidence for the connectivity of the cerebellarflocculonodular lobe with the cingulate and insular cortices comesfrom the virus tracing studies in rodents (Kaufman et al., 1996). Similarconnectivity was identified as network (e) in the current study, span-ning large areas of the posterior cingulate cortex and a small patch ofthe insular cortex. Unlike Kaufman et al. (1996) the connectivity of net-work (e) also implicates dorsomedial prefrontal cortex. These resultsfurther hint at cerebellar involvement with the limbic system of thebrain.
The vermis has been previously reported to be involved in saccadesand pursuit initiation (Kheradmand and Zee, 2011). Networks (b) and(f) in the current study showed functional connectivity in the lobule(VI) of the vermis, with a limitation that network (b) was likely dueto partial volume effects from the occipital cortex. These two networksprojected primarily to the occipital lobe and the sensorimotor cortex re-spectively, possibly implicating them in ocular motor control. Both net-work (b) and (f) also spanned small subregions of the cingulate cortexthus providing further evidence for the cerebellar vermial involvementin limbic functions.

2085V.I. Dobromyslin et al. / NeuroImage 60 (2012) 2073–2085
Projecting cerebellar networks onto the rest of the brain vs. whole-brain ICA
Performing the unmixing on the whole-brain fMRI data usingthe time course information from the distinct cerebellar networksidentified with cerebellum-only ICA achieved three goals: 1) tracingcerebro-cerebellar connectivity, and, 2) showing the uniqueness ofthe cerebellar networks 3) confirmed previously published findingsregarding cerebro-cerebellar connectivity.
The absence of strong correlation between the cRSNs providedfurther evidence that they were functionally distinct from eachother. This finding supports the notion that while the cortical projec-tions of some cRSNs overlap spatially (i.e., networks (c), (d), and (e)),they potentially serve a different purpose.
Conclusions
Our primary objective in this study was to explore cerebro-cerebellar resting state functional connectivity using a novelmethod fo-cused on functional coherence limited to the cerebellum. The resultsshow that the consistent cerebellar networks identified in the presentstudy provide more unique information than the cerebellar networksidentified with the more traditional whbr-ICA and seed based analyses.We speculate that the proposed crbl-ICA provides a gain in temporaland spatial sensitivity leading to a better detection of functional connec-tivity across the brain that could be useful in detecting conditions thatpreferentially affect the cerebellum such as alcoholism.
Acknowledgments
This work was supported by grants from the National Institutes ofHealth, including National Institute of Alcoholism and Alcohol Abuse(R01 14205 to RM); National Institute of Nursing Research (R01NR 010827 to DS); National Institute of Neurological Disease andStroke (K23NS062148 to EL) and the National Institute on Aging(K23AG034258 to CF). Additionally, this work was supported bythe Veterans Administration Merit Service Award to RM and by theVA Rehabilitation Research and Development Service TBI Center ofExcellence to RM and WM.
References
1000 Functional Connectomes Project http://www.nitrc.org/projects/fcon_1000/.Allen, G., Courchesne, E., 1998. The cerebellum and non-motor function: clinical
implications. Mol. Psychiatry 3, 207–210.Beckmann, C.F., Smith, S.M., 2004. Probabilistic independent component analysis for func-
tional magnetic resonance imaging. IEEE Trans. on Medical Imaging 23 (2), 137–152.Beckmann, C.F., Smith, S.M., 2005. Tensorial extensions of independent component
analysis for multisubject FMRI analysis. NeuroImage 25, 294–311.Beckmann, C.F., DeLuca, M., Devlin, J.T., Smith, S.M., 2005. Investigations into resting-state
connectivity using independent component analysis. Philos. Trans. R. Soc. Lond. BBiol. Sci. 360, 1001–1013.
Biswal, B., Yetkin, F.Z., Haughton, V.M., Hyde, J.S., 1995. Functional connectivity in themotor cortex of resting human brain using echo-planar MRI. Magn. Reson. Med.34, 537–541.
Brodal, P., 1979. The pontocerebellar projection in the rhesus monkey: an experimentalstudy with retrograde axonal transport of horseradish peroxidase. Neuroscience 4,193–208.
Buckner, R.L., Andrews-Hanna, J.R., Schacter, D.L., 2008. The brain's default network:anatomy, function, and relevance to disease. Ann. N. Y. Acad. Sci. 1124, 1–38.
Buckner, R.L., Krienen, F.M., Castellanos, A., Diaz, J.C., Yeo, B.T., 2011. The organizationof the human cerebellum estimated by intrinsic functional connectivity. J. Neurophysiol.106, 2322–2345.
Clower, D.M., West, R.A., Lynch, J.C., Strick, P.L., 2001. The inferior parietal lobule is thetarget of output from the superior colliculus, hippocampus, and cerebellum. J. Neurosci.21, 6283–6291.
Cole, D.M., Smith, S.M., Beckmann, C.F., 2010. Advances and pitfalls in the analysis andinterpretation of resting-state FMRI data. Front. Syst. Neurosci. 4, 8.
Damoiseaux, J.S., Rombouts, S.A., Barkhof, F., Scheltens, P., Stam, C.J., Smith, S.M.,Beckmann, C.F., 2006. Consistent resting-state networks across healthy subjects.Proc. Natl. Acad. Sci. U. S. A. 103, 13848–13853.
De Luca, M., Beckmann, C.F., De Stefano, N., Matthews, P.M., Smith, S.M., 2006. fMRIresting state networks define distinct modes of long-distance interactions in thehuman brain. NeuroImage 29, 1359–1367.
Diedrichsen, J., Balsters, J.H., Flavell, J., Cussans, E., Ramnani, N., 2009. A probabilisticMR atlas of the human cerebellum. NeuroImage 46, 39–46.
Fischl, B., Salat, D.H., Busa, E., Albert, M., Dieterich, M., Haselgrove, C., van der Kouwe,A., Killiany, R., Kennedy, D., Klaveness, S., Montillo, A., Makris, N., Rosen, B., Dale,A.M., 2002. Whole brain segmentation: automated labeling of neuroanatomicalstructures in the human brain. Neuron 33, 341–355.
Fortier, C.B., Disterhoft, J.F., McGlinchey-Berroth, R., 2000. Cerebellar cortical degenerationdisrupts discrimination learning but not delay or trace classical eyeblink conditioning.Neuropsychology 14, 537–550.
Fransson, P., 2005. Spontaneous low-frequency BOLD signal fluctuations: an fMRIinvestigation of the resting-state default mode of brain function hypothesis.Hum. Brain Mapp. 26, 15–29.
Habas, C., Kamdar, N., Nguyen, D., Prater, K., Beckmann, C.F., Menon, V., Greicius, M.D.,2009. Distinct cerebellar contributions to intrinsic connectivity networks. J. Neurosci.29, 8586–8594.
Ito, M., 1984. The modifiable neuronal network of the cerebellum. Jpn. J. Physiol. 34,781–792.
Ivry, R.B., Spencer, R.M., Zelaznik, H.N., Diedrichsen, J., 2002. The cerebellum and eventtiming. Ann. N. Y. Acad. Sci. 978, 302–317.
Jenkinson, M., Smith, S., 2001. A global optimisation method for robust affine registrationof brain images. Med. Image Anal. 5, 143–156.
Kaufman, G.D., Mustari, M.J., Miselis, R.R., Perachio, A.A., 1996. Transneuronal pathwaysto the vestibulocerebellum. J. Comp. Neurol. 370 (4), 501–523.
Kelly, R.M., Strick, P.L., 2003. Cerebellar loops with motor cortex and prefrontal cortexof a nonhuman primate. J. Neurosci. 23, 8432–8444.
Kheradmand, A., Zee, D.S., 2011. Cerebellum and ocular motor control. Front. Neurol. 2, 53.Krienen, F.M., Buckner, R.L., 2009. Segregated fronto-cerebellar circuits revealed by intrinsic
functional connectivity. Cereb. Cortex 19, 2485–2497.Leiner, H.C., Leiner, A.L., Dow, R.S., 1993. Cognitive and language functions of the
human cerebellum. Trends Neurosci. 16, 444–447.Llinas, R.R., Walton, K.D., Lang, E.J., 2003. Cerebellum. In: Shepherd, G.M. (Ed.), The
Synaptic Organization of the Brain. Oxford University Press, New York.Lowe, M.J., Mock, B.J., Sorenson, J.A., 1998. Functional connectivity in single and multi-
slice echoplanar imaging using resting-state fluctuations. NeuroImage 7, 119–132.May, J.G., Andersen, R.A., 1986. Different patterns of corticopontine projections from
separate cortical fields within the inferior parietal lobule and dorsal prelunategyrus of the macaque. Exp. Brain Res. 63 (2), 265–278.
Middleton, F.A., Strick, P.L., 1994. Anatomical evidence for cerebellar and basal gangliainvolvement in higher cognitive function. Science 266, 458–461.
Middleton, F.A., Strick, P.L., 2001. Cerebellar projections to the prefrontal cortex of theprimate. J. Neurosci. 21, 700–712.
Murdoch, B.E., 2010. The cerebellum and language: historical perspective and review.Cortex 46, 858–868.
O'Reilly, J.X., Beckmann, C.F., Tomassini, V., Ramnani, N., Johansen-Berg, H., 2009. Distinctand overlapping functional zones in the cerebellum defined by resting state functionalconnectivity. Cereb Cortex 20, 953–965.
Paulus, K.S., Magnano, I., Conti, M., Galistu, P., D'Onofrio, M., Satta, W., Aiello, I., 2004.Pure post-stroke cerebellar cognitive affective syndrome: a case report. Neurol.Sci. 25, 220–224.
Ramnani, N., Behrens, T.E., Johansen-Berg, H., Richter, M.C., Pinsk, M.A., Andersson, J.L.,Rudebeck, P., Ciccarelli, O., Richter, W., Thompson, A.J., Gross, C.G., Robson, M.D.,Kastner, S., Matthews, P.M., 2006. The evolution of prefrontal inputs to thecortico-pontine system: diffusion imaging evidence from Macaque monkeys andhumans. Cereb. Cortex 16, 811–818.
Schmahmann, J.D., 1991. An emerging concept. The cerebellar contribution to higherfunction. Arch. Neurol. 48, 1178–1187.
Schmahmann, J.D., Pandya, D.N., 1997. The cerebrocerebellar system. Int. Rev. Neurobiol.41, 31–60.
Schmahmann, J.D., Sherman, J.C., 1998. The cerebellar cognitive affective syndrome.Brain 121 (Pt 4), 561–579.
Smith, S.M., 2002. Fast robust automated brain extraction. Hum. BrainMapp. 17, 143–155.Smith, S.M., Jenkinson, M., Woolrich, M.W., Beckmann, C.F., Behrens, T.E., Johansen-Berg,
H., Bannister, P.R., De Luca, M., Drobnjak, I., Flitney, D.E., Niazy, R.K., Saunders, J.,Vickers, J., Zhang, Y., De Stefano, N., Brady, J.M., Matthews, P.M., 2004. Advances infunctional and structural MR image analysis and implementation as FSL. NeuroImage23 (Suppl 1), S208–S219.
Smith, S.M., Fox, P.T., Miller, K.L., Glahn, D.C., Fox, P.M., Mackay, C.E., Filippini, N.,Watkins, K.E., Toro, R., Laird, A.R., Beckmann, C.F., 2009. Correspondence of thebrain's functional architecture during activation and rest. Proc. Natl. Acad. Sci.U. S. A. 106, 13040–13045.
Sporns, O., Tononi, G., Edelman, G.M., 2002. Theoretical neuroanatomy and the connectivityof the cerebral cortex. Behav. Brain Res. 135, 69–74.
Stoodley, C.J., Schmahmann, J.D., 2009. Functional topography in the human cerebellum:a meta-analysis of neuroimaging studies. NeuroImage 44, 489–501.
Vincent, J.L., Kahn, I., Snyder, A.Z., Raichle,M.E., Buckner, R.L., 2008. Evidence for a frontopar-ietal control system revealed by intrinsic functional connectivity. J. Neurophysiol. 100,3328–3342.
Zuo, X.N., Kelly, C., Adelstein, J.S., Klein, D.F., Castellanos, F.X., Milham, M.P., 2010. Reliableintrinsic connectivity networks: test–retest evaluation using ICA and dual regressionapproach. Neuroimage 49, 2163–2177.