
Distillation
15
Department of Chemical Engineering University of San Carlos –Talamban Campus Nasipit, Talamban, Cebu City ChE 512L Chemical Engineering Laboratory 2 Distillation (Batch Distillation of Water-Ethanol Mixture) A laboratory report submitted to: Engr. Ramelito Agapay Instructor, ChE 512L Submitted by: Campos, Anthony Kevin Casia, Aljone August 3, 2012
-
Upload
kara-sheen-batayola -
Category
Documents
-
view
46 -
download
0
description
Laboratory Report
Transcript of Distillation

Department of Chemical Engineering
University of San Carlos –Talamban Campus
Nasipit, Talamban, Cebu City
ChE 512L
Chemical Engineering Laboratory 2
Distillation
(Batch Distillation of Water-Ethanol Mixture)
A laboratory report submitted to:
Engr. Ramelito Agapay
Instructor, ChE 512L
Submitted by:
Campos, Anthony Kevin
Casia, Aljone
August 3, 2012
I. Introduction
Distillation is carried out in two ways: differential distillation and staged distillation. The
difference is what is inside of the distillation column. In differential (simple batch) distillation,
the column contains packing like that used for gas absorption. In small laboratory columns, this
packing is usually random, of raschig rings or even glass beads. Such distillation aims to provide
small amounts of very pure chemicals. The second way to effect these separations is staged
distillation. In staged distillation, the column internals are completely different than those
normally used for gas absorption. Now these internals consist of a series of compartments or
‘‘trays,’’ where liquid and vapor are contacted intimately, in the hope that they will approach
equilibrium. Now, the liquid and vapor concentrations in the column do not vary continuously,
but discretely, jumping to new values on each tray. Staged distillation was an innovation for
commodity chemicals a century ago, and was the standard during the rapid growth of the
chemical industry. [Cussler,2009]
Distillation normally involves three pieces of equipment: a column, a condenser on top of
the column, and a reboiler at the bottom of the column. The reboiler, often a steam-jacketed
kettle, is heated so that much of its contents evaporates and flow upwards through the column.
The vapors passing out of the column are liquefied in the condenser and much of this condensate
is sent back downwards through the column. This countercurrent flow of vapor and condensate is
common to all forms of distillation.
The system we are dealing in the experiment is a separation of a binary mixture of
Ethanol-water solution via differential distillation. The mechanism in which we can concentrate
the ethanol-water mixture to higher ethanol content is their relative volatility. Thus, the driving
force towards separation is their relative volatility. The batch distillation is performing at a
constant reflux ratio of 0.15. It is not possible to neither maintain the bottom concentration nor
increase with respect to time because of the constraint that the operating condition is a batch. The
same is with the distillate concentration. Thus in the separation, decreasing concentration with
respect to time is to be expected for both bottoms and distillate concentrations.
The differential equation is best described by Rayleigh equation (eq1). It assumes that
small amount of dL (differential Liquid) is vaporized, the composition of the liquid changes from
x to x - dx (differential liquid mole fraction) and the amount of liquid from L to L – dL.

∫
The Rayleigh equation is used to calculate for the theoretical average composition yave.
The term ∫
is obtained by graphical integration of the changing bottom liquid mole fraction
with respect to the reciprocal of the difference in the mole fraction of the distillate and bottoms.
Equation 2 is used to determine the average composition.
∫
∫
II. Objectives
1. Determine the average concentration of a specified volume of the distillate that is obtained
from a feed mixture of known composition by operating the distillation unit at constant
reflux.
2. Use experimental data to predict the time required to obtain a particular concentration of
the distillate.
III. Methodology
1. Materials
Graduated cylinder (2L), stopwatch, thermometer, goggles, siphon, pail, wash
bottle, analytical grade EtOH, technical grade EtOH, test tubes, distilled water,
volumetric flask, refractometer, pipet, aspirator
2. Equipment and Apparatus
Analytical balance, weighing scale, refractometer, and distillation set-up.
3. Procedure
a. Preparation of the Standard Calibration Curve
Specific amount of ethanol (analytical grade) with distilled water to make
solutions which corresponds to 20, 40, 60, 80 percent by weight ethanol was prepared. By
using refractometer, the refractive index of each solution was determined. Graph of
percent weight ethanol solution versus refractive index was plotted as the basis for

determining the different concentrations that is obtained from the distillate and bottom
ethanol solution samples.
b. Preparation of Feed
The refractive index of the technical grade ethanol was determined by taking 2mL
sample. From the calibration curve, the corresponding percent weight ethanol was
determined. This data was used as a reference for the preparation of the 27 L ethanol
solution that has 30 wt% EtOH.
c. Pre-start up Operation
All vents were opened. Prior to closing the reboiler steam inlet valve, all of the drain
valves, steam supply valve, steam regulating valve, reflux control valve, recycle valve,
and the valve that connects the two receiver valve were closed. The seal of the cylindrical
still was opened by a wrench wherein the prepared 27 L EtOH was poured using siphon
until the flask is about 2/3 full. Soft water was allowed to flow through the pipeline. The
soft water inlet valve was opened slowly as soon as steady flow is obtained. This is to
ensure that no air bubbles are trapped in the pipelines. Two thermometer were provided
to the thermometer pockets.
d. Start-up Operation
The by-pass valve was opened to allow the stem to surge through the drain and
release incondensable gases. The by-pass valve was closed and the steam supply valve
was slowly opened. The steam supply pressure gauge was ensured that it indicates a
value greater than 20 psig. Then the regulating valve was slowly adjusted to regulated
steam pressure wherein the pressure was set to 10 psig.
e. Experiment Proper
When the liquid mixture in the still started to boil, total reflux is operated for 20
minutes. Then the reflux control valve was opened to give a total offtake of products. The
time to fill the upper product receiver from the lower to upper mark was noted.
The recycle valve was opened to drain the product back to the reboiler. After it
was drained, the recycle valve was closed again and noted that it will not be opened again
in the duration of the experiment. Once again, total reflux was operated for a few
minutes. The reflux control valve was adjusted to approximately 1/6th
open. the time
required to fill the product receiver was noted to the same mark as before. The distillate
was withdrawn simultaneously at regular interval of about 5 minutes. The sample was
mixed properly by shaking and 10mL sample was collected every 5 min for the
determination of its refractive index. I that time interval, the temperatures of the bottoms
and distillate was also recorded. The sampling was allowed to distill until 3L of the
distillate was collected.
f. Shutdown Operation
The reflux control valve was set to total reflux and the steam regulating valve was
closed. The residual steam in the reboiler was carefully vented through the by-pass valve.
The condenser cooling water was turned off when the boiling has stopped. The ethanol
solution in the bottoms was allowed to cool. Lastly, the solution was drained to a suitable
receiver.
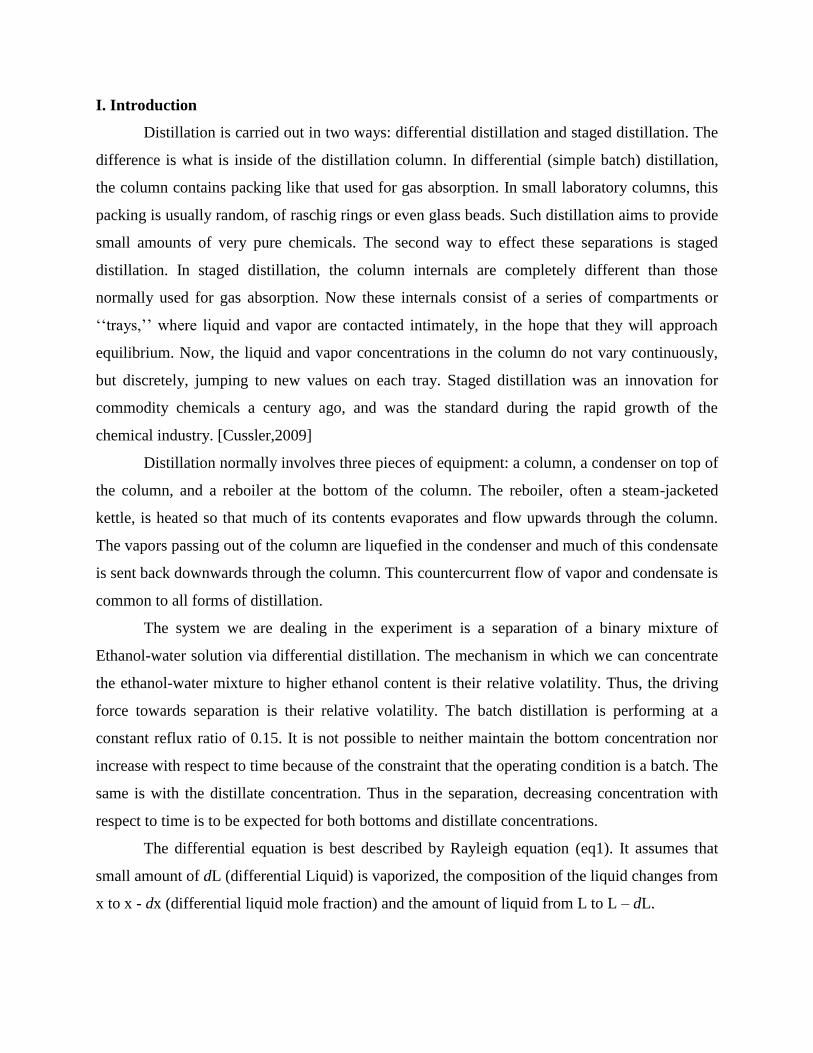
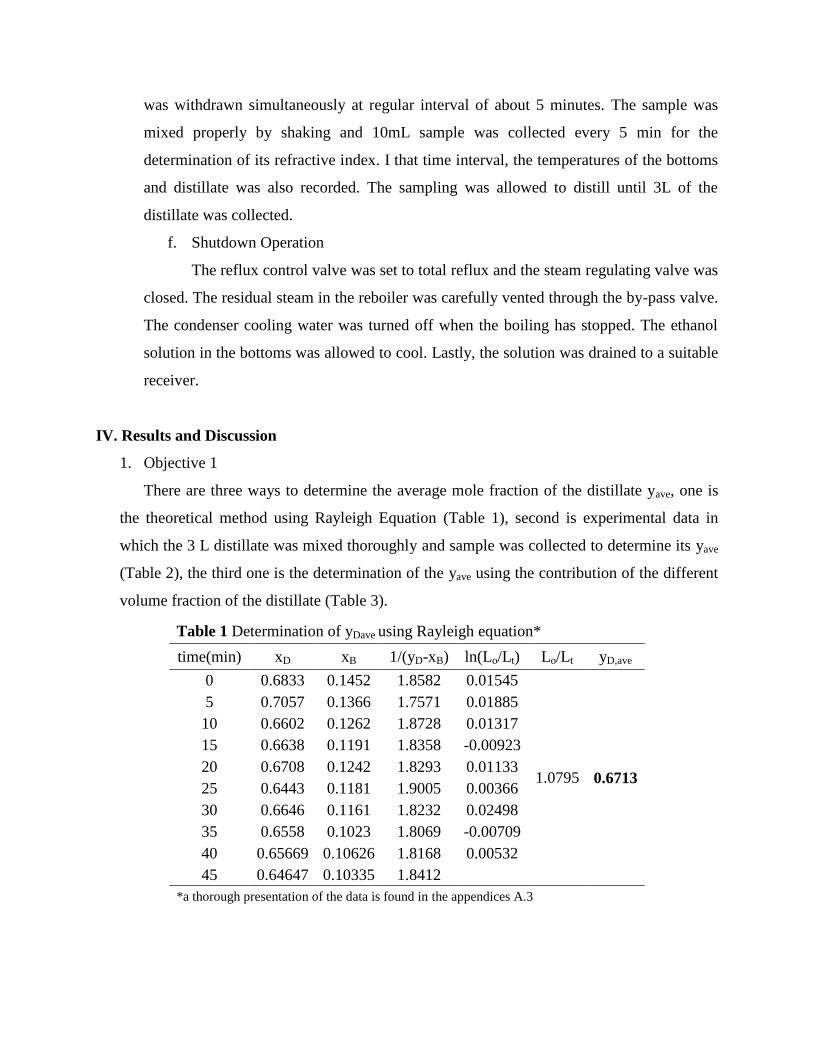
IV. Results and Discussion
1. Objective 1
There are three ways to determine the average mole fraction of the distillate yave, one is
the theoretical method using Rayleigh Equation (Table 1), second is experimental data in
which the 3 L distillate was mixed thoroughly and sample was collected to determine its yave
(Table 2), the third one is the determination of the yave using the contribution of the different
volume fraction of the distillate (Table 3).
Table 1 Determination of yDave using Rayleigh equation*
time(min) xD xB 1/(yD-xB) ln(Lo/Lt) Lo/Lt yD,ave
0 0.6833 0.1452 1.8582 0.01545
1.0795 0.6713
5 0.7057 0.1366 1.7571 0.01885
10 0.6602 0.1262 1.8728 0.01317
15 0.6638 0.1191 1.8358 -0.00923
20 0.6708 0.1242 1.8293 0.01133
25 0.6443 0.1181 1.9005 0.00366
30 0.6646 0.1161 1.8232 0.02498
35 0.6558 0.1023 1.8069 -0.00709
40 0.65669 0.10626 1.8168 0.00532
45 0.64647 0.10335 1.8412
*a thorough presentation of the data is found in the appendices A.3
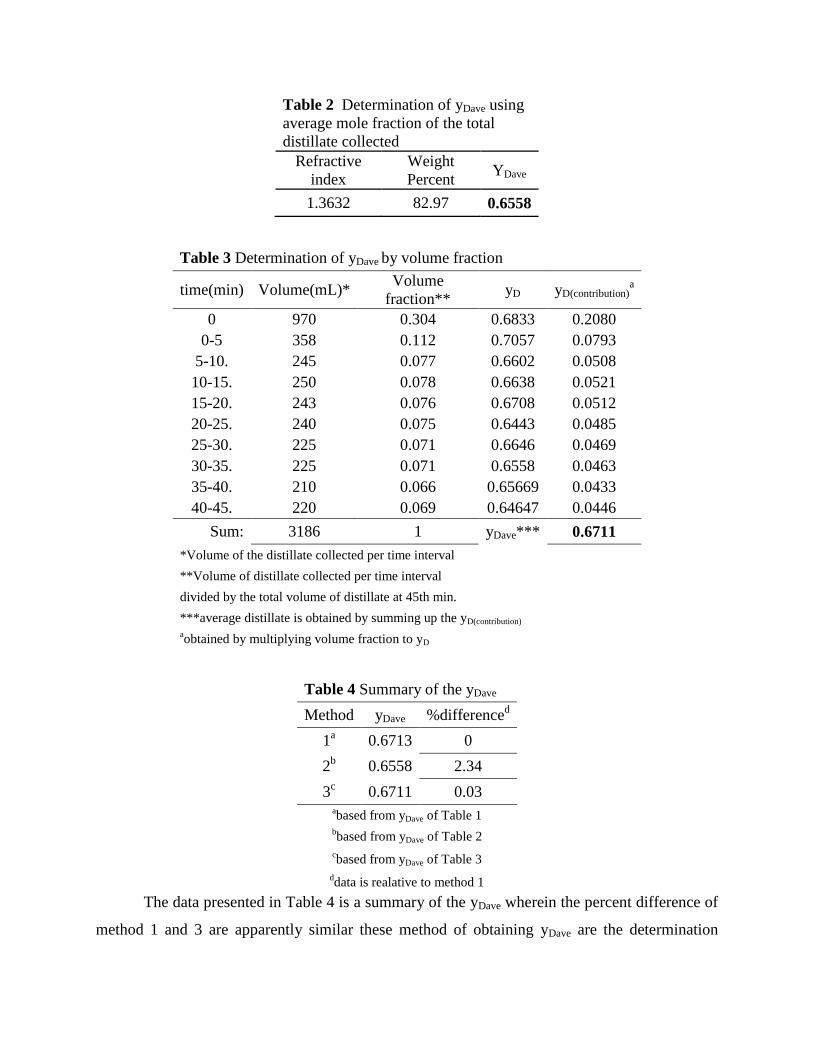
Table 2 Determination of yDave using
average mole fraction of the total
distillate collected
Refractive
index
Weight
Percent YDave
1.3632 82.97 0.6558
Table 3 Determination of yDave by volume fraction
time(min) Volume(mL)* Volume
fraction** yD yD(contribution)
a
0 970 0.304 0.6833 0.2080
0-5 358 0.112 0.7057 0.0793
5-10. 245 0.077 0.6602 0.0508
10-15. 250 0.078 0.6638 0.0521
15-20. 243 0.076 0.6708 0.0512
20-25. 240 0.075 0.6443 0.0485
25-30. 225 0.071 0.6646 0.0469
30-35. 225 0.071 0.6558 0.0463
35-40. 210 0.066 0.65669 0.0433
40-45. 220 0.069 0.64647 0.0446
Sum: 3186 1 yDave*** 0.6711
*Volume of the distillate collected per time interval
**Volume of distillate collected per time interval
divided by the total volume of distillate at 45th min.
***average distillate is obtained by summing up the yD(contribution) aobtained by multiplying volume fraction to yD
Table 4 Summary of the yDave
Method yDave %differenced
1a 0.6713 0
2b 0.6558 2.34
3c 0.6711 0.03
abased from yDave of Table 1
bbased from yDave of Table 2
cbased from yDave of Table 3
ddata is realative to method 1
The data presented in Table 4 is a summary of the yDave wherein the percent difference of
method 1 and 3 are apparently similar these method of obtaining yDave are the determination

using Rayleigh equation and the method of volume fraction. It showed that the confirmation
from experimental data is best correlated by the Rayleigh equation. Method 2 did not fit the 0.67
range because probably the mixing of all the distillate is not enough and that we did not really
got representation of the average distillate concentration. Another speculation is the dissipation
of ethanol solution towards the atmosphere upon mixing. We mixed the distillate solution in the
pale wherein it is susceptible to volatilization causing the solution to decrease its concentration
of about 0.02 based from 0.67. The value 0.67 is a valid assumption of the correct yDave if we
look at to how these data are obtained. It is the when we collected sample of the distillate and
assured that the collected sample was sealed tightly compared to method 2 wherein the sample
obtained has been exposed to air for some time.
Fig. 1 Graph of mole fraction EtOH versus time (Distillate).
Figure 1 is confirmation of the obtained yDave that the obtained yDave is within the range of
the decreasing mole fraction with respect to time. The expected decrease in mole fraction with
respect to time for a batch distillation is confirmed in Fig 1 and 2 as discussed in the
introduction.
0.6400
0.6500
0.6600
0.6700
0.6800
0.6900
0.7000
0.7100
0 5 10 15 20 25 30 35 40 45Mole
Fra
ctio
n o
f et
OH
solu
tion
Time [mins]

Fig. 2 Graph of mole fraction EtOH versus time (Bottoms).
2. Objective 2
Table 5 Data for
determining time
of maximum
concentration
time(min) yD,ave
0 0.6833
0-5 0.6941
0-10 0.6877
0-15 0.6807
0-20 0.6838
0-25 0.6779
0-30 0.6763
0-35 0.6713
0-40 0.6727
0-45 0.6713
Table 5 shows the yDave when it reaches maximum average concentration of the distillate
obtained. The data shows that at the 5th
minute, the average concentration of the distillate is at its
0.1000
0.1050
0.1100
0.1150
0.1200
0.1250
0.1300
0.1350
0.1400
0.1450
0.1500
0.1550
0 5 10 15 20 25 30 35 40 45
Mo
l Fra
ctio
n E
tOH
,xB
Time, t (min)
Fig. 4 Time vs. Mol Fraction EtOH at Bottoms

maximum, It can also be explain in Fig. 1 wherein the peak is also at its 5th
minute. The
supporting data for this can be seen in the appendices (from A.2-1 to A.2-9)
V. Conclusion
The average mole fractions of the distillates are 0.6713, 0.6558 and 0.6711.
The time required to obtain a maximum average concentration of the distillate is 5
minutes.
VI. References
Geankoplis, C.J. (2009). Transport Processes and Unit Operations, 4th
Edition, Prentice
Hall,New Jersey.
Perry, R.H. et.al. Eds. (2008) Perry’s Chemical Engineer’s Handbook, 8th
Edition,
McGraw-Hill, Inc., New York
Cussler, E.L. (2007) Diffusion Mass Transfer in Fluid System, 3rd
Edition, Cambridge
University Press, New York
VII. Appendices
A.1-1 Determination of the reflux
ratio
Filling Time
[s] Reflux
Ratio Fully
Open 1/6 Open
266 306 0.1504
A.1-2 Experimental yDave
Refractive
Index, nD
Dilution
Factor
Experimental
YAVE
1.3632 2.1667 0.8447
A.1-3 Graphical Integration involving Rayleigh’s Distillation
A.2-1
time(min) mD mB xD xB 1/(yD-xB) ln(Lo/Lt) Lo/Lt yD,ave
0 0.847 0.303 0.6833 0.1452 1.8582 0.0155 1.0156 0.6941
5 0.860 0.288 0.7057 0.1366 1.7571
A.2-2
time(min) mD mB xD xB 1/(yD-xB) ln(Lo/Lt) Lo/Lt yD,ave
0 0.847 0.3027 0.6833 0.1452 1.8582
0.0343 1.0349 0.6877 5 0.860 0.288 0.7057 0.1366 1.7571
10 0.832 0.270 0.6602 0.1262 1.8728
A.2-3
time(min) mD mB xD xB 1/(yD-xB) ln(Lo/Lt) Lo/Lt yD,ave
0 0.847 0.3027 0.6833 0.1452 1.8582
0.0475 1.0486 0.6807 5 0.860 0.2880 0.7057 0.1366 1.7571
10 0.832 0.2697 0.6602 0.1262 1.8728
15 0.835 0.2569 0.6638 0.1191 1.8358
1.74
1.76
1.78
1.80
1.82
1.84
1.86
1.88
1.90
1.92
0.1010 0.1110 0.1210 0.1310 0.1410
1/(
YD-X
B)
XB
Rayleigh's Distillation

A.2-4
time(min) mD mB xD xB 1/(yD-xB) ln(Lo/Lt) Lo/Lt yD,ave
0 0.847 0.3027 0.6833 0.1452 1.8582
0.0382 1.0390 0.6838
5 0.860 0.2880 0.7057 0.1366 1.7571
10 0.832 0.2697 0.6602 0.1262 1.8728
15 0.835 0.2569 0.6638 0.1191 1.8358
20 0.839 0.2660 0.6708 0.1242 1.8293
A.2-5
time(min) mD mB xD xB 1/(yD-xB) ln(Lo/Lt) Lo/Lt yD,ave
0 0.8465 0.3027 0.6833 0.1452 1.8582
0.0496 1.0508 0.6779
5 0.8598 0.2880 0.7057 0.1366 1.7571
10 0.8324 0.2697 0.6602 0.1262 1.8728
15 0.8347 0.2569 0.6638 0.1191 1.8358
20 0.8390 0.2660 0.6708 0.1242 1.8293
25 0.8224 0.2550 0.6443 0.1181 1.9005
A.2-6
time(min) mD mB xD xB 1/(yD-xB) ln(Lo/Lt) Lo/Lt yD,ave
0 0.8465 0.3027 0.6833 0.1452 1.8582
0.0532 1.0547 0.6763
5 0.8598 0.2880 0.7057 0.1366 1.7571
10 0.8324 0.2697 0.6602 0.1262 1.8728
15 0.8347 0.2569 0.6638 0.1191 1.8358
20 0.8390 0.2660 0.6708 0.1242 1.8293
25 0.8224 0.2550 0.6443 0.1181 1.9005
30 0.8351 0.2514 0.6646 0.1161 1.8232
A.2-7
time(min) mD mB xD xB 1/(yD-xB) ln(Lo/Lt) Lo/Lt yD,ave
0 0.847 0.3027 0.6833 0.1452 1.8582
0.0782 1.0814 0.6713
5 0.860 0.2880 0.7057 0.1366 1.7571
10 0.832 0.2697 0.6602 0.1262 1.8728
15 0.835 0.2569 0.6638 0.1191 1.8358
20 0.839 0.2660 0.6708 0.1242 1.8293
25 0.822 0.2550 0.6443 0.1181 1.9005
30 0.835 0.2514 0.6646 0.1161 1.8232
35 0.830 0.2257 0.6558 0.1023 1.8069

A.2-8
time(min) mD mB xD xB 1/(yD-xB) ln(Lo/Lt) Lo/Lt yD,ave
0 0.847 0.3027 0.6833 0.1452 1.8582
0.0711 1.0737 0.6727
5 0.860 0.2880 0.7057 0.1366 1.7571
10 0.832 0.2697 0.6602 0.1262 1.8728
15 0.835 0.2569 0.6638 0.1191 1.8358
20 0.839 0.2660 0.6708 0.1242 1.8293
25 0.822 0.2550 0.6443 0.1181 1.9005
30 0.835 0.2514 0.6646 0.1161 1.8232
35 0.830 0.2257 0.6558 0.1023 1.8069
40 0.83023 0.2331 0.65669 0.10626 1.8168
A.2-9
time(min) mD mB xD xB 1/(yD-xB) ln(Lo/Lt) Lo/Lt yD,ave
0 0.847 0.3027 0.6833 0.1452 1.8582
0.0765 1.0795 0.6713
5 0.860 0.2880 0.7057 0.1366 1.7571
10 0.832 0.2697 0.6602 0.1262 1.8728
15 0.835 0.2569 0.6638 0.1191 1.8358
20 0.839 0.2660 0.6708 0.1242 1.8293
25 0.822 0.2550 0.6443 0.1181 1.9005
30 0.835 0.2514 0.6646 0.1161 1.8232
35 0.830 0.2257 0.6558 0.1023 1.8069
40 0.83023 0.2331 0.65669 0.10626 1.8168
45 0.82379 0.2276 0.64647 0.10335 1.8412
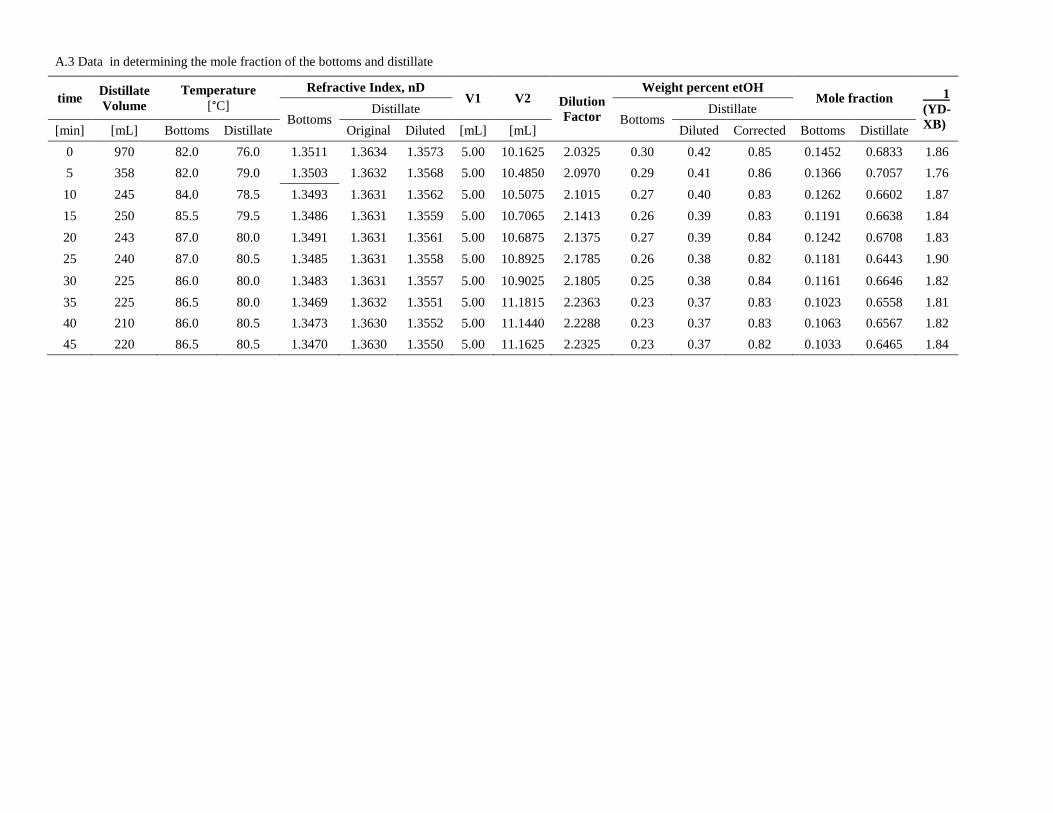
A.3 Data in determining the mole fraction of the bottoms and distillate
time Distillate
Volume
Temperature
[°C]
Refractive Index, nD V1 V2 Dilution
Factor
Weight percent etOH Mole fraction 1
(YD-
XB) Bottoms Distillate
Bottoms Distillate
[min] [mL] Bottoms Distillate Original Diluted [mL] [mL] Diluted Corrected Bottoms Distillate
0 970 82.0 76.0 1.3511 1.3634 1.3573 5.00 10.1625 2.0325 0.30 0.42 0.85 0.1452 0.6833 1.86
5 358 82.0 79.0 1.3503 1.3632 1.3568 5.00 10.4850 2.0970 0.29 0.41 0.86 0.1366 0.7057 1.76
10 245 84.0 78.5 1.3493 1.3631 1.3562 5.00 10.5075 2.1015 0.27 0.40 0.83 0.1262 0.6602 1.87
15 250 85.5 79.5 1.3486 1.3631 1.3559 5.00 10.7065 2.1413 0.26 0.39 0.83 0.1191 0.6638 1.84
20 243 87.0 80.0 1.3491 1.3631 1.3561 5.00 10.6875 2.1375 0.27 0.39 0.84 0.1242 0.6708 1.83
25 240 87.0 80.5 1.3485 1.3631 1.3558 5.00 10.8925 2.1785 0.26 0.38 0.82 0.1181 0.6443 1.90
30 225 86.0 80.0 1.3483 1.3631 1.3557 5.00 10.9025 2.1805 0.25 0.38 0.84 0.1161 0.6646 1.82
35 225 86.5 80.0 1.3469 1.3632 1.3551 5.00 11.1815 2.2363 0.23 0.37 0.83 0.1023 0.6558 1.81
40 210 86.0 80.5 1.3473 1.3630 1.3552 5.00 11.1440 2.2288 0.23 0.37 0.83 0.1063 0.6567 1.82
45 220 86.5 80.5 1.3470 1.3630 1.3550 5.00 11.1625 2.2325 0.23 0.37 0.82 0.1033 0.6465 1.84

A.4 Calibration Curve
0
10
20
30
40
50
60
70
80
90
100
1.33 1.332 1.334 1.336 1.338 1.34 1.342 1.344 1.346 1.348 1.35 1.352 1.354 1.356 1.358 1.36 1.362 1.364 1.366
Pe
rce
nt
We
igh
t Et
OH
Refractive Index


![Knowledge Distillation - University of British Columbialsigal/532S_2018W2/4b.pdf · Distillation and Quantization [4]: two compression methods Quantized distillation Differentiable](https://static.fdocuments.us/doc/165x107/5fd649d491f9321f9733e28e/knowledge-distillation-university-of-british-columbia-lsigal532s2018w24bpdf.jpg)


![Data Distillation: Towards Omni-Supervised Learning · Data Distillation model A model A Figure 1. Model Distillation [18] vs. Data Distillation. In data distillation, ensembled predictions](https://static.fdocuments.us/doc/165x107/60a237adb93b13457117b793/data-distillation-towards-omni-supervised-learning-data-distillation-model-a-model.jpg)

