DISTELL ’04 - ShareData - ShareData Online - South ... · Inside DISTELL ’04 FEATURES SOCIAL...
94
Embedding a performance culture Solid returns despite difficult trading conditions DISTELL ’04 ANNUAL REPORT Looking ahead | Reviewing operations | Financial highlights DISTELL How we’ve measured up Analysis of performance 4 Duty-bound Focal point for governance 28
Transcript of DISTELL ’04 - ShareData - ShareData Online - South ... · Inside DISTELL ’04 FEATURES SOCIAL...
Embedding aperformance culture
Solid returns despitedifficult trading conditions
DISTELL ’04ANNUAL REPORT Looking ahead | Reviewing operations | Financial highlights
DISTELL
How we’vemeasured upAnalysis ofperformance
4
Duty-boundFocal point forgovernance
28
DISTELL ANNUAL REPORT 2004
PH
OT
OG
RA
PH
ER
:A
DR
IAA
N O
OS
TH
UIZ
EN
I
NS
PIR
ER
:S
AR
É K
OT
ZE
AN
D F
RIE
ND
MA
RLE
NE
S
HO
T O
N L
OC
AT
ION
AT
PL
AIS
IR D
E M
ER
LE
IN
SI
DE
D
IS
TE
LL
’
04
CO
NT
EN
TS
Inside DDIISSTTEELLLL ’’0044
F E A T U R E S S O C I A L
R E V I E W S
F I N A N C I A L S
2 The numbers’ storyFinancial highlights
4 How we’ve measured upObjectives and performance
6 Our groupStructure of the group
7 Our global presenceDistell around the world
8 Board mattersComposition of the board andexecutive management
10 Our brands at a glance
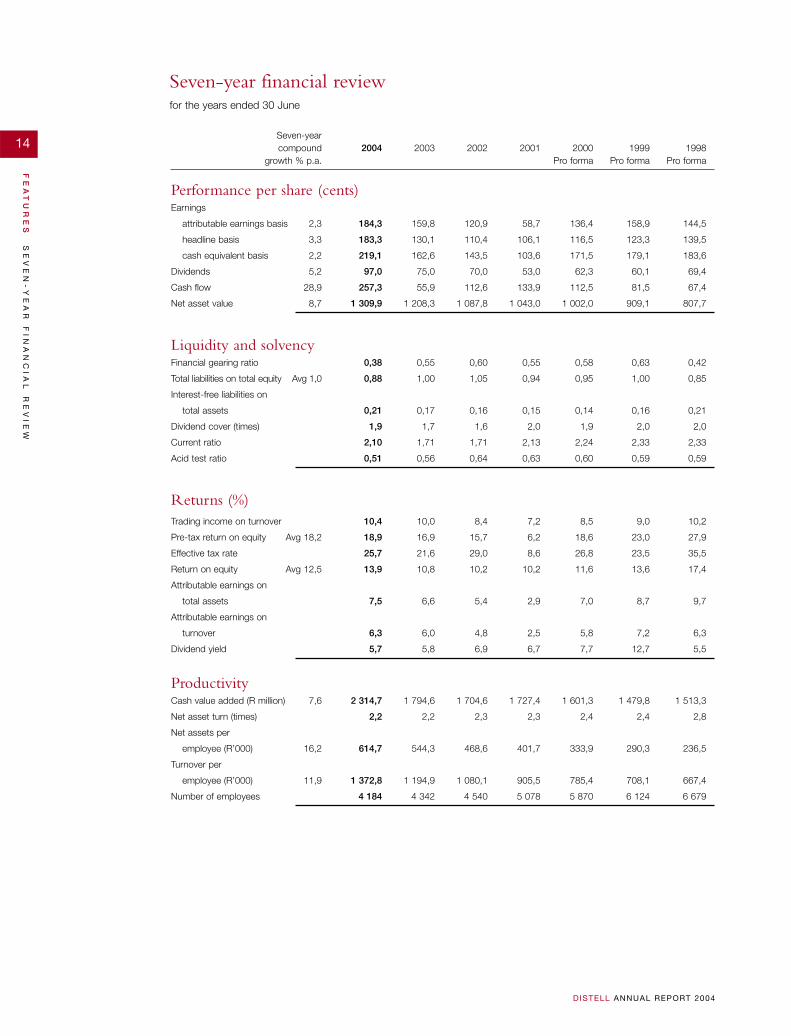
12 Seven-year financial reviewfor the years ended 30 June
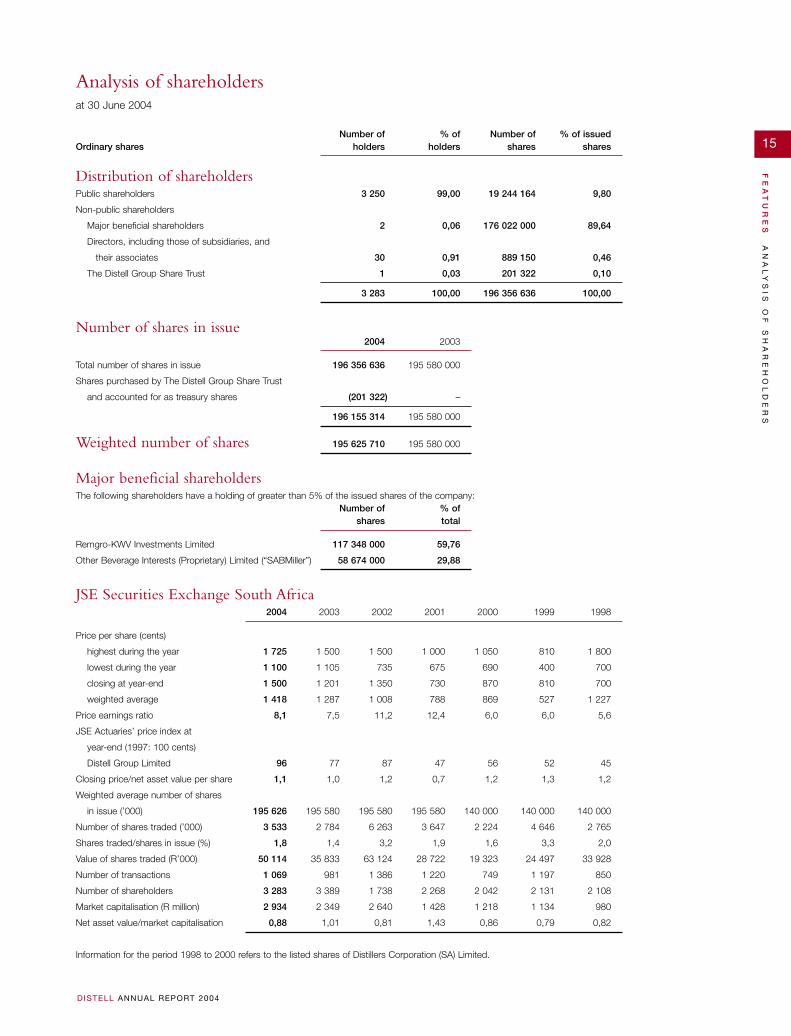
15 Analysis of shareholders
16 A challenging yearChairman’s statement
20 Performance & growthManaging director’s report
28 Duty-boundCorporate governance report
35 Taking responsibilityCorporate responsibility report
42 Our peopleEmbedding a performance culture
44 The Distell way
45 Annual financial statements
86 Notice to shareholders,voting forms and dates ofimportance to shareholders
42 2 28 4
we introduce ourDDIISSTTEELLLL IINNSSPPIIRREERRSSOUR MODELS FOR 2004
Employees across the company were asked to
nominate those of their colleagues whose example
sets the benchmark for others to emulate.
Achievement is after all a team effort. The eight
people featured in this report were selected as true
Distell inspirers.
FRONT COVERPHOTOGRAPH: ADRIAAN OOSTHUIZEN INSPIRER: BRENDA DLAMINI SHOT ON LOCATION AT BOHEMIA, STELLENBOSCH

1
FE
AT
UR
ES
DISTELL ANNUAL REPORT 2004
inspiring eachotherFirmly focused on the future while
building on the past, Distell people striveto do what others only dream.
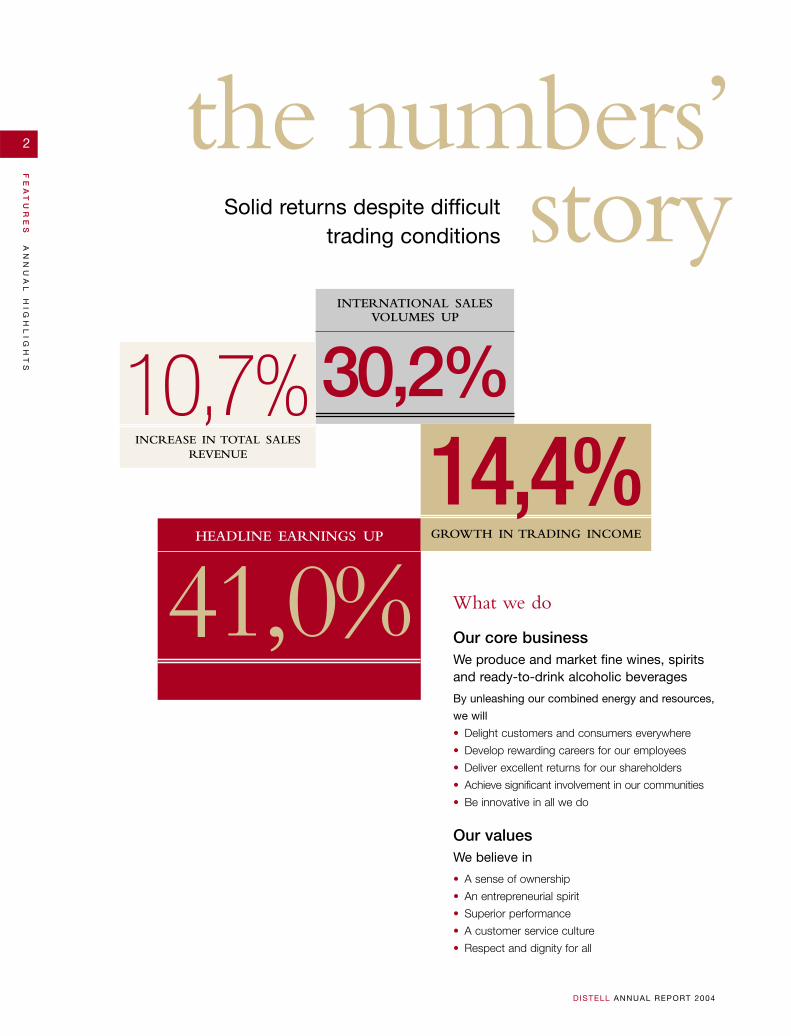
INTERNATIONAL SALESVOLUMES UP
30,2%
the numbers’story
What we do
2
FE
AT
UR
ES
AN
NU
AL
H
IG
HL
IG
HT
S
D ISTELL ANNUAL REPORT 2004
Solid returns despite difficulttrading conditions
Our core businessWe produce and market fine wines, spiritsand ready-to-drink alcoholic beverages
By unleashing our combined energy and resources,
we will
• Delight customers and consumers everywhere
• Develop rewarding careers for our employees
• Deliver excellent returns for our shareholders
• Achieve significant involvement in our communities
• Be innovative in all we do
Our valuesWe believe in
• A sense of ownership
• An entrepreneurial spirit
• Superior performance
• A customer service culture
• Respect and dignity for all
INCREASE IN TOTAL SALESREVENUE
10,7%
HEADLINE EARNINGS UP
41,0%GROWTH IN TRADING INCOME
14,4%
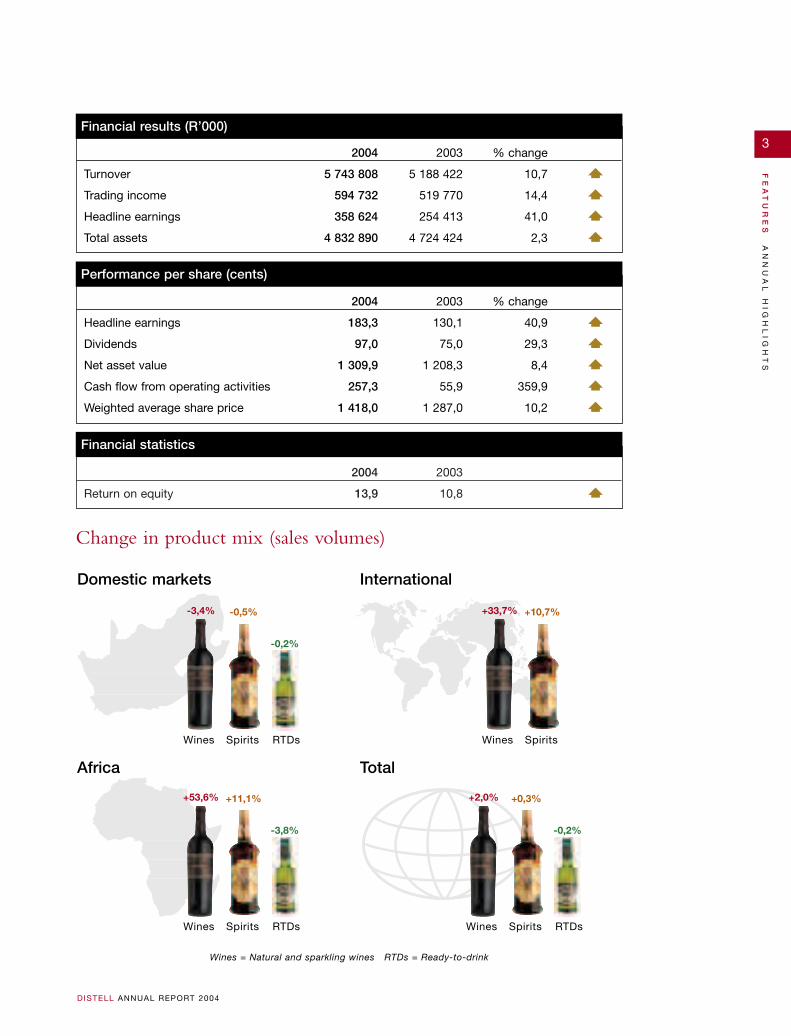
2004 2003
Return on equity 13,9 10,8
2004 2003 % change
Headline earnings 183,3 130,1 40,9
Dividends 97,0 75,0 29,3
Net asset value 1 309,9 1 208,3 8,4
Cash flow from operating activities 257,3 55,9 359,9
Weighted average share price 1 418,0 1 287,0 10,2
2004 2003 % change
Turnover 5 743 808 5 188 422 10,7
Trading income 594 732 519 770 14,4
Headline earnings 358 624 254 413 41,0
Total assets 4 832 890 4 724 424 2,3
Change in product mix (sales volumes)
3
FE
AT
UR
ES
AN
NU
AL
H
IG
HL
IG
HT
S
D ISTELL ANNUAL REPORT 2004
Financial results (R’000)
Performance per share (cents)
Financial statistics
Africa Total
Wines = Natural and sparkling wines RTDs = Ready-to-drink
Wines Spirits RTDs
-3,4% -0,5%
-0,2%
Wines Spirits
+33,7% +10,7%
Wines Spirits RTDs
+53,6% +11,1%
-3,8%
Wines Spirits RTDs
+2,0% +0,3%
-0,2%
Domestic markets International
4
FE
AT
UR
ES
OB
JE
CT
IV
ES
D ISTELL ANNUAL REPORT 2004
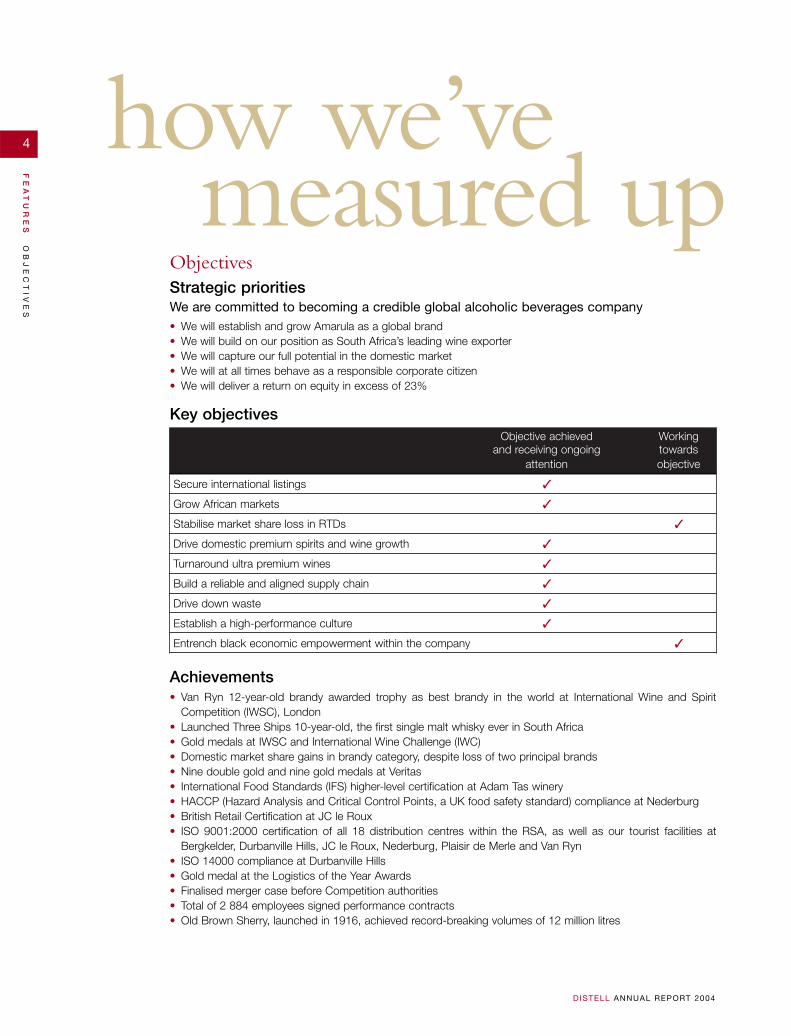
how we’vemeasured up
Strategic prioritiesWe are committed to becoming a credible global alcoholic beverages company• We will establish and grow Amarula as a global brand• We will build on our position as South Africa’s leading wine exporter• We will capture our full potential in the domestic market• We will at all times behave as a responsible corporate citizen• We will deliver a return on equity in excess of 23%
Key objectivesObjective achieved Working
and receiving ongoing towardsattention objective
Secure international listings ✓
Grow African markets ✓
Stabilise market share loss in RTDs ✓
Drive domestic premium spirits and wine growth ✓
Turnaround ultra premium wines ✓
Build a reliable and aligned supply chain ✓
Drive down waste ✓
Establish a high-performance culture ✓
Entrench black economic empowerment within the company ✓
Achievements• Van Ryn 12-year-old brandy awarded trophy as best brandy in the world at International Wine and Spirit
Competition (IWSC), London• Launched Three Ships 10-year-old, the first single malt whisky ever in South Africa• Gold medals at IWSC and International Wine Challenge (IWC)• Domestic market share gains in brandy category, despite loss of two principal brands• Nine double gold and nine gold medals at Veritas• International Food Standards (IFS) higher-level certification at Adam Tas winery• HACCP (Hazard Analysis and Critical Control Points, a UK food safety standard) compliance at Nederburg• British Retail Certification at JC le Roux • ISO 9001:2000 certification of all 18 distribution centres within the RSA, as well as our tourist facilities at
Bergkelder, Durbanville Hills, JC le Roux, Nederburg, Plaisir de Merle and Van Ryn • ISO 14000 compliance at Durbanville Hills• Gold medal at the Logistics of the Year Awards• Finalised merger case before Competition authorities• Total of 2 884 employees signed performance contracts• Old Brown Sherry, launched in 1916, achieved record-breaking volumes of 12 million litres
Objectives
5
FE
AT
UR
ES
PE
RF
OR
MA
NC
E
D ISTELL ANNUAL REPORT 2004
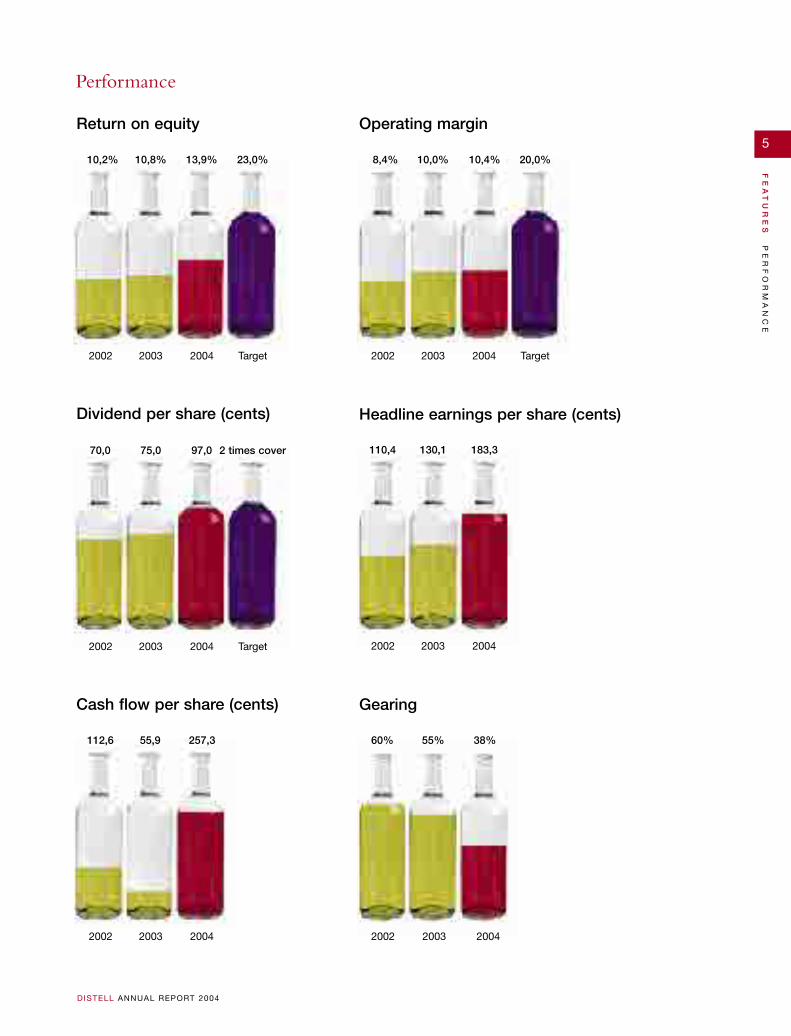
Performance
Return on equity Operating margin
Dividend per share (cents) Headline earnings per share (cents)
Cash flow per share (cents) Gearing
2002 2003 2004 Target
10,2% 10,8% 13,9% 23,0%
2002 2003 2004 Target
70,0 75,0 97,0 2 times cover
2002 2003 2004
112,6 55,9 257,3
2002 2003 2004
60% 55% 38%
2002 2003 2004
110,4 130,1 183,3
2002 2003 2004 Target
8,4% 10,0% 10,4% 20,0%
6
FE
AT
UR
ES
GR
OU
P
ST
RU
CT
UR
E
D ISTELL ANNUAL REPORT 2004
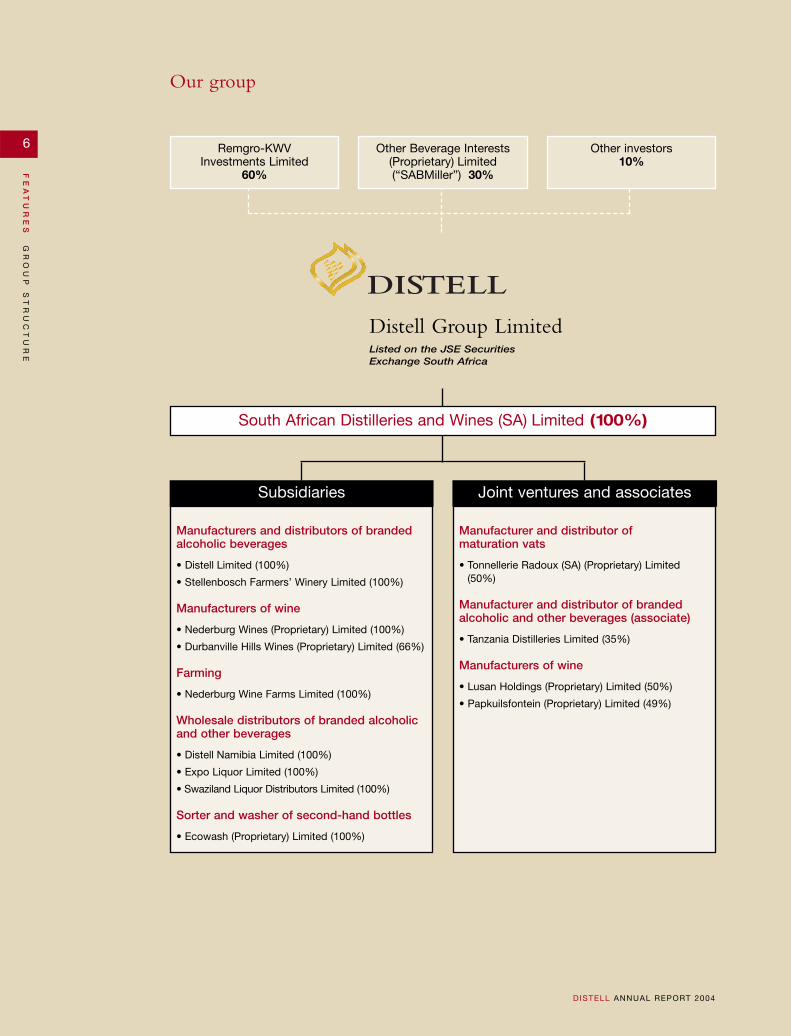
Subsidiaries
Manufacturers and distributors of brandedalcoholic beverages
• Distell Limited (100%)
• Stellenbosch Farmers’ Winery Limited (100%)
Manufacturers of wine
• Nederburg Wines (Proprietary) Limited (100%)
• Durbanville Hills Wines (Proprietary) Limited (66%)
Farming
• Nederburg Wine Farms Limited (100%)
Wholesale distributors of branded alcoholicand other beverages
• Distell Namibia Limited (100%)
• Expo Liquor Limited (100%)
• Swaziland Liquor Distributors Limited (100%)
Sorter and washer of second-hand bottles
• Ecowash (Proprietary) Limited (100%)
Manufacturer and distributor ofmaturation vats
• Tonnellerie Radoux (SA) (Proprietary) Limited(50%)
Manufacturer and distributor of brandedalcoholic and other beverages (associate)
• Tanzania Distilleries Limited (35%)
Manufacturers of wine
• Lusan Holdings (Proprietary) Limited (50%)
• Papkuilsfontein (Proprietary) Limited (49%)
Distell Group LimitedListed on the JSE SecuritiesExchange South Africa
DISTELL
Joint ventures and associates
South African Distilleries and Wines (SA) Limited (100%)
Other investors10%
Other Beverage Interests(Proprietary) Limited(“SABMiller”) 30%
Remgro-KWVInvestments Limited
60%
Our group
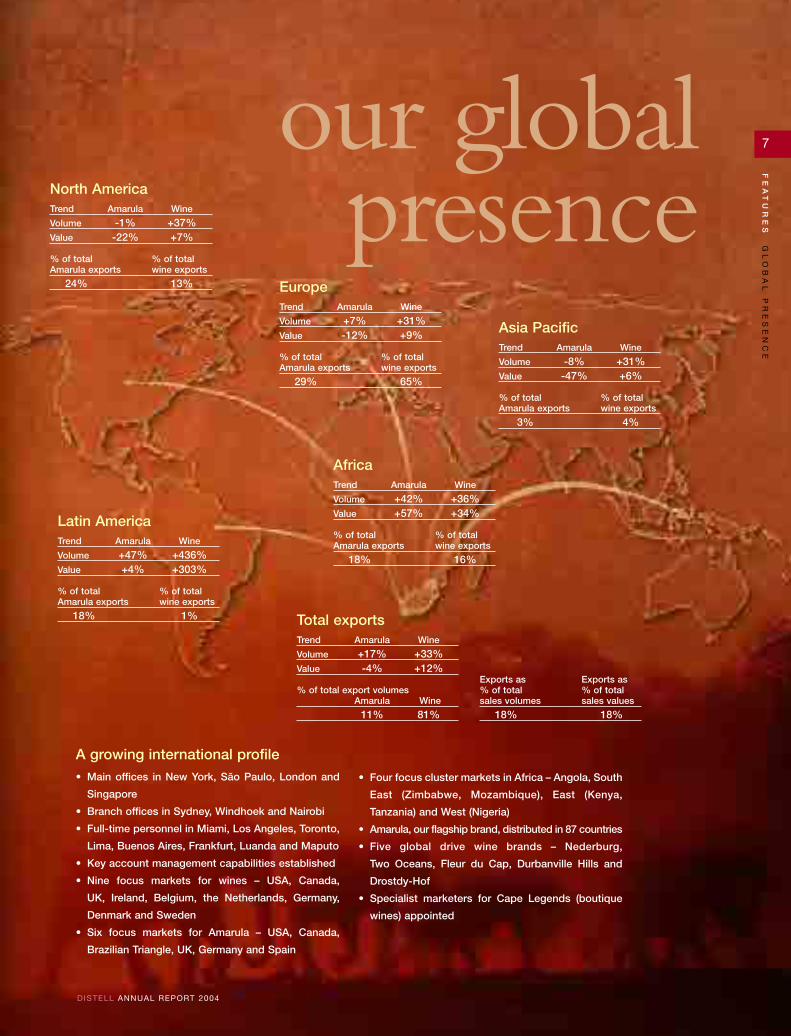
A growing international profile• Main offices in New York, São Paulo, London and
Singapore
• Branch offices in Sydney, Windhoek and Nairobi
• Full-time personnel in Miami, Los Angeles, Toronto,
Lima, Buenos Aires, Frankfurt, Luanda and Maputo
• Key account management capabilities established
• Nine focus markets for wines – USA, Canada,
UK, Ireland, Belgium, the Netherlands, Germany,
Denmark and Sweden
• Six focus markets for Amarula – USA, Canada,
Brazilian Triangle, UK, Germany and Spain
• Four focus cluster markets in Africa – Angola, South
East (Zimbabwe, Mozambique), East (Kenya,
Tanzania) and West (Nigeria)
• Amarula, our flagship brand, distributed in 87 countries
• Five global drive wine brands – Nederburg,
Two Oceans, Fleur du Cap, Durbanville Hills and
Drostdy-Hof
• Specialist marketers for Cape Legends (boutique
wines) appointed
our globalpresence
EuropeTrend Amarula Wine
Volume +7% +31%Value -12% +9%
% of total % of totalAmarula exports wine exports
29% 65%
AfricaTrend Amarula Wine
Volume +42% +36%Value +57% +34%
% of total % of totalAmarula exports wine exports
18% 16%
Latin AmericaTrend Amarula Wine
Volume +47% +436%Value +4% +303%
% of total % of totalAmarula exports wine exports
18% 1% Total exportsTrend Amarula Wine
Volume +17% +33%Value -4% +12%
% of total export volumesAmarula Wine
11% 81%
Exports as Exports as% of total % of totalsales volumes sales values
18% 18%
Asia PacificTrend Amarula Wine
Volume -8% +31%Value -47% +6%
% of total % of totalAmarula exports wine exports
3% 4%
North AmericaTrend Amarula Wine
Volume -1% +37%Value -22% +7%
% of total % of totalAmarula exports wine exports
24% 13%
7
FE
AT
UR
ES
GL
OB
AL
P
RE
SE
NC
E
D ISTELL ANNUAL REPORT 2004
Joe Madungandaba*Chief executive officer of Community InvestmentHoldings. Chairman of Marine Data Systems and deputychairperson of Transtel Audit Committee, executivedirector of Jasco Electronic Holdings Ltd and non-executive director of Air Liquide Healthcare.Attended 5 out of 6 meetings.
David Nurek*Regional chairman of Investec Western Cape, deputychairman of Foschini, and also a director of New ClicksHoldings, Pick ’n Pay,Aspen Pharmaceuticals and Trencor.Attended 4 out of 6 board meetings; 4 out of 4 auditcommittee meetings; and 5 out of 5 remunerationcommittee meetings.
Daan Prins*Business consultant, previously financial director ofRothmans International.Attended 6 out of 6 board meetings; and 4 out of 4 auditcommittee meetings.
Jan Scannell#
Managing directorAttended 6 out of 6 board meetings.
Peter Swartz*Proprietor of Swartz Properties (Pty) Ltd and also adirector of Absa, Ellerine, New Clicks, Sanlam and SunwestInternational.Attended 6 out of 6 board meetings; and 5 out of 5remuneration committee meetings.
Thys VisserDeputy chairman and chief executive officer of Remgroand also a director of Rainbow Chicken and Nampak.Attended 5 out of 6 board meetings; 4 out of 4 auditcommittee meetings; and 5 out of 5 remunerationcommittee meetings.
* Independent# Executive
8
FE
AT
UR
ES
BO
AR
D
D ISTELL ANNUAL REPORT 2004
The board is the focal point for the group’s execution of corporate governance.This body is ultimately accountable and responsible for the performance, affairsand behaviour of Distell, formalised in a charter for the board and its committees.
board mattersBoard of directors
Duimpie Bayly* Director of Duimpie Bayly & Associates, consultant andadviser to the wine industry.Attended 6 out of 6 board meetings.
Peter Bester*Retired as executive chairman of Cadbury Schweppes (SA)Ltd in 2001. He is currently director of ABI, AnglovaalIndustries, Suidwes Beleggings and National Brands.Appointed 28 April 2004.Attended 2 out of 2 board meetings.
Piet BeyersDirector of Remgro, Richemont, VenFin and Unilever-BestfoodsRobertsons.Attended 5 out of 6 board meetings.
Merwe Botha#
Financial directorAppointed 8 December 2003.Attended 4 out of 4 board meetings.
Johan Carinus*Wine farmer, also a director of Stellenbosch Vineyards andHet Jan Marais Fund.Attended 6 out of 6 board meetings.
Smartie Genade#
Operations directorAttended 6 out of 6 board meetings.
Jakes Gerwel*Served as director-general in the Office of former PresidentNelson Mandela. Presently director of Naspers, OldMutual, Goldfields, and chairman of Brimstone, AfriconEngineering and Educor. Also the chancellor of RhodesUniversity and chairman of the board of trustees of theNelson Mandela Foundation.Appointed 28 April 2004.Attended 1 out of 2 board meetings.
Dr Edwin de la H HertzogChairman of Medi-Clinic Corporation and also a directorof Remgro,Total (SA) and Trans Hex Group.Attended 5 out of 6 board meetings.
9
FE
AT
UR
ES
BO
AR
D
D ISTELL ANNUAL REPORT 2004
Executive management
Jan Scannell (53)Managing directorBCom, LLB
Jan joined the Distillers Corporation in 1979. He wasappointed as director in 1988, and as managing director in1994. In December 2000, he was appointed as managingdirector of Distell. Jan must ensure that the companydelivers on its objectives, and is responsible for building ahigh-performance culture.
Merwe Botha (51)Financial directorBCom Hons (Taxation), BCompt Hons, CA(SA)
Merwe joined the Distillers Corporation in 1980. He wasappointed financial director in 1997 and to his presentposition at Distell in December 2000. Merwe is responsiblefor financial planning and control, information technology,statutory reporting and internal audit.
Stoffel Cronjé (50)Company secretary and human resource director MA
Stoffel joined the Distillers Corporation in 1980. He wasappointed group secretary and human resource director in1990 and to his present position at Distell in December2000. Stoffel performs all statutory company secretarialfunctions. He also oversees the human resources division.
Smartie Genade (53)Operations director BCom (Hons), MBA
Smartie joined Stellenbosch Farmers’ Winery (SFW) in1972. He was appointed director in 1988,managing directorin 2000 and to his present position at Distell in December2000. Smartie oversees the operations of the group,including packaging, distribution, technical services,procurement and supply chain management.
Hennie Heÿl (58)Primary production directorMSc Agric
Hennie joined the Distillers Corporation in 1974. He wasappointed technical director in 1988, production directorin 1997 and to his present position at Distell in December2000. Hennie is responsible for our farms; grape, wine,brandy and other raw material procurement; distillation,winemaking and blending.
Etienne Heyns (49)International operations directorBCom (Hons), MBA
Etienne joined Distell as international operations directorin May 2002. He has over 20 years of experience ininternational marketing. Etienne is responsible for growingour international revenue by providing superior service toexisting customers and obtaining new listings.
Gert Loubser (56)Quality management and research directorMSc, PhD
Gert joined SFW in 1974. He was appointed research anddevelopment director in 1994 and to his present position atDistell in December 2000.Gert must ensure that total qualitymanagement is implemented throughout the group and thatongoing research leads to new products and processes.
Malcolm Searle (44)Marketing directorBCom (Hons)
Malcolm joined Distell as marketing director in January2004. He has almost 20 years experience in the FMCGbusiness, and has worked as marketing executive in severalcountries across the globe. Malcolm is responsible forbuilding strong brand portfolios on market strategies thatleverage consumer insights and drive innovation.
André Steyn (54)Corporate affairs directorBCom (Hons), LLB
André joined SFW in 1978. He was appointed humanresources, industry and corporate affairs director in 1990and to his present position at Distell in December 2000.André is responsible for managing the corporate reputation,internal communication and new business opportunities.
Tim Tarr (46)Sales director
Tim joined the Distillers Corporation in 1979. He wasappointed national sales director in 1995 and to his presentposition at Distell in December 2000.Tim must ensure thatwe retain and improve our market leadership in SouthAfrica, Botswana, Lesotho, Namibia and Swaziland. Heoversees all our sales forces.
Valerio Toros (41)Business process improvement directorBEng (Mech), MBA
Valerio joined the Distillers Corporation in 1991 as projectengineer. After overseeing the SFW/Distillers mergerimplementation from 2000 to 2001, he became the groupmanager of business process improvement (BPI). He wasappointed as BPI director at the end of 2003. Valerio isresponsible for the Distell Management Operating System(DMOS), and for major projects and initiatives to improvecompany performance.
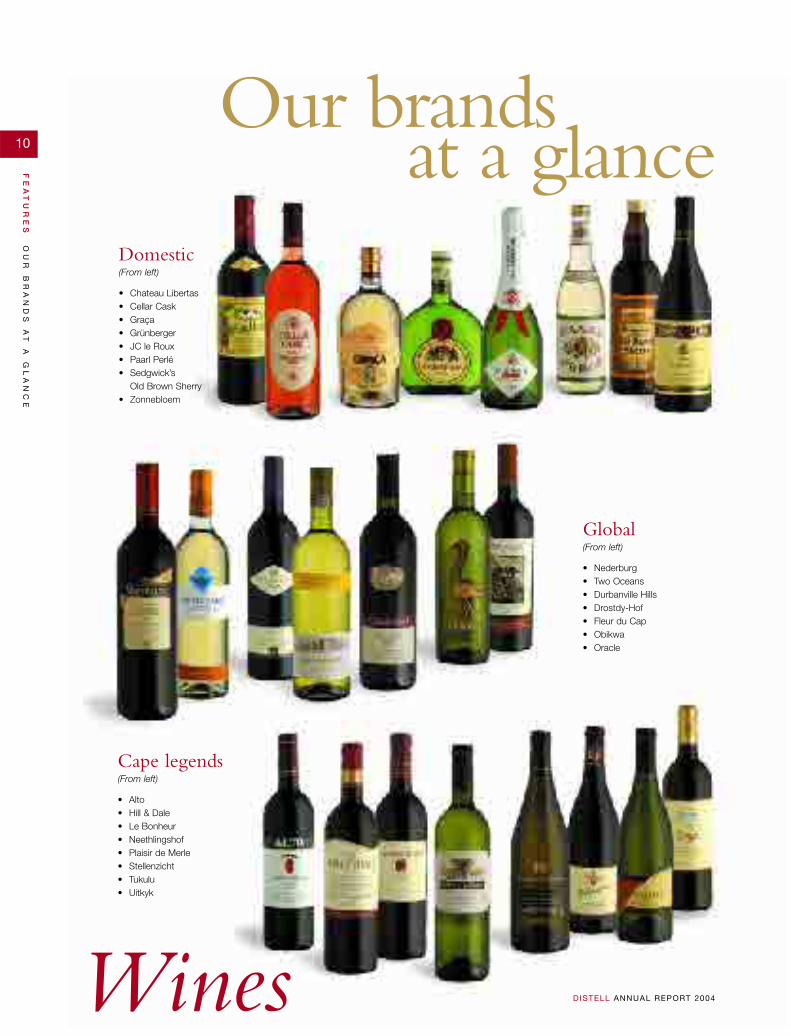
Domestic(From left)
• Chateau Libertas• Cellar Cask• Graça• Grünberger• JC le Roux• Paarl Perlé• Sedgwick’s
Old Brown Sherry• Zonnebloem
Global(From left)
• Nederburg• Two Oceans• Durbanville Hills• Drostdy-Hof• Fleur du Cap• Obikwa• Oracle
Cape legends(From left)
• Alto• Hill & Dale• Le Bonheur• Neethlingshof• Plaisir de Merle• Stellenzicht• Tukulu• Uitkyk
10
FE
AT
UR
ES
OU
R
BR
AN
DS
A
T
A
GL
AN
CE
D ISTELL ANNUAL REPORT 2004
Our brands at a glance
Wines
(From left)
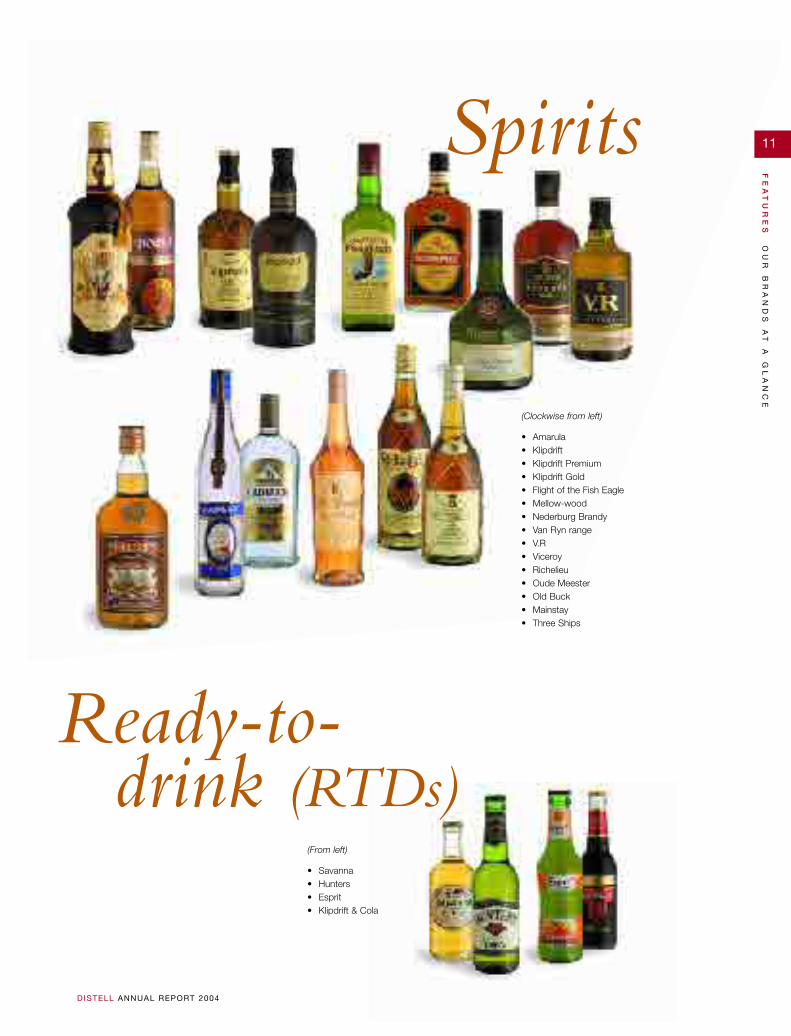
• Savanna• Hunters• Esprit• Klipdrift & Cola
(Clockwise from left)
• Amarula• Klipdrift • Klipdrift Premium• Klipdrift Gold• Flight of the Fish Eagle• Mellow-wood• Nederburg Brandy• Van Ryn range• V.R• Viceroy• Richelieu• Oude Meester• Old Buck• Mainstay• Three Ships
Ready-to-drink (RTDs)
11
FE
AT
UR
ES
OU
R
BR
AN
DS
A
T
A
GL
AN
CE
D ISTELL ANNUAL REPORT 2004
Spirits
12
FE
AT
UR
ES
SE
VE
N-
YE
AR
F
IN
AN
CI
AL
R
EV
IE
W
D ISTELL ANNUAL REPORT 2004
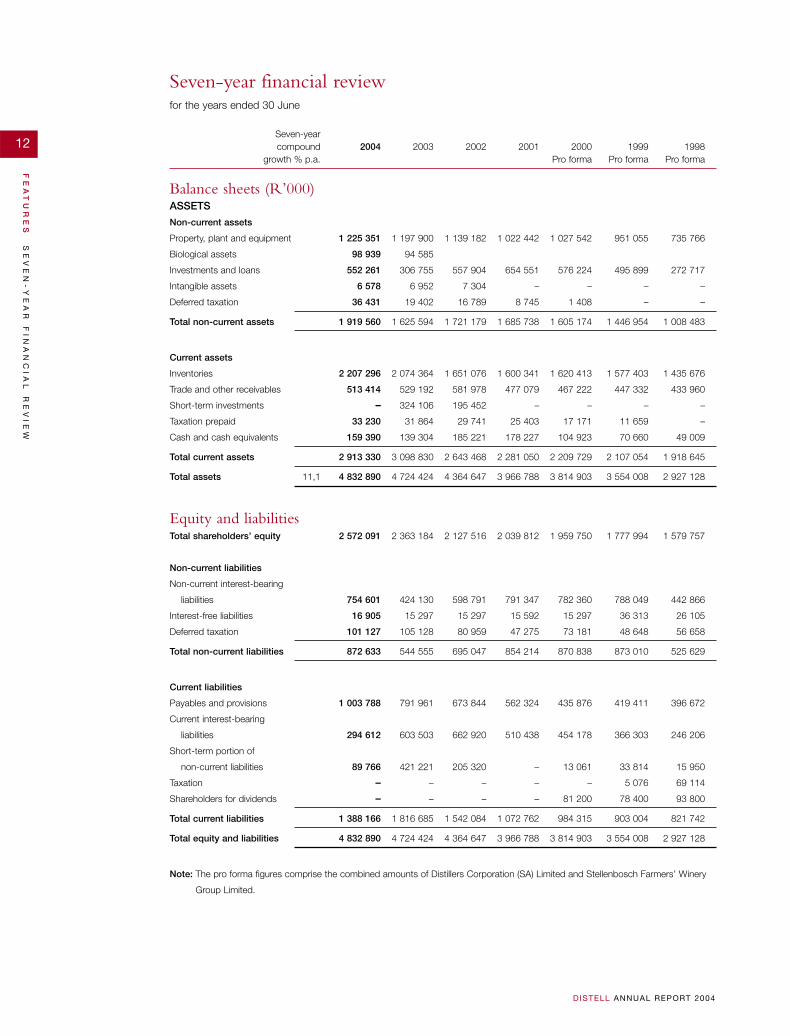
Seven-yearcompound 2004 2003 2002 2001 2000 1999 1998
growth % p.a. Pro forma Pro forma Pro forma
Balance sheets (R’000)ASSETS
Non-current assets
Property, plant and equipment 1 225 351 1 197 900 1 139 182 1 022 442 1 027 542 951 055 735 766
Biological assets 98 939 94 585
Investments and loans 552 261 306 755 557 904 654 551 576 224 495 899 272 717
Intangible assets 6 578 6 952 7 304 – – – –
Deferred taxation 36 431 19 402 16 789 8 745 1 408 – –
Total non-current assets 1 919 560 1 625 594 1 721 179 1 685 738 1 605 174 1 446 954 1 008 483
Current assets
Inventories 2 207 296 2 074 364 1 651 076 1 600 341 1 620 413 1 577 403 1 435 676
Trade and other receivables 513 414 529 192 581 978 477 079 467 222 447 332 433 960
Short-term investments – 324 106 195 452 – – – –
Taxation prepaid 33 230 31 864 29 741 25 403 17 171 11 659 –
Cash and cash equivalents 159 390 139 304 185 221 178 227 104 923 70 660 49 009
Total current assets 2 913 330 3 098 830 2 643 468 2 281 050 2 209 729 2 107 054 1 918 645
Total assets 11,1 4 832 890 4 724 424 4 364 647 3 966 788 3 814 903 3 554 008 2 927 128
Equity and liabilitiesTotal shareholders’ equity 2 572 091 2 363 184 2 127 516 2 039 812 1 959 750 1 777 994 1 579 757
Non-current liabilities
Non-current interest-bearing
liabilities 754 601 424 130 598 791 791 347 782 360 788 049 442 866
Interest-free liabilities 16 905 15 297 15 297 15 592 15 297 36 313 26 105
Deferred taxation 101 127 105 128 80 959 47 275 73 181 48 648 56 658
Total non-current liabilities 872 633 544 555 695 047 854 214 870 838 873 010 525 629
Current liabilities
Payables and provisions 1 003 788 791 961 673 844 562 324 435 876 419 411 396 672
Current interest-bearing
liabilities 294 612 603 503 662 920 510 438 454 178 366 303 246 206
Short-term portion of
non-current liabilities 89 766 421 221 205 320 – 13 061 33 814 15 950
Taxation – – – – – 5 076 69 114
Shareholders for dividends – – – – 81 200 78 400 93 800
Total current liabilities 1 388 166 1 816 685 1 542 084 1 072 762 984 315 903 004 821 742
Total equity and liabilities 4 832 890 4 724 424 4 364 647 3 966 788 3 814 903 3 554 008 2 927 128
Note: The pro forma figures comprise the combined amounts of Distillers Corporation (SA) Limited and Stellenbosch Farmers’ Winery
Group Limited.
Seven-year financial reviewfor the years ended 30 June
13
FE
AT
UR
ES
SE
VE
N-
YE
AR
F
IN
AN
CI
AL
R
EV
IE
W
D ISTELL ANNUAL REPORT 2004
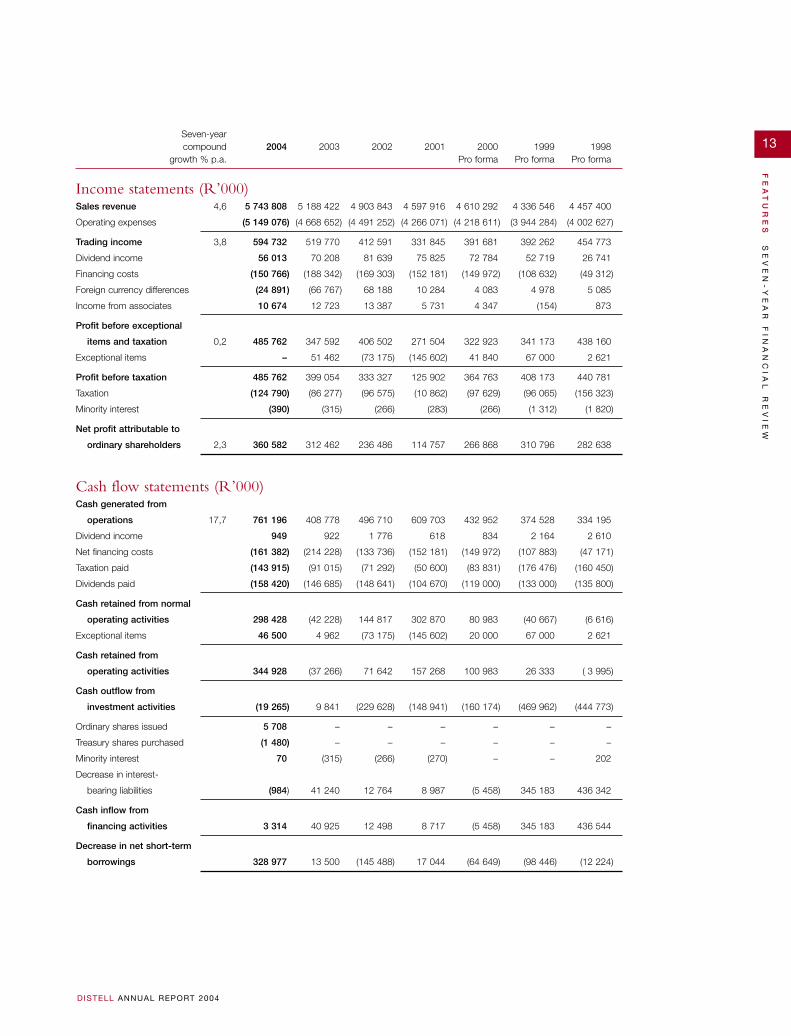
Seven-yearcompound 2004 2003 2002 2001 2000 1999 1998
growth % p.a. Pro forma Pro forma Pro forma
Income statements (R’000)Sales revenue 4,6 5 743 808 5 188 422 4 903 843 4 597 916 4 610 292 4 336 546 4 457 400
Operating expenses (5 149 076) (4 668 652) (4 491 252) (4 266 071) (4 218 611) (3 944 284) (4 002 627)
Trading income 3,8 594 732 519 770 412 591 331 845 391 681 392 262 454 773
Dividend income 56 013 70 208 81 639 75 825 72 784 52 719 26 741
Financing costs (150 766) (188 342) (169 303) (152 181) (149 972) (108 632) (49 312)
Foreign currency differences (24 891) (66 767) 68 188 10 284 4 083 4 978 5 085
Income from associates 10 674 12 723 13 387 5 731 4 347 (154) 873
Profit before exceptional
items and taxation 0,2 485 762 347 592 406 502 271 504 322 923 341 173 438 160
Exceptional items – 51 462 (73 175) (145 602) 41 840 67 000 2 621
Profit before taxation 485 762 399 054 333 327 125 902 364 763 408 173 440 781
Taxation (124 790) (86 277) (96 575) (10 862) (97 629) (96 065) (156 323)
Minority interest (390) (315) (266) (283) (266) (1 312) (1 820)
Net profit attributable to
ordinary shareholders 2,3 360 582 312 462 236 486 114 757 266 868 310 796 282 638
Cash flow statements (R’000)Cash generated from
operations 17,7 761 196 408 778 496 710 609 703 432 952 374 528 334 195
Dividend income 949 922 1 776 618 834 2 164 2 610
Net financing costs (161 382) (214 228) (133 736) (152 181) (149 972) (107 883) (47 171)
Taxation paid (143 915) (91 015) (71 292) (50 600) (83 831) (176 476) (160 450)
Dividends paid (158 420) (146 685) (148 641) (104 670) (119 000) (133 000) (135 800)
Cash retained from normal
operating activities 298 428 (42 228) 144 817 302 870 80 983 (40 667) (6 616)
Exceptional items 46 500 4 962 (73 175) (145 602) 20 000 67 000 2 621
Cash retained from
operating activities 344 928 (37 266) 71 642 157 268 100 983 26 333 ( 3 995)
Cash outflow from
investment activities (19 265) 9 841 (229 628) (148 941) (160 174) (469 962) (444 773)
Ordinary shares issued 5 708 – – – – – –
Treasury shares purchased (1 480) – – – – – –
Minority interest 70 (315) (266) (270) – – 202
Decrease in interest-
bearing liabilities (984) 41 240 12 764 8 987 (5 458) 345 183 436 342
Cash inflow from
financing activities 3 314 40 925 12 498 8 717 (5 458) 345 183 436 544
Decrease in net short-term
borrowings 328 977 13 500 (145 488) 17 044 (64 649) (98 446) (12 224)
14
FE
AT
UR
ES
SE
VE
N-
YE
AR
F
IN
AN
CI
AL
R
EV
IE
W
D ISTELL ANNUAL REPORT 2004
Seven-yearcompound 2004 2003 2002 2001 2000 1999 1998
growth % p.a. Pro forma Pro forma Pro forma
Performance per share (cents)Earnings
attributable earnings basis 2,3 184,3 159,8 120,9 58,7 136,4 158,9 144,5
headline basis 3,3 183,3 130,1 110,4 106,1 116,5 123,3 139,5
cash equivalent basis 2,2 219,1 162,6 143,5 103,6 171,5 179,1 183,6
Dividends 5,2 97,0 75,0 70,0 53,0 62,3 60,1 69,4
Cash flow 28,9 257,3 55,9 112,6 133,9 112,5 81,5 67,4
Net asset value 8,7 1 309,9 1 208,3 1 087,8 1 043,0 1 002,0 909,1 807,7
Liquidity and solvencyFinancial gearing ratio 0,38 0,55 0,60 0,55 0,58 0,63 0,42
Total liabilities on total equity Avg 1,0 0,88 1,00 1,05 0,94 0,95 1,00 0,85
Interest-free liabilities on
total assets 0,21 0,17 0,16 0,15 0,14 0,16 0,21
Dividend cover (times) 1,9 1,7 1,6 2,0 1,9 2,0 2,0
Current ratio 2,10 1,71 1,71 2,13 2,24 2,33 2,33
Acid test ratio 0,51 0,56 0,64 0,63 0,60 0,59 0,59
Returns (%)Trading income on turnover 10,4 10,0 8,4 7,2 8,5 9,0 10,2
Pre-tax return on equity Avg 18,2 18,9 16,9 15,7 6,2 18,6 23,0 27,9
Effective tax rate 25,7 21,6 29,0 8,6 26,8 23,5 35,5
Return on equity Avg 12,5 13,9 10,8 10,2 10,2 11,6 13,6 17,4
Attributable earnings on
total assets 7,5 6,6 5,4 2,9 7,0 8,7 9,7
Attributable earnings on
turnover 6,3 6,0 4,8 2,5 5,8 7,2 6,3
Dividend yield 5,7 5,8 6,9 6,7 7,7 12,7 5,5
ProductivityCash value added (R million) 7,6 2 314,7 1 794,6 1 704,6 1 727,4 1 601,3 1 479,8 1 513,3
Net asset turn (times) 2,2 2,2 2,3 2,3 2,4 2,4 2,8
Net assets per
employee (R’000) 16,2 614,7 544,3 468,6 401,7 333,9 290,3 236,5
Turnover per
employee (R’000) 11,9 1 372,8 1 194,9 1 080,1 905,5 785,4 708,1 667,4
Number of employees 4 184 4 342 4 540 5 078 5 870 6 124 6 679
Seven-year financial reviewfor the years ended 30 June
15
FE
AT
UR
ES
AN
AL
YS
IS
O
F
SH
AR
EH
OL
DE
RS
D ISTELL ANNUAL REPORT 2004
Number of % of Number of % of issuedOrdinary shares holders holders shares shares
Distribution of shareholdersPublic shareholders 3 250 99,00 19 244 164 9,80
Non-public shareholders
Major beneficial shareholders 2 0,06 176 022 000 89,64
Directors, including those of subsidiaries, and
their associates 30 0,91 889 150 0,46
The Distell Group Share Trust 1 0,03 201 322 0,10
3 283 100,00 196 356 636 100,00
Number of shares in issue2004 2003
Total number of shares in issue 196 356 636 195 580 000
Shares purchased by The Distell Group Share Trust
and accounted for as treasury shares (201 322) –
196 155 314 195 580 000
Weighted number of shares 195 625 710 195 580 000
Major beneficial shareholdersThe following shareholders have a holding of greater than 5% of the issued shares of the company:
Number of % ofshares total
Remgro-KWV Investments Limited 117 348 000 59,76
Other Beverage Interests (Proprietary) Limited (“SABMiller”) 58 674 000 29,88
JSE Securities Exchange South Africa2004 2003 2002 2001 2000 1999 1998
Price per share (cents)
highest during the year 1 725 1 500 1 500 1 000 1 050 810 1 800
lowest during the year 1 100 1 105 735 675 690 400 700
closing at year-end 1 500 1 201 1 350 730 870 810 700
weighted average 1 418 1 287 1 008 788 869 527 1 227
Price earnings ratio 8,1 7,5 11,2 12,4 6,0 6,0 5,6
JSE Actuaries’ price index at
year-end (1997: 100 cents)
Distell Group Limited 96 77 87 47 56 52 45
Closing price/net asset value per share 1,1 1,0 1,2 0,7 1,2 1,3 1,2
Weighted average number of shares
in issue (’000) 195 626 195 580 195 580 195 580 140 000 140 000 140 000
Number of shares traded (’000) 3 533 2 784 6 263 3 647 2 224 4 646 2 765
Shares traded/shares in issue (%) 1,8 1,4 3,2 1,9 1,6 3,3 2,0
Value of shares traded (R’000) 50 114 35 833 63 124 28 722 19 323 24 497 33 928
Number of transactions 1 069 981 1 386 1 220 749 1 197 850
Number of shareholders 3 283 3 389 1 738 2 268 2 042 2 131 2 108
Market capitalisation (R million) 2 934 2 349 2 640 1 428 1 218 1 134 980
Net asset value/market capitalisation 0,88 1,01 0,81 1,43 0,86 0,79 0,82
Information for the period 1998 to 2000 refers to the listed shares of Distillers Corporation (SA) Limited.
Analysis of shareholdersat 30 June 2004
16
RE
VI
EW
SC
HA
IR
MA
N’
S
ST
AT
EM
EN
T
D ISTELL ANNUAL REPORT 2004DISTELL ANNUAL REPORT 2004
The past year has been characterised by a much
strengthened rand, reduced inflation, lower interest rates
and accelerated discretionary spending among South
Africa’s middle and higher income groups on the one
hand, but slower spending by lower income consumers,
who comprise the majority of South Africans, on the
other. Job shedding prompted by a more robust currency
that has made the country’s exports less price-competitive
on international markets, the growing impact of HIV/Aids
and adverse weather conditions in many agricultural areas
continue to erode their already limited spending power.
Understandably, the domestic market for alcoholic
beverages experienced muted growth, showing a volume
increase for the past year of just 1,9%, with beer the main
contributor.
A stronger rand has had a significant impact on much of
the local liquor industry, particularly the wine sector,
where there has been increasing consolidation in an effort
to maintain a presence on international markets. Over the
past few years, some local wine producers have used a weak
rand as their single biggest competitive advantage. Now
that this has been lost to them, their profit margins have
suffered, particularly in the face of a global oversupply of
wine, compounded by a record 2004 vintage, which has
delivered exceptional tonnage and quality. Californian
producers, now aided by a weaker dollar, Australian and
New Zealand producers are seeking new ways to market
their wines and deplete their build-up of stocks from
earlier vintages. At the same time, the beleaguered French
industry has responded to changed market conditions with
a revitalised and more competitive operating system. It
should be noted that while these countries are supported
by government subsidies in their efforts, no such benefit is
available to the South African wine industry.
Domestic competition has intensified, with producers
unable or unwilling to sell their wines abroad, courting
local consumers more assiduously then ever, buoyed by
greater variety and aggressive pricing strategies.
Simultaneously, a strong rand has made South Africa a
favourable market for foreign producers.
Distell was forced to stringently review its operating costs
at the start of the decade and to rationalise its product
ranges while servicing a variety of price points in both
retail and on-consumption segments, inculcating a culture
of fiscal discipline.This, coupled with an ongoing policy of
brand building that eschews discounting as a tactic of
growing market share in favour of investing in trademarks
for the long term, has accorded us a measure of resilience
against these conditions.
We have also been cushioned to some extent by our strong
domestic support base across a wide spectrum of products
and pricing segments in wine, spirits and ready-to-drink
alcoholic beverages (RTDs). Given our focus on both retail
and on-consumption channels in export markets, our
vulnerability to the advancing power of the multiple
grocers in many key export markets has also been
contained.
The company also continues to find ways of making the
supply chain more cost-efficient through research and
partnerships with supplier growers, planning wines in the
vineyard and matching growing costs to the eventual selling
prices, production site energy audits, judicious use of water
and recycling. Our suppliers are responding in similar vein
and are passing on the benefits of a stronger rand.
Notwithstanding a stronger currency and a decline in
global tourism, South Africa remains an attractive tourist
destination, particularly for Europeans and North
Americans, and the country has continued to outperform
its key competitors. The Cape and the winelands have
grown in popularity, along with leading game parks and
lodges.This development has been good for Amarula, the
country’s most widely distributed alcoholic beverage, and
for our portfolio of wines.CONTINUED OVERLEAF
A statement from Distell’schairman, David Nurek
a challengingyear
PH
OT
OG
RA
PH
ER
:A
DR
IAA
N O
OS
TH
UIZ
EN
I
NS
PIR
ER
:S
ELW
YN
G
RA
HA
M
SH
OT
ON
LO
CA
TIO
N A
T S
HO
OT
ER
S,
ST
RA
ND

17
RE
VI
EW
SC
HA
IR
MA
N’
S
ST
AT
EM
EN
T
D ISTELL ANNUAL REPORT 2004
Inclusive teamwork,commitment and
innovation are SelwynGraham’s cornerstoneof delivering superior
service levels andworld-class quality.
18
RE
VI
EW
SC
HA
IR
MA
N’
S
ST
AT
EM
EN
T
D ISTELL ANNUAL REPORT 2004
The company is also actively engaged in promoting the
biodiversity of the Cape, in the interests of nature conser-
vation and ecotourism, and has played a vital role in the
establishment of the Biodiversity and Wine Initiative. Its
guidelines, set out in the Biodiversity Bill and scheduled to
become law during 2004,have in many instances already been
implemented in our own vineyards and those of our suppliers.
They have also been incorporated into South Africa’s very
progressive Integrated Production of Wine system that
promotes sustainable winegrowing and production.
Encouragingly, both Government and the private sector
have heightened their focus on broad-based black
economic empowerment (BEE). Distell is actively involved
in the shaping of the Liquor Industry Charter that has been
reviewing the entire manufacturing and distribution chain,
from ownership and management to employee equity and
skills development, procurement practices, enterprise
development and social investment. The company serves
on the Charter’s steering committee and is represented on
all its working groups.At the same time, the Wine Industry
Charter, facilitated by the SA Wine and Brandy Company,
is making headway in setting targets in all these areas
pertaining to wine.
Internally, BEE is a drive project of Distell. We are co-
ordinating and strengthening our focus in areas such
as preferential procurement, enterprise and skills
development, employment equity and corporate social
investment.
The inclusion of a broad-based black shareholder in Distell
is currently being attended to by a subcommittee of the
board of directors.
As a founding member of the Wine Industry Ethical Trade
Association (WIETA) we have been contributing to the
development of its code of socially responsible and ethical
labour practices. All 18 of our sites are being evaluated by
the NGO’s independent audit committee, a process due
for completion later in 2004. The audit process covers a
comprehensive range of issues such as health and safety;
freedom of association; the right of workers to participate
in decisions affecting them; worker benefits and
conditions; child labour; fair disciplinary procedures; and
the sourcing of and contractual obligations to seasonal
workers.
The finalisation of the Liquor Act and its implementation
are to be welcomed as the culmination of constructive
negotiation between Government, producers, wholesalers,
distributors and retailers and as a boost for BEE. Not only
does the bill encourage diversity of ownership across all
three tiers of the industry, but it also provides a more stable
basis from which to promote the responsible consumption
of alcohol.
However, we are concerned at the tardiness to effect
legislation at provincial level.To date, just two of the nine
provinces have promulgated liquor licensing legislation –
Gauteng and Eastern Cape, and both of these are
fundamentally flawed in that they create more confusion
and bureaucracy. There is an urgent need to formalise
retail trade in a way that is acceptable to producers, sellers
and consumers and that makes it possible to effectively
advance responsible drinking.
Another issue that requires urgent consideration is the
discriminatory level of excise duties applied to wine, which
CONTINUED FROM PAGE 16
Distell is actively involved in the shaping of the Liquor Industry
Charter that has been reviewing the entire manufacturing and
distribution chain, from ownership and management to employee
equity and skills development, procurement practices, enterprise
development and social investment.
19
RE
VI
EW
SC
HA
IR
MA
N’
S
ST
AT
EM
EN
T
D ISTELL ANNUAL REPORT 2004
last February were increased 30,7%, and spirits, which rose
13,8%, while beer went up just 9%.
We are of the view that excess consumption of all alcoholic
beverages and under-age drinking is best addressed
through holistic measures that identify and target
vulnerable groups with appropriate interventions such as
education and life-skills programmes for consumers;
training licensees in how to develop and entrench a culture
of moderation among their patrons; counselling and
rehabilitating abusers; and by adopting responsible
advertising, packaging, promotion and sales. This is the
route we have taken through our industry body, the
Industry Association for the Responsible Use of Alcohol
(ARA) of which we are a leading corporate member.
We are gratified by the considerable progress made by
Government in combating illicit liquor trading. However,
cross-border activities such as round-tripping and
smuggling continue, partially exacerbated by such high
excise duties, thus providing another compelling reason for
a revision in State policy towards taxation of wines and
spirits.
We welcome three new directors to our board. They are
Peter Bester, former executive chairman of Cadbury
Schweppes (SA) Limited and a director of several other
boards, who brings a wealth of business and marketing
expertise, Merwe Botha, Distell’s financial director, whose
financial acumen is well established, and Jakes Gerwel,
former director-general in the Office of the State
President, chairman of the board of trustees of the Nelson
Mandela Foundation, chancellor of Rhodes University and
a director of several major corporates. Professor Gerwel’s
academic and socio-economic insights and his contri-
bution to business are greatly valued.
On behalf of the board, I express our appreciation to every
member of Distell for their hard work, expertise and
commitment and their role in delivering a solid
performance in undoubtedly difficult circumstances.
DM Nurek
Chairman
16 August 2004
20
RE
VI
EW
SM
AN
AG
IN
G
DI
RE
CT
OR
’S
R
EP
OR
T
D ISTELL ANNUAL REPORT 2004
OverviewWe continued to improve performance across various
dimensions of our business during the year under review,
making considerable progress towards achieving the
important objectives we set ourselves four years ago.These
are:
• To grow our international business
• To capture the true potential of our brands in the
domestic market
• To reduce our cost base through continuous process
improvement in order to fund international expansion,
while simultaneously meeting short-term shareholder
expectations
Although much still needs to be done to fulfil our
aspirations, we can reflect on four years of continuous
improvement.
This year, headline earnings grew 41,0%. Profit before
taxation and exceptional items rose 39,8%, achieving
cumulative annual growth of 21,3% over a three-year
period.
The extremely volatile exchange rates since 2001 have
obviously impacted on our performance, given that we are
a substantial exporter of wines and spirits. Over the past
year alone, the rand strengthened by 16,4% on average
against the currencies of the countries in which we trade
and our performance should be evaluated in this context.
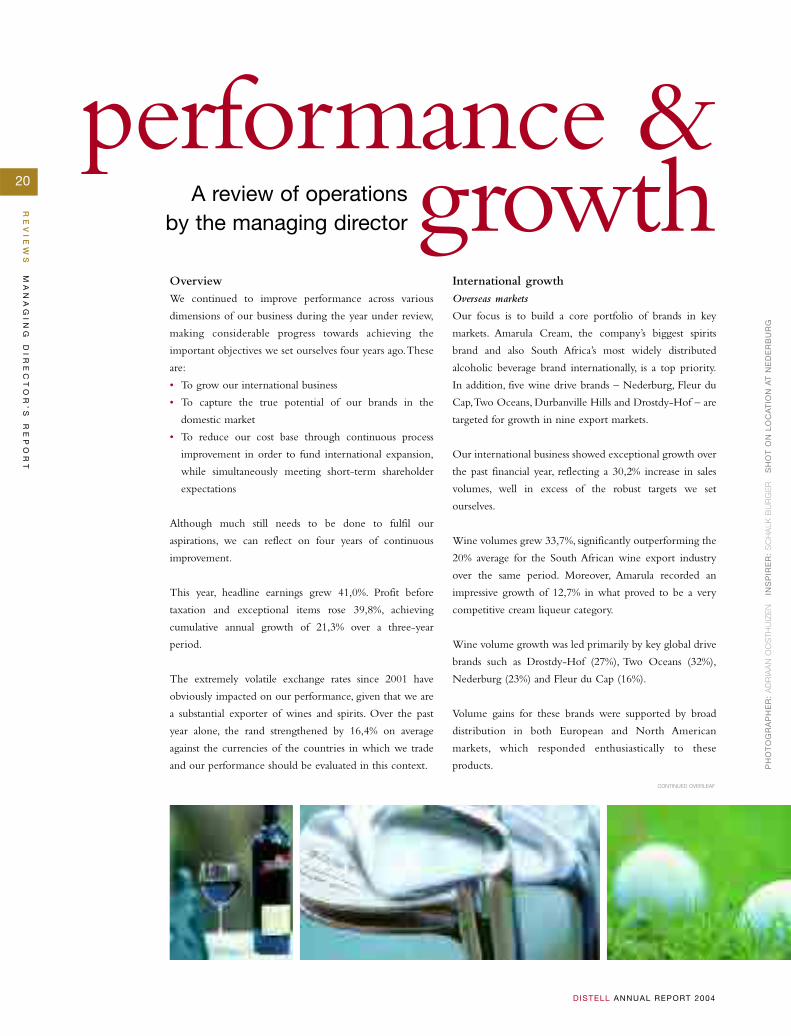
International growthOverseas markets
Our focus is to build a core portfolio of brands in key
markets. Amarula Cream, the company’s biggest spirits
brand and also South Africa’s most widely distributed
alcoholic beverage brand internationally, is a top priority.
In addition, five wine drive brands – Nederburg, Fleur du
Cap,Two Oceans, Durbanville Hills and Drostdy-Hof – are
targeted for growth in nine export markets.
Our international business showed exceptional growth over
the past financial year, reflecting a 30,2% increase in sales
volumes, well in excess of the robust targets we set
ourselves.
Wine volumes grew 33,7%, significantly outperforming the
20% average for the South African wine export industry
over the same period. Moreover, Amarula recorded an
impressive growth of 12,7% in what proved to be a very
competitive cream liqueur category.
Wine volume growth was led primarily by key global drive
brands such as Drostdy-Hof (27%), Two Oceans (32%),
Nederburg (23%) and Fleur du Cap (16%).
Volume gains for these brands were supported by broad
distribution in both European and North American
markets, which responded enthusiastically to these
products.
CONTINUED OVERLEAF
A review of operationsby the managing director
performance &growth
PH
OT
OG
RA
PH
ER
:A
DR
IAA
N O
OS
TH
UIZ
EN
I
NS
PIR
ER
:S
CH
ALK
BU
RG
ER
S
HO
T O
N L
OC
AT
ION
AT
NE
DE
RB
UR
G
21
RE
VI
EW
SM
AN
AG
IN
G
DI
RE
CT
OR
’S
R
EP
OR
T
D ISTELL ANNUAL REPORT 2004
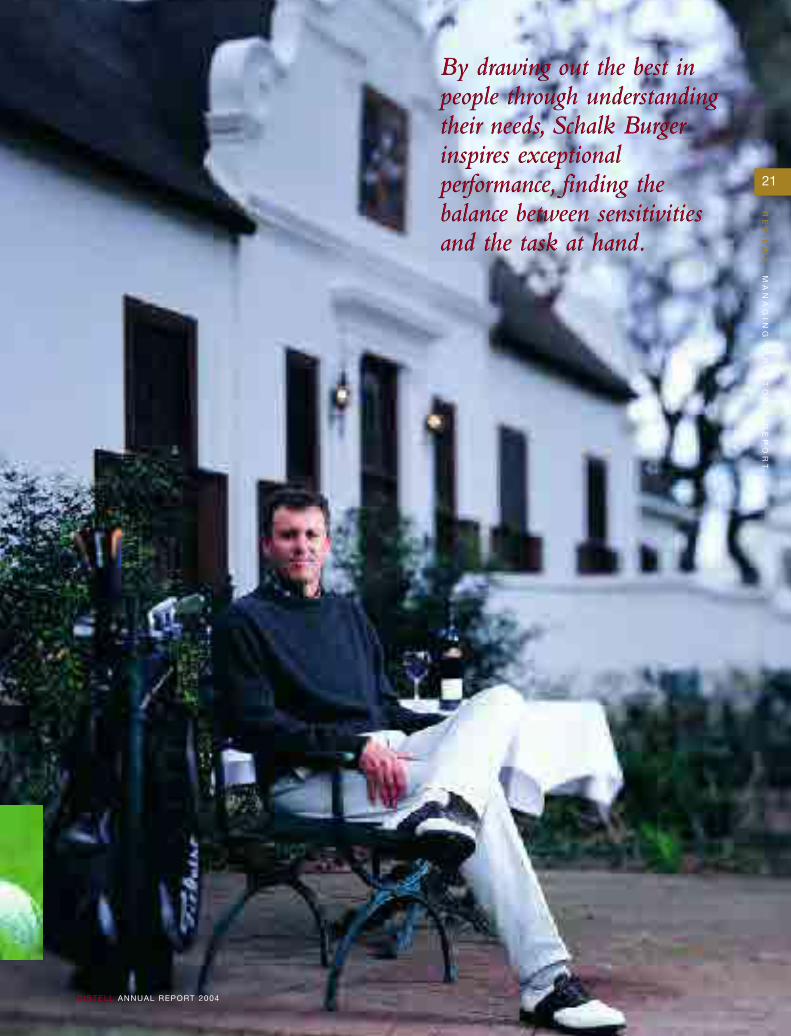
By drawing out the best inpeople through understandingtheir needs, Schalk Burgerinspires exceptionalperformance, finding thebalance between sensitivitiesand the task at hand.
By drawing out the best inpeople through understandingtheir needs, Schalk Burgerinspires exceptionalperformance, finding thebalance between sensitivitiesand the task at hand.
22
RE
VI
EW
SM
AN
AG
IN
G
DI
RE
CT
OR
’S
R
EP
OR
T
D ISTELL ANNUAL REPORT 2004
We also strengthened our presence through listings with
multiple retailers globally, giving us greater product
exposure, although numerous opportunities remain to
be exploited. Our performance and participation in
the multiple grocer distribution environment of the
Netherlands and the United Kingdom, did not meet
expectations. Consequently, new strategies are being
pursued. These include the restructuring of our direct
selling arm in Europe as well as of our agent network
worldwide to capitalise on profitable opportunities.
Amarula Cream’s growth has come from key markets such
as the US, Canada, Germany, Scandinavia, Brazil and the
UK. The brand continued to outperform the category,
notwithstanding increased competition, which saw a
number of new cream liqueur launches and substantial
investments by the major liquor companies.
International sales revenue increased by just 4,3% mainly
due to the strengthening of the rand. Our challenge
remains to protect margins through a continued focus on
achieving greater efficiency throughout the value chain.
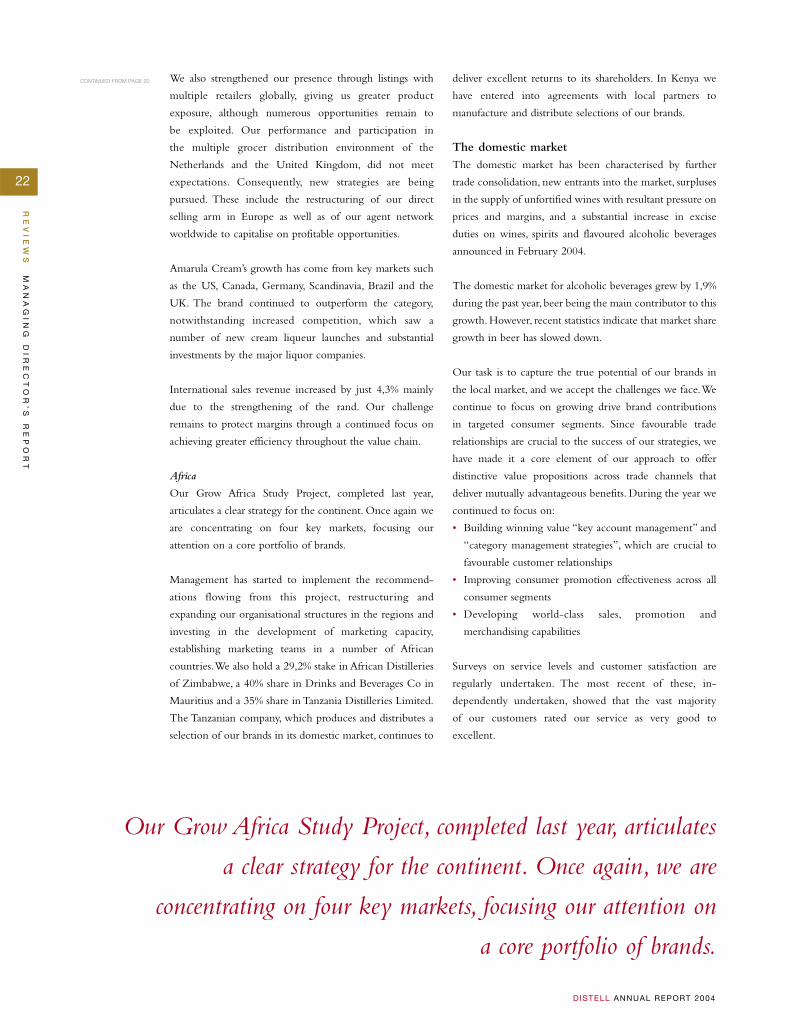
Africa
Our Grow Africa Study Project, completed last year,
articulates a clear strategy for the continent. Once again we
are concentrating on four key markets, focusing our
attention on a core portfolio of brands.
Management has started to implement the recommend-
ations flowing from this project, restructuring and
expanding our organisational structures in the regions and
investing in the development of marketing capacity,
establishing marketing teams in a number of African
countries.We also hold a 29,2% stake in African Distilleries
of Zimbabwe, a 40% share in Drinks and Beverages Co in
Mauritius and a 35% share in Tanzania Distilleries Limited.
The Tanzanian company, which produces and distributes a
selection of our brands in its domestic market, continues to
deliver excellent returns to its shareholders. In Kenya we
have entered into agreements with local partners to
manufacture and distribute selections of our brands.
The domestic marketThe domestic market has been characterised by further
trade consolidation, new entrants into the market, surpluses
in the supply of unfortified wines with resultant pressure on
prices and margins, and a substantial increase in excise
duties on wines, spirits and flavoured alcoholic beverages
announced in February 2004.
The domestic market for alcoholic beverages grew by 1,9%
during the past year, beer being the main contributor to this
growth. However, recent statistics indicate that market share
growth in beer has slowed down.
Our task is to capture the true potential of our brands in
the local market, and we accept the challenges we face.We
continue to focus on growing drive brand contributions
in targeted consumer segments. Since favourable trade
relationships are crucial to the success of our strategies, we
have made it a core element of our approach to offer
distinctive value propositions across trade channels that
deliver mutually advantageous benefits. During the year we
continued to focus on:
• Building winning value “key account management” and
“category management strategies”, which are crucial to
favourable customer relationships
• Improving consumer promotion effectiveness across all
consumer segments
• Developing world-class sales, promotion and
merchandising capabilities
Surveys on service levels and customer satisfaction are
regularly undertaken. The most recent of these, in-
dependently undertaken, showed that the vast majority
of our customers rated our service as very good to
excellent.
Our Grow Africa Study Project, completed last year, articulates
a clear strategy for the continent. Once again, we are
concentrating on four key markets, focusing our attention on
a core portfolio of brands.
CONTINUED FROM PAGE 20
23
RE
VI
EW
SM
AN
AG
IN
G
DI
RE
CT
OR
’S
R
EP
OR
T
D ISTELL ANNUAL REPORT 2004
Distell’s overall volumes in the domestic market remained
constant.This was due in part to the loss of the distribution
rights to the Martell and KWV 10 and 20-year-old brandies
in terms of a ruling by the Competitions Tribunal in
June 2003. However, the loss of these brandy trademarks, as
well as a decline in sales volumes of unfortified wines, was
offset by growth elsewhere in the portfolio.
Marketing activity
Distell is the owner of a well-balanced portfolio of
trademarks. Consumer branding is at the heart of
everything we do and starts with marketing strategy as a
driver of business strategy.
Our long-term success depends on our ability to continue
to build and develop a well-balanced portfolio of brands to
satisfy consumer needs. Our approach is to improve market
segmentation, consumer understanding, brand positioning
and investment decision-making, effective market
execution and measuring trade implementation.
Constant innovation is essential in all facets of marketing
and is at the heart of a newly embarked on marketing
renewal programme that seeks to deliver a new excitement
and agility to our brands and our marketing people.
We have introduced improved measures to sharpen our
consumer insights and to manage consumer knowledge,
while a new focus on market activation will also provide
consumers the opportunity to encounter our brands with
greater frequency and impact.
Operational efficienciesOperational management continued to improve
efficiencies, customer service levels, product quality and
cost-effectiveness, with most key performance indicators
showing significant improvement on previous years.
Since effective procurement practices provide the most
important opportunity to reduce our overall cost base, they
remain a top priority. By closely collaborating with key
suppliers we have succeeded in protecting margins
previously eroded by the volatility in the exchange rate.
Some operational highlights were:
• ISO 9001:2000 listings achieved by all our distribution
centres located in South Africa
• A gold medal earned by our distribution arm at the 2004
Logistics Achiever of the Year Awards
• The International Food Standards (IFS) higher-level
certification accorded the Adam Tas cellars, responsible
for a high percentage of export wines. As far as we are
aware, this makes Distell the first South African wine
producer and marketer to attain this IFS level.
• Both Adam Tas and sparkling wine production centre,
JC le Roux received British Retail Certification.
• Global Conformity Services audited JC le Roux and
Nederburg for HACCP and has recommended
certification.
Financial and operational performance
Effect of the change in accounting policyDistell’s accounting policy has been changed to comply
with the new South African Statement of Generally
Accepted Accounting Practice (GAAP) dealing with
Agriculture (AC137). In accordance with this new
statement, vineyards owned by the group must be valued at
fair value. Fair value was calculated by discounting net cash
flows of the vineyards over the balance of their lifespan at
an appropriate discount rate.
The effect of this change in the period under review is
not material. Comparative figures for the year ended
30 June 2003 have been restated, reducing trading income
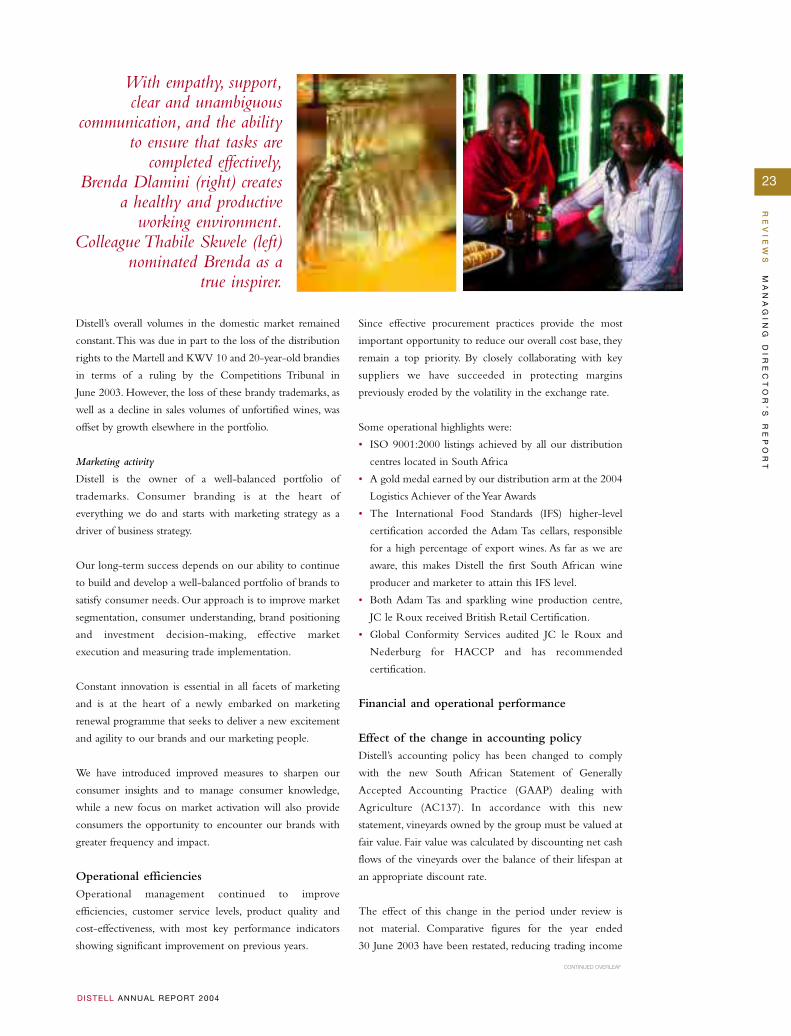
With empathy, support,clear and unambiguous
communication, and the abilityto ensure that tasks are
completed effectively,Brenda Dlamini (right) creates
a healthy and productiveworking environment.
Colleague Thabile Skwele (left)nominated Brenda as a
true inspirer.
CONTINUED OVERLEAF
24
RE
VI
EW
SM
AN
AG
IN
G
DI
RE
CT
OR
’S
R
EP
OR
T
D ISTELL ANNUAL REPORT 2004
by R21,3 million and headline earnings by R17,4 million.
(See notes 2 and 32 to the financial statements on
pages 59 and 78.)
Sales revenueSales revenue grew 10,7% to R5,7 billion on a sales volume
increase of 1,9%.
Total sales volumes for the second six months of the
financial year showed a strong growth of 5,2% on the
corresponding period of the previous year.
International sales volume growth outpaced sales growth in
the domestic market further improving overall sales mix,
given the increased geographic spread of our activities. Sales
volumes outside South Africa accounted for 18,3%
(2003: 17,1%) of total sales volumes.
Locally, sales volumes showed marginal growth of 0,4% but
reflected a more profitable product mix. Our trademarks in
the important spirits category performed better than our
other categories. Although Distell relinquished its
distribution rights to the Martell brandies at the beginning
of the financial year, and the KWV brandies during the
third quarter, spirit volumes were still able to grow 2,0%. If
Martell sales are excluded, spirit volumes actually showed a
growth of 7,4%, with brandy reflecting an increase of 7,9%.
However, sales volumes of unfortified wine came under
pressure, declining 2,7% because of increased product and
price competition that stemmed from a stronger focus on
the local market by domestic and international players.
Although the market for ready-to-drink alcoholic
beverages (RTDs) remains extremely competitive, Distell
succeeded in achieving marginal volume growth in this
category.
International sales volumes, excluding Africa, increased
30,2%. Volume growth for both Amarula Cream and
unfortified wines accelerated this year. Amarula Cream
achieved volume growth of 12,7% (2003: 8,1%) and
unfortified wines 33,7% (2003: 19,3%). However,
international sales revenue, mainly as a result of the
substantial improvement in the value of the rand, grew
by just 4,3%.
Sales revenue derived from African countries (including
BLNS countries) increased 12,3%.
Trading incomeThe increase in trading income was driven largely by
increased sales revenue, a continued improvement in sales
mix and margins, disciplined cost management and the
containment of overhead costs through ongoing initiatives
to enhance efficiencies across various dimensions of
the business.
Net operating margin, a key performance indicator,
improved from 10,0% to 10,4% notwithstanding the
unfavourable impact of the stronger rand on export
margins.
Financing costs and cash flowCash flow from trading activities (before working capital
movements) rose to R738,9 million from last year’s
R601,1 million.
Cash flow from operating activities improved by
R382,2 million, mainly as a result of an increase in trading
income, improved working capital management and an
amount of R46,5 million received as compensation for
relinquishing the distribution rights to Martell brandies
last year.
PH
OT
OG
RA
PH
ER
:A
DR
IAA
N O
OS
TH
UIZ
EN
I
NS
PIR
ER
:B
RU
CE
MO
OD
IE
SH
OT
ON
LO
CA
TIO
N A
T G
OR
DO
N’S
BA
Y
CONTINUED FROM PAGE 23
CONTINUED OVERLEAF
25
RE
VI
EW
SM
AN
AG
IN
G
DI
RE
CT
OR
’S
R
EP
OR
T
D ISTELL ANNUAL REPORT 2004
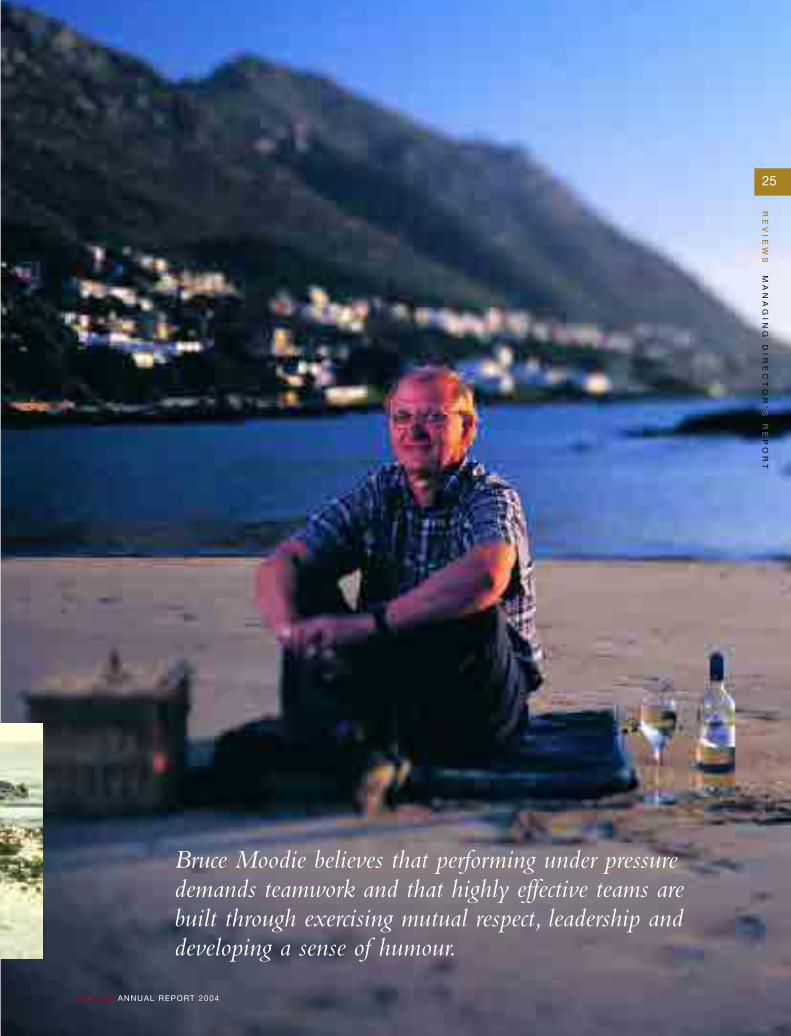
Bruce Moodie believes that performing under pressuredemands teamwork and that highly effective teams arebuilt through exercising mutual respect, leadership anddeveloping a sense of humour.
26
RE
VI
EW
SM
AN
AG
IN
G
DI
RE
CT
OR
’S
R
EP
OR
T
D ISTELL ANNUAL REPORT 2004
We continue to invest in global markets to build our
brands as part of a profitable growth strategy and look
forward to increased sales in an improved global
economic climate.The group substantially reduced fixed investment spend,
with investment to maintain and expand operations
amounting to R161,2 million (2003: R195,8 million).
The group generated net cash flow of R188,6 million, and
net financing costs, as a result, decreased by R23,4 million
to R94,8 million.
Interest cover, which is net interest paid in relation to profit
before interest and taxation, improved from 3,9 to
6,1 times.
Foreign currency movementsAny change in the rate of exchange between transaction
date and settlement or period-end date is disclosed
separately in the income statement in terms of GAAP.
During the period under review a loss of R24,9 million
(2003: R66,8 million) was reflected in this regard.
TaxationThe effective tax rate increased from 21,6% to 25,7%,
mainly as a result of non-taxable income included under
exceptional items the previous year.
Headline earningsHeadline earnings increased by 41,0% to R358,6 million.
This growth is largely attributable to growth in trading
income of 14,4%, and a reduction in financing costs and
foreign currency conversion losses. However, if the effect of
the change in accounting policy is excluded, headline
earnings grew 32,0%.
DividendsThe directors have resolved to declare dividend number
32 of 51 cents (2003: 35 cents) per share, making a total
dividend of 97 cents per share for the year ended
30 June 2004 (2003: 75 cents). This dividend represents a
dividend cover of 1,9 times (2003: 1,7 times) by headline
earnings.
Details regarding dividend payment dates and related
matters are disclosed in note 25 to the financial statements.
Investment and fundingTotal assets increased R108,5 million to R4,8 billion, an
increase of 2,3% on the previous year.
Capital expenditure amounted to R161,2 million. Of this,
R37 million was spent on the second and final phase in the
expansion and upgrade of the Nederburg cellar in Paarl to
support the continued growth of the brand domestically
and internationally.
Management’s focus on the systematic reduction in working
capital is reflected in an overall reduction of R22,3 million.
The increase in inventory, mainly as a result of an increase in
bulk wines and spirits, is necessitated by the group’s long-term
view of consumer demand for its products.The investment in
bulk inventories under maturation is planned accordingly.
Net interest-bearing liabilities were reduced from
R733,9 million to R485,9 million at 30 June 2004. Net
interest-bearing liabilities relative to net cash inflow from
normal operating activities improved to 0,64 from a level of
1,80 at the prior year-end.The group’s gearing, as measured
by net interest-bearing debt relative to net assets, decreased
at year-end to 18,9% from last year’s 31,1%.The group has
substantial unutilised borrowing facilities.
Legal and legislative issuesAs announced on 12 December 2003, the appeal by the
Competition Commission against certain findings of the
Competition Tribunal in the merger between Distillers
Corporation (SA) Limited and Stellenbosch Farmers’
Winery Group Limited was dismissed in a judgment
handed down by the Competition Appeal Court on
11 December 2003.
In September 2003, the National Assembly approved the
new Liquor Bill, which accommodates the industry’s
CONTINUED FROM PAGE 24
27
RE
VI
EW
SM
AN
AG
IN
G
DI
RE
CT
OR
’S
R
EP
OR
T
D ISTELL ANNUAL REPORT 2004
concerns, and in particular allows companies to hold
licences in both manufacturing and distribution. There is
to be an automatic conversion of existing licences and
licence holders must demonstrate within 12 months
thereafter that they meet certain criteria set by the Minister
of Trade and Industry.We believe these criteria are sound.
During the legislative process the Government committed
itself to ensuring the Bill would not adversely affect the
industry’s efficiency.
ProspectsManagement continues to focus resources on the
important strategic initiatives required to achieve our goals
of growing international business, capturing the full
potential of our brands domestically and reducing our cost
base to be competitive wherever we trade.To this end, we
have introduced a formal process to regularly monitor and
report on progress achieved and to provide for special
interventions so that major initiatives do deliver on target.
The domestic market is likely to remain extremely
competitive in the near term but a favourable medium to
longer-term outlook for the South African economy leads
us to believe consumer demand for alcoholic beverages will
strengthen, driven in part by lower inflation and interest
rates.
We continue to invest in global markets to build our brands
as part of a profitable growth strategy and look forward to
increased sales in an improved global economic climate.
We are confident Distell is well positioned to capture
opportunities in domestic and foreign markets and the
group expects to continue to reflect real growth in
earnings and has budgeted accordingly.
JJ Scannell
Managing director
16 August 2004
With spontaneity,optimism and a genuineand infectious joy for life
Saré Kotze creates anatmosphere of fun andthe belief that no task
is too onerous.
28
SO
CI
AL
CO
RP
OR
AT
E
GO
VE
RN
AN
CE
D ISTELL ANNUAL REPORT 2004
Corporate governance reportCorporate governance, critically important to Distell’s
success as a business and in protecting the interests of its
shareholders, is managed and monitored by the company’s
board of directors and several of its subcommittees.
The directors are unreservedly committed to the principles
of good governance and to this end accept full
accountability in applying the necessary disciplines in
maintaining the highest standards of professionalism,
integrity, independence, fairness and social responsibility,
and they acknowledge their accountability to all
stakeholders. Transparency in the management process
gives shareholders and other interest groups the assurance
that the group is managed according to ethical norms and
international best practice within the boundaries of
prudently determined risk parameters.
The board is of the opinion that the group substantially
complies with all the significant principles incorporated in
the Code of Corporate Practices and Conduct, as set out
in the second King Report (King II) and the JSE Securities
Exchange Listings Requirements.
Board of directorsThe board evaluates and reviews the strategic direction of
the group, agrees on key performance indicators and
identifies key risk areas and responses. Executive
management is then charged with the detailed planning
and implementation of these strategies in accordance with
appropriate risk parameters.
The board holds management accountable for its activities,
which are monitored and controlled through regular
reports and discussions. In this way the board is able to:
• Retain full and effective control over the group, and
monitor management’s implementation of planning
strategies
• Review the performance of executive management
against business plans, budgets and industry standards
• Consider significant financial matters, including
investment decisions
• Identify, consider, monitor and, if appropriate, approve
financial and non-financial matters relevant to the
business of the group
• Ensure a comprehensive system of policies, procedures
and controls is operative and adhered to
• Ensure sound governance, including compliance with
relevant laws and regulations, audit and accounting
principles and the group’s internal governing documents
and codes of conduct
• Define levels of materiality, hold certain powers and
delegate other matters with the necessary written
authority and terms of reference to management or
board committees
• Be aware of and commit to the underlying principles of
good corporate governance, monitor and maintain
compliance
The board is chaired by independent, non-executive
director DM Nurek and comprises 11 non-executive
directors (of whom eight are independent) and threeP
HO
TO
GR
AP
HE
R:
AD
RIA
AN
OO
ST
HU
IZE
N
IN
SP
IRE
R:
DU
RA
ND
T V
AN
AS
WE
GE
N
SH
OT
ON
LO
CA
TIO
N A
T L
E B
ON
HE
UR
CONTINUED OVERLEAF
duty-bound Adhering to the principles of sound
corporate governance
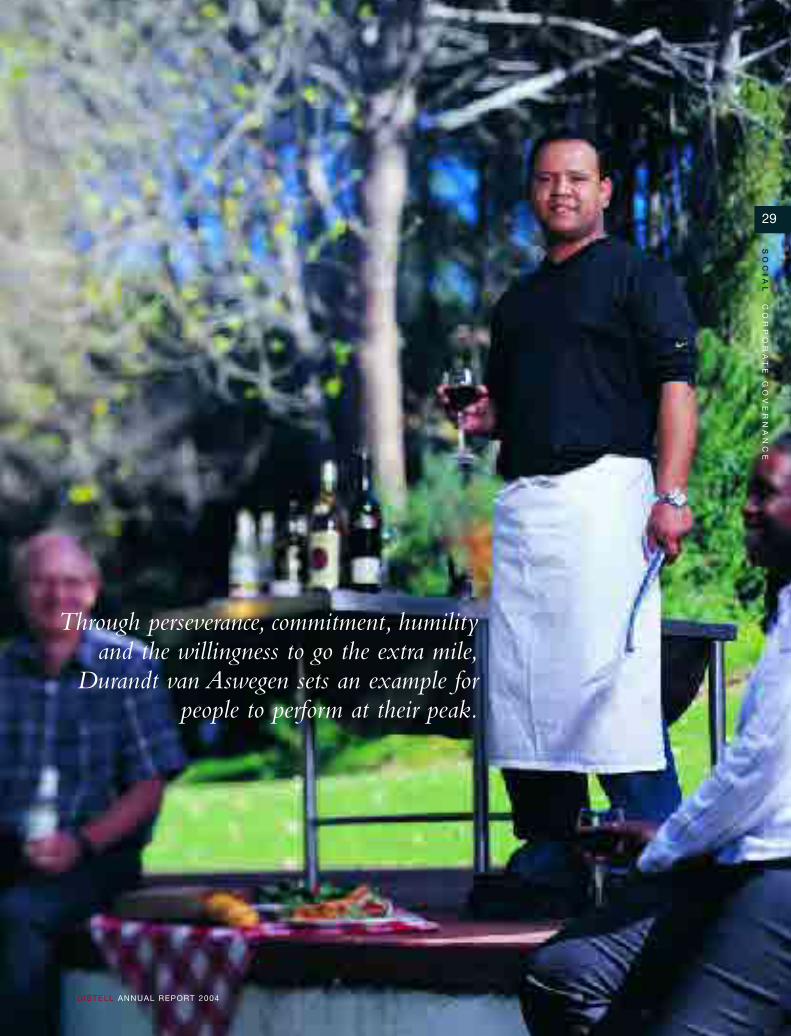
Through perseverance, commitment, humilityand the willingness to go the extra mile,
Durandt van Aswegen sets an example forpeople to perform at their peak.
29
SO
CI
AL
CO
RP
OR
AT
E
GO
VE
RN
AN
CE
D ISTELL ANNUAL REPORT 2004
30
SO
CI
AL
CO
RP
OR
AT
E
GO
VE
RN
AN
CE
D ISTELL ANNUAL REPORT 2004
executive directors, including the managing director. The
roles of the chairman and managing director are separated
with responsibilities divided between them.The chairman
has no executive functions.
Non-executive directors, appointed for their knowledge
and experience of a wide range of businesses and business
sectors, augment the skills and experience of the executive
directors and management and contribute independent
viewpoints to matters under consideration. All directors
have the appropriate knowledge and experience necessary
to fulfil their duties and enjoy significant influence at
meetings.This ensures a balance of authority and precludes
any one director from exercising unfettered powers of
decision-making.
Generally, directors have no fixed term of appointment but
retire by rotation. At each annual general meeting of the
company, a third of the directors (those longest in office
since their last election) retire and, if available, are
considered for reappointment.
Procedures for appointments to the board are formal and
transparent and a matter for the board as a whole. The
board is always mindful of the need to maintain an infusion
of fresh thinking and a relevant mix of skills and
experience.
The effectiveness of the board composition and the
performance of all its directors, including the chairman, are
assessed annually.
Non-executive directors receive no share options, nor
material benefits from Distell, other than their directors’
fees.
All board members are required to disclose the extent of
their shareholdings in Distell, other directorships and any
potential conflict of interest. It is incumbent on directors to
act in the best interests of the company at all times.Where
a potential conflict of interest does exist, they are expected
to recuse themselves from relevant discussions and
decisions.
Directors and other nominated employees are required to
advise and obtain clearance from the chairman before
dealing in Distell shares. The chairman will withhold
clearance during a closed period or any period when there
exists unpublished, price-sensitive information in relation
to the company shares.
The board convenes at least every two months to review a
formal schedule of matters for which its members are fully
briefed in advance. Effective chairmanship and a formal
agenda ensure that all issues requiring attention are raised
and addressed. This enables directors to discharge their
responsibilities in determining if prescribed functions have
been carried out according to set standards within the
boundaries of prudent, predetermined risk levels and in
line with international best practice.
Adequate “Directors and Officers” insurance cover has
been purchased by the company to meet any material
claims against directors and officers.
In addition, all directors have unlimited access to the
advice of the company secretary, who acts as an adviser to
the board and its subcommittees on issues, including
compliance with group rules and procedures, statutory
regulations and with the King II. Independent professional
advice is available to directors in appropriate circumstances
at the company’s expense.
The names and credentials of the directors and their
attendance at board meetings are detailed on page 8.
Board subcommitteesSpecific responsibilities have been delegated to board
committees, with defined terms of reference from
approved charters.All chairs of committees report orally on
the proceedings of their committees at the subsequent
board meeting and minutes of committee meetings are
provided to the board.The principal board committees are
as follows:
The audit and risk committeeThe audit and risk committee regularly evaluates the
group’s exposure and responses to significant business,
strategic, statutory and financial risks and reviews:
• the effectiveness of risk management processes; and
• the appropriateness and adequacy of the systems of
internal financial and operational controls.
The committee also reviews and evaluates accounting
policies and financial information issued to the public, to
ensure appropriate standards of governance and reporting
are maintained.
The audit and risk committee is responsible for
recommending the appointment of the external auditors,
determines their fees and assesses the performance of
internal as well as external auditors. The committee also
ensures effective communication between directors,
management and internal and external auditors. The risk
CONTINUED FROM PAGE 28
31
SO
CI
AL
CO
RP
OR
AT
E
GO
VE
RN
AN
CE
D ISTELL ANNUAL REPORT 2004
management workgroup assists the audit and risk
committee with its risk management function.
The audit and risk committee comprises three non-
executive directors, whose details are provided on page 8.
The committee is chaired by Mr D Prins, an independent
non-executive director. The chairman of the board does
not act as chairman of the audit and risk committee.
The committee meets at least four times a year. The
external auditors, the managing director, the financial
director and the company secretary are in attendance at
each meeting and other members of the management
team, including internal audit representatives, attend as
required. However, when issues are raised with the external
auditors in which executive attendees have a vested
interest, the latter recuse themselves.
Audit and risk committee members, as well as the internal
and external auditors, have unlimited access to whatever
information they require in discharging their
responsibilities. Moreover, the internal and external
auditors have unlimited access to the chairman.
The internal audit department reports directly to the audit
and risk committee and is also responsible to the financial
director on day-to-day matters. The managing director is
copied on all significant reports which are then discussed
with him.
The remuneration committeeThe remuneration committee is responsible for the
assessment and approval of a broad remuneration strategy
for the group, including short and long-term incentive pay
structures for executive management.These remuneration
strategies are aimed at rewarding employees at market-
related levels and in accordance with their contribution to
the group’s operating and financial performance in terms
of basic pay as well as short and long-term incentives. To
promote identification with shareholders’ interests, share
incentives are considered a critical element of executive
incentive pay.
The committee determines the remuneration of executive
and non-executive directors and senior management.
The remuneration committee is responsible for the
identification, assessment and nomination of potential new
directors. During the year it nominated Prof GJ Gerwel
and Messrs PM Bester and MJ Botha. New directors are
provided with suitable induction material designed to
familiarise them with all aspects of the business.
The remuneration committee consists of three non-
executive directors, whose details are provided on page 8,
and is chaired by Mr DM Nurek.
In compliance with its charter the committee met five
times during the year.
Accountability and auditInternal auditThe mandate of the group’s internal audit function
operates in terms of the audit and risk committee’s
approved charter to provide management with an
independent, objective consulting and assurance service
that reviews matters relating to control, risk management,
corporate governance and operational efficiency.
The primary mandate of the group’s internal auditors is to
examine and evaluate the effectiveness of operational
activities, the attendant business risks and the effectiveness
of the system of internal operational and financial control
to manage such risks and to bring material deficiencies,
instances of non-compliance and development needs to
the attention of management, the external auditors and the
audit and risk committee for resolution. In particular, the
internal audit function assesses the relevance, reliability and
The group’s exposure and responses to significant
business, strategic, statutory and financial risks and reviews
are regularly evaluated.
CONTINUED OVERLEAF
32
SO
CI
AL
CO
RP
OR
AT
E
GO
VE
RN
AN
CE
D ISTELL ANNUAL REPORT 2004
integrity of management and financial information, the
efficient and economic use of resources, the safeguarding of
assets, compliance with relevant policies, procedures, laws
and regulations and the prevention of waste, extravagance
and fraud.
The function of the group’s internal audit is also to provide
a risk management facilitation role, ensuring the process of
risk management is always accorded the highest priority,
but without assuming responsibility for risk management
itself, which remains the responsibility of relevant line
management.
The internal auditors also conduct independent
investigations into fraud or other irregularities.
The internal audit department functions under the
direction of, and reports to the audit and risk committee,
but is responsible to the group financial director for day-
to-day matters. It has unrestricted access to the chairman of
the audit and risk committee. The internal audit plan is
presented in advance of audit and risk committee meetings
and is based on an assessment of potential risk areas. All
Distell business operations and support functions are
subject to internal audit. The audit and risk committee
approves the yearly audit schedule. Internal audits are
conducted in accordance with the standards of the Institute
of Internal Auditors.
Teams of appropriately qualified and experienced
employees perform internal audits. The services of
independent external practitioners are engaged from time
to time for special assignments and they enjoy equivalent
access to information.
Every audit assignment is followed by a detailed report to
executive management, including recommendations on
aspects requiring improvement. Material findings are
reported to the audit and risk committee.
External auditThe external auditors express an independent opinion on
the annual financial statements.The external audit function
provides reasonable, but not absolute, assurance on the
accuracy and reliability of financial disclosures.
The external auditors’ plan is reviewed by the audit and
risk committee to ensure significant areas of concern are
covered, without encroaching on the external auditors’
independence and right to audit.
There is close co-operation between internal and external
auditors with the aim of ensuring appropriate combined
audit coverage and minimisation of duplicated effort.
Internal controlSystems of internal control are designed to manage, rather
than eliminate, the risk of failure to achieve business
objectives and can provide reasonable, but not absolute,
assurance against misstatement or loss.
While the board of directors is responsible for the internal
control systems and for reviewing their effectiveness,
responsibility for their actual implementation and
maintenance rests with executive management.
The systems of internal control are based on established
organisational structures, together with written policies
and procedures, and provide for suitably qualified
employees, segregation of duties, clearly defined lines of
authority and accountability. They also include standard
cost and budgeting controls, and comprehensive
management reporting.
The group’s treasury department is responsible for controlling
and reducing exposure to interest rate, liquidity and currency
transaction risks.Treasury functions and decisions are guided
by written policies and procedures as well as by clearly defined
levels of authority and risk assumption.While non-leveraged
derivatives are purchased periodically to hedge specific
interest rate or currency exposures, the group treasury does
not undertake speculative financial transactions.
The effectiveness of and adherence to internal control
systems are monitored continually through reviews and
reports by senior management, through a process of control
self-assessment, as well as through the internal and external
audit processes. The process of controls self-assessment by
management itself, supplements the existing structures to
evaluate the systems of internal control, and is designed to
assess, maintain and improve controls on an ongoing basis.
All divisions report on their assessments on a monthly basis.
During the year under review, none of these reviews
indicated the occurrence of any significant lapse in the
functioning of internal controls.
The directors are satisfied that control systems and procedures
are suitably implemented, maintained and monitored on an
ongoing basis by qualified personnel, with an appropriate
segregation of authority, duties and reporting lines.
CONTINUED FROM PAGE 31
33
SO
CI
AL
CO
RP
OR
AT
E
GO
VE
RN
AN
CE
D ISTELL ANNUAL REPORT 2004
Risk managementThe board is responsible for the total process of risk
management. The audit and risk committee has specific
responsibility for the system of risk management and
reviews the risk reports of the group twice a year, reporting
to the board on key risks facing the group and its associated
risk mitigation responses.
A central risk manager, reporting to the audit and risk
committee, is responsible for setting policies and procedures
on risk management and risk financing. The workgroup
supervises the activities of decentralised risk management
and loss control departments. The management of opera-
tional risk, a line function, is conducted in compliance with
set policies and standards. Performance is measured on a
regular basis through independent risk audits carried out by
a central risk management function, assisted by independent
consultants.
The group has adopted a continuous, systematic and
integrated enterprise-wide risk management process that
focuses on identifying, accessing, managing and moni-
toring all known forms of risks across the group.
Management, assisted by external consultants, continued
with a process to further develop and enhance its
comprehensive risk management framework and related
controls. This included the implementation of integrated
risk management software, training and communication,
continuous control self-assessment by line management
and comprehensive reporting. This year, the major
emphasis was on developing a comprehensive framework
for managing risks associated with information systems and
related technologies.
Major risks are the subject of ongoing attention of
the board of directors and are given particular
consideration in the group’s annual business plans, which
they approve.
The most significant risks currently faced by the group
include those pertaining to regulations, the supply chain,
physical environment, skills and people, technology as well
as currency and interest rates. These risks are included in
the group’s integrated risk management programme.
The group has adopted a continuous, systematic and integrated
enterprise-wide risk management process that focuses on
identifying, accessing, managing and monitoring all known forms
of risks across the group.
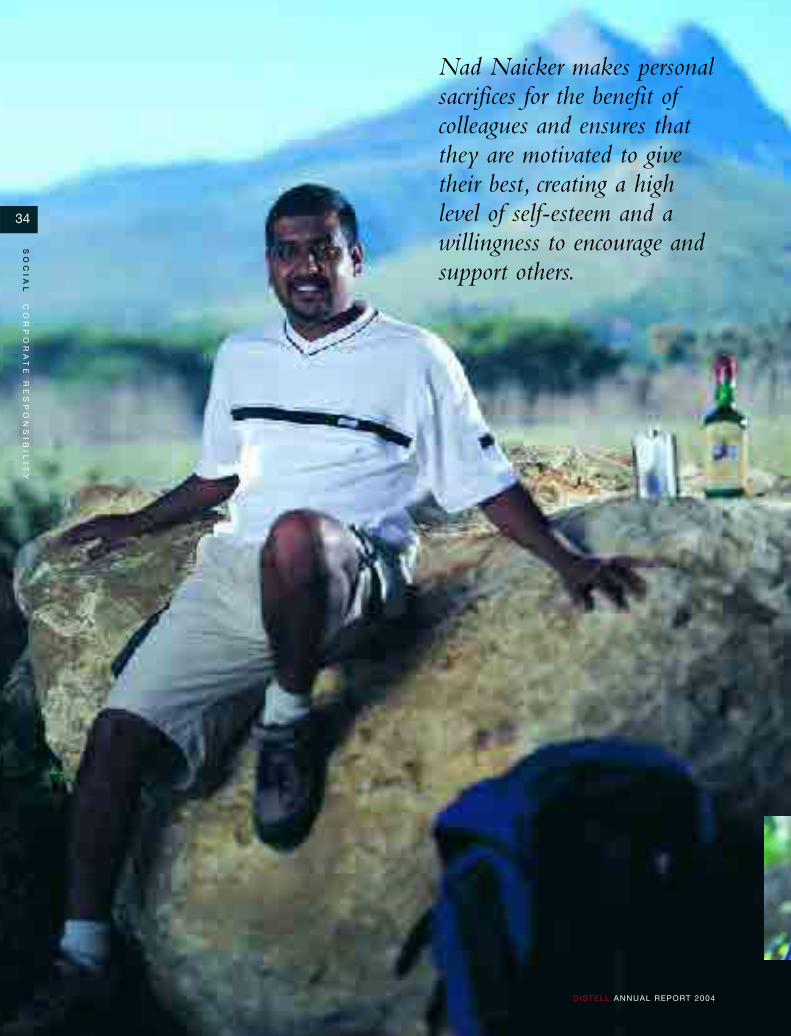
Nad Naicker makes personalsacrifices for the benefit ofcolleagues and ensures thatthey are motivated to givetheir best, creating a highlevel of self-esteem and awillingness to encourage andsupport others.
34
SO
CI
AL
CO
RP
OR
AT
E
RE
SP
ON
SI
BI
LI
TY
D ISTELL ANNUAL REPORT 2004
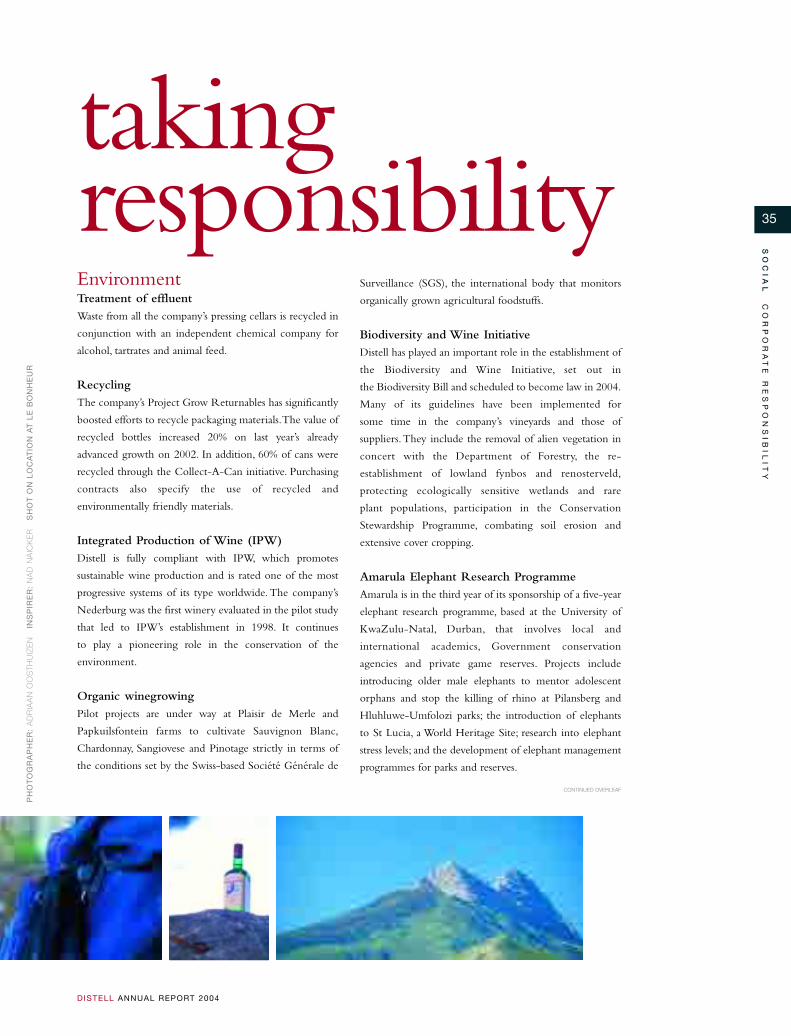
35
SO
CI
AL
CO
RP
OR
AT
E
RE
SP
ON
SI
BI
LI
TY
D ISTELL ANNUAL REPORT 2004
EnvironmentTreatment of effluentWaste from all the company’s pressing cellars is recycled in
conjunction with an independent chemical company for
alcohol, tartrates and animal feed.
RecyclingThe company’s Project Grow Returnables has significantly
boosted efforts to recycle packaging materials.The value of
recycled bottles increased 20% on last year’s already
advanced growth on 2002. In addition, 60% of cans were
recycled through the Collect-A-Can initiative. Purchasing
contracts also specify the use of recycled and
environmentally friendly materials.
Integrated Production of Wine (IPW)Distell is fully compliant with IPW, which promotes
sustainable wine production and is rated one of the most
progressive systems of its type worldwide. The company’s
Nederburg was the first winery evaluated in the pilot study
that led to IPW’s establishment in 1998. It continues
to play a pioneering role in the conservation of the
environment.
Organic winegrowingPilot projects are under way at Plaisir de Merle and
Papkuilsfontein farms to cultivate Sauvignon Blanc,
Chardonnay, Sangiovese and Pinotage strictly in terms of
the conditions set by the Swiss-based Société Générale de
Surveillance (SGS), the international body that monitors
organically grown agricultural foodstuffs.
Biodiversity and Wine InitiativeDistell has played an important role in the establishment of
the Biodiversity and Wine Initiative, set out in
the Biodiversity Bill and scheduled to become law in 2004.
Many of its guidelines have been implemented for
some time in the company’s vineyards and those of
suppliers.They include the removal of alien vegetation in
concert with the Department of Forestry, the re-
establishment of lowland fynbos and renosterveld,
protecting ecologically sensitive wetlands and rare
plant populations, participation in the Conservation
Stewardship Programme, combating soil erosion and
extensive cover cropping.
Amarula Elephant Research Programme Amarula is in the third year of its sponsorship of a five-year
elephant research programme, based at the University of
KwaZulu-Natal, Durban, that involves local and
international academics, Government conservation
agencies and private game reserves. Projects include
introducing older male elephants to mentor adolescent
orphans and stop the killing of rhino at Pilansberg and
Hluhluwe-Umfolozi parks; the introduction of elephants
to St Lucia, a World Heritage Site; research into elephant
stress levels; and the development of elephant management
programmes for parks and reserves.
takingresponsibility
PH
OT
OG
RA
PH
ER
:A
DR
IAA
N O
OS
TH
UIZ
EN
I
NS
PIR
ER
:N
AD
NA
ICK
ER
S
HO
T O
N L
OC
AT
ION
AT
LE
BO
NH
EU
R
CONTINUED OVERLEAF
36
SO
CI
AL
CO
RP
OR
AT
E
RE
SP
ON
SI
BI
LI
TY
D ISTELL ANNUAL REPORT 2004
WWF-SA and Peace Parks FoundationDistell’s relationship, through its merged entities, dates back
to the inception of the WWF-SA in 1968. Involvement
includes the protection of habitats, conservation of species
and natural resources.
Kenya Wildlife SocietyThe company, via Amarula, provides support to this
initiative of the Kenyan government to promote and
communicate the importance of conservation.
Sedgwick’s Old Brown Sherry/OceanographicResearch/WWF-SA Fish Tagging ProjectSedgwick’s Old Brown Sherry provides funding for one
of the longest-running and most successful marine
conservation projects in South Africa. Established 21 years
ago, it has tagged and released over 178 500 line fish from
some 341 species along the South African coastline.
Public healthResponsible drinkingDistell recognises the social and health benefits of
moderate and responsible consumption of alcoholic
beverages for those who have taken the decision to drink
and are not at risk. It also acknowledges that targeting
abuse is the collective responsibility of the alcoholic
beverage industry, Government, national, provincial and
local authorities and police services. The company works
with other members of the industry through the Industry
Association for Responsible Alcohol Use (ARA) to
promote and execute a constructive approach to alcohol
use and abuse.The ARA represents the industry in liaison
with Government, the Advertising Standards Authority and
law enforcement agencies and researches and funds a
variety of initiatives into targeting and supporting those at
risk. Projects include life-skills education for urban and
rural children, youth and adult communities; the
identification of alcohol-related health risks; intervention
among vulnerable groups through counseling and
rehabilitation; research into and creating awareness of the
dangers of foetal alcohol syndrome; highlighting the
dangers of drinking and driving through the Arrive Alive
campaign; running pedestrian-focused campaigns;
providing training to licensees to develop and entrench a
culture of moderation among patrons; and to eliminate
under-age drinking.
Distell’s advertising principlesThe following principles derived from the ARA code
apply to all advertising, packaging and promotional
material produced on behalf of the company:
• Advertisements will not show or encourage irresponsible
drinking. This applies, for example, to the quantity of
drink being consumed in any advertisement.
• Liquor advertising will not be directed at anyone
under the age of 18 years. No-one associated with the
act of drinking in an advertisement will be younger
than 25. No-one under the age of 18 will be depicted
in advertisements except where it would be usual for
them to appear, such as in family scenes or in
background crowds. They will not be shown drinking
alcoholic beverages, nor may it be implied that they are.
In addition, no characters or icons with special appeal to
children will be featured.
• Advertisements will not be placed in any medium aimed
specifically at children. Moreover, advertisements may
not be transmitted in the commercial breaks immediately
before, during or immediately after children’s
programmes on television or radio.
• Advertisements will not imply that alcoholic beverage
consumption is essential to business and social success or
acceptance, or that refusal is a sign of weakness. Nor will
they be based on a dare or imply any failing in those
who do not accept the challenge of a particular
alcoholic beverage.
• Advertisements will not be suggestive of sexual
indulgence or permissiveness, or claim or suggest that
alcoholic beverages can contribute directly to sexual
success or seduction.
• Advertisements will not claim that alcohol has curative
qualities, nor offer it expressly as a stimulant, sedative or
tranquilliser. Advertisements may refer to the refreshing
attributes of an alcoholic beverage, but will not imply
that performance can be improved through the
consumption of such a drink.
• Advertisements will not suggest consumption of liquor
under circumstances that are generally regarded as
inadvisable, improper or illegal, such as preceding or
during any activity requiring sobriety, skill or precision.
Examples of such activities are driving, work or sport
requiring intense physical effort.
• Advertisements will not depict pregnant women.
• Alcoholic drinks will not be advertised in a context of
aggressive or antisocial behaviour.
CONTINUED FROM PAGE 35
37
SO
CI
AL
CO
RP
OR
AT
E
RE
SP
ON
SI
BI
LI
TY
D ISTELL ANNUAL REPORT 2004
All advertisements in print, television and cinema media will
carry the message:“Not for sale to persons under the age of
18”. The minimum specifications set for displaying this
message are designed to ensure its clear visibility.Furthermore:
• There must be no variation in the wording of the
message line.
• In the case of TV and cinema media, the message must
be retained for the duration of the advertisement.
The following rules also apply in the case of all
promotional events undertaken in the name of Distell:
• All product launches or promotions will exclude activities
which encourage excessive or irresponsible consumption.
• Appropriate snacks or meals should be available when
promotions or tastings are held.
• On-campus promotions will be arranged in a manner that
meets with the approval of the authorities of the university
or other tertiary institutions and care will be taken to
avoid serving alcoholic beverages to under-age consumers.
• No promotions will be permitted that encourage
increased consumption within a limited time period.
• In accordance with the law, Distell will not deliver or sell
to unlicensed outlets.
Hospice Palliative Care Association of South AfricaA central element of the annual Nederburg Auction is the
charity auction of rare wines in aid of the Hospice
Palliative Care Association of South Africa. For the past
14 years Nederburg has hosted this charity event and also
donated many of the exceptional wines that fetch record
prices (contributing close on R2 million to the association).
Organ Donor Foundation of Southern AfricaNederburg Wines stages an annual post-auction gala
charity function in aid of the Organ Donor Foundation.
The funds raised are used to further the foundation’s
awareness drive.
Mothers 2 Mothers (M2M)Nederburg Wines has run two projects in support of this
NGO that uses a mentoring system among HIV-positive
women to provide health care, psychological and practical
support, as well as job training. The first was a celebrity
auction. The second involved wine media who created a
white blend from the Nederburg cellars. Called Nederburg
Amateur (taking its name from the French for enthusiast),
the wine was sold at the Nederburg Auction in aid
of M2M.
Skills transferDistell funds training in farm management at the
Worcester Agricultural College for candidates from the
communities where the company farms, and identifies and
sponsors the training of candidates at a variety of tertiary
institutions in the agricultural sciences.The company also
contributes 50% towards two Patrick Grubb Bursaries
awarded annually to historically disadvantaged people with
winemaking promise. The project enables each successful
candidate to spend a harvest with a leading winery abroad.
Funding is also provided to train the Gauteng
entrepreneurs who are shareholders in Papkuilsfontein
Vineyards, Darling, in their fiduciary role and in
corporate governance. Annually the top student in the
faculty of Commerce at the University of Stellenbosch is
awarded a cash prize and the CGW Schumann Medal,
named after the faculty’s first dean. Amarula funds a
scholarship programme for candidates to attend the
School of Life and Environmental Studies at the
University of KwaZulu-Natal, Durban.
Sedgwick’s Old Brown Sherry provides funding for one of the
longest-running and most successful marine conservation projects
in South Africa. Established 21 years ago, it has tagged and
released over 178 500 line fish from some 341 species along the
South African coastline.
CONTINUED OVERLEAF
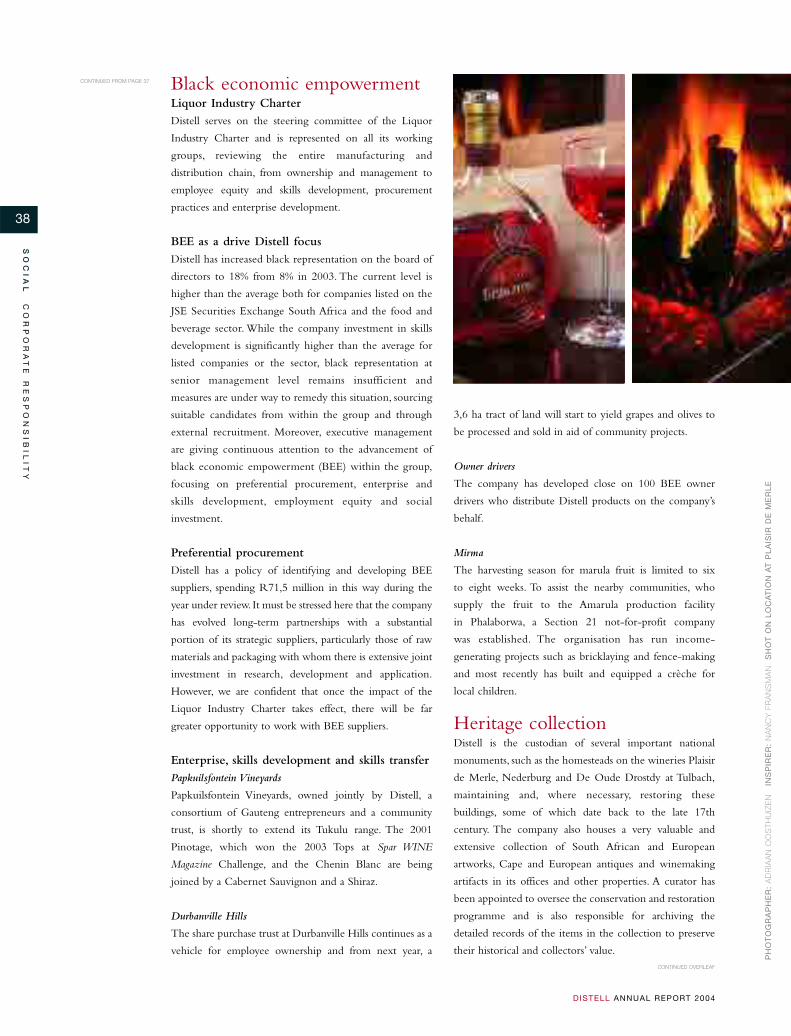
38
SO
CI
AL
CO
RP
OR
AT
E
RE
SP
ON
SI
BI
LI
TY
D ISTELL ANNUAL REPORT 2004
Black economic empowermentLiquor Industry CharterDistell serves on the steering committee of the Liquor
Industry Charter and is represented on all its working
groups, reviewing the entire manufacturing and
distribution chain, from ownership and management to
employee equity and skills development, procurement
practices and enterprise development.
BEE as a drive Distell focusDistell has increased black representation on the board of
directors to 18% from 8% in 2003. The current level is
higher than the average both for companies listed on the
JSE Securities Exchange South Africa and the food and
beverage sector. While the company investment in skills
development is significantly higher than the average for
listed companies or the sector, black representation at
senior management level remains insufficient and
measures are under way to remedy this situation, sourcing
suitable candidates from within the group and through
external recruitment. Moreover, executive management
are giving continuous attention to the advancement of
black economic empowerment (BEE) within the group,
focusing on preferential procurement, enterprise and
skills development, employment equity and social
investment.
Preferential procurementDistell has a policy of identifying and developing BEE
suppliers, spending R71,5 million in this way during the
year under review. It must be stressed here that the company
has evolved long-term partnerships with a substantial
portion of its strategic suppliers, particularly those of raw
materials and packaging with whom there is extensive joint
investment in research, development and application.
However, we are confident that once the impact of the
Liquor Industry Charter takes effect, there will be far
greater opportunity to work with BEE suppliers.
Enterprise, skills development and skills transferPapkuilsfontein Vineyards
Papkuilsfontein Vineyards, owned jointly by Distell, a
consortium of Gauteng entrepreneurs and a community
trust, is shortly to extend its Tukulu range. The 2001
Pinotage, which won the 2003 Tops at Spar WINE
Magazine Challenge, and the Chenin Blanc are being
joined by a Cabernet Sauvignon and a Shiraz.
Durbanville Hills
The share purchase trust at Durbanville Hills continues as a
vehicle for employee ownership and from next year, a
3,6 ha tract of land will start to yield grapes and olives to
be processed and sold in aid of community projects.
Owner drivers
The company has developed close on 100 BEE owner
drivers who distribute Distell products on the company’s
behalf.
Mirma
The harvesting season for marula fruit is limited to six
to eight weeks. To assist the nearby communities, who
supply the fruit to the Amarula production facility
in Phalaborwa, a Section 21 not-for-profit company
was established. The organisation has run income-
generating projects such as bricklaying and fence-making
and most recently has built and equipped a crèche for
local children.
Heritage collectionDistell is the custodian of several important national
monuments, such as the homesteads on the wineries Plaisir
de Merle, Nederburg and De Oude Drostdy at Tulbach,
maintaining and, where necessary, restoring these
buildings, some of which date back to the late 17th
century. The company also houses a very valuable and
extensive collection of South African and European
artworks, Cape and European antiques and winemaking
artifacts in its offices and other properties. A curator has
been appointed to oversee the conservation and restoration
programme and is also responsible for archiving the
detailed records of the items in the collection to preserve
their historical and collectors’ value.
PH
OT
OG
RA
PH
ER
:A
DR
IAA
N O
OS
TH
UIZ
EN
I
NS
PIR
ER
:N
AN
CY
FR
AN
SM
AN
S
HO
T O
N L
OC
AT
ION
AT
PL
AIS
IR D
E M
ER
LE
CONTINUED FROM PAGE 37
CONTINUED OVERLEAF
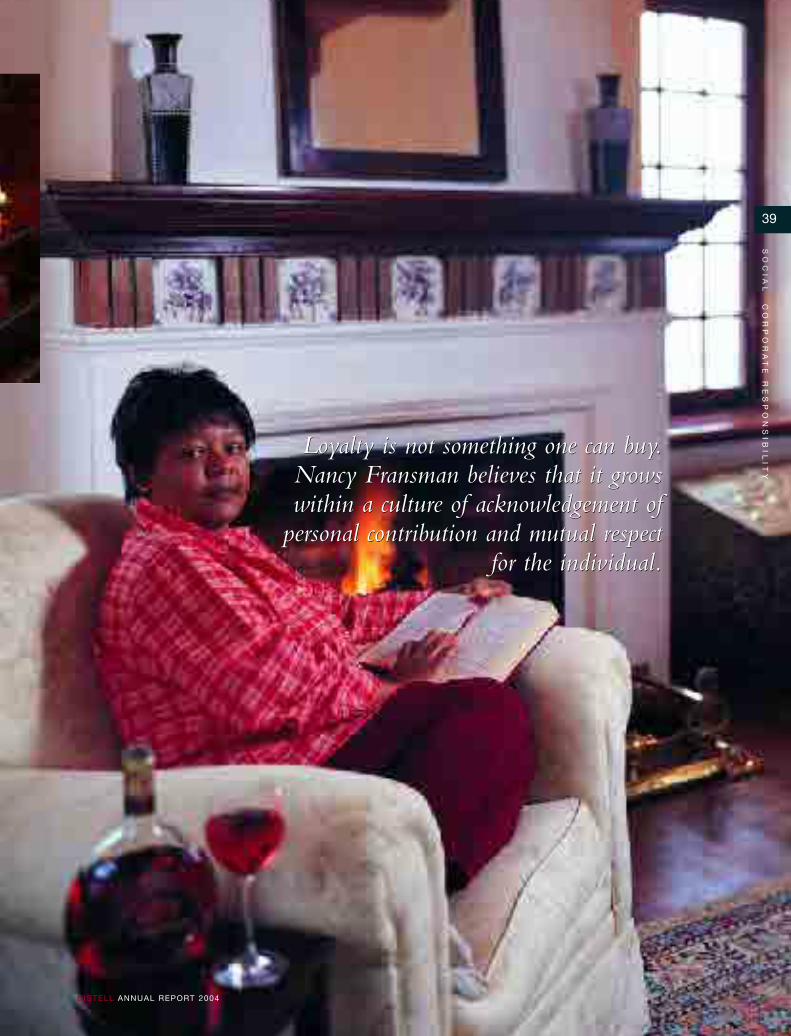
Loyalty is not something one can buy.Nancy Fransman believes that it growswithin a culture of acknowledgement of
personal contribution and mutual respectfor the individual.
39
SO
CI
AL
CO
RP
OR
AT
E
RE
SP
ON
SI
BI
LI
TY
D ISTELL ANNUAL REPORT 2004
Loyalty is not something one can buy.Nancy Fransman believes that it growswithin a culture of acknowledgement of
personal contribution and mutual respectfor the individual.
40
SO
CI
AL
CO
RP
OR
AT
E
RE
SP
ON
SI
BI
LI
TY
D ISTELL ANNUAL REPORT 2004
CONTINUED FROM PAGE 38 Arts and culture The association between alcoholic beverages and culture is a long-standing one worldwide.The company, through its
forerunners SFW and Distillers Corporation, has a history of actively supporting the arts, particularly performance arts,
literally providing a platform for established and new talent throughout the country.
Distell Foundation for the Performing ArtsThe foundation retained an active profile in six of South Africa’s nine provinces, sponsoring the Annual Oude LibertasAmphitheatre Summer Season, arts festivals, community projects, classical music concerts, performances on the company’swine estates, as well as the prestigious Fleur du Cap Theatre Awards, now in their 26th year.
Thirty-one percent of the performances were black productions, involving emergent talent, which Distell has made it apolicy to nurture and promote.
Festivals and other projects supported by the foundation:
Grahamstown Arts FestivalThe last phase of the Bow Project, a three-year community development initiative towhich many South African composerscontributed, is based on the Uhadi bowsongs of Nofmishi Dywili, the leadingovertone singer and bow player from LadyFrere, accompanied by the SontongaQuartet. The group has performed locallyand in Europe.
University of Port ElizabethThe university’s regular musical recitalsfeatured the award-winning SontongaQuartet, whose members are Marc Uys(violin), Waldo Alexander (violin), Xandi vanDijk (viola) and Brian Choveaux (cello).
Aardklop Arts Festival Potchefstroom Maria de Buenos Aires tango opera thatpremiered at the Oude Libertas Amphi-theatre’s Summer Season, was staged atthe KKNK and Aardklop in 2004.
Hilton Festival A three-day musical festival in Durbanincluded trumpet, oboe organ and twopianos; a classical concert for children;Angela Gilbert in concert; Moscow nightswith the Kerimov Trio (violin, cello, piano);Tea with Debussy; The Carnival of theAnimals; a performance of romanticchamber music; the Sontonga quartet withAnneke Lamont; Jazz for Two Pianos, Sax& Organ; and a Chopin piano recital.
KwaZulu-Natal UniversityPerformances included the Odeion StringQuartet, Etudes II, composed by KevinVolans and performed by Jill Richards(piano).
KwaZulu-Natal
North West
Eastern Cape
Volksbladfees Bloemfontein Priors Runnicles – a classical musicconcert – was staged, featuring the OdeionString Quartet.
University of the WitwatersrandPerformances included the Gyorgi LigeliCommemorative Concert for six pianists;Hear and Now, a programme of Dvorakcompositions, featuring Malcolm Nay(piano) and the Rosamunde Quartet(Denise Sutton, Suzanne Martens, Jeanne-Louise Moolman and Marion Lewin) joinedby Carla Pohl, singing gypsy songs.
SuidoosterfeesThe community theatre production ofKanna hy kô Hystoe was staged at thePentech Technikon, Belhar.
Kalfiefees HermanusCape Town City Ballet performed Swan Lake.
Woordfees StellenboschPerformances included Black Tie Ensemble& Mimi Coertse; Russian Music from theRomantic Era; Onderweg, a concert ofElizabeth Eybers poems set to music,performed by Marica Otto and Elna vander Merwe (piano); Prof Piet Vier AgDekades with Marianne Serfontein, AndréHoward and Prof Piet (piano); Die Stemvan die Vrou with Zanne Stapelberg,Marianne Serfontein and Mimi Coertse.
Youth Music FestivalA community development project, incollaboration with the Cape PhilharmonicOrchestra and Artscape, staged a concertof classical music and jazz, featuringyoung South African soloists.
Western Cape
Gauteng
Free State KKNK (Klein Karoo Nasionale Kunstefees)Events staged were KaleidoscopeConcert, the University of PretoriaSymphony Orchestra under direction ofEric Rycroft with soloist Johan Botes(piano); a performance by the SontongaQuartet and Maria de Buenos Aires, anArgentinian opera directed by MarthinusBasson with Nicole Holm in the title role.
Distell also sponsored the Kanna ClassicalMusic Prize, won by the Sontonga Quartet.
Cederbergfees, ClanwilliamWorld-renowned South African soprano,Angela Gilbert, now resident in New York,was accompanied by KwaZulu-Natalpianist Christopher Duigan, performingHandel, Gershwin and Lizst. Also presentedwas Drie Kaapse Tenore with Theresa deWitt.
JazzartDance Theatre Company and traineesperformed Gregory Maqoma’s re-Phase are-Play at the Artscape Theatre.
Abaqondisi Brothers at KhayamandiThe tenth anniversary show was presentedof this talented group of 12 African malesingers and dancers from Khayamandi,Stellenbosch.
Ikhwezi Community Theatre FestivalA three-week performance workshop andfestival was held at the Baxter Theatre,attended by 15 rural groups from theWestern Cape.
Classical music concertsUniversity of Cape Town master classeswere given to students at the UCT Collegeof Music by pianist Prof Frank Weinstockof the University of Cincinnati, US.
The Stellenbosch, Port Elizabeth SongCycle was presented with Angela Gilbert,accompanied by Mark Nixon (piano).
The Cape Philharmonic Orchestra ConcertSeries featured the works of Temmingh,
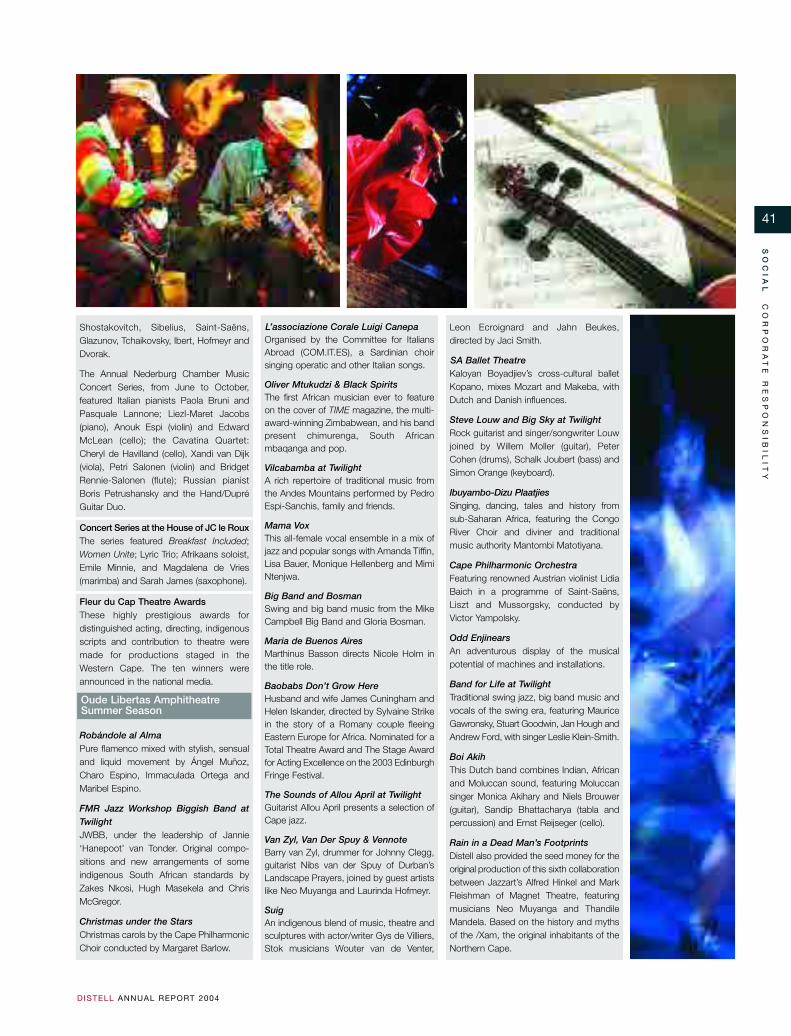
41
SO
CI
AL
CO
RP
OR
AT
E
RE
SP
ON
SI
BI
LI
TY
D ISTELL ANNUAL REPORT 2004
Shostakovitch, Sibelius, Saint-Saëns,Glazunov, Tchaikovsky, Ibert, Hofmeyr andDvorak.
The Annual Nederburg Chamber MusicConcert Series, from June to October,featured Italian pianists Paola Bruni andPasquale Lannone; Liezl-Maret Jacobs(piano), Anouk Espi (violin) and EdwardMcLean (cello); the Cavatina Quartet:Cheryl de Havilland (cello), Xandi van Dijk(viola), Petri Salonen (violin) and BridgetRennie-Salonen (flute); Russian pianistBoris Petrushansky and the Hand/DupréGuitar Duo.
Concert Series at the House of JC le RouxThe series featured Breakfast Included;Women Unite; Lyric Trio; Afrikaans soloist,Emile Minnie, and Magdalena de Vries(marimba) and Sarah James (saxophone).
Fleur du Cap Theatre AwardsThese highly prestigious awards fordistinguished acting, directing, indigenousscripts and contribution to theatre weremade for productions staged in theWestern Cape. The ten winners wereannounced in the national media.
Robándole al AlmaPure flamenco mixed with stylish, sensualand liquid movement by Ángel Muñoz,Charo Espino, Immaculada Ortega andMaribel Espino.
FMR Jazz Workshop Biggish Band atTwilightJWBB, under the leadership of Jannie‘Hanepoot’ van Tonder. Original compo-sitions and new arrangements of someindigenous South African standards byZakes Nkosi, Hugh Masekela and ChrisMcGregor.
Christmas under the StarsChristmas carols by the Cape PhilharmonicChoir conducted by Margaret Barlow.
Oude Libertas AmphitheatreSummer Season
L’associazione Corale Luigi CanepaOrganised by the Committee for ItaliansAbroad (COM.IT.ES), a Sardinian choirsinging operatic and other Italian songs.
Oliver Mtukudzi & Black SpiritsThe first African musician ever to featureon the cover of TIME magazine, the multi-award-winning Zimbabwean, and his bandpresent chimurenga, South Africanmbaqanga and pop.
Vilcabamba at TwilightA rich repertoire of traditional music fromthe Andes Mountains performed by PedroEspi-Sanchis, family and friends.
Mama VoxThis all-female vocal ensemble in a mix ofjazz and popular songs with Amanda Tiffin,Lisa Bauer, Monique Hellenberg and MimiNtenjwa.
Big Band and BosmanSwing and big band music from the MikeCampbell Big Band and Gloria Bosman.
Maria de Buenos AiresMarthinus Basson directs Nicole Holm inthe title role.
Baobabs Don’t Grow HereHusband and wife James Cuningham andHelen Iskander, directed by Sylvaine Strikein the story of a Romany couple fleeingEastern Europe for Africa. Nominated for aTotal Theatre Award and The Stage Awardfor Acting Excellence on the 2003 EdinburghFringe Festival.
The Sounds of Allou April at TwilightGuitarist Allou April presents a selection ofCape jazz.
Van Zyl, Van Der Spuy & VennoteBarry van Zyl, drummer for Johnny Clegg,guitarist Nibs van der Spuy of Durban’sLandscape Prayers, joined by guest artistslike Neo Muyanga and Laurinda Hofmeyr.
SuigAn indigenous blend of music, theatre andsculptures with actor/writer Gys de Villiers,Stok musicians Wouter van de Venter,
Leon Ecroignard and Jahn Beukes,directed by Jaci Smith.
SA Ballet TheatreKaloyan Boyadjiev’s cross-cultural balletKopano, mixes Mozart and Makeba, withDutch and Danish influences.
Steve Louw and Big Sky at TwilightRock guitarist and singer/songwriter Louwjoined by Willem Moller (guitar), PeterCohen (drums), Schalk Joubert (bass) andSimon Orange (keyboard).
Ibuyambo-Dizu PlaatjiesSinging, dancing, tales and history fromsub-Saharan Africa, featuring the CongoRiver Choir and diviner and traditionalmusic authority Mantombi Matotiyana.
Cape Philharmonic OrchestraFeaturing renowned Austrian violinist LidiaBaich in a programme of Saint-Saëns,Liszt and Mussorgsky, conducted byVictor Yampolsky.
Odd EnjinearsAn adventurous display of the musicalpotential of machines and installations.
Band for Life at TwilightTraditional swing jazz, big band music andvocals of the swing era, featuring MauriceGawronsky, Stuart Goodwin, Jan Hough andAndrew Ford, with singer Leslie Klein-Smith.
Boi AkihThis Dutch band combines Indian, Africanand Moluccan sound, featuring Moluccansinger Monica Akihary and Niels Brouwer(guitar), Sandip Bhattacharya (tabla andpercussion) and Ernst Reijseger (cello).
Rain in a Dead Man’s FootprintsDistell also provided the seed money for theoriginal production of this sixth collaborationbetween Jazzart’s Alfred Hinkel and MarkFleishman of Magnet Theatre, featuringmusicians Neo Muyanga and ThandileMandela. Based on the history and mythsof the /Xam, the original inhabitants of theNorthern Cape.
42
SO
CI
AL
OU
R
PE
OP
LE
D ISTELL ANNUAL REPORT 2004
our peopleFocus areas and highlights ofthe yearDistell InspirersEmployees across the company were asked to nominate
those of their co-workers whom they regard as truly
inspiring people. The eight people chosen are photo-
graphically featured in this annual report.
Employee Performance Management SystemThe Employee Performance Management System (EPMS)
was conducted with all 2 884 employees at supervisory,
administrative and management levels signing individually
tailored performance contracts. Employees were evaluated
on performance against predetermined individual, team
and company targets, and incentive bonuses determined
accordingly.
Mission-Directed TeamsThe Mission-Directed Teams (MDT) concept, originally
directed at production plants, was expanded to include all
distribution sites.Work teams have been implemented from
executive to shop floor level, and now number 174 teams
across production and distribution. Work teams assess
quality, speed, cost, morale and innovations on a daily basis.
Rewards for AwardsAward-winning wine and spirit teams, from viticulturists
to winemakers and distillers, continued to receive financial
incentives for achieving success in major competitions,
such as the International Wine & Spirit Competition based
in London, the International Challenge and the SA
National Wine Show, which awards the Veritas medals.
Leadership developmentDistell Leadership Development Programme (DLDP)
After a rigorous selection process, 68 candidates drawn
from four levels – senior management, middle manage-
ment, foundation management and specialists – were
chosen to undergo leadership training through the Gordon
Institute of Business Science.Various training modules are
offered over the course of a year. Almost 70% of the
candidates are from historically disadvantaged groups.
Wine Business Management Training
Distell has nominated two people from the company to
attend the inaugural Wine Business Management Masters
programme run jointly by the universities of Cape Town
and Adelaide. The course requires travel to and study
in Australia.
HIV/Aids awarenessThe HIV/Aids awareness and intervention programme,
started in the previous financial year, continued. A total of
2 048 employees have now been trained in how to manage
the disease and form part of the process in creating a
supportive and non-threatening working environment for
infected and non-infected staff. Distell’s HIV/Aids
awareness campaign also includes the training of peer
educators and the compilation and distribution of
information on the illness. Positive cases are supported by
our Employee Assistance Programme.
Responsible drinkingTraining programmes on responsible alcohol use have
reached 2 832 employees since January 2002. These pro-
grammes focus on lifestyle and health education and,
where necessary, also provide intervention and support
through the Employee Assistance Programme.
Embedding aperformance culture
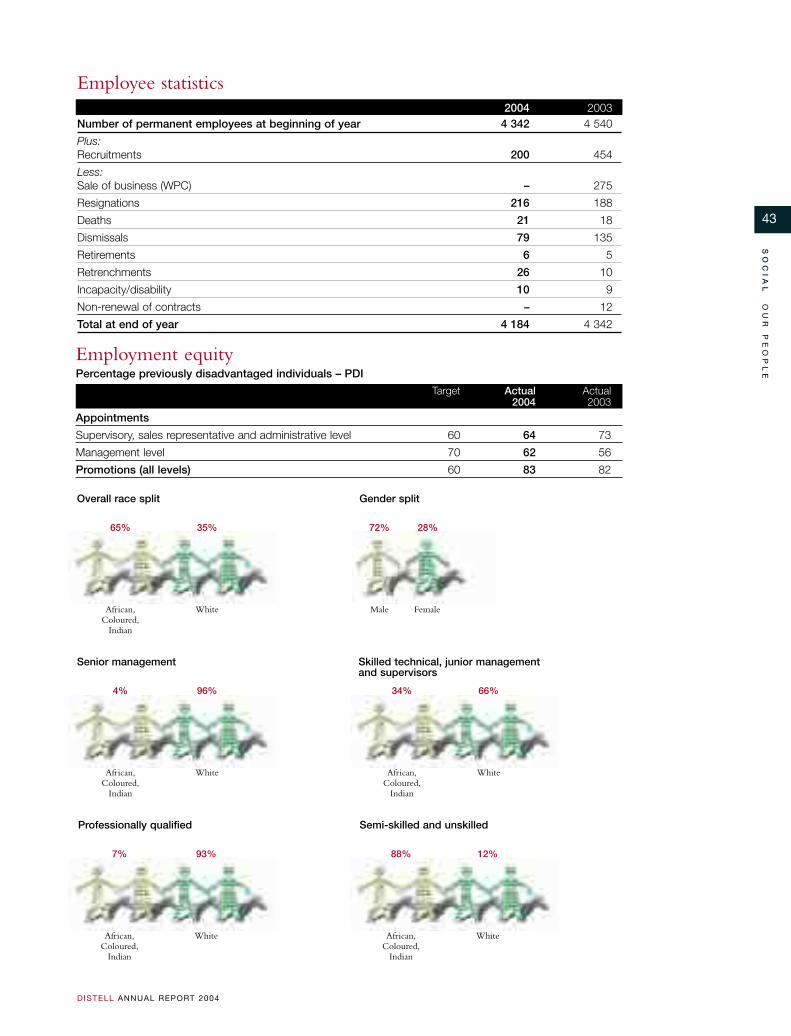
43
SO
CI
AL
OU
R
PE
OP
LE
D ISTELL ANNUAL REPORT 2004
Employee statistics2004 2003
Number of permanent employees at beginning of year 4 342 4 540
Plus: Recruitments 200 454
Less:Sale of business (WPC) – 275
Resignations 216 188
Deaths 21 18
Dismissals 79 135
Retirements 6 5
Retrenchments 26 10
Incapacity/disability 10 9
Non-renewal of contracts – 12
Total at end of year 4 184 4 342
Employment equityPercentage previously disadvantaged individuals – PDI
Target Actual Actual2004 2003
Appointments
Supervisory, sales representative and administrative level 60 64 73
Management level 70 62 56
Promotions (all levels) 60 83 82
Overall race split
65% 35%
African,Coloured,
Indian
White
Senior management
4% 96%
African,Coloured,
Indian
White
Professionally qualified
7% 93%
African,Coloured,
Indian
White
Skilled technical, junior managementand supervisors
34% 66%
African,Coloured,
Indian
White
Semi-skilled and unskilled
88% 12%
African,Coloured,
Indian
White
Gender split
72% 28%
Male Female
the Distellway 44
SO
CI
AL
TH
E
DI
ST
EL
L
WA
Y
D ISTELL ANNUAL REPORT 2004
1 Always complying with the lawTo meet the requirements of liquor legislation in all
the countries where we transact business. To comply
with all aspects of the law as minimum standard of
acceptable individual behaviour.
2 Quality products To develop and deliver products that are sought after
by customers.
3 Customer serviceTo provide the highest levels of service and thereby
provide our customers with a consistent and reliable
supply. To meet all promises made.
4 Community investmentTo balance the inherent tension between the pursuit of
profit and the impact of such actions on the
community. To show our commitment to enhance the
quality of life of all the societies in which we operate.
5 Responsible alcohol useTo practise and promote the responsible use of alcohol
as part of a healthy lifestyle.
6 Black economic empowermentTo promote the interests of previously excluded groups
in our operations wherever possible, whether by way of
preferential procurement, joint ventures, skills
development or employment equity.
7 Employee developmentTo nurture the individual growth of all employees by
engendering a culture of personal accountability and by
providing training and development opportunities to all.
8 Inclusivity and shared values To create a culture of inclusivity based on shared values.
9 HIV/AidsTo ensure that all our employees are educated
regarding the cause, consequences, treatment and
prevention of the disease. Not to discriminate against
anyone infected with the virus.
10 Sharing information To share relevant information timeously with all
stakeholders, in an open and transparent manner.
11 Building relationshipsTo foster healthy, mutually beneficial and long-term
relationships with key suppliers, customers, agents
and partners.
12 Fostering prideTo guard the reputation of our company and our
brands at all times.
13 RecognitionTo recognise and encourage exceptional and value-
added performance openly.
14 TeamworkTo encourage teamwork within and across functional
departments, and break down silos.
15 RespectTo treat everyone with respect and dignity regardless
of race, gender, language, culture, creed, age,
physical disability or occupational/educational level.
16 Innovation and risk takingTo encourage employees to introduce and try new
concepts and ideas.
17 PerformanceTo manage performance using agreed targets,
qualities and measures at reasonable intervals and to
give open, honest and constructive feedback both on
achievements and under-achievements.
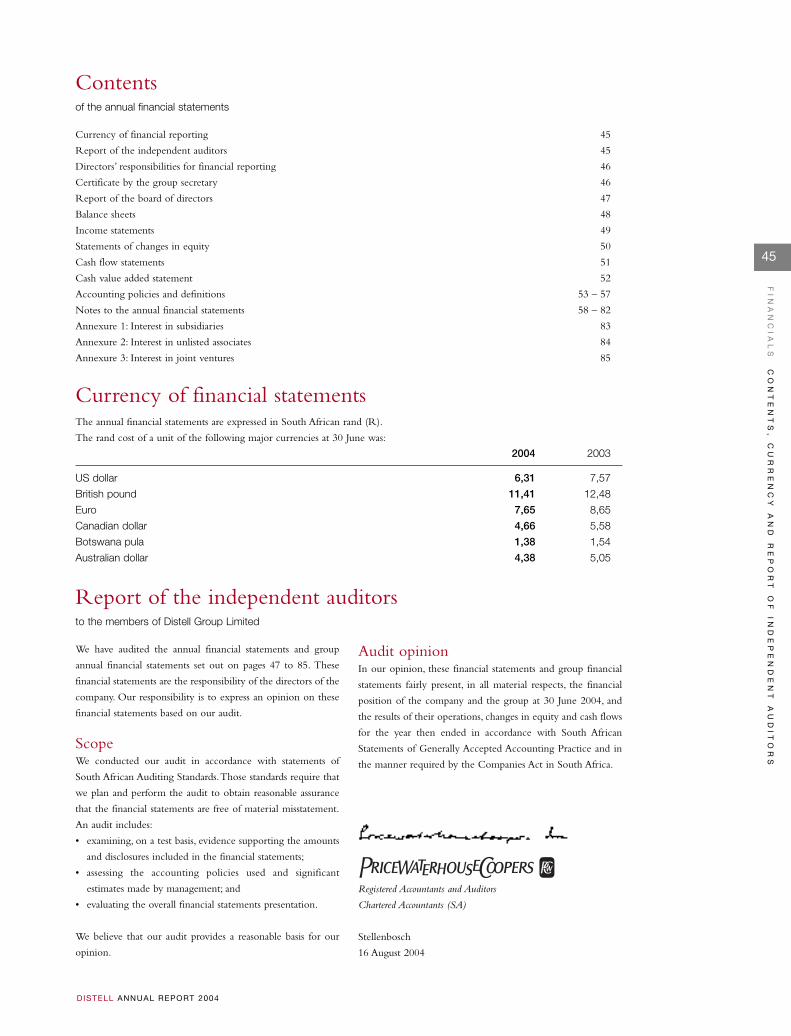
45
FI
NA
NC
IA
LS
CO
NT
EN
TS
,
CU
RR
EN
CY
A
ND
R
EP
OR
T
OF
I
ND
EP
EN
DE
NT
A
UD
IT
OR
S
D ISTELL ANNUAL REPORT 2004
Contentsof the annual financial statements
Report of the independent auditorsto the members of Distell Group Limited
Currency of financial reporting 45
Report of the independent auditors 45
Directors’ responsibilities for financial reporting 46
Certificate by the group secretary 46
Report of the board of directors 47
Balance sheets 48
Income statements 49
Statements of changes in equity 50
Cash flow statements 51
Cash value added statement 52
Accounting policies and definitions 53 – 57
Notes to the annual financial statements 58 – 82
Annexure 1: Interest in subsidiaries 83
Annexure 2: Interest in unlisted associates 84
Annexure 3: Interest in joint ventures 85
The annual financial statements are expressed in South African rand (R).
The rand cost of a unit of the following major currencies at 30 June was:
2004 2003
US dollar 6,31 7,57
British pound 11,41 12,48
Euro 7,65 8,65
Canadian dollar 4,66 5,58
Botswana pula 1,38 1,54
Australian dollar 4,38 5,05
We have audited the annual financial statements and group
annual financial statements set out on pages 47 to 85. These
financial statements are the responsibility of the directors of the
company. Our responsibility is to express an opinion on these
financial statements based on our audit.
ScopeWe conducted our audit in accordance with statements of
South African Auditing Standards.Those standards require that
we plan and perform the audit to obtain reasonable assurance
that the financial statements are free of material misstatement.
An audit includes:
• examining, on a test basis, evidence supporting the amounts
and disclosures included in the financial statements;
• assessing the accounting policies used and significant
estimates made by management; and
• evaluating the overall financial statements presentation.
We believe that our audit provides a reasonable basis for our
opinion.
Audit opinionIn our opinion, these financial statements and group financial
statements fairly present, in all material respects, the financial
position of the company and the group at 30 June 2004, and
the results of their operations, changes in equity and cash flows
for the year then ended in accordance with South African
Statements of Generally Accepted Accounting Practice and in
the manner required by the Companies Act in South Africa.
Registered Accountants and Auditors
Chartered Accountants (SA)
Stellenbosch
16 August 2004
Currency of financial statements
46
FI
NA
NC
IA
LS
DI
RE
CT
OR
S’
R
ES
PO
NS
IB
IL
IT
IE
S
AN
D
CE
RT
IF
IC
AT
E
BY
G
RO
UP
S
EC
RE
TA
RY
D ISTELL ANNUAL REPORT 2004
Directors’ responsibilitiesfor financial reporting
Certificate by the group secretary
The Companies Act, 1973, requires the directors to prepare
financial statements for each financial year which fairly present
the state of affairs of the company and the group and the profits
or losses for the period. In preparing these financial statements,
they must:
• select suitable accounting policies and apply them
consistently;
• make judgements and estimates that are reasonable and
prudent;
• state whether set accounting standards have been followed,
subject to any material departures disclosed and explained in
the financial statements; and
• prepare the financial statements on the going concern basis
unless it is inappropriate to presume the group will continue
in business.
The directors are responsible for keeping proper accounting
records, which disclose with reasonable accuracy at any time
the financial position of the company, to ensure the financial
statements comply with the Companies Act, 1973. They have
general responsibility for taking such steps as are reasonably
accessible to them to safeguard the assets of the group and to
prevent and detect fraud and other irregularities.
These annual financial statements are prepared in accordance
with South African Statements of Generally Accepted
Accounting Practice (GAAP) and incorporate full and
responsible disclosure in line with the accounting policies of
the group, supported by reasonable and prudent judgements
and estimates.
The board of directors approves any change in accounting
policy, with their effects fully explained in the annual financial
statements.
The directors have reviewed the group’s budget and cash flow
projections for the period to 30 June 2005. Based on these
projections, and considering the group’s current financial
position and the financing facilities available to it, they are
satisfied it has adequate resources to continue its operations in
the foreseeable future. The annual financial statements were
prepared on a going concern basis.
No event, material to the understanding of this report, has
occurred between the financial year-end and the date of this
report.
A copy of the financial statements of the group is placed on
the company’s website. The directors are responsible for the
maintenance and integrity of statutory and audited information
on the company’s website.
The annual financial statements as set out on pages 47 to 85
have been approved by the board of directors and are signed on
their behalf:
DM Nurek JJ Scannell
Chairman Managing director
Stellenbosch
16 August 2004
In my capacity as group secretary I hereby confirm, in terms of the Companies Act, 1973, that for the year ended 30 June 2004,
the group has lodged with the Registrar of Companies all such returns as are required of a public company in terms of this Act
and that all such returns are true, correct and up to date.
CJ Cronjé
Group secretary
Stellenbosch
16 August 2004
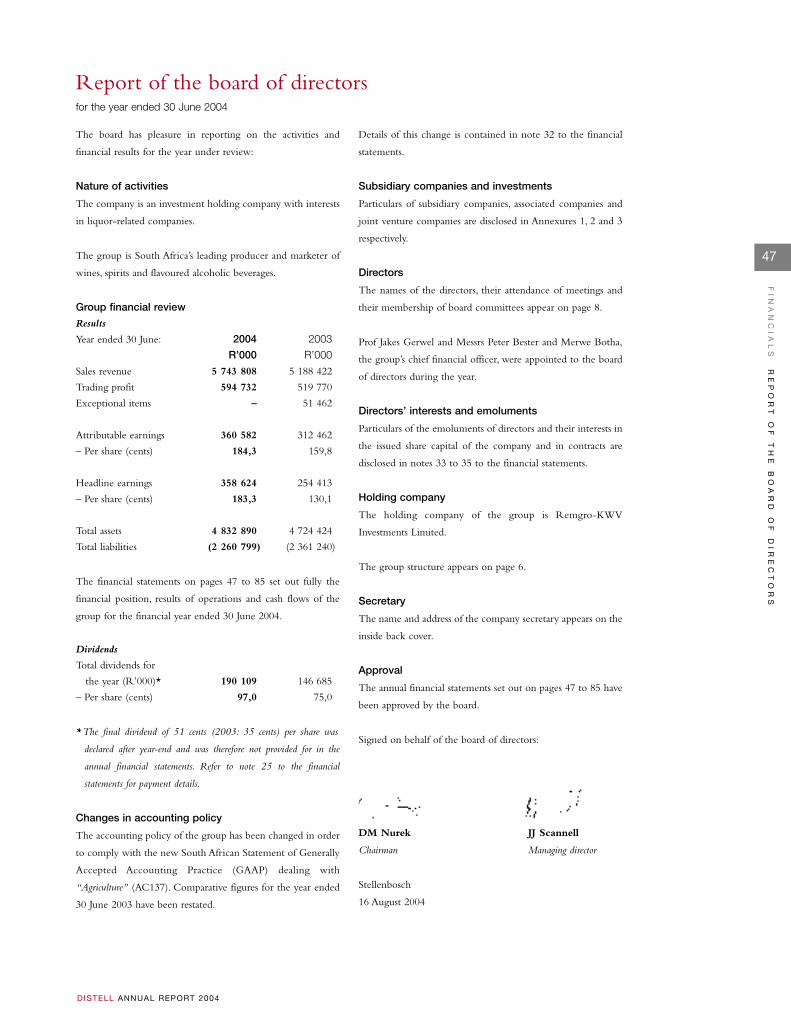
47
FI
NA
NC
IA
LS
RE
PO
RT
O
F
TH
E
BO
AR
D
OF
D
IR
EC
TO
RS
D ISTELL ANNUAL REPORT 2004
Report of the board of directorsfor the year ended 30 June 2004
The board has pleasure in reporting on the activities and
financial results for the year under review:
Nature of activities
The company is an investment holding company with interests
in liquor-related companies.
The group is South Africa’s leading producer and marketer of
wines, spirits and flavoured alcoholic beverages.
Group financial review
Results
Year ended 30 June: 2004 2003
R’000 R’000
Sales revenue 5 743 808 5 188 422
Trading profit 594 732 519 770
Exceptional items – 51 462
Attributable earnings 360 582 312 462
– Per share (cents) 184,3 159,8
Headline earnings 358 624 254 413
– Per share (cents) 183,3 130,1
Total assets 4 832 890 4 724 424
Total liabilities (2 260 799) (2 361 240)
The financial statements on pages 47 to 85 set out fully the
financial position, results of operations and cash flows of the
group for the financial year ended 30 June 2004.
Dividends
Total dividends for
the year (R’000)* 190 109 146 685
– Per share (cents) 97,0 75,0
* The final dividend of 51 cents (2003: 35 cents) per share was
declared after year-end and was therefore not provided for in the
annual financial statements. Refer to note 25 to the financial
statements for payment details.
Changes in accounting policy
The accounting policy of the group has been changed in order
to comply with the new South African Statement of Generally
Accepted Accounting Practice (GAAP) dealing with
“Agriculture” (AC137). Comparative figures for the year ended
30 June 2003 have been restated.
Details of this change is contained in note 32 to the financial
statements.
Subsidiary companies and investments
Particulars of subsidiary companies, associated companies and
joint venture companies are disclosed in Annexures 1, 2 and 3
respectively.
Directors
The names of the directors, their attendance of meetings and
their membership of board committees appear on page 8.
Prof Jakes Gerwel and Messrs Peter Bester and Merwe Botha,
the group’s chief financial officer, were appointed to the board
of directors during the year.
Directors’ interests and emoluments
Particulars of the emoluments of directors and their interests in
the issued share capital of the company and in contracts are
disclosed in notes 33 to 35 to the financial statements.
Holding company
The holding company of the group is Remgro-KWV
Investments Limited.
The group structure appears on page 6.
Secretary
The name and address of the company secretary appears on the
inside back cover.
Approval
The annual financial statements set out on pages 47 to 85 have
been approved by the board.
Signed on behalf of the board of directors:
DM Nurek JJ Scannell
Chairman Managing director
Stellenbosch
16 August 2004
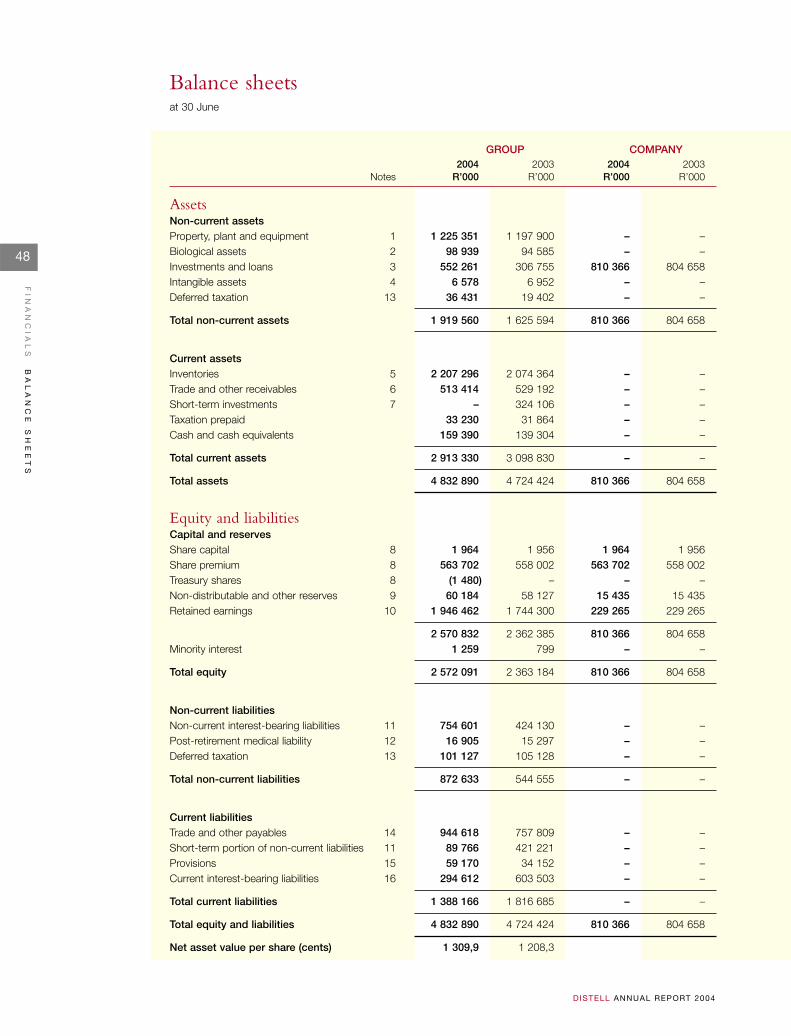
48
FI
NA
NC
IA
LS
BA
LA
NC
E
SH
EE
TS
D ISTELL ANNUAL REPORT 2004
Balance sheetsat 30 June
GROUP COMPANY2004 2003 2004 2003
Notes R’000 R’000 R’000 R’000
AssetsNon-current assetsProperty, plant and equipment 1 1 225 351 1 197 900 – –Biological assets 2 98 939 94 585 – –Investments and loans 3 552 261 306 755 810 366 804 658Intangible assets 4 6 578 6 952 – –Deferred taxation 13 36 431 19 402 – –
Total non-current assets 1 919 560 1 625 594 810 366 804 658
Current assetsInventories 5 2 207 296 2 074 364 – –Trade and other receivables 6 513 414 529 192 – –Short-term investments 7 – 324 106 – –Taxation prepaid 33 230 31 864 – –Cash and cash equivalents 159 390 139 304 – –
Total current assets 2 913 330 3 098 830 – –
Total assets 4 832 890 4 724 424 810 366 804 658
Equity and liabilitiesCapital and reservesShare capital 8 1 964 1 956 1 964 1 956Share premium 8 563 702 558 002 563 702 558 002Treasury shares 8 (1 480) – – –Non-distributable and other reserves 9 60 184 58 127 15 435 15 435Retained earnings 10 1 946 462 1 744 300 229 265 229 265
2 570 832 2 362 385 810 366 804 658Minority interest 1 259 799 – –
Total equity 2 572 091 2 363 184 810 366 804 658
Non-current liabilitiesNon-current interest-bearing liabilities 11 754 601 424 130 – –Post-retirement medical liability 12 16 905 15 297 – –Deferred taxation 13 101 127 105 128 – –
Total non-current liabilities 872 633 544 555 – –
Current liabilitiesTrade and other payables 14 944 618 757 809 – –Short-term portion of non-current liabilities 11 89 766 421 221 – –Provisions 15 59 170 34 152 – –Current interest-bearing liabilities 16 294 612 603 503 – –
Total current liabilities 1 388 166 1 816 685 – –
Total equity and liabilities 4 832 890 4 724 424 810 366 804 658
Net asset value per share (cents) 1 309,9 1 208,3
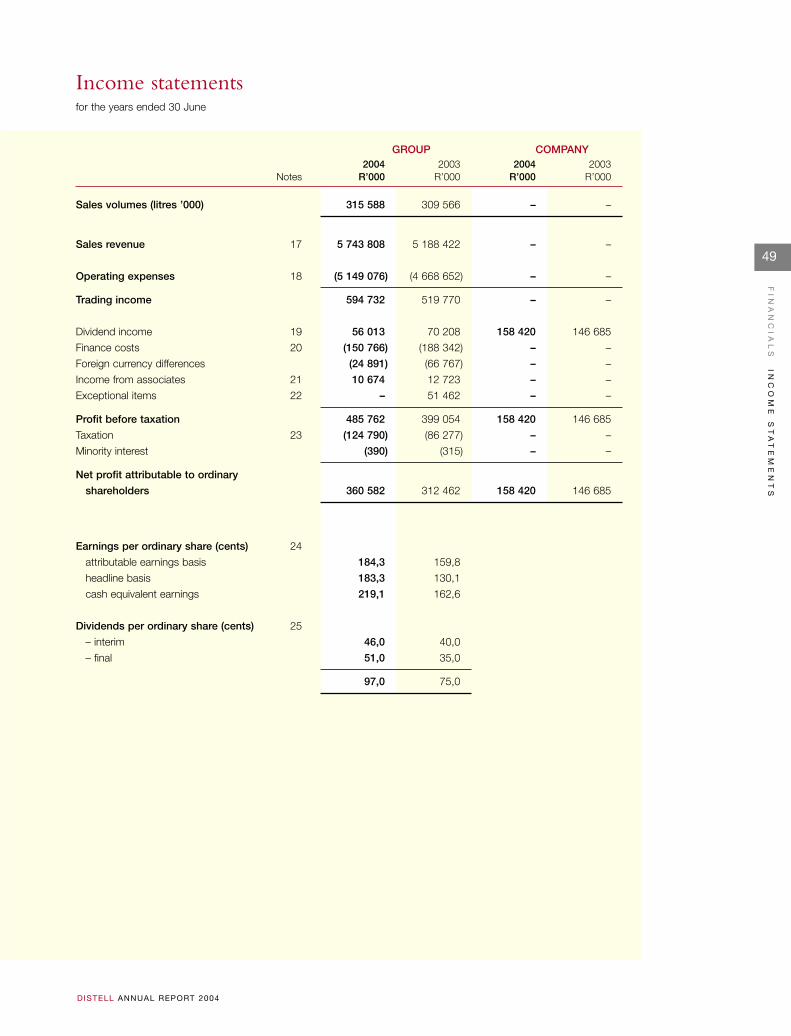
49
FI
NA
NC
IA
LS
IN
CO
ME
S
TA
TE
ME
NT
S
D ISTELL ANNUAL REPORT 2004
Income statementsfor the years ended 30 June
Sales volumes (litres ’000) 315 588 309 566 – –
Sales revenue 17 5 743 808 5 188 422 – –
Operating expenses 18 (5 149 076) (4 668 652) – –
Trading income 594 732 519 770 – –
Dividend income 19 56 013 70 208 158 420 146 685
Finance costs 20 (150 766) (188 342) – –
Foreign currency differences (24 891) (66 767) – –
Income from associates 21 10 674 12 723 – –
Exceptional items 22 – 51 462 – –
Profit before taxation 485 762 399 054 158 420 146 685
Taxation 23 (124 790) (86 277) – –
Minority interest (390) (315) – –
Net profit attributable to ordinary
shareholders 360 582 312 462 158 420 146 685
Earnings per ordinary share (cents) 24
attributable earnings basis 184,3 159,8
headline basis 183,3 130,1
cash equivalent earnings 219,1 162,6
Dividends per ordinary share (cents) 25
– interim 46,0 40,0
– final 51,0 35,0
97,0 75,0
GROUP COMPANY2004 2003 2004 2003
Notes R’000 R’000 R’000 R’000
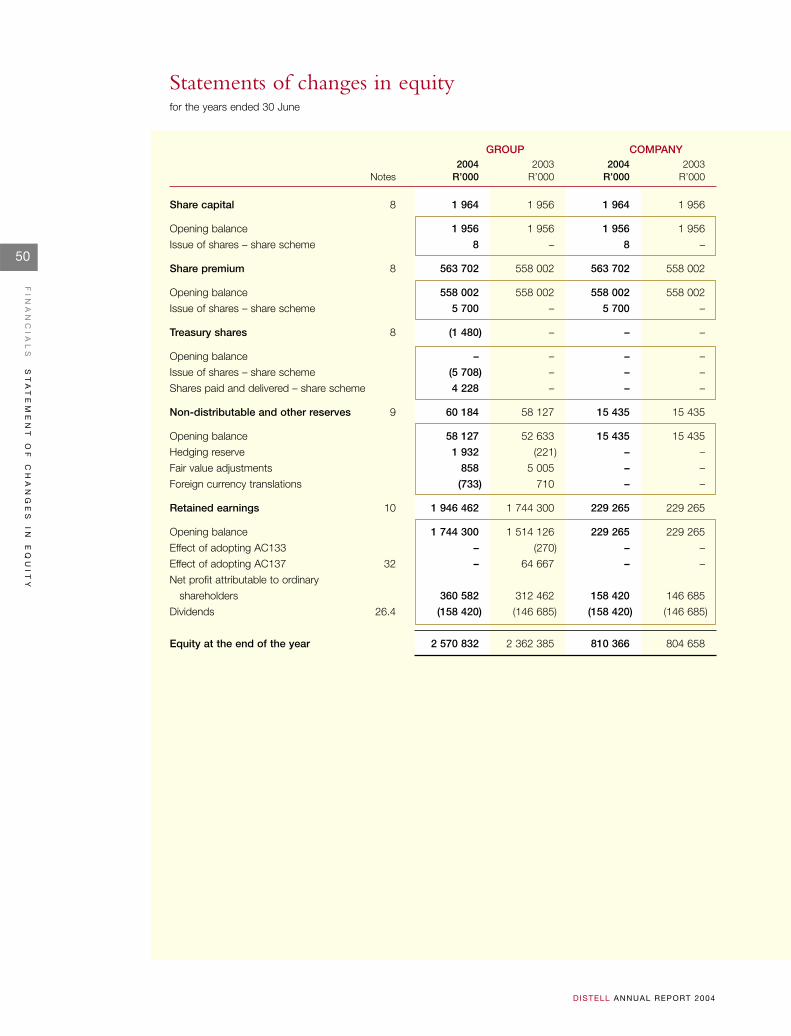
50
FI
NA
NC
IA
LS
ST
AT
EM
EN
T
OF
C
HA
NG
ES
I
N
EQ
UI
TY
D ISTELL ANNUAL REPORT 2004
Statements of changes in equityfor the years ended 30 June
GROUP COMPANY2004 2003 2004 2003
Notes R’000 R’000 R’000 R’000
Share capital 8 1 964 1 956 1 964 1 956
Opening balance 1 956 1 956 1 956 1 956
Issue of shares – share scheme 8 – 8 –
Share premium 8 563 702 558 002 563 702 558 002
Opening balance 558 002 558 002 558 002 558 002
Issue of shares – share scheme 5 700 – 5 700 –
Treasury shares 8 (1 480) – – –
Opening balance – – – –
Issue of shares – share scheme (5 708) – – –
Shares paid and delivered – share scheme 4 228 – – –
Non-distributable and other reserves 9 60 184 58 127 15 435 15 435
Opening balance 58 127 52 633 15 435 15 435
Hedging reserve 1 932 (221) – –
Fair value adjustments 858 5 005 – –
Foreign currency translations (733) 710 – –
Retained earnings 10 1 946 462 1 744 300 229 265 229 265
Opening balance 1 744 300 1 514 126 229 265 229 265
Effect of adopting AC133 – (270) – –
Effect of adopting AC137 32 – 64 667 – –
Net profit attributable to ordinary
shareholders 360 582 312 462 158 420 146 685
Dividends 26.4 (158 420) (146 685) (158 420) (146 685)
Equity at the end of the year 2 570 832 2 362 385 810 366 804 658
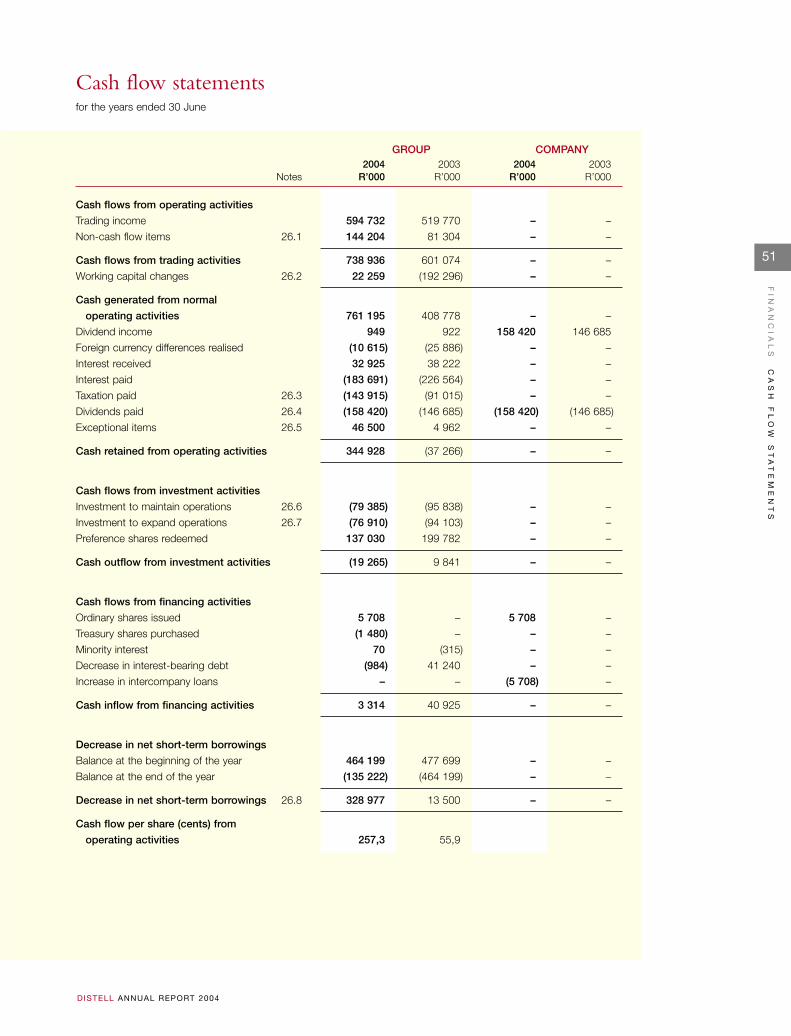
51
FI
NA
NC
IA
LS
CA
SH
F
LO
W
ST
AT
EM
EN
TS
D ISTELL ANNUAL REPORT 2004
Cash flow statementsfor the years ended 30 June
Cash flows from operating activities
Trading income 594 732 519 770 – –
Non-cash flow items 26.1 144 204 81 304 – –
Cash flows from trading activities 738 936 601 074 – –
Working capital changes 26.2 22 259 (192 296) – –
Cash generated from normal
operating activities 761 195 408 778 – –
Dividend income 949 922 158 420 146 685
Foreign currency differences realised (10 615) (25 886) – –
Interest received 32 925 38 222 – –
Interest paid (183 691) (226 564) – –
Taxation paid 26.3 (143 915) (91 015) – –
Dividends paid 26.4 (158 420) (146 685) (158 420) (146 685)
Exceptional items 26.5 46 500 4 962 – –
Cash retained from operating activities 344 928 (37 266) – –
Cash flows from investment activities
Investment to maintain operations 26.6 (79 385) (95 838) – –
Investment to expand operations 26.7 (76 910) (94 103) – –
Preference shares redeemed 137 030 199 782 – –
Cash outflow from investment activities (19 265) 9 841 – –
Cash flows from financing activities
Ordinary shares issued 5 708 – 5 708 –
Treasury shares purchased (1 480) – – –
Minority interest 70 (315) – –
Decrease in interest-bearing debt (984) 41 240 – –
Increase in intercompany loans – – (5 708) –
Cash inflow from financing activities 3 314 40 925 – –
Decrease in net short-term borrowings
Balance at the beginning of the year 464 199 477 699 – –
Balance at the end of the year (135 222) (464 199) – –
Decrease in net short-term borrowings 26.8 328 977 13 500 – –
Cash flow per share (cents) from
operating activities 257,3 55,9
GROUP COMPANY2004 2003 2004 2003
Notes R’000 R’000 R’000 R’000
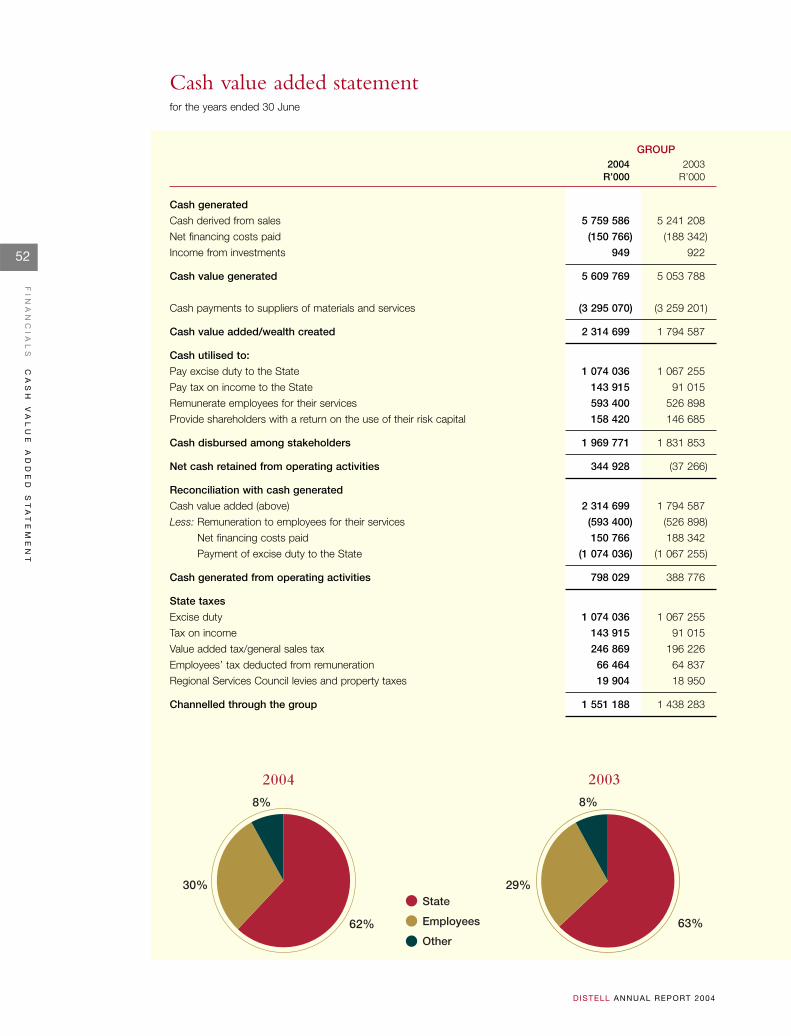
52
FI
NA
NC
IA
LS
CA
SH
V
AL
UE
A
DD
ED
S
TA
TE
ME
NT
D ISTELL ANNUAL REPORT 2004
Cash value added statementfor the years ended 30 June
GROUP2004 2003
R’000 R’000
Cash generated
Cash derived from sales 5 759 586 5 241 208
Net financing costs paid (150 766) (188 342)
Income from investments 949 922
Cash value generated 5 609 769 5 053 788
Cash payments to suppliers of materials and services (3 295 070) (3 259 201)
Cash value added/wealth created 2 314 699 1 794 587
Cash utilised to:
Pay excise duty to the State 1 074 036 1 067 255
Pay tax on income to the State 143 915 91 015
Remunerate employees for their services 593 400 526 898
Provide shareholders with a return on the use of their risk capital 158 420 146 685
Cash disbursed among stakeholders 1 969 771 1 831 853
Net cash retained from operating activities 344 928 (37 266)
Reconciliation with cash generated
Cash value added (above) 2 314 699 1 794 587
Less: Remuneration to employees for their services (593 400) (526 898)
Net financing costs paid 150 766 188 342
Payment of excise duty to the State (1 074 036) (1 067 255)
Cash generated from operating activities 798 029 388 776
State taxes
Excise duty 1 074 036 1 067 255
Tax on income 143 915 91 015
Value added tax/general sales tax 246 869 196 226
Employees’ tax deducted from remuneration 66 464 64 837
Regional Services Council levies and property taxes 19 904 18 950
Channelled through the group 1 551 188 1 438 283
State
Employees
Other
2004
62%
30%
8%
2003
63%
29%
8%
53
FI
NA
NC
IA
LS
AC
CO
UN
TI
NG
P
OL
IC
IE
S
D ISTELL ANNUAL REPORT 2004
Accounting policies and definitions
1. Accounting policiesThe principal accounting policies of the group conformto South African Statements of Generally AcceptedAccounting Practice effective for the group’s financialyear. These policies are consistent, except for biologicalassets, with those applied in the previous year. Changesare dealt with in note 32.
The annual financial statements have been prepared inaccordance with the historical cost convention, asmodified by the restatement of biological assets andcertain financial instruments to fair value.
1.1 Basis of consolidationSubsidiariesSubsidiary undertakings, which are those companies inwhich the group, directly or indirectly, has an interest ofmore than one half of the voting rights or otherwise haspower to exercise control over the operations, have beenconsolidated. Subsidiaries are consolidated from the dateon which effective control is transferred to the group andare no longer consolidated from the date of disposal. Allintercompany transactions, balances and unrealisedsurpluses and deficits on transactions between groupcompanies have been eliminated. Where necessary,accounting policies for subsidiaries have been changed toensure consistency with the policies adopted by the group.Separate disclosure is made of minority interests.
A listing of the group’s principal subsidiaries is set out inannexure 1 to the annual financial statements.
Associate companies
Investments in associated undertakings are accounted forby the equity method of accounting. These areundertakings over which the group has between 20% and50% of the voting rights, and over which the groupexercises significant influence, but which it does notcontrol. Equity accounting involves recognising in theincome statement the group’s share of the associate’s profitor loss for the year.The group’s interest in the associate iscarried in the balance sheet at an amount that reflects itsshare of the net assets of the associate and includesgoodwill on the acquisition. Provisions are recorded forlong-term impairment in value.
A listing of the group’s principal associated under-takings is set out in annexure 2 to the annual financialstatements.
Joint venturesThe group’s interest is accounted for by proportionateconsolidation.
Under this method, the group includes its share of thejoint ventures’ individual income and expenses, assets and
liabilities in the relevant components of the financialstatements on a line-by-line basis.
Further details about the joint ventures are set out inannexure 3 to the annual financial statements.
Business combinationsA business combination that is an acquisition isaccounted for in accordance with the purchase method.
A uniting of interests is accounted for using the poolingof interests method.
Transactions among enterprises under common controlare accounted for using predecessor accounting.
1.2 Property, plant and equipment Land and buildings are recorded at their historical costs.Buildings are depreciated on the straight-line method overtheir estimated useful lives. Improvements to leaseholdproperties are depreciated over the periods of the leases.
Machinery, equipment and vehicles are recorded athistoric cost and depreciated on the straight-line methodover their estimated useful lives.
Capitalised leased assets are assets leased in terms offinance lease agreements. It is capitalised at theirequivalent cash consideration. Depreciation is providedon the straight-line method over their estimated usefullives. Finance charges are written off over the term of thelease in accordance with the effective interest ratemethod. Leases of assets in terms of which all the risksand benefits of ownership are effectively retained by thelessor are classified as operating leases. Payments madeunder operating leases are accounted for in normalincome.
Gains and losses on disposal of property, plant andequipment are determined by reference to their carryingamounts which are taken into account in determiningoperating profit.
Software packages and the direct costs associated withthe development and installation thereof, are capitalisedand depreciated on the straight-line method over theirestimated useful lives from commencement of use.
Where the carrying amount of an asset is greater than itsestimated recoverable amount, impairment losses arerecognised and it is written down immediately to itsrecoverable amount.
Finance costs on borrowings to finance the constructionof property, plant and equipment are recognised as anexpense when incurred.
54
FI
NA
NC
IA
LS
AC
CO
UN
TI
NG
P
OL
IC
IE
S
D ISTELL ANNUAL REPORT 2004
Accounting policies and definitions
1.3 Biological assetsBiological assets consist of grape vines which are valuedat fair value by discounting its net cash flows over theremaining lives thereof at an appropriate discount rate.
Gains and losses arising from changes in fair value areaccounted for in income in the period in which they arise.
1.4 Investments and loansNon-current investments are initially measured at cost,which includes transaction costs on transaction date.Subsequent to initial recognition these instruments aremeasured as follows:
Held for trading and available-for-sale investmentsMarketable securities are carried at fair value, which iscalculated by reference to exchange quoted selling pricesat the close of business on 30 June.
Non-listed investments are carried at fair value, which isdetermined by utilising accepted valuation techniques.
Other investments and loansOther investments are carried at amortised cost.
On disposal of an investment, the difference between thenet disposal proceeds and the carrying amount is chargedor credited against income.
The investment of Distell Group Limited in SouthAfrican Distilleries and Wines (SA) Limited is disclosedat cost in the company financial statements.
1.5 Intangible assets GoodwillGoodwill represents the excess of the cost of an acquisitionover the fair value of the group’s share of the net assets ofthe acquired subsidiaries/associates at the date ofacquisition. Goodwill on acquisitions occurring between1 July 2000 and 31 March 2004 is reported in the balancesheet as an intangible asset and is amortised using thestraight-line method over its estimated useful life.Goodwillon acquisitions that occurred prior to 1 July 2000 wascharged in full to retained earnings; such goodwill has notbeen retroactively capitalised and amortised. Goodwill onacquisitions on or after 31 March 2004 is carried at cost.
Goodwill arising on major strategic acquisitions of thegroup to expand its product or geographical marketcoverage is amortised over a maximum period of twentyyears. For all other acquisitions goodwill is generallyamortised over a shorter period not exceeding five years.
The carrying amount of goodwill is reviewed annuallyand written down for permanent impairment where it isconsidered necessary.
The gain or loss on disposal of an entity includesthe unamortised balance of goodwill relating to theentity disposed.
TrademarksExpenditure on the acquisition of trademarks or brandsare capitalised at the cost to the group and amortised onthe straight-line method over its estimated useful life,generally twenty years. No value is placed on internallydeveloped trademarks or brands.
The carrying amount of each intangible asset is reviewedannually and adjusted for impairment where it isconsidered necessary.
Expenditure to maintain trademarks and brands isaccounted for against income as incurred.
1.6 Research and developmentResearch and development expenditure are accountedfor against income as incurred.
1.7 Inventories Inventories are stated at the lower of cost or net realisablevalue. Cost is determined by the first-in first-out (FIFO)method. The cost of finished goods and work inprogress comprises raw materials, direct labour, otherdirect costs and related production overheads, butexcludes interest expense.
Net realisable value is the estimate of the selling price inthe ordinary course of business, less the costs ofcompletion and selling expenses.
1.8 TaxationDeferred taxation is provided at current ratesusing the liability method. Provision is made forall temporary differences between the taxation basesof the assets and liabilities and their balance sheetcarrying values.
No deferred tax liability is recognised in thosecircumstances where the initial recognition at the date ofacquisition of an asset or liability has no impact onaccounting profit or taxable income.
Assets are not raised in respect of deferred taxation onassessed losses, unless it is probable that future taxableprofits will be available against which the unused taxlosses can be utilised in the foreseeable future.
Secondary taxation on companies (STC) is provided inrespect of dividend payments, net of dividends receivedor receivable and is recognised as a taxation charge forthe year in which the dividend is paid.
55
FI
NA
NC
IA
LS
AC
CO
UN
TI
NG
P
OL
IC
IE
S
D ISTELL ANNUAL REPORT 2004
Deferred tax is provided on unutilised STC creditswhich will be utilised in the foreseeable future.
Non-resident shareholders’ taxation is provided inrespect of foreign dividends receivable only when thedividend is recognised.
1.9 Trade and other receivablesTrade and other receivables originated by the group arecarried at cost less provision for doubtful debts. Anestimate is made for doubtful receivables based ona review of all outstanding amounts at the year-end.Bad debts are written off during the year in which theyare identified.
1.10 Cash and cash equivalentsCash and cash equivalents are measured at amortised cost.
1.11 Treasury sharesShares in the company held by The Distell Group ShareTrust are classified as treasury shares and are held at cost.These shares are treated as a deduction from the issuednumber of shares and taken into account in the calculationof the weighted average number of shares.The cost priceof the shares is deducted from the group’s equity.
1.12 ProvisionsProvisions are recognised when the group has a presentlegal or constructive obligation, as a result of past events,for which it is probable that an outflow of resources thatcan be reliably estimated, will be required to settle theobligation.
1.13 Foreign entitiesThe assets and liabilities of foreign entities are translatedinto South African rand at exchange rates ruling at thefinancial year-end. Income and expenditure items aretranslated using average rates of exchange during therelevant accounting period. Differences arising ontranslation are reflected in non-distributable reserves.
1.14 Foreign currency transactions and balancesTransactions in foreign currencies are converted to SouthAfrican rand at the spot rate on the date of thetransactions. Monetary assets, liabilities and commitmentsin foreign currencies are translated to South African randusing rates of exchange ruling at the financial year-end.Forward exchange contracts are converted at the market-related forward rates at the financial year-end.Differences arising on translation are reflected separatelyin the income statement.
1.15 Financial instrumentsFinancial instruments are initially measured at cost,which includes transaction costs. Financial instrumentscarried on the balance sheet consist of cash and bank
balances, investments, receivables, trade creditors, leasesand borrowings. The particular recognition methodsadopted are disclosed in the individual policy statementsassociated with each item.
DerivativesDerivative assets and liabilities, which are traded in anorganised financial market, are remeasured at the currentquoted market bid price for assets held or liabilities to beissued or the offer price for assets to be acquired orliabilities held.
The group is party to financial instruments that reduceexposure to fluctuations in foreign currency exchangeand interest rates. These instruments mainly compriseforeign currency forward contracts and interest rate swapagreements. The purpose of these instruments is toreduce risk.
Foreign currency forward contracts protect the groupfrom movements in exchange rates by establishing therate at which a foreign currency asset or liability will besettled.
Interest rate swap agreements protect the group frommovements in interest rates.Any differential to be paid orreceived on an interest rate swap agreement is recognisedas a component of interest revenue or expense over theperiod of the agreement. Gains and losses on earlytermination of interest rate swaps or on repayment of theborrowing are taken to the income statement.
Gains and losses on subsequent measurementGains and losses on subsequent measurement arerecognised as follows:• Gains and losses arising from a change in the fair value
of financial instruments that are not part of a hedgingrelationship are included in net profit or loss for theperiod in which they arise, except for available-for-salefinancial assets, where the gains and losses arerecognised directly in equity until the financial asset isdisposed or a permanent devaluation occurs.
• Gains and losses arising from the subsequentmeasurement of fair value hedging instruments arerecognised immediately in net profit or loss.
• Gains and losses arising from subsequent measurementof cash flow hedging instruments are initiallyrecognised directly in equity. If the hedged firmcommitment or forecasted transaction results in therecognition of an asset or liability, then the cumulativeamount recognised in equity is adjusted against theinitial measurement of the asset or the liability. Forother cash flow hedges, the cumulative amountrecognised in equity is included in net profit or loss inthe period when the commitment or forecastedtransaction affects profit or loss.
56
FI
NA
NC
IA
LS
AC
CO
UN
TI
NG
P
OL
IC
IE
S
D ISTELL ANNUAL REPORT 2004
Accounting policies and definitions
OffsettingWhere a legally enforceable right of set-off exists forrecognised financial assets and financial liabilities, andwhere there is an intention to settle the liability andrealise the asset simultaneously, or to settle on a net basis,all related financial effects are offset.
Disclosure about financial instruments to which thegroup is a party is provided in note 30 to the annualfinancial statements.
1.16 Employee benefitsRetirement fundsThe group provides pension, retirement or providentfund benefits to all employees.
For defined benefit plans, the pension accounting costsare assessed using the projected unit credit method.Under this method, the cost of providing pensions ischarged to the income statement to spread regular costsover the service lives of the employees. The pensionobligation is measured as the present value of theestimated future cash outflows using interest rates ofgovernment securities that have terms to maturityapproximating the terms of the related liability.
The net surplus or deficit of the benefit obligation is thedifference between the present value of the fundedobligations and the fair value of the plan assets.
All actuarial gains and losses are spread forward over theaverage remaining service lives of employees.
Contributions of the group to defined contributionpension plans are accounted for against income when theemployees render the related services.
Medical fundsMedical aid costs are accounted for against incomeduring the period when employees render services to thegroup.
The group provides for actuarially determined futuremedical benefits of employees who retire based on theemployee’s remaining years in service up to retirementage and completing a minimum service period.
The expected costs of these benefits are accumulatedover the period of employment, using methodologysimilar to that for defined pension plans. Valuation ofthese obligations is carried out by independent qualifiedactuaries.
Equity compensation benefitsShare options are granted to management and keyemployees with more than three years of service.Options
are granted at the market price of the shares on thedate of the offer and are exercisable at that price. Optionsare exercisable within one year from the date of offerand are payable within ten years in three equalinstalments of which the first instalment is only payableafter three years. The proceeds received, net ofany transaction costs, are credited to share capital(nominal value) and share premium.The group does notmake a charge to staff costs in connection with shareoptions.
1.17 Merger provisions Costs specifically attributable to the merger mainlycomprise lease termination penalties and employeetermination payments, and are recognised in the periodin which they are incurred. Employee terminationbenefits are provided for based on the number ofemployees identified to be made redundant.
Any fixed assets that are no longer required fortheir original use are disclosed as a separate line itemunder property, plant and equipment and carriedat the lower of the carrying amount or estimatedrealisable value.
1.18 Revenue recognitionSales are recognised upon delivery of products andcustomer acceptance, if any, or performance of services,net of value added taxes (VAT) and general sales taxes(GST) and discounts, and after eliminating sales withinthe group.
Other revenues earned by the group are recognised onthe following basis:• Interest income: as it accrues unless collectability is
in doubt• Dividend income: when the shareholder has an
irrevocable right to receive payment.
1.19 Segment reportingThe group is a manufacturer, marketer and distributor ofalcoholic beverages.
The only primary business segment identified is liquor.
On a secondary reporting format, significant geographicdistribution regions have been defined (note 27).
Costs between the regions are allocated on an actual costbasis.
1.20 Exceptional itemsExceptional items are material items which arise fromevents or transactions that fall within the ordinaryactivities of the group. They are disclosed separately byvirtue of their size or incidence.
57
FI
NA
NC
IA
LS
DE
FI
NI
TI
ON
S
AN
D
RA
TI
OS
D ISTELL ANNUAL REPORT 2004
2. Definitions and ratios2.1 Acid test ratio
Current assets, excluding inventories, divided by totalcurrent liabilities.
2.2 Cash flow per ordinary shareCash flow from operating activities before dividendspaid, divided by the number of ordinary shares in issue.This basis identifies the cash stream actually achieved inthe period under review.
2.3 Cash and cash equivalentsFor the purposes of the cash flow statement, cash andcash equivalents comprise cash on hand, deposits held atcall with banks, and investments in money marketinstruments, net of bank overdrafts. In the balance sheet,bank overdrafts are included in interest-bearing liabilitiesunder current liabilities.
2.4 Current ratioCurrent assets divided by total current liabilities.
2.5 Dividend coverHeadline earnings per ordinary share divided bydividends per ordinary share.
2.6 Dividend yieldDividends per ordinary share divided by the weightedaverage price per share during the year.
2.7 Earnings per ordinary shareAttributable earnings basisEarnings attributable to ordinary shareholders divided bythe weighted average number of ordinary shares in issue.
Headline basisEarnings attributable to ordinary shareholders, aftertaking into account the adjustments explained innote 24.2, divided by the weighted average number ofordinary shares in issue.
Cash equivalent basisEarnings attributable to ordinary shareholders, aftertaking into account the adjustments explained innote 24.3, divided by the weighted average number ofordinary shares in issue.This basis recognises the potentialof the earnings stream to generate cash.
2.8 Earnings yieldHeadline earnings per ordinary share divided by theclosing share price at year-end on the JSE SecuritiesExchange South Africa (JSE).
2.9 Effective tax rateThe tax charge for the year divided by the profit beforetaxation.
2.10 Financial gearing ratioThe ratio of interest-bearing liabilities, net of cash andcash equivalents, to total equity.
2.11 Interest-free liabilities to total assetsInterest-free liabilities, excluding post-retirementmedical liability, divided by total assets (both excludingdeferred taxation).
2.12 Net asset turnSales revenue divided by net assets at year-end.
2.13 Net asset value per ordinary shareTotal equity divided by the number of ordinary sharesin issue.
2.14 Pre-tax return on equityProfit before taxation as a percentage of closing equity.
2.15 Price earnings ratioThe closing share price at year-end on the JSE, dividedby headline earnings per ordinary share for that year.
2.16 Rate of improvement in shareholders’ wealthThis represents the internal rate of return over a seven-year period. It is computed by recognising the marketprice of a Distell ordinary share seven years ago as a cashoutflow, recognising the annual cash dividend streams pershare and the closing share price at the end of the currentyear as inflows and then determining the discount rateinherent to these cash flow streams.The equivalent of themarket price of a Distell ordinary share seven years agois computed by dividing the total market capitalisation ofboth Distillers and SFW at that date by the number ofordinary shares in issue at 30 June 2004 (196,4 millionshares).
2.17 Return on equityHeadline earnings divided by closing equity.
2.18 Sales revenueRevenue comprises income from sales in the ordinarycourse of business, net of VAT and GST, but inclusive ofexcise duty levied on domestic sales of wine and spirits.
2.19 Weighted average price paid per share tradedThe total value of shares traded divided by the totalnumber of shares traded for the year on the JSE.
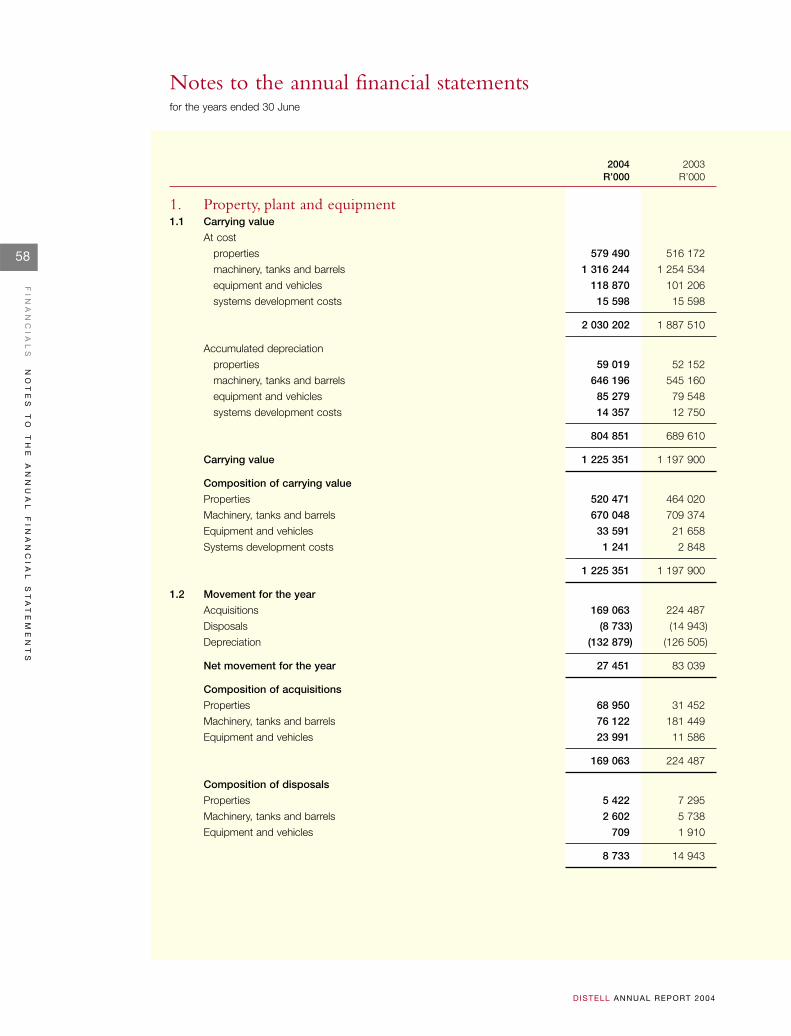
58
FI
NA
NC
IA
LS
NO
TE
S
TO
T
HE
A
NN
UA
L
FI
NA
NC
IA
L
ST
AT
EM
EN
TS
D ISTELL ANNUAL REPORT 2004
Notes to the annual financial statementsfor the years ended 30 June
2004 2003R’000 R’000
1. Property, plant and equipment1.1 Carrying value
At cost
properties 579 490 516 172
machinery, tanks and barrels 1 316 244 1 254 534
equipment and vehicles 118 870 101 206
systems development costs 15 598 15 598
2 030 202 1 887 510
Accumulated depreciation
properties 59 019 52 152
machinery, tanks and barrels 646 196 545 160
equipment and vehicles 85 279 79 548
systems development costs 14 357 12 750
804 851 689 610
Carrying value 1 225 351 1 197 900
Composition of carrying value
Properties 520 471 464 020
Machinery, tanks and barrels 670 048 709 374
Equipment and vehicles 33 591 21 658
Systems development costs 1 241 2 848
1 225 351 1 197 900
1.2 Movement for the year
Acquisitions 169 063 224 487
Disposals (8 733) (14 943)
Depreciation (132 879) (126 505)
Net movement for the year 27 451 83 039
Composition of acquisitions
Properties 68 950 31 452
Machinery, tanks and barrels 76 122 181 449
Equipment and vehicles 23 991 11 586
169 063 224 487
Composition of disposals
Properties 5 422 7 295
Machinery, tanks and barrels 2 602 5 738
Equipment and vehicles 709 1 910
8 733 14 943
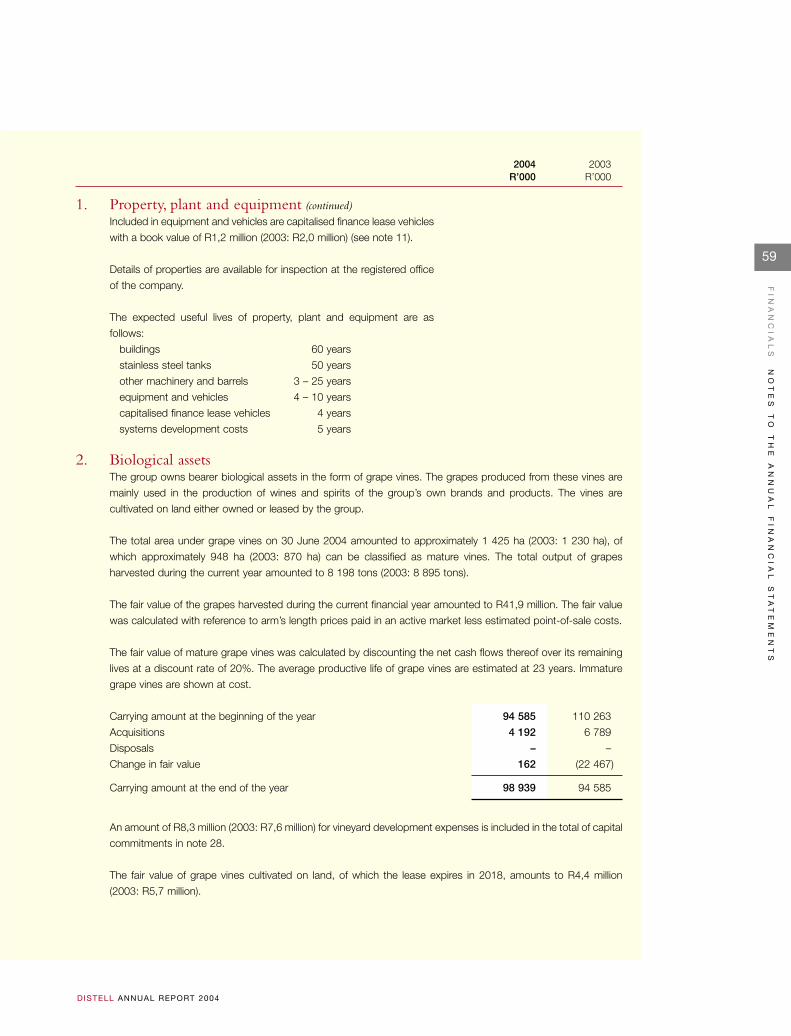
59
FI
NA
NC
IA
LS
NO
TE
S
TO
T
HE
A
NN
UA
L
FI
NA
NC
IA
L
ST
AT
EM
EN
TS
D ISTELL ANNUAL REPORT 2004
1. Property, plant and equipment (continued)Included in equipment and vehicles are capitalised finance lease vehicles
with a book value of R1,2 million (2003: R2,0 million) (see note 11).
Details of properties are available for inspection at the registered office
of the company.
The expected useful lives of property, plant and equipment are as
follows:
buildings 60 years
stainless steel tanks 50 years
other machinery and barrels 3 – 25 years
equipment and vehicles 4 – 10 years
capitalised finance lease vehicles 4 years
systems development costs 5 years
2. Biological assetsThe group owns bearer biological assets in the form of grape vines. The grapes produced from these vines are
mainly used in the production of wines and spirits of the group’s own brands and products. The vines are
cultivated on land either owned or leased by the group.
The total area under grape vines on 30 June 2004 amounted to approximately 1 425 ha (2003: 1 230 ha), of
which approximately 948 ha (2003: 870 ha) can be classified as mature vines. The total output of grapes
harvested during the current year amounted to 8 198 tons (2003: 8 895 tons).
The fair value of the grapes harvested during the current financial year amounted to R41,9 million. The fair value
was calculated with reference to arm’s length prices paid in an active market less estimated point-of-sale costs.
The fair value of mature grape vines was calculated by discounting the net cash flows thereof over its remaining
lives at a discount rate of 20%. The average productive life of grape vines are estimated at 23 years. Immature
grape vines are shown at cost.
Carrying amount at the beginning of the year 94 585 110 263
Acquisitions 4 192 6 789
Disposals – –
Change in fair value 162 (22 467)
Carrying amount at the end of the year 98 939 94 585
An amount of R8,3 million (2003: R7,6 million) for vineyard development expenses is included in the total of capital
commitments in note 28.
The fair value of grape vines cultivated on land, of which the lease expires in 2018, amounts to R4,4 million
(2003: R5,7 million).
2004 2003R’000 R’000
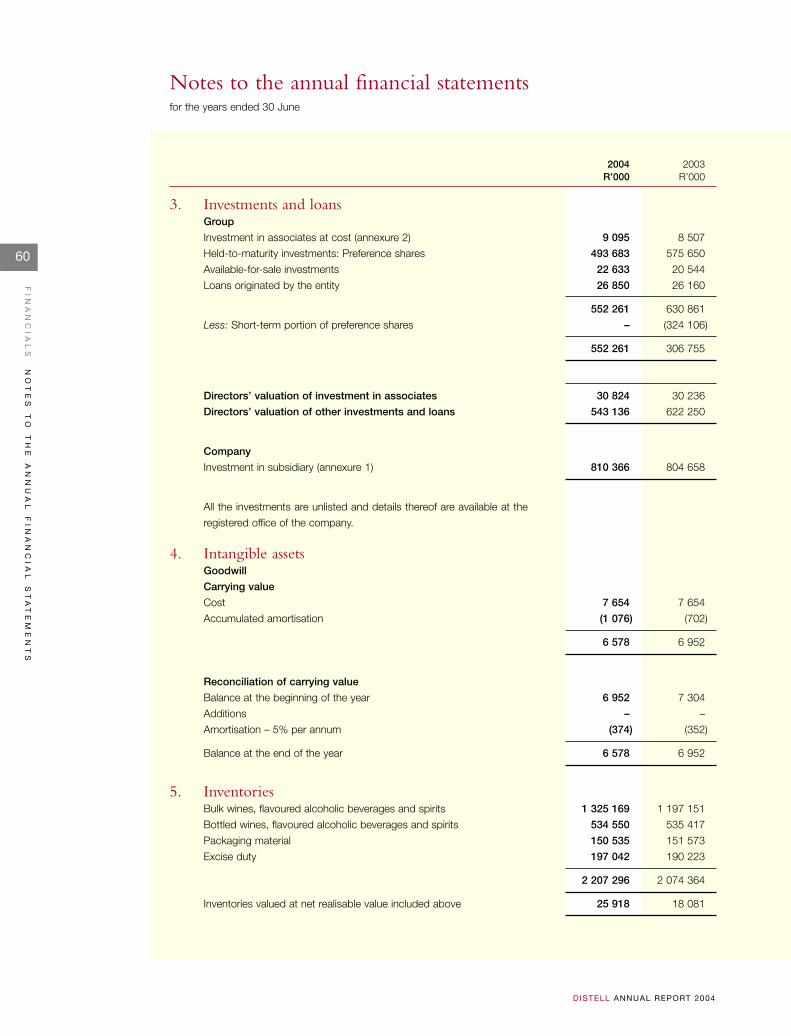
60
FI
NA
NC
IA
LS
NO
TE
S
TO
T
HE
A
NN
UA
L
FI
NA
NC
IA
L
ST
AT
EM
EN
TS
D ISTELL ANNUAL REPORT 2004
Notes to the annual financial statementsfor the years ended 30 June
2004 2003R’000 R’000
3. Investments and loansGroup
Investment in associates at cost (annexure 2) 9 095 8 507
Held-to-maturity investments: Preference shares 493 683 575 650
Available-for-sale investments 22 633 20 544
Loans originated by the entity 26 850 26 160
552 261 630 861
Less: Short-term portion of preference shares – (324 106)
552 261 306 755
Directors’ valuation of investment in associates 30 824 30 236
Directors’ valuation of other investments and loans 543 136 622 250
Company
Investment in subsidiary (annexure 1) 810 366 804 658
All the investments are unlisted and details thereof are available at the
registered office of the company.
4. Intangible assetsGoodwill
Carrying value
Cost 7 654 7 654
Accumulated amortisation (1 076) (702)
6 578 6 952
Reconciliation of carrying value
Balance at the beginning of the year 6 952 7 304
Additions – –
Amortisation – 5% per annum (374) (352)
Balance at the end of the year 6 578 6 952
5. InventoriesBulk wines, flavoured alcoholic beverages and spirits 1 325 169 1 197 151
Bottled wines, flavoured alcoholic beverages and spirits 534 550 535 417
Packaging material 150 535 151 573
Excise duty 197 042 190 223
2 207 296 2 074 364
Inventories valued at net realisable value included above 25 918 18 081
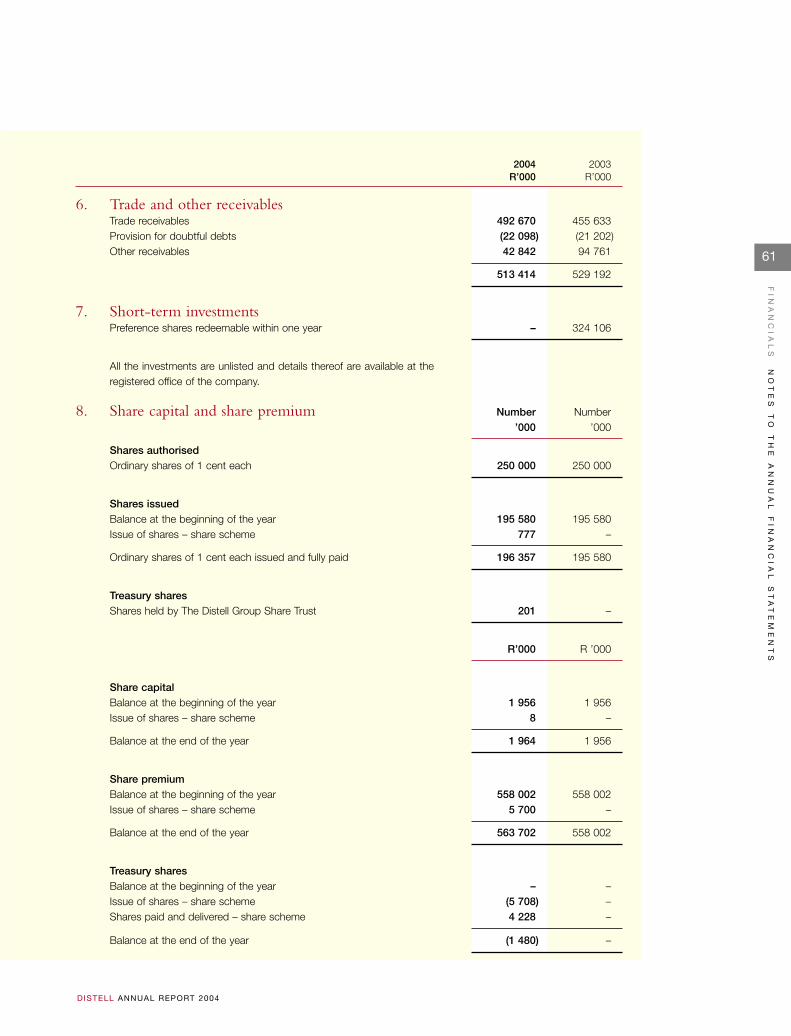
61
FI
NA
NC
IA
LS
NO
TE
S
TO
T
HE
A
NN
UA
L
FI
NA
NC
IA
L
ST
AT
EM
EN
TS
D ISTELL ANNUAL REPORT 2004
6. Trade and other receivablesTrade receivables 492 670 455 633 Provision for doubtful debts (22 098) (21 202)Other receivables 42 842 94 761
513 414 529 192
7. Short-term investmentsPreference shares redeemable within one year – 324 106
All the investments are unlisted and details thereof are available at theregistered office of the company.
8. Share capital and share premium Number Number’000 ’000
Shares authorisedOrdinary shares of 1 cent each 250 000 250 000
Shares issuedBalance at the beginning of the year 195 580 195 580 Issue of shares – share scheme 777 –
Ordinary shares of 1 cent each issued and fully paid 196 357 195 580
Treasury sharesShares held by The Distell Group Share Trust 201 –
R’000 R ’000
Share capitalBalance at the beginning of the year 1 956 1 956 Issue of shares – share scheme 8 –
Balance at the end of the year 1 964 1 956
Share premiumBalance at the beginning of the year 558 002 558 002 Issue of shares – share scheme 5 700 –
Balance at the end of the year 563 702 558 002
Treasury sharesBalance at the beginning of the year – –Issue of shares – share scheme (5 708) –Shares paid and delivered – share scheme 4 228 –
Balance at the end of the year (1 480) –
2004 2003R’000 R’000
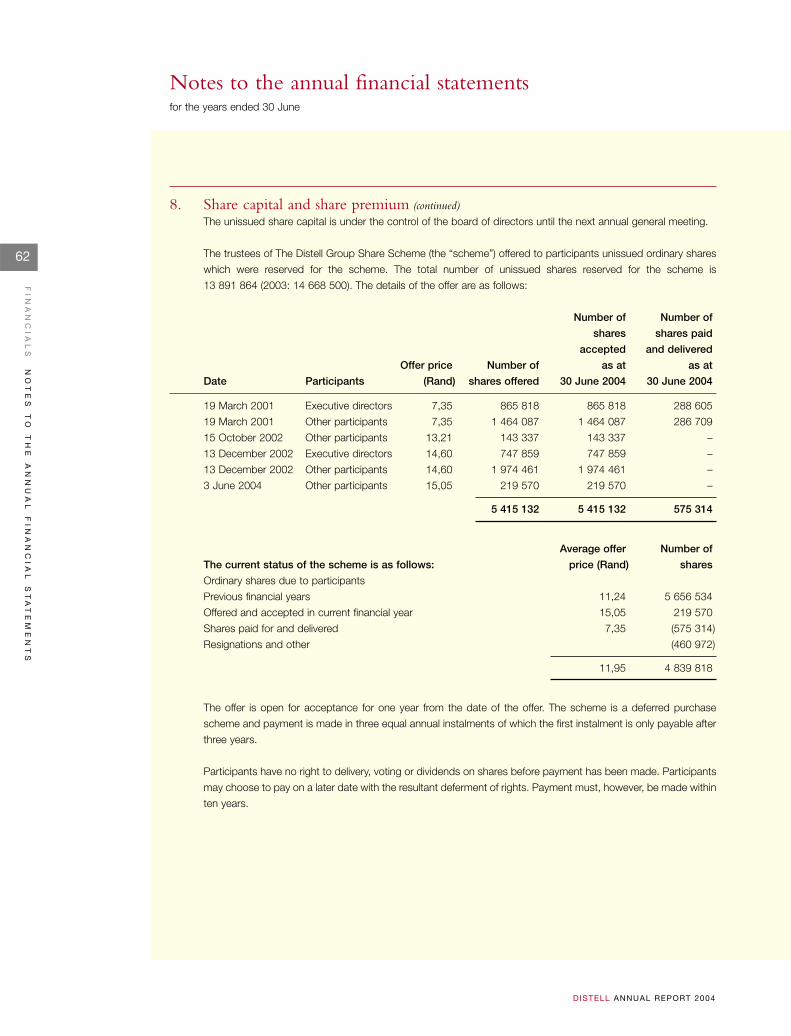
62
FI
NA
NC
IA
LS
NO
TE
S
TO
T
HE
A
NN
UA
L
FI
NA
NC
IA
L
ST
AT
EM
EN
TS
D ISTELL ANNUAL REPORT 2004
Notes to the annual financial statementsfor the years ended 30 June
8. Share capital and share premium (continued)The unissued share capital is under the control of the board of directors until the next annual general meeting.
The trustees of The Distell Group Share Scheme (the “scheme”) offered to participants unissued ordinary shares
which were reserved for the scheme. The total number of unissued shares reserved for the scheme is
13 891 864 (2003: 14 668 500). The details of the offer are as follows:
Number of Number of
shares shares paid
accepted and delivered
Offer price Number of as at as at
Date Participants (Rand) shares offered 30 June 2004 30 June 2004
19 March 2001 Executive directors 7,35 865 818 865 818 288 605
19 March 2001 Other participants 7,35 1 464 087 1 464 087 286 709
15 October 2002 Other participants 13,21 143 337 143 337 –
13 December 2002 Executive directors 14,60 747 859 747 859 –
13 December 2002 Other participants 14,60 1 974 461 1 974 461 –
3 June 2004 Other participants 15,05 219 570 219 570 –
5 415 132 5 415 132 575 314
Average offer Number of
The current status of the scheme is as follows: price (Rand) shares
Ordinary shares due to participants
Previous financial years 11,24 5 656 534
Offered and accepted in current financial year 15,05 219 570
Shares paid for and delivered 7,35 (575 314)
Resignations and other (460 972)
11,95 4 839 818
The offer is open for acceptance for one year from the date of the offer. The scheme is a deferred purchase
scheme and payment is made in three equal annual instalments of which the first instalment is only payable after
three years.
Participants have no right to delivery, voting or dividends on shares before payment has been made. Participants
may choose to pay on a later date with the resultant deferment of rights. Payment must, however, be made within
ten years.
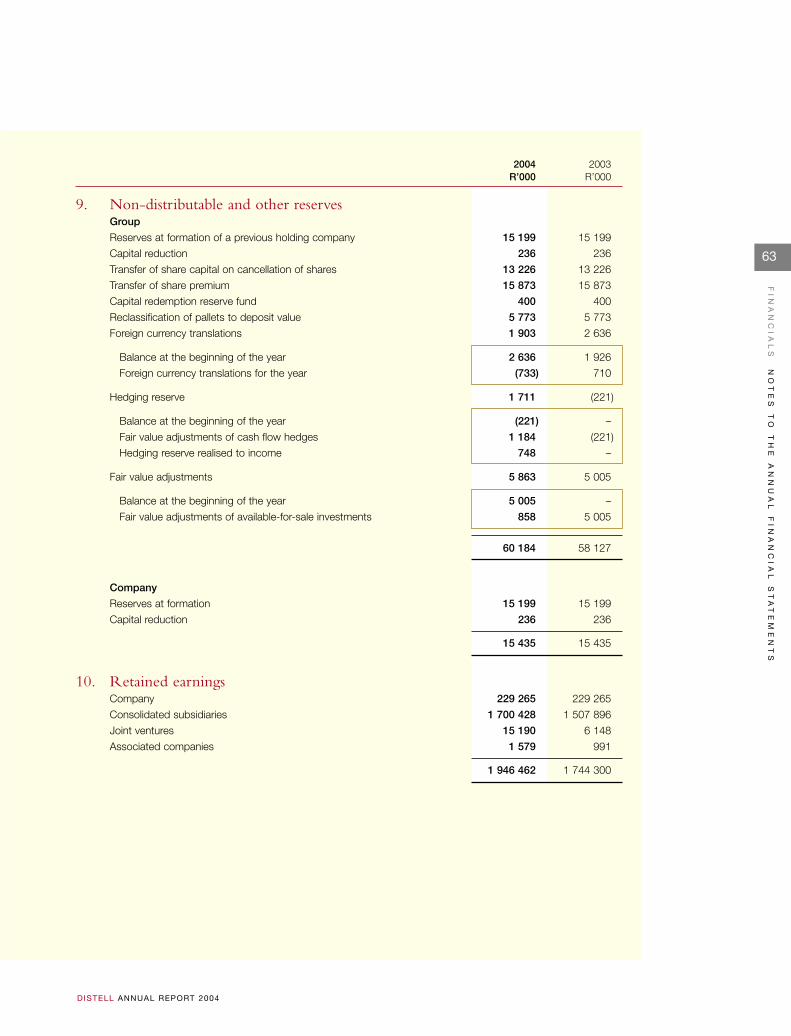
63
FI
NA
NC
IA
LS
NO
TE
S
TO
T
HE
A
NN
UA
L
FI
NA
NC
IA
L
ST
AT
EM
EN
TS
D ISTELL ANNUAL REPORT 2004
9. Non-distributable and other reservesGroup
Reserves at formation of a previous holding company 15 199 15 199
Capital reduction 236 236
Transfer of share capital on cancellation of shares 13 226 13 226
Transfer of share premium 15 873 15 873
Capital redemption reserve fund 400 400
Reclassification of pallets to deposit value 5 773 5 773
Foreign currency translations 1 903 2 636
Balance at the beginning of the year 2 636 1 926
Foreign currency translations for the year (733) 710
Hedging reserve 1 711 (221)
Balance at the beginning of the year (221) –
Fair value adjustments of cash flow hedges 1 184 (221)
Hedging reserve realised to income 748 –
Fair value adjustments 5 863 5 005
Balance at the beginning of the year 5 005 –
Fair value adjustments of available-for-sale investments 858 5 005
60 184 58 127
Company
Reserves at formation 15 199 15 199
Capital reduction 236 236
15 435 15 435
10. Retained earningsCompany 229 265 229 265
Consolidated subsidiaries 1 700 428 1 507 896
Joint ventures 15 190 6 148
Associated companies 1 579 991
1 946 462 1 744 300
2004 2003R’000 R’000
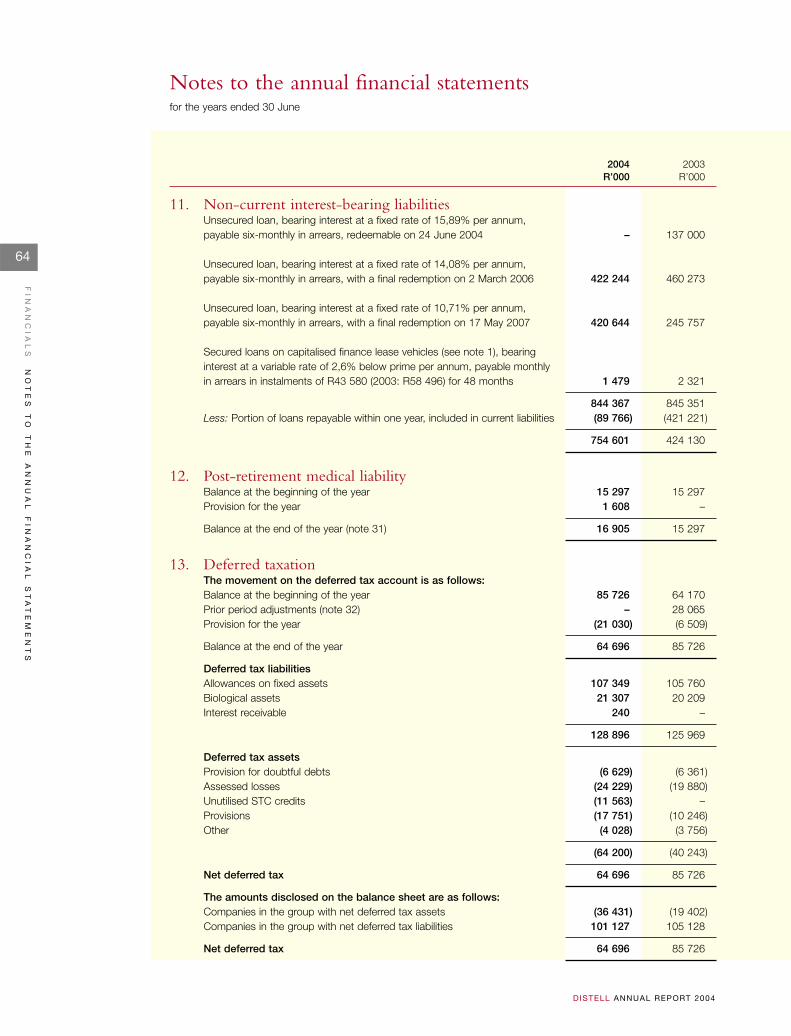
64
FI
NA
NC
IA
LS
NO
TE
S
TO
T
HE
A
NN
UA
L
FI
NA
NC
IA
L
ST
AT
EM
EN
TS
D ISTELL ANNUAL REPORT 2004
Notes to the annual financial statementsfor the years ended 30 June
2004 2003R’000 R’000
11. Non-current interest-bearing liabilitiesUnsecured loan, bearing interest at a fixed rate of 15,89% per annum, payable six-monthly in arrears, redeemable on 24 June 2004 – 137 000
Unsecured loan, bearing interest at a fixed rate of 14,08% per annum, payable six-monthly in arrears, with a final redemption on 2 March 2006 422 244 460 273
Unsecured loan, bearing interest at a fixed rate of 10,71% per annum, payable six-monthly in arrears, with a final redemption on 17 May 2007 420 644 245 757
Secured loans on capitalised finance lease vehicles (see note 1), bearing interest at a variable rate of 2,6% below prime per annum, payable monthly in arrears in instalments of R43 580 (2003: R58 496) for 48 months 1 479 2 321
844 367 845 351 Less: Portion of loans repayable within one year, included in current liabilities (89 766) (421 221)
754 601 424 130
12. Post-retirement medical liabilityBalance at the beginning of the year 15 297 15 297 Provision for the year 1 608 –
Balance at the end of the year (note 31) 16 905 15 297
13. Deferred taxationThe movement on the deferred tax account is as follows:Balance at the beginning of the year 85 726 64 170 Prior period adjustments (note 32) – 28 065 Provision for the year (21 030) (6 509)
Balance at the end of the year 64 696 85 726
Deferred tax liabilitiesAllowances on fixed assets 107 349 105 760 Biological assets 21 307 20 209 Interest receivable 240 –
128 896 125 969
Deferred tax assetsProvision for doubtful debts (6 629) (6 361)Assessed losses (24 229) (19 880)Unutilised STC credits (11 563) –Provisions (17 751) (10 246)Other (4 028) (3 756)
(64 200) (40 243)
Net deferred tax 64 696 85 726
The amounts disclosed on the balance sheet are as follows:Companies in the group with net deferred tax assets (36 431) (19 402)Companies in the group with net deferred tax liabilities 101 127 105 128
Net deferred tax 64 696 85 726
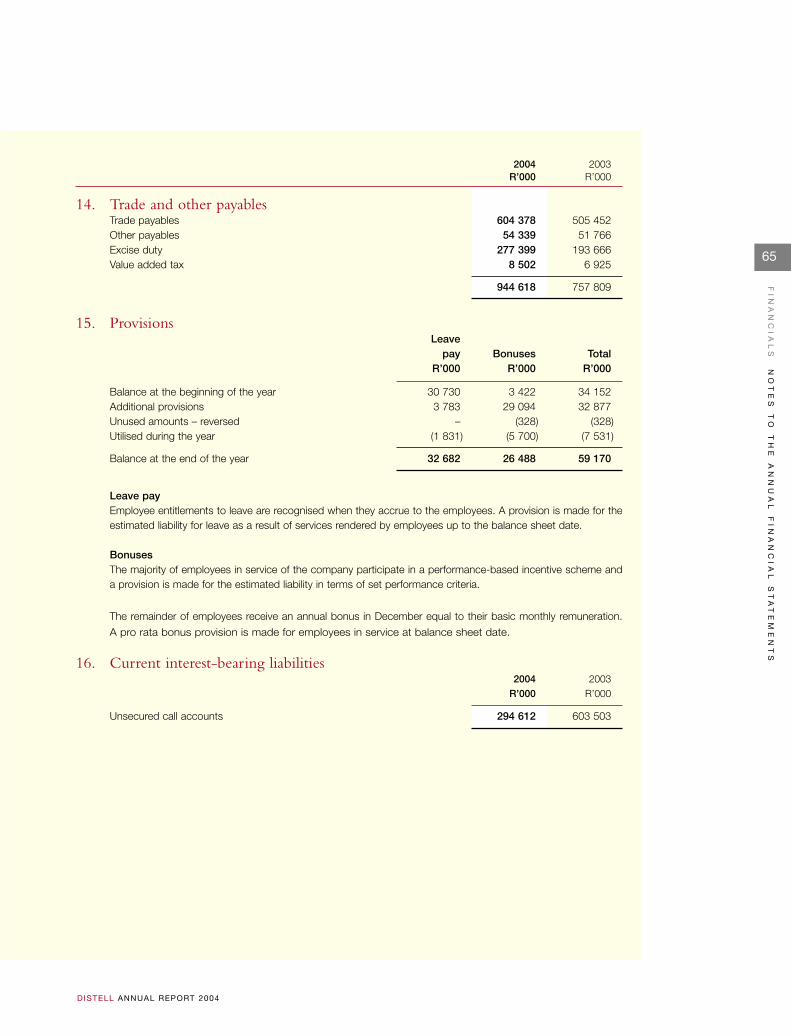
65
FI
NA
NC
IA
LS
NO
TE
S
TO
T
HE
A
NN
UA
L
FI
NA
NC
IA
L
ST
AT
EM
EN
TS
D ISTELL ANNUAL REPORT 2004
14. Trade and other payablesTrade payables 604 378 505 452 Other payables 54 339 51 766 Excise duty 277 399 193 666 Value added tax 8 502 6 925
944 618 757 809
15. ProvisionsLeave
pay Bonuses Total R’000 R’000 R’000
Balance at the beginning of the year 30 730 3 422 34 152 Additional provisions 3 783 29 094 32 877 Unused amounts – reversed – (328) (328)Utilised during the year (1 831) (5 700) (7 531)
Balance at the end of the year 32 682 26 488 59 170
Leave payEmployee entitlements to leave are recognised when they accrue to the employees. A provision is made for theestimated liability for leave as a result of services rendered by employees up to the balance sheet date.
BonusesThe majority of employees in service of the company participate in a performance-based incentive scheme anda provision is made for the estimated liability in terms of set performance criteria.
The remainder of employees receive an annual bonus in December equal to their basic monthly remuneration.
A pro rata bonus provision is made for employees in service at balance sheet date.
16. Current interest-bearing liabilities2004 2003
R’000 R’000
Unsecured call accounts 294 612 603 503
2004 2003R’000 R’000
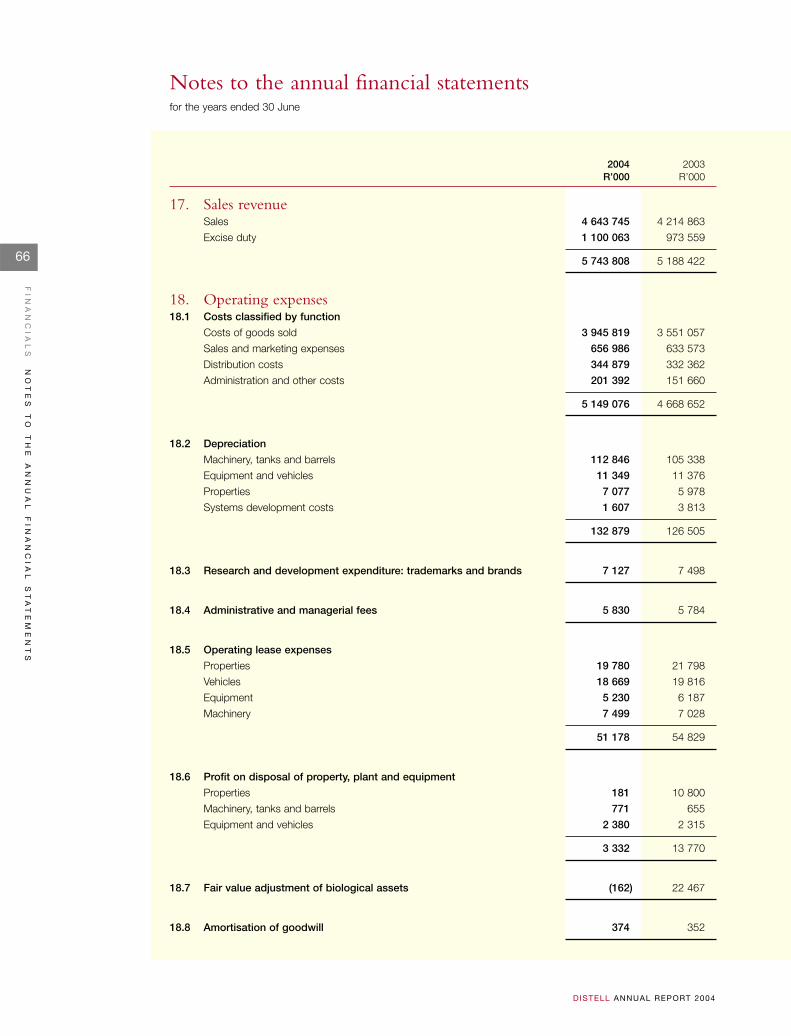
66
FI
NA
NC
IA
LS
NO
TE
S
TO
T
HE
A
NN
UA
L
FI
NA
NC
IA
L
ST
AT
EM
EN
TS
D ISTELL ANNUAL REPORT 2004
Notes to the annual financial statementsfor the years ended 30 June
2004 2003R’000 R’000
17. Sales revenueSales 4 643 745 4 214 863
Excise duty 1 100 063 973 559
5 743 808 5 188 422
18. Operating expenses18.1 Costs classified by function
Costs of goods sold 3 945 819 3 551 057
Sales and marketing expenses 656 986 633 573
Distribution costs 344 879 332 362
Administration and other costs 201 392 151 660
5 149 076 4 668 652
18.2 Depreciation
Machinery, tanks and barrels 112 846 105 338
Equipment and vehicles 11 349 11 376
Properties 7 077 5 978
Systems development costs 1 607 3 813
132 879 126 505
18.3 Research and development expenditure: trademarks and brands 7 127 7 498
18.4 Administrative and managerial fees 5 830 5 784
18.5 Operating lease expenses
Properties 19 780 21 798
Vehicles 18 669 19 816
Equipment 5 230 6 187
Machinery 7 499 7 028
51 178 54 829
18.6 Profit on disposal of property, plant and equipment
Properties 181 10 800
Machinery, tanks and barrels 771 655
Equipment and vehicles 2 380 2 315
3 332 13 770
18.7 Fair value adjustment of biological assets (162) 22 467
18.8 Amortisation of goodwill 374 352
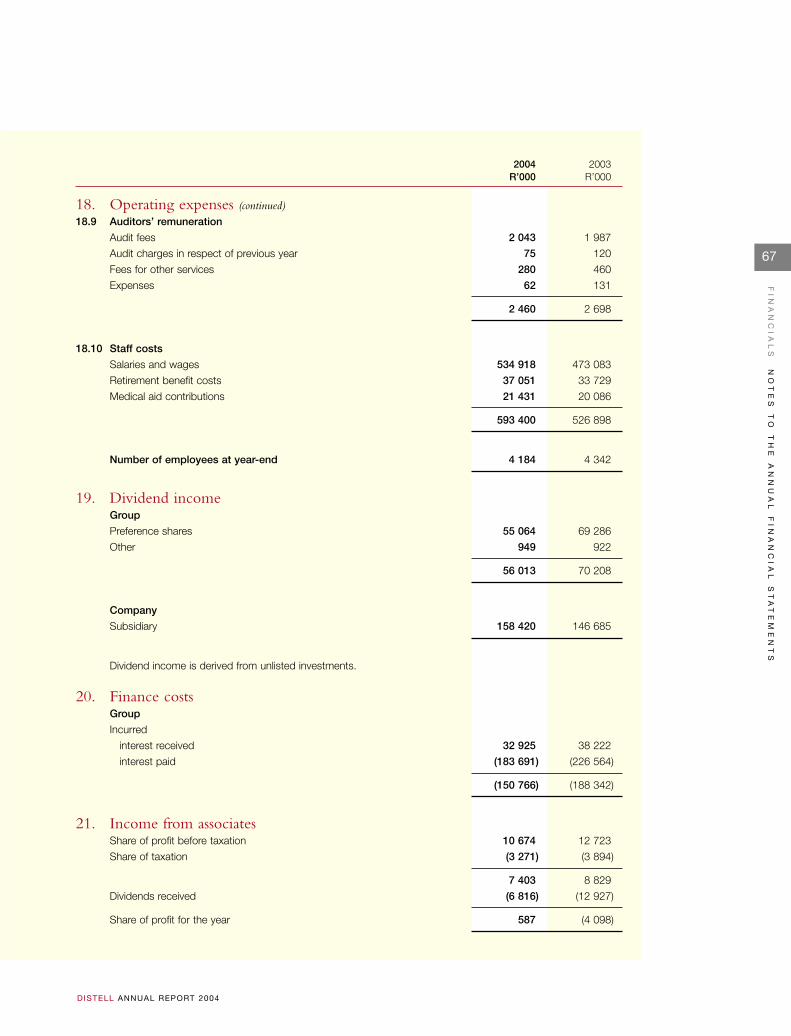
67
FI
NA
NC
IA
LS
NO
TE
S
TO
T
HE
A
NN
UA
L
FI
NA
NC
IA
L
ST
AT
EM
EN
TS
D ISTELL ANNUAL REPORT 2004
18. Operating expenses (continued)18.9 Auditors’ remuneration
Audit fees 2 043 1 987
Audit charges in respect of previous year 75 120
Fees for other services 280 460
Expenses 62 131
2 460 2 698
18.10 Staff costs
Salaries and wages 534 918 473 083
Retirement benefit costs 37 051 33 729
Medical aid contributions 21 431 20 086
593 400 526 898
Number of employees at year-end 4 184 4 342
19. Dividend incomeGroup
Preference shares 55 064 69 286
Other 949 922
56 013 70 208
Company
Subsidiary 158 420 146 685
Dividend income is derived from unlisted investments.
20. Finance costsGroup
Incurred
interest received 32 925 38 222
interest paid (183 691) (226 564)
(150 766) (188 342)
21. Income from associatesShare of profit before taxation 10 674 12 723
Share of taxation (3 271) (3 894)
7 403 8 829
Dividends received (6 816) (12 927)
Share of profit for the year 587 (4 098)
2004 2003R’000 R’000
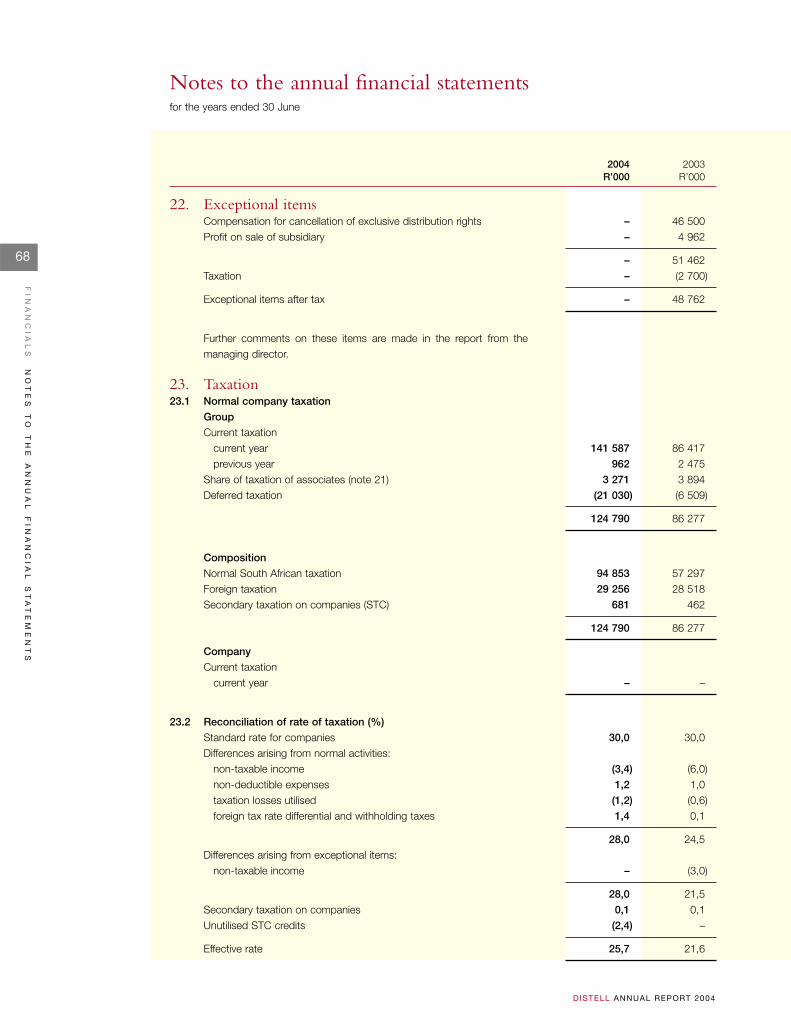
68
FI
NA
NC
IA
LS
NO
TE
S
TO
T
HE
A
NN
UA
L
FI
NA
NC
IA
L
ST
AT
EM
EN
TS
D ISTELL ANNUAL REPORT 2004
Notes to the annual financial statementsfor the years ended 30 June
2004 2003R’000 R’000
22. Exceptional itemsCompensation for cancellation of exclusive distribution rights – 46 500 Profit on sale of subsidiary – 4 962
– 51 462 Taxation – (2 700)
Exceptional items after tax – 48 762
Further comments on these items are made in the report from themanaging director.
23. Taxation23.1 Normal company taxation
Group
Current taxationcurrent year 141 587 86 417 previous year 962 2 475
Share of taxation of associates (note 21) 3 271 3 894 Deferred taxation (21 030) (6 509)
124 790 86 277
Composition
Normal South African taxation 94 853 57 297 Foreign taxation 29 256 28 518 Secondary taxation on companies (STC) 681 462
124 790 86 277
Company
Current taxation current year – –
23.2 Reconciliation of rate of taxation (%)
Standard rate for companies 30,0 30,0 Differences arising from normal activities:
non-taxable income (3,4) (6,0)non-deductible expenses 1,2 1,0 taxation losses utilised (1,2) (0,6)foreign tax rate differential and withholding taxes 1,4 0,1
28,0 24,5 Differences arising from exceptional items:
non-taxable income – (3,0)
28,0 21,5 Secondary taxation on companies 0,1 0,1 Unutilised STC credits (2,4) –
Effective rate 25,7 21,6
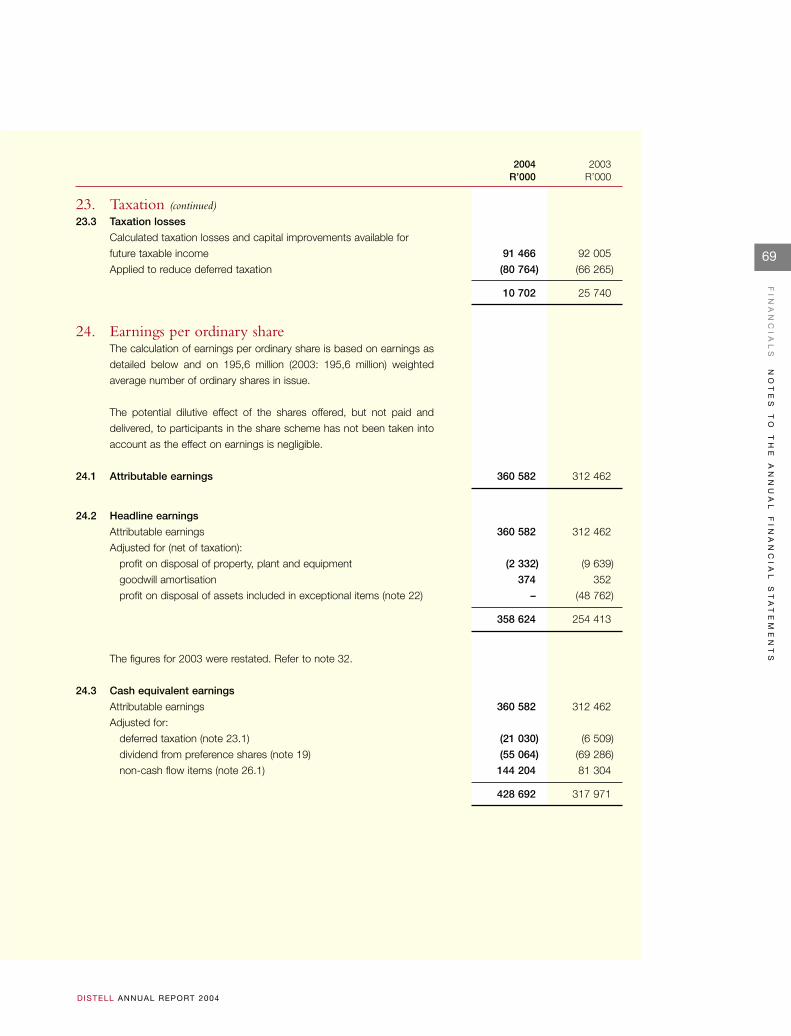
69
FI
NA
NC
IA
LS
NO
TE
S
TO
T
HE
A
NN
UA
L
FI
NA
NC
IA
L
ST
AT
EM
EN
TS
D ISTELL ANNUAL REPORT 2004
23. Taxation (continued)23.3 Taxation losses
Calculated taxation losses and capital improvements available for
future taxable income 91 466 92 005
Applied to reduce deferred taxation (80 764) (66 265)
10 702 25 740
24. Earnings per ordinary shareThe calculation of earnings per ordinary share is based on earnings as
detailed below and on 195,6 million (2003: 195,6 million) weighted
average number of ordinary shares in issue.
The potential dilutive effect of the shares offered, but not paid and
delivered, to participants in the share scheme has not been taken into
account as the effect on earnings is negligible.
24.1 Attributable earnings 360 582 312 462
24.2 Headline earnings
Attributable earnings 360 582 312 462
Adjusted for (net of taxation):
profit on disposal of property, plant and equipment (2 332) (9 639)
goodwill amortisation 374 352
profit on disposal of assets included in exceptional items (note 22) – (48 762)
358 624 254 413
The figures for 2003 were restated. Refer to note 32.
24.3 Cash equivalent earnings
Attributable earnings 360 582 312 462
Adjusted for:
deferred taxation (note 23.1) (21 030) (6 509)
dividend from preference shares (note 19) (55 064) (69 286)
non-cash flow items (note 26.1) 144 204 81 304
428 692 317 971
2004 2003R’000 R’000
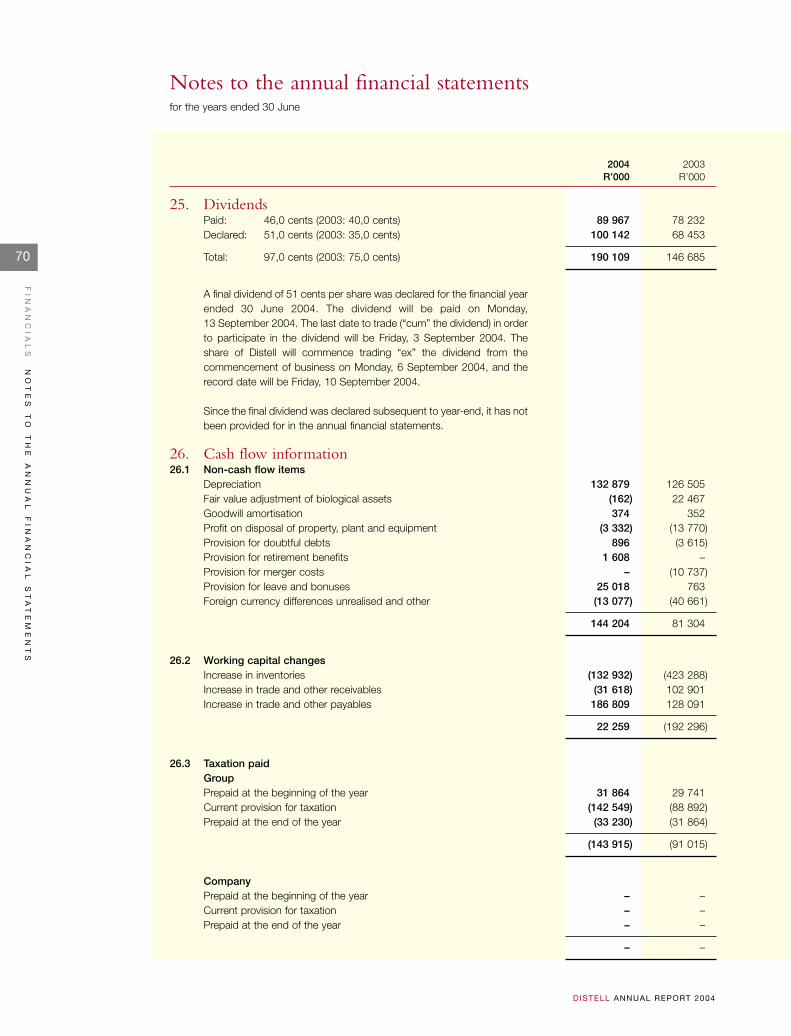
70
FI
NA
NC
IA
LS
NO
TE
S
TO
T
HE
A
NN
UA
L
FI
NA
NC
IA
L
ST
AT
EM
EN
TS
D ISTELL ANNUAL REPORT 2004
Notes to the annual financial statementsfor the years ended 30 June
2004 2003R’000 R’000
25. DividendsPaid: 46,0 cents (2003: 40,0 cents) 89 967 78 232 Declared: 51,0 cents (2003: 35,0 cents) 100 142 68 453
Total: 97,0 cents (2003: 75,0 cents) 190 109 146 685
A final dividend of 51 cents per share was declared for the financial yearended 30 June 2004. The dividend will be paid on Monday,13 September 2004. The last date to trade (“cum” the dividend) in orderto participate in the dividend will be Friday, 3 September 2004. Theshare of Distell will commence trading “ex” the dividend from thecommencement of business on Monday, 6 September 2004, and therecord date will be Friday, 10 September 2004.
Since the final dividend was declared subsequent to year-end, it has notbeen provided for in the annual financial statements.
26. Cash flow information26.1 Non-cash flow items
Depreciation 132 879 126 505 Fair value adjustment of biological assets (162) 22 467 Goodwill amortisation 374 352 Profit on disposal of property, plant and equipment (3 332) (13 770)Provision for doubtful debts 896 (3 615)Provision for retirement benefits 1 608 –Provision for merger costs – (10 737)Provision for leave and bonuses 25 018 763 Foreign currency differences unrealised and other (13 077) (40 661)
144 204 81 304
26.2 Working capital changesIncrease in inventories (132 932) (423 288)Increase in trade and other receivables (31 618) 102 901 Increase in trade and other payables 186 809 128 091
22 259 (192 296)
26.3 Taxation paidGroupPrepaid at the beginning of the year 31 864 29 741 Current provision for taxation (142 549) (88 892)Prepaid at the end of the year (33 230) (31 864)
(143 915) (91 015)
CompanyPrepaid at the beginning of the year – –Current provision for taxation – –Prepaid at the end of the year – –
– –
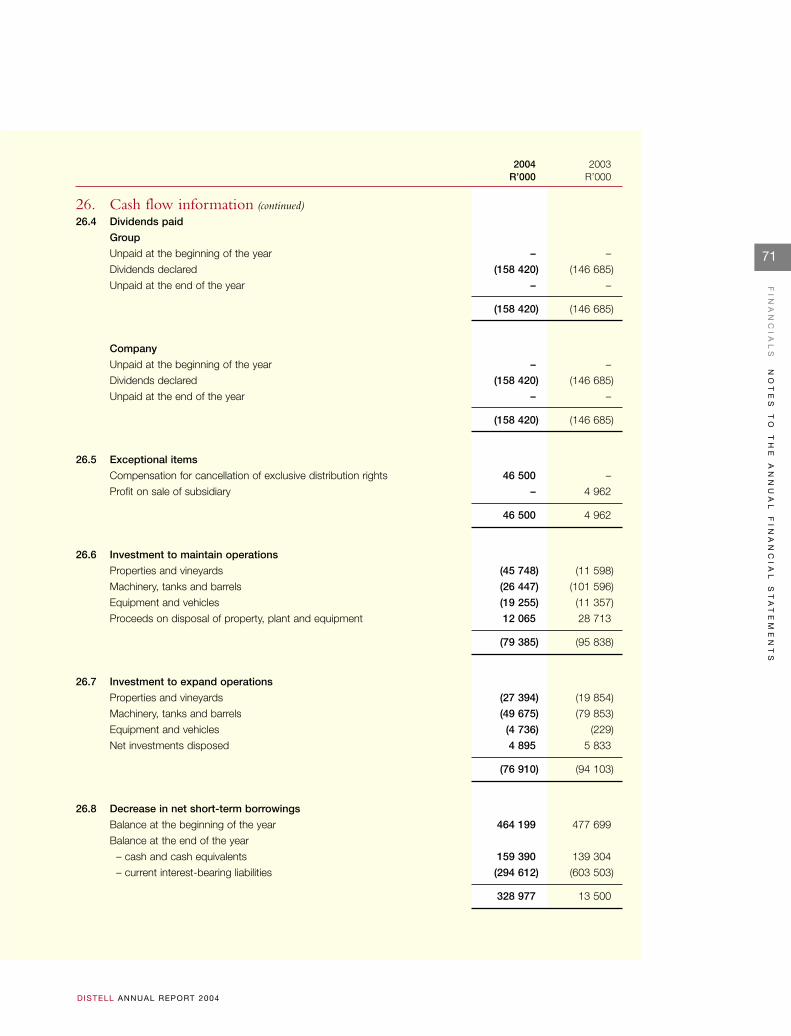
71
FI
NA
NC
IA
LS
NO
TE
S
TO
T
HE
A
NN
UA
L
FI
NA
NC
IA
L
ST
AT
EM
EN
TS
D ISTELL ANNUAL REPORT 2004
26. Cash flow information (continued)26.4 Dividends paid
Group
Unpaid at the beginning of the year – –
Dividends declared (158 420) (146 685)
Unpaid at the end of the year – –
(158 420) (146 685)
Company
Unpaid at the beginning of the year – –
Dividends declared (158 420) (146 685)
Unpaid at the end of the year – –
(158 420) (146 685)
26.5 Exceptional items
Compensation for cancellation of exclusive distribution rights 46 500 –
Profit on sale of subsidiary – 4 962
46 500 4 962
26.6 Investment to maintain operations
Properties and vineyards (45 748) (11 598)
Machinery, tanks and barrels (26 447) (101 596)
Equipment and vehicles (19 255) (11 357)
Proceeds on disposal of property, plant and equipment 12 065 28 713
(79 385) (95 838)
26.7 Investment to expand operations
Properties and vineyards (27 394) (19 854)
Machinery, tanks and barrels (49 675) (79 853)
Equipment and vehicles (4 736) (229)
Net investments disposed 4 895 5 833
(76 910) (94 103)
26.8 Decrease in net short-term borrowings
Balance at the beginning of the year 464 199 477 699
Balance at the end of the year
– cash and cash equivalents 159 390 139 304
– current interest-bearing liabilities (294 612) (603 503)
328 977 13 500
2004 2003R’000 R’000
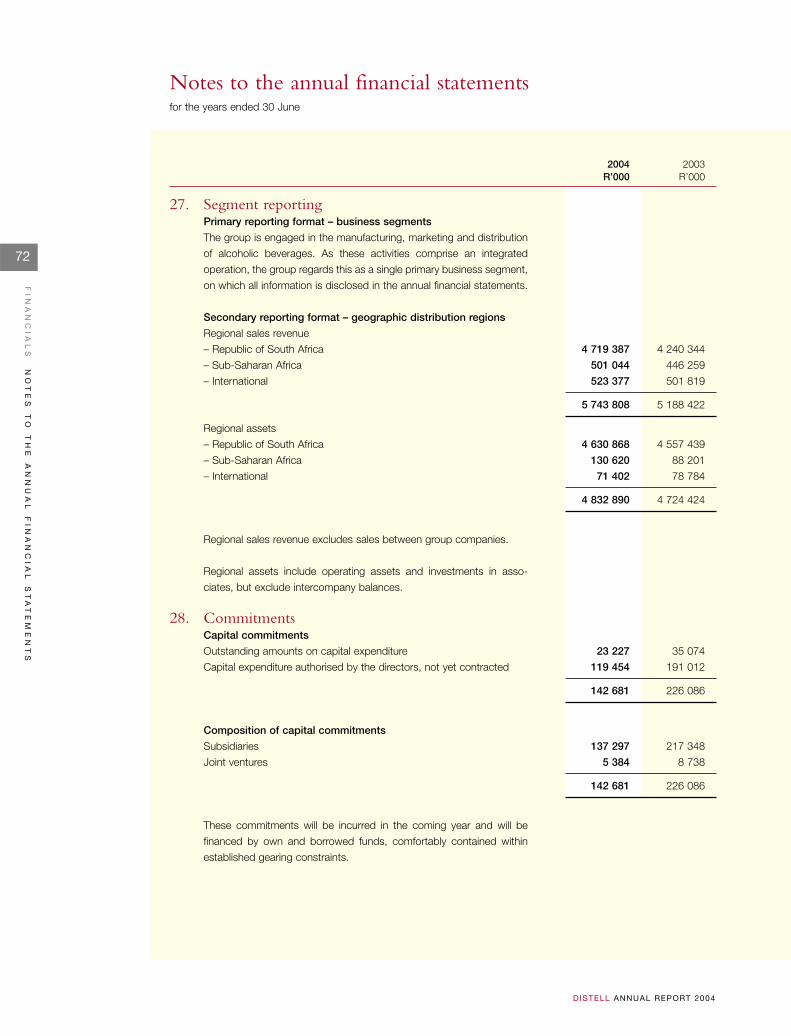
72
FI
NA
NC
IA
LS
NO
TE
S
TO
T
HE
A
NN
UA
L
FI
NA
NC
IA
L
ST
AT
EM
EN
TS
D ISTELL ANNUAL REPORT 2004
Notes to the annual financial statementsfor the years ended 30 June
2004 2003R’000 R’000
27. Segment reportingPrimary reporting format – business segments
The group is engaged in the manufacturing, marketing and distribution
of alcoholic beverages. As these activities comprise an integrated
operation, the group regards this as a single primary business segment,
on which all information is disclosed in the annual financial statements.
Secondary reporting format – geographic distribution regions
Regional sales revenue
– Republic of South Africa 4 719 387 4 240 344
– Sub-Saharan Africa 501 044 446 259
– International 523 377 501 819
5 743 808 5 188 422
Regional assets
– Republic of South Africa 4 630 868 4 557 439
– Sub-Saharan Africa 130 620 88 201
– International 71 402 78 784
4 832 890 4 724 424
Regional sales revenue excludes sales between group companies.
Regional assets include operating assets and investments in asso-
ciates, but exclude intercompany balances.
28. CommitmentsCapital commitments
Outstanding amounts on capital expenditure 23 227 35 074
Capital expenditure authorised by the directors, not yet contracted 119 454 191 012
142 681 226 086
Composition of capital commitments
Subsidiaries 137 297 217 348
Joint ventures 5 384 8 738
142 681 226 086
These commitments will be incurred in the coming year and will be
financed by own and borrowed funds, comfortably contained within
established gearing constraints.
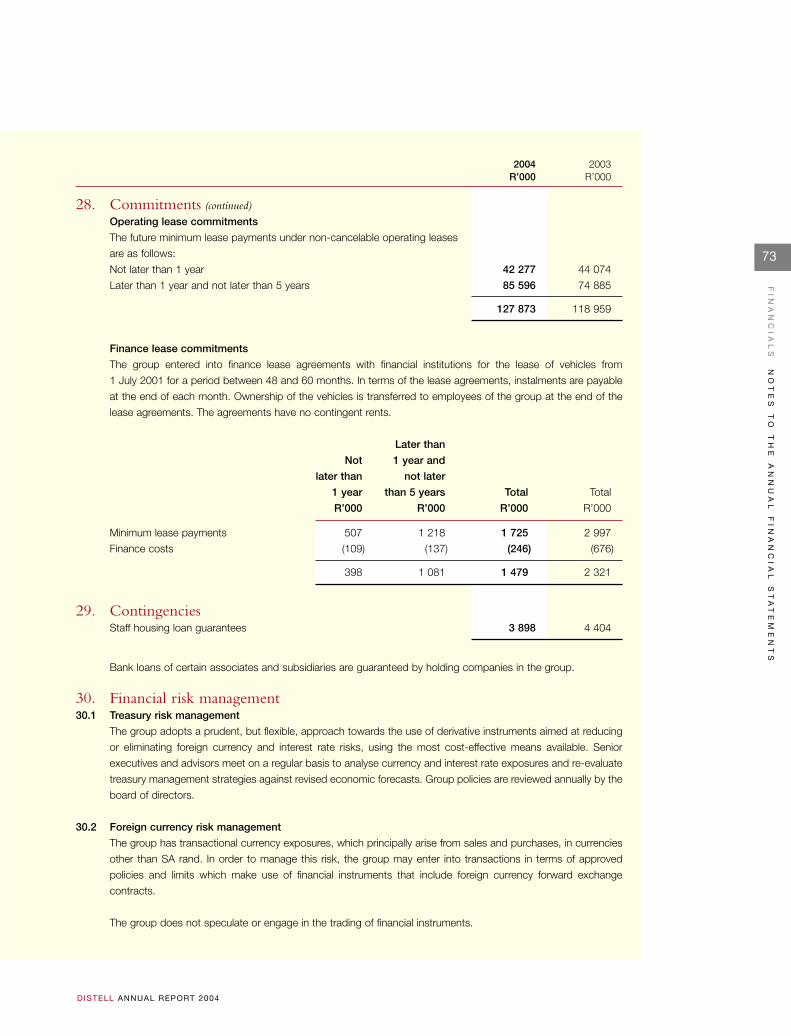
73
FI
NA
NC
IA
LS
NO
TE
S
TO
T
HE
A
NN
UA
L
FI
NA
NC
IA
L
ST
AT
EM
EN
TS
D ISTELL ANNUAL REPORT 2004
2004 2003R’000 R’000
28. Commitments (continued)Operating lease commitments
The future minimum lease payments under non-cancelable operating leases
are as follows:
Not later than 1 year 42 277 44 074
Later than 1 year and not later than 5 years 85 596 74 885
127 873 118 959
Finance lease commitments
The group entered into finance lease agreements with financial institutions for the lease of vehicles from
1 July 2001 for a period between 48 and 60 months. In terms of the lease agreements, instalments are payable
at the end of each month. Ownership of the vehicles is transferred to employees of the group at the end of the
lease agreements. The agreements have no contingent rents.
Later than
Not 1 year and
later than not later
1 year than 5 years Total Total
R’000 R’000 R’000 R’000
Minimum lease payments 507 1 218 1 725 2 997
Finance costs (109) (137) (246) (676)
398 1 081 1 479 2 321
29. ContingenciesStaff housing loan guarantees 3 898 4 404
Bank loans of certain associates and subsidiaries are guaranteed by holding companies in the group.
30. Financial risk management30.1 Treasury risk management
The group adopts a prudent, but flexible, approach towards the use of derivative instruments aimed at reducing
or eliminating foreign currency and interest rate risks, using the most cost-effective means available. Senior
executives and advisors meet on a regular basis to analyse currency and interest rate exposures and re-evaluate
treasury management strategies against revised economic forecasts. Group policies are reviewed annually by the
board of directors.
30.2 Foreign currency risk management
The group has transactional currency exposures, which principally arise from sales and purchases, in currencies
other than SA rand. In order to manage this risk, the group may enter into transactions in terms of approved
policies and limits which make use of financial instruments that include foreign currency forward exchange
contracts.
The group does not speculate or engage in the trading of financial instruments.
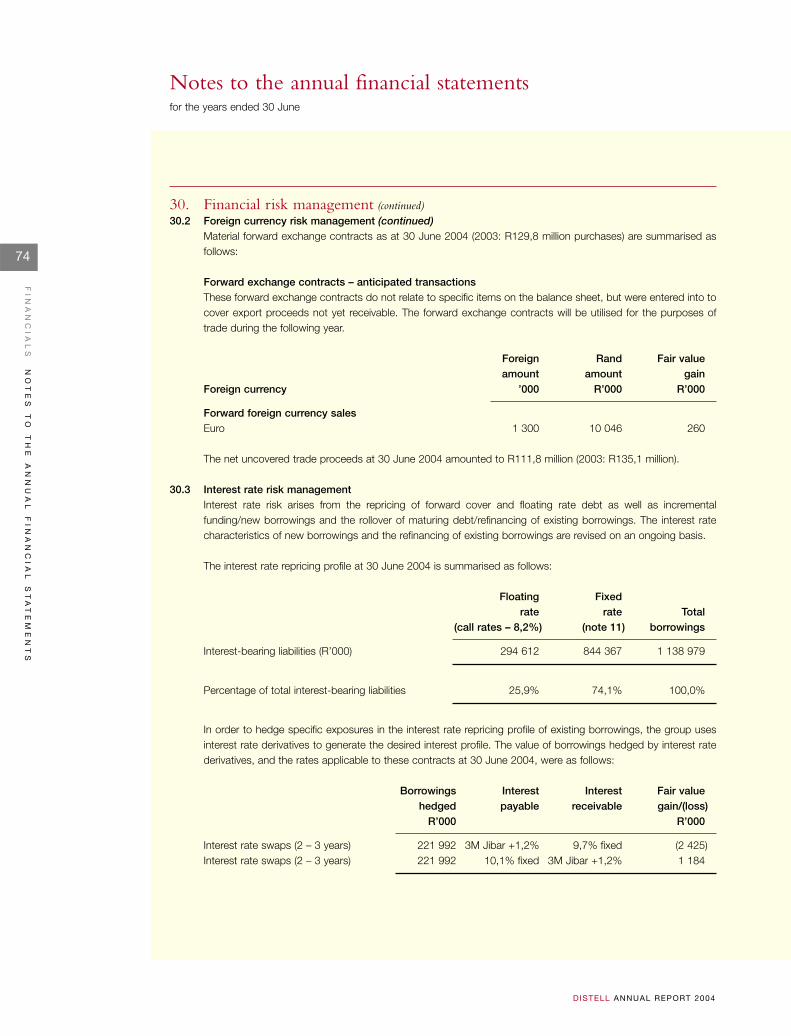
74
FI
NA
NC
IA
LS
NO
TE
S
TO
T
HE
A
NN
UA
L
FI
NA
NC
IA
L
ST
AT
EM
EN
TS
D ISTELL ANNUAL REPORT 2004
Notes to the annual financial statementsfor the years ended 30 June
30. Financial risk management (continued)30.2 Foreign currency risk management (continued)
Material forward exchange contracts as at 30 June 2004 (2003: R129,8 million purchases) are summarised asfollows:
Forward exchange contracts – anticipated transactionsThese forward exchange contracts do not relate to specific items on the balance sheet, but were entered into tocover export proceeds not yet receivable. The forward exchange contracts will be utilised for the purposes oftrade during the following year.
Foreign Rand Fair value amount amount gain
Foreign currency ’000 R’000 R’000
Forward foreign currency salesEuro 1 300 10 046 260
The net uncovered trade proceeds at 30 June 2004 amounted to R111,8 million (2003: R135,1 million).
30.3 Interest rate risk managementInterest rate risk arises from the repricing of forward cover and floating rate debt as well as incrementalfunding/new borrowings and the rollover of maturing debt/refinancing of existing borrowings. The interest ratecharacteristics of new borrowings and the refinancing of existing borrowings are revised on an ongoing basis.
The interest rate repricing profile at 30 June 2004 is summarised as follows:
Floating Fixedrate rate Total
(call rates – 8,2%) (note 11) borrowings
Interest-bearing liabilities (R’000) 294 612 844 367 1 138 979
Percentage of total interest-bearing liabilities 25,9% 74,1% 100,0%
In order to hedge specific exposures in the interest rate repricing profile of existing borrowings, the group usesinterest rate derivatives to generate the desired interest profile. The value of borrowings hedged by interest ratederivatives, and the rates applicable to these contracts at 30 June 2004, were as follows:
Borrowings Interest Interest Fair valuehedged payable receivable gain/(loss)
R’000 R’000
Interest rate swaps (2 – 3 years) 221 992 3M Jibar +1,2% 9,7% fixed (2 425)Interest rate swaps (2 – 3 years) 221 992 10,1% fixed 3M Jibar +1,2% 1 184
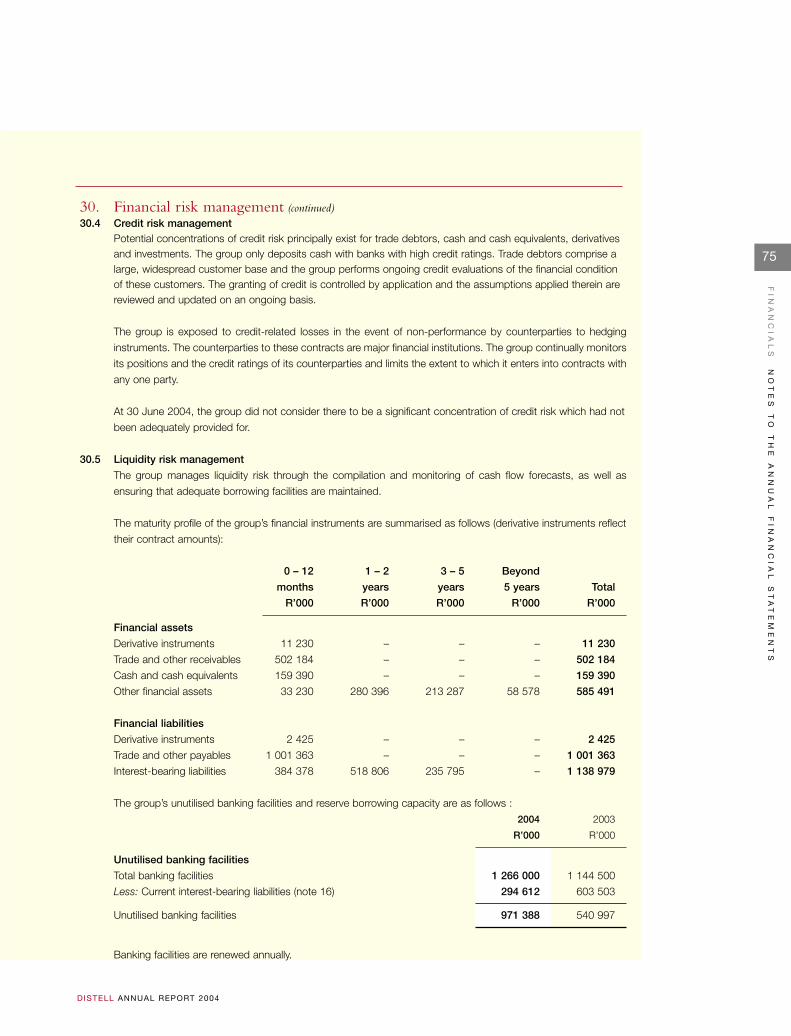
75
FI
NA
NC
IA
LS
NO
TE
S
TO
T
HE
A
NN
UA
L
FI
NA
NC
IA
L
ST
AT
EM
EN
TS
D ISTELL ANNUAL REPORT 2004
30. Financial risk management (continued)30.4 Credit risk management
Potential concentrations of credit risk principally exist for trade debtors, cash and cash equivalents, derivativesand investments. The group only deposits cash with banks with high credit ratings. Trade debtors comprise alarge, widespread customer base and the group performs ongoing credit evaluations of the financial conditionof these customers. The granting of credit is controlled by application and the assumptions applied therein arereviewed and updated on an ongoing basis.
The group is exposed to credit-related losses in the event of non-performance by counterparties to hedging
instruments. The counterparties to these contracts are major financial institutions. The group continually monitors
its positions and the credit ratings of its counterparties and limits the extent to which it enters into contracts with
any one party.
At 30 June 2004, the group did not consider there to be a significant concentration of credit risk which had not
been adequately provided for.
30.5 Liquidity risk management
The group manages liquidity risk through the compilation and monitoring of cash flow forecasts, as well as
ensuring that adequate borrowing facilities are maintained.
The maturity profile of the group’s financial instruments are summarised as follows (derivative instruments reflect
their contract amounts):
0 – 12 1 – 2 3 – 5 Beyond
months years years 5 years Total
R’000 R’000 R’000 R’000 R’000
Financial assets
Derivative instruments 11 230 – – – 11 230
Trade and other receivables 502 184 – – – 502 184
Cash and cash equivalents 159 390 – – – 159 390
Other financial assets 33 230 280 396 213 287 58 578 585 491
Financial liabilities
Derivative instruments 2 425 – – – 2 425
Trade and other payables 1 001 363 – – – 1 001 363
Interest-bearing liabilities 384 378 518 806 235 795 – 1 138 979
The group’s unutilised banking facilities and reserve borrowing capacity are as follows :
2004 2003
R’000 R’000
Unutilised banking facilities
Total banking facilities 1 266 000 1 144 500
Less: Current interest-bearing liabilities (note 16) 294 612 603 503
Unutilised banking facilities 971 388 540 997
Banking facilities are renewed annually.
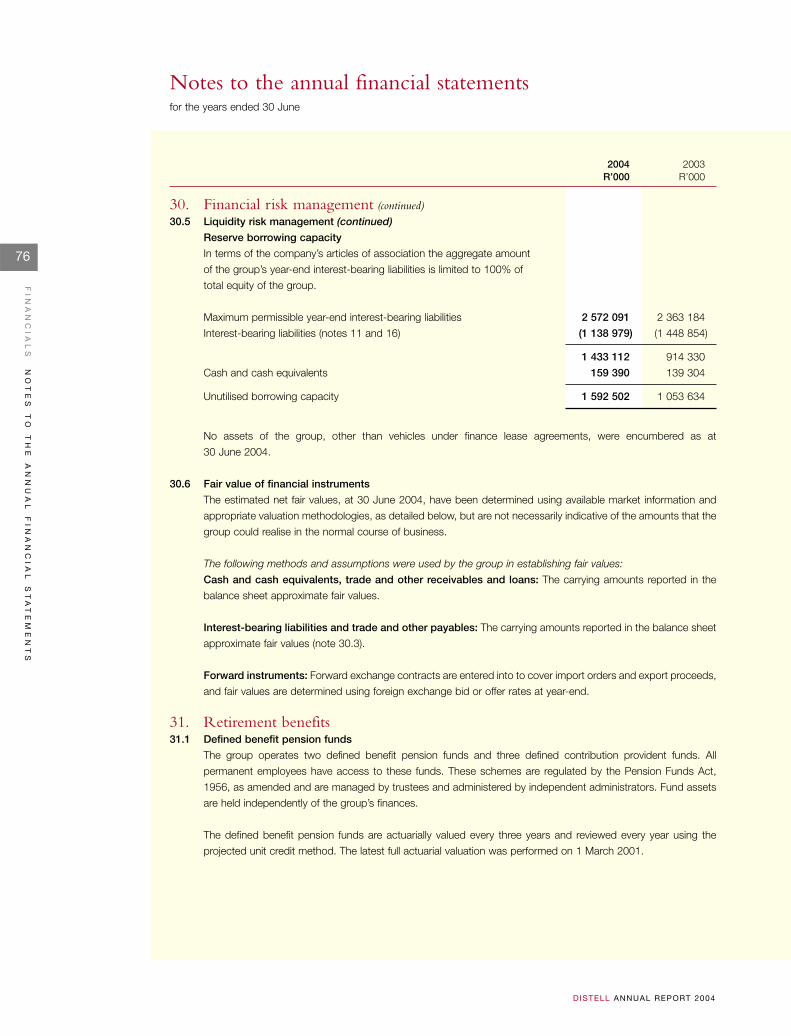
76
FI
NA
NC
IA
LS
NO
TE
S
TO
T
HE
A
NN
UA
L
FI
NA
NC
IA
L
ST
AT
EM
EN
TS
D ISTELL ANNUAL REPORT 2004
Notes to the annual financial statementsfor the years ended 30 June
30. Financial risk management (continued)30.5 Liquidity risk management (continued)
Reserve borrowing capacity
In terms of the company’s articles of association the aggregate amount
of the group’s year-end interest-bearing liabilities is limited to 100% of
total equity of the group.
Maximum permissible year-end interest-bearing liabilities 2 572 091 2 363 184
Interest-bearing liabilities (notes 11 and 16) (1 138 979) (1 448 854)
1 433 112 914 330
Cash and cash equivalents 159 390 139 304
Unutilised borrowing capacity 1 592 502 1 053 634
No assets of the group, other than vehicles under finance lease agreements, were encumbered as at
30 June 2004.
30.6 Fair value of financial instruments
The estimated net fair values, at 30 June 2004, have been determined using available market information and
appropriate valuation methodologies, as detailed below, but are not necessarily indicative of the amounts that the
group could realise in the normal course of business.
The following methods and assumptions were used by the group in establishing fair values:
Cash and cash equivalents, trade and other receivables and loans: The carrying amounts reported in the
balance sheet approximate fair values.
Interest-bearing liabilities and trade and other payables: The carrying amounts reported in the balance sheet
approximate fair values (note 30.3).
Forward instruments: Forward exchange contracts are entered into to cover import orders and export proceeds,
and fair values are determined using foreign exchange bid or offer rates at year-end.
31. Retirement benefits31.1 Defined benefit pension funds
The group operates two defined benefit pension funds and three defined contribution provident funds. All
permanent employees have access to these funds. These schemes are regulated by the Pension Funds Act,
1956, as amended and are managed by trustees and administered by independent administrators. Fund assets
are held independently of the group’s finances.
The defined benefit pension funds are actuarially valued every three years and reviewed every year using the
projected unit credit method. The latest full actuarial valuation was performed on 1 March 2001.
2004 2003R’000 R’000
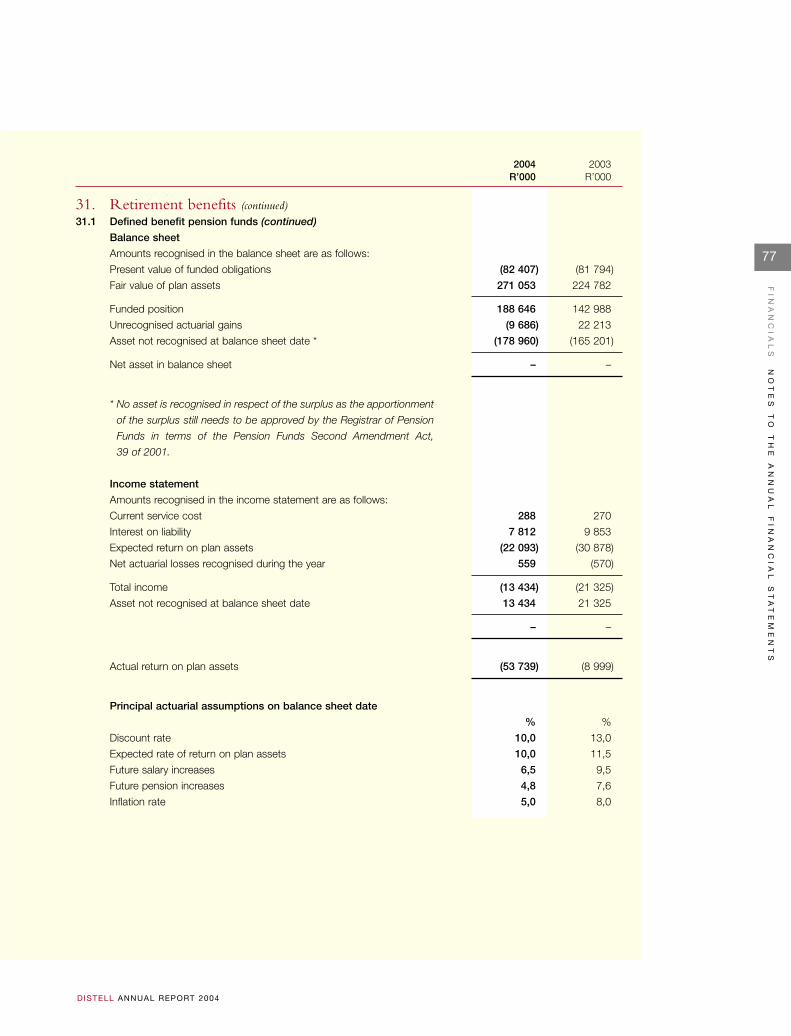
77
FI
NA
NC
IA
LS
NO
TE
S
TO
T
HE
A
NN
UA
L
FI
NA
NC
IA
L
ST
AT
EM
EN
TS
D ISTELL ANNUAL REPORT 2004
31. Retirement benefits (continued)31.1 Defined benefit pension funds (continued)
Balance sheet
Amounts recognised in the balance sheet are as follows:
Present value of funded obligations (82 407) (81 794)
Fair value of plan assets 271 053 224 782
Funded position 188 646 142 988
Unrecognised actuarial gains (9 686) 22 213
Asset not recognised at balance sheet date * (178 960) (165 201)
Net asset in balance sheet – –
* No asset is recognised in respect of the surplus as the apportionment
of the surplus still needs to be approved by the Registrar of Pension
Funds in terms of the Pension Funds Second Amendment Act,
39 of 2001.
Income statement
Amounts recognised in the income statement are as follows:
Current service cost 288 270
Interest on liability 7 812 9 853
Expected return on plan assets (22 093) (30 878)
Net actuarial losses recognised during the year 559 (570)
Total income (13 434) (21 325)
Asset not recognised at balance sheet date 13 434 21 325
– –
Actual return on plan assets (53 739) (8 999)
Principal actuarial assumptions on balance sheet date
% %
Discount rate 10,0 13,0
Expected rate of return on plan assets 10,0 11,5
Future salary increases 6,5 9,5
Future pension increases 4,8 7,6
Inflation rate 5,0 8,0
2004 2003R’000 R’000
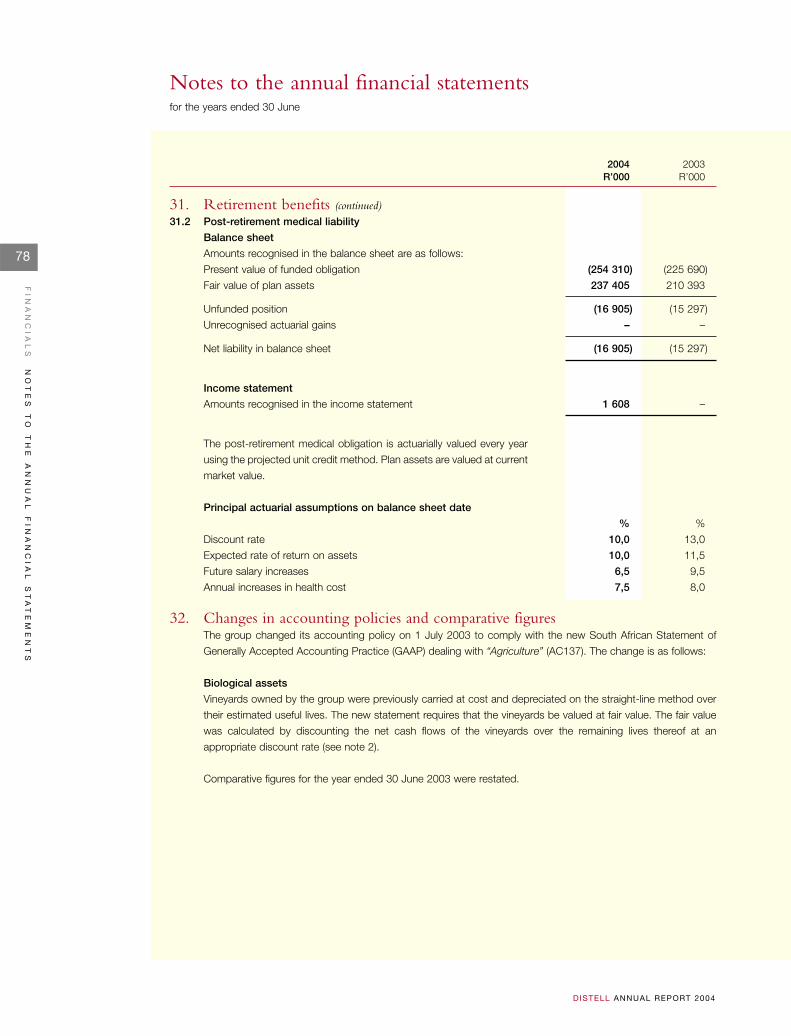
78
FI
NA
NC
IA
LS
NO
TE
S
TO
T
HE
A
NN
UA
L
FI
NA
NC
IA
L
ST
AT
EM
EN
TS
D ISTELL ANNUAL REPORT 2004
Notes to the annual financial statementsfor the years ended 30 June
2004 2003R’000 R’000
31. Retirement benefits (continued)31.2 Post-retirement medical liability
Balance sheet
Amounts recognised in the balance sheet are as follows:
Present value of funded obligation (254 310) (225 690)
Fair value of plan assets 237 405 210 393
Unfunded position (16 905) (15 297)
Unrecognised actuarial gains – –
Net liability in balance sheet (16 905) (15 297)
Income statement
Amounts recognised in the income statement 1 608 –
The post-retirement medical obligation is actuarially valued every year
using the projected unit credit method. Plan assets are valued at current
market value.
Principal actuarial assumptions on balance sheet date
% %
Discount rate 10,0 13,0
Expected rate of return on assets 10,0 11,5
Future salary increases 6,5 9,5
Annual increases in health cost 7,5 8,0
32. Changes in accounting policies and comparative figuresThe group changed its accounting policy on 1 July 2003 to comply with the new South African Statement of
Generally Accepted Accounting Practice (GAAP) dealing with “Agriculture” (AC137). The change is as follows:
Biological assets
Vineyards owned by the group were previously carried at cost and depreciated on the straight-line method over
their estimated useful lives. The new statement requires that the vineyards be valued at fair value. The fair value
was calculated by discounting the net cash flows of the vineyards over the remaining lives thereof at an
appropriate discount rate (see note 2).
Comparative figures for the year ended 30 June 2003 were restated.
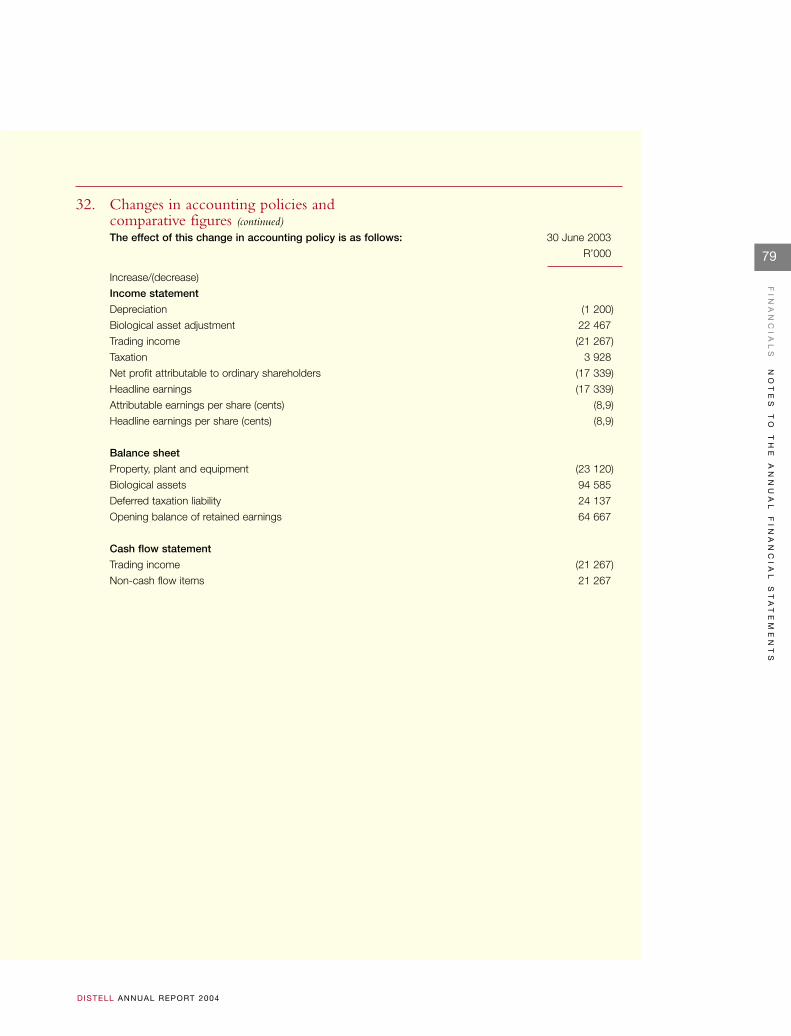
79
FI
NA
NC
IA
LS
NO
TE
S
TO
T
HE
A
NN
UA
L
FI
NA
NC
IA
L
ST
AT
EM
EN
TS
D ISTELL ANNUAL REPORT 2004
32. Changes in accounting policies and comparative figures (continued)The effect of this change in accounting policy is as follows: 30 June 2003
R’000
Increase/(decrease)
Income statement
Depreciation (1 200)
Biological asset adjustment 22 467
Trading income (21 267)
Taxation 3 928
Net profit attributable to ordinary shareholders (17 339)
Headline earnings (17 339)
Attributable earnings per share (cents) (8,9)
Headline earnings per share (cents) (8,9)
Balance sheet
Property, plant and equipment (23 120)
Biological assets 94 585
Deferred taxation liability 24 137
Opening balance of retained earnings 64 667
Cash flow statement
Trading income (21 267)
Non-cash flow items 21 267
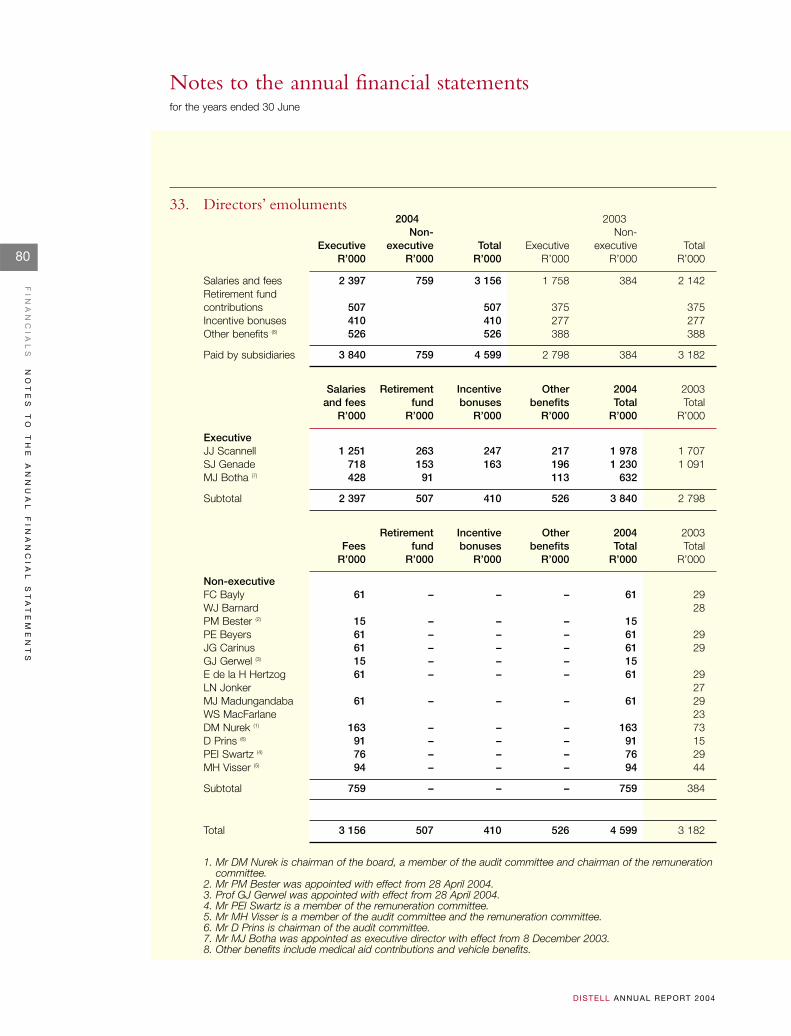
80
FI
NA
NC
IA
LS
NO
TE
S
TO
T
HE
A
NN
UA
L
FI
NA
NC
IA
L
ST
AT
EM
EN
TS
D ISTELL ANNUAL REPORT 2004
Notes to the annual financial statementsfor the years ended 30 June
33. Directors’ emoluments 2004 2003
Non- Non-Executive executive Total Executive executive Total
R’000 R’000 R’000 R’000 R’000 R’000
Salaries and fees 2 397 759 3 156 1 758 384 2 142 Retirement fund contributions 507 507 375 375 Incentive bonuses 410 410 277 277 Other benefits (8) 526 526 388 388
Paid by subsidiaries 3 840 759 4 599 2 798 384 3 182
Salaries Retirement Incentive Other 2004 2003and fees fund bonuses benefits Total Total
R’000 R’000 R’000 R’000 R’000 R’000
ExecutiveJJ Scannell 1 251 263 247 217 1 978 1 707 SJ Genade 718 153 163 196 1 230 1 091 MJ Botha (7) 428 91 113 632
Subtotal 2 397 507 410 526 3 840 2 798
Retirement Incentive Other 2004 2003Fees fund bonuses benefits Total Total
R’000 R’000 R’000 R’000 R’000 R’000
Non-executiveFC Bayly 61 – – – 61 29 WJ Barnard 28 PM Bester (2) 15 – – – 15PE Beyers 61 – – – 61 29 JG Carinus 61 – – – 61 29 GJ Gerwel (3) 15 – – – 15E de la H Hertzog 61 – – – 61 29 LN Jonker 27 MJ Madungandaba 61 – – – 61 29 WS MacFarlane 23 DM Nurek (1) 163 – – – 163 73 D Prins (6) 91 – – – 91 15 PEI Swartz (4) 76 – – – 76 29 MH Visser (5) 94 – – – 94 44
Subtotal 759 – – – 759 384
Total 3 156 507 410 526 4 599 3 182
1. Mr DM Nurek is chairman of the board, a member of the audit committee and chairman of the remunerationcommittee.
2. Mr PM Bester was appointed with effect from 28 April 2004.3. Prof GJ Gerwel was appointed with effect from 28 April 2004.4. Mr PEI Swartz is a member of the remuneration committee.5. Mr MH Visser is a member of the audit committee and the remuneration committee.6. Mr D Prins is chairman of the audit committee.7. Mr MJ Botha was appointed as executive director with effect from 8 December 2003.8. Other benefits include medical aid contributions and vehicle benefits.
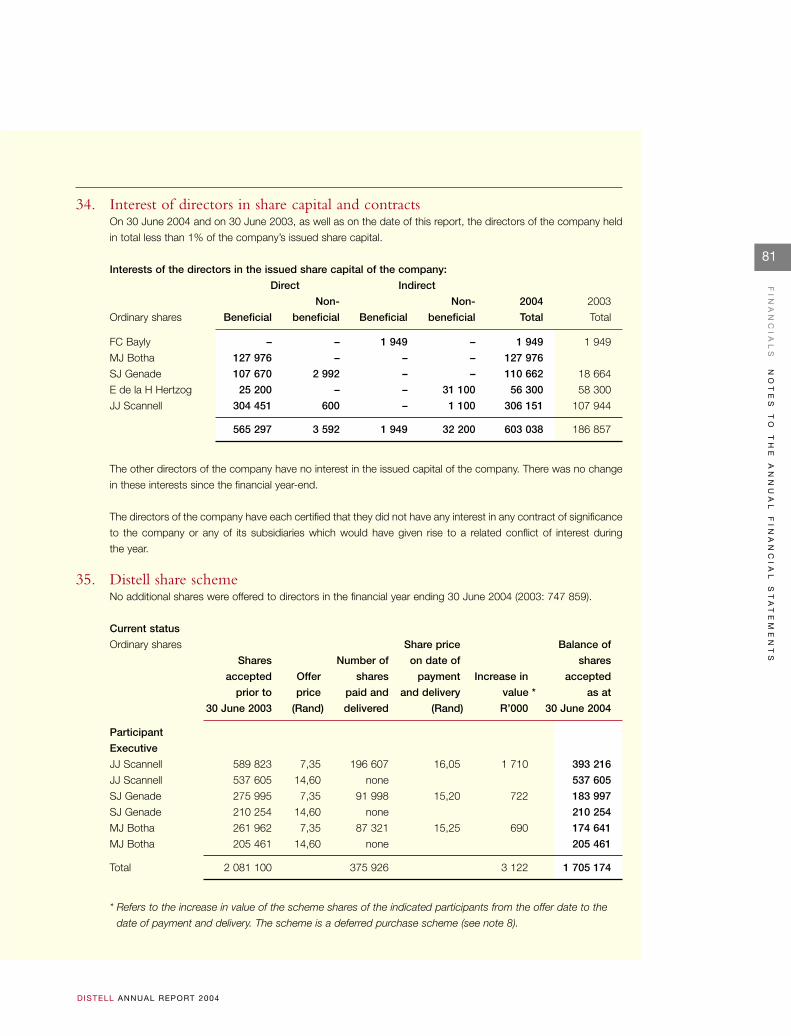
81
FI
NA
NC
IA
LS
NO
TE
S
TO
T
HE
A
NN
UA
L
FI
NA
NC
IA
L
ST
AT
EM
EN
TS
D ISTELL ANNUAL REPORT 2004
34. Interest of directors in share capital and contractsOn 30 June 2004 and on 30 June 2003, as well as on the date of this report, the directors of the company held
in total less than 1% of the company’s issued share capital.
Interests of the directors in the issued share capital of the company:
Direct Indirect
Non- Non- 2004 2003
Ordinary shares Beneficial beneficial Beneficial beneficial Total Total
FC Bayly – – 1 949 – 1 949 1 949
MJ Botha 127 976 – – – 127 976
SJ Genade 107 670 2 992 – – 110 662 18 664
E de la H Hertzog 25 200 – – 31 100 56 300 58 300
JJ Scannell 304 451 600 – 1 100 306 151 107 944
565 297 3 592 1 949 32 200 603 038 186 857
The other directors of the company have no interest in the issued capital of the company. There was no change
in these interests since the financial year-end.
The directors of the company have each certified that they did not have any interest in any contract of significance
to the company or any of its subsidiaries which would have given rise to a related conflict of interest during
the year.
35. Distell share schemeNo additional shares were offered to directors in the financial year ending 30 June 2004 (2003: 747 859).
Current status
Ordinary shares Share price Balance of
Shares Number of on date of shares
accepted Offer shares payment Increase in accepted
prior to price paid and and delivery value * as at
30 June 2003 (Rand) delivered (Rand) R’000 30 June 2004
Participant
Executive
JJ Scannell 589 823 7,35 196 607 16,05 1 710 393 216
JJ Scannell 537 605 14,60 none 537 605
SJ Genade 275 995 7,35 91 998 15,20 722 183 997
SJ Genade 210 254 14,60 none 210 254
MJ Botha 261 962 7,35 87 321 15,25 690 174 641
MJ Botha 205 461 14,60 none 205 461
Total 2 081 100 375 926 3 122 1 705 174
* Refers to the increase in value of the scheme shares of the indicated participants from the offer date to the
date of payment and delivery. The scheme is a deferred purchase scheme (see note 8).
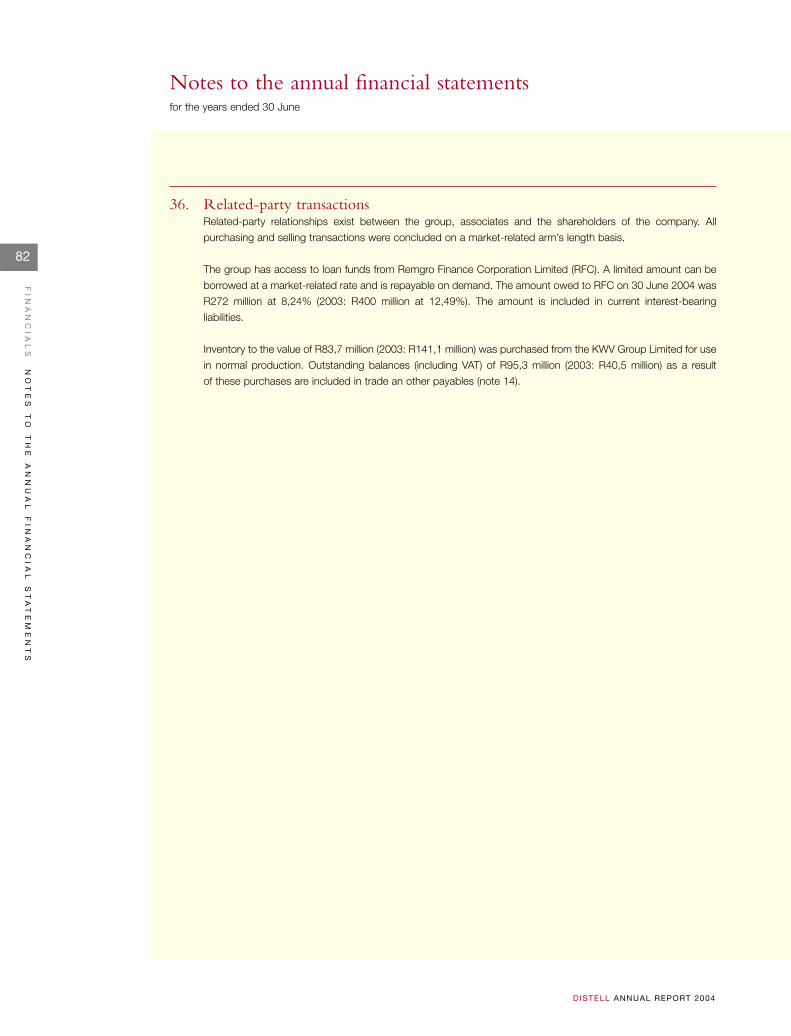
82
FI
NA
NC
IA
LS
NO
TE
S
TO
T
HE
A
NN
UA
L
FI
NA
NC
IA
L
ST
AT
EM
EN
TS
D ISTELL ANNUAL REPORT 2004
Notes to the annual financial statementsfor the years ended 30 June
36. Related-party transactionsRelated-party relationships exist between the group, associates and the shareholders of the company. All
purchasing and selling transactions were concluded on a market-related arm’s length basis.
The group has access to loan funds from Remgro Finance Corporation Limited (RFC). A limited amount can be
borrowed at a market-related rate and is repayable on demand. The amount owed to RFC on 30 June 2004 was
R272 million at 8,24% (2003: R400 million at 12,49%). The amount is included in current interest-bearing
liabilities.
Inventory to the value of R83,7 million (2003: R141,1 million) was purchased from the KWV Group Limited for use
in normal production. Outstanding balances (including VAT) of R95,3 million (2003: R40,5 million) as a result
of these purchases are included in trade an other payables (note 14).
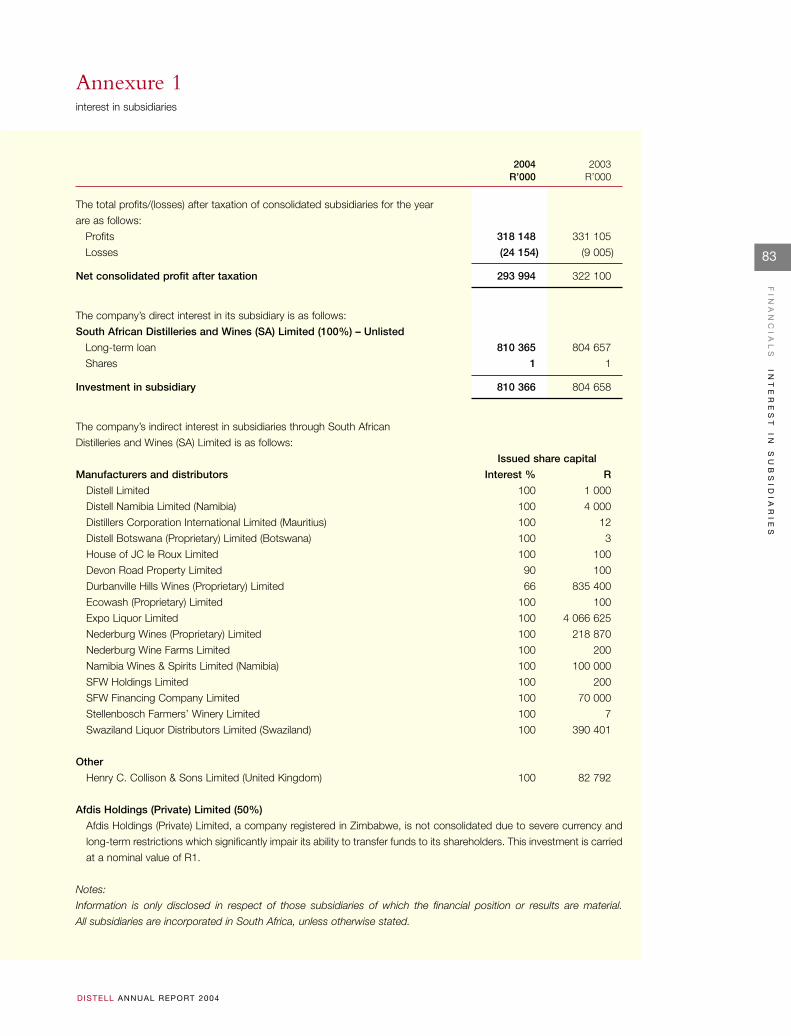
83
FI
NA
NC
IA
LS
IN
TE
RE
ST
I
N
SU
BS
ID
IA
RI
ES
D ISTELL ANNUAL REPORT 2004
Annexure 1interest in subsidiaries
The total profits/(losses) after taxation of consolidated subsidiaries for the year
are as follows:
Profits 318 148 331 105
Losses (24 154) (9 005)
Net consolidated profit after taxation 293 994 322 100
The company’s direct interest in its subsidiary is as follows:
South African Distilleries and Wines (SA) Limited (100%) – Unlisted
Long-term loan 810 365 804 657
Shares 1 1
Investment in subsidiary 810 366 804 658
The company’s indirect interest in subsidiaries through South African
Distilleries and Wines (SA) Limited is as follows:
Issued share capital
Manufacturers and distributors Interest % R
Distell Limited 100 1 000
Distell Namibia Limited (Namibia) 100 4 000
Distillers Corporation International Limited (Mauritius) 100 12
Distell Botswana (Proprietary) Limited (Botswana) 100 3
House of JC le Roux Limited 100 100
Devon Road Property Limited 90 100
Durbanville Hills Wines (Proprietary) Limited 66 835 400
Ecowash (Proprietary) Limited 100 100
Expo Liquor Limited 100 4 066 625
Nederburg Wines (Proprietary) Limited 100 218 870
Nederburg Wine Farms Limited 100 200
Namibia Wines & Spirits Limited (Namibia) 100 100 000
SFW Holdings Limited 100 200
SFW Financing Company Limited 100 70 000
Stellenbosch Farmers’ Winery Limited 100 7
Swaziland Liquor Distributors Limited (Swaziland) 100 390 401
Other
Henry C. Collison & Sons Limited (United Kingdom) 100 82 792
Afdis Holdings (Private) Limited (50%)
Afdis Holdings (Private) Limited, a company registered in Zimbabwe, is not consolidated due to severe currency and
long-term restrictions which significantly impair its ability to transfer funds to its shareholders. This investment is carried
at a nominal value of R1.
Notes:
Information is only disclosed in respect of those subsidiaries of which the financial position or results are material.
All subsidiaries are incorporated in South Africa, unless otherwise stated.
2004 2003R’000 R’000
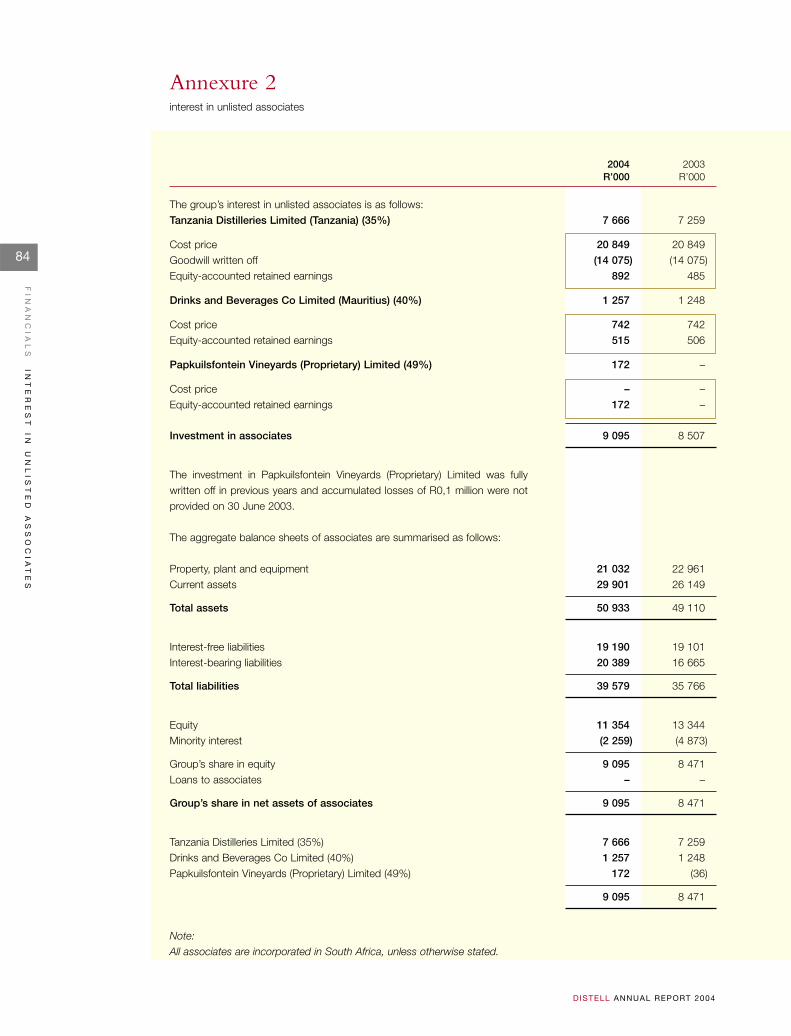
84
FI
NA
NC
IA
LS
IN
TE
RE
ST
I
N
UN
LI
ST
ED
A
SS
OC
IA
TE
S
D ISTELL ANNUAL REPORT 2004
Annexure 2interest in unlisted associates
The group’s interest in unlisted associates is as follows:Tanzania Distilleries Limited (Tanzania) (35%) 7 666 7 259
Cost price 20 849 20 849 Goodwill written off (14 075) (14 075)Equity-accounted retained earnings 892 485
Drinks and Beverages Co Limited (Mauritius) (40%) 1 257 1 248
Cost price 742 742 Equity-accounted retained earnings 515 506
Papkuilsfontein Vineyards (Proprietary) Limited (49%) 172 –
Cost price – –Equity-accounted retained earnings 172 –
Investment in associates 9 095 8 507
The investment in Papkuilsfontein Vineyards (Proprietary) Limited was fullywritten off in previous years and accumulated losses of R0,1 million were notprovided on 30 June 2003.
The aggregate balance sheets of associates are summarised as follows:
Property, plant and equipment 21 032 22 961 Current assets 29 901 26 149
Total assets 50 933 49 110
Interest-free liabilities 19 190 19 101 Interest-bearing liabilities 20 389 16 665
Total liabilities 39 579 35 766
Equity 11 354 13 344 Minority interest (2 259) (4 873)
Group’s share in equity 9 095 8 471 Loans to associates – –
Group’s share in net assets of associates 9 095 8 471
Tanzania Distilleries Limited (35%) 7 666 7 259 Drinks and Beverages Co Limited (40%) 1 257 1 248 Papkuilsfontein Vineyards (Proprietary) Limited (49%) 172 (36)
9 095 8 471
Note:
All associates are incorporated in South Africa, unless otherwise stated.
2004 2003R’000 R’000
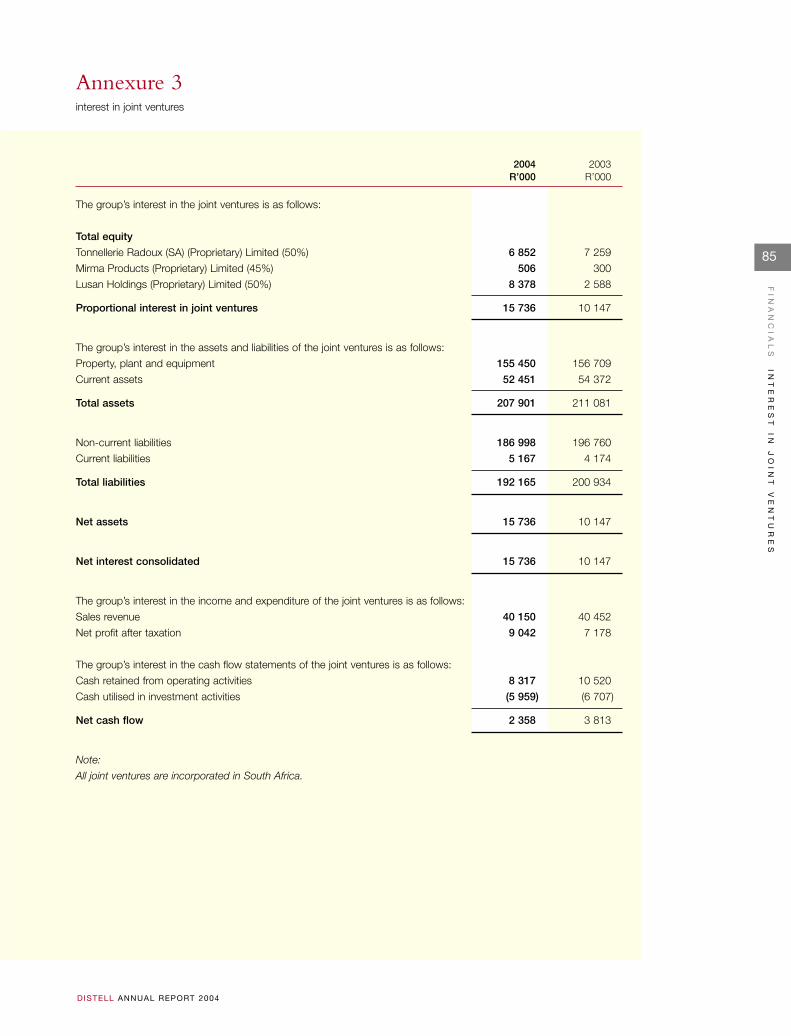
85
FI
NA
NC
IA
LS
IN
TE
RE
ST
I
N
JO
IN
T
VE
NT
UR
ES
D ISTELL ANNUAL REPORT 2004
Annexure 3interest in joint ventures
The group’s interest in the joint ventures is as follows:
Total equity
Tonnellerie Radoux (SA) (Proprietary) Limited (50%) 6 852 7 259
Mirma Products (Proprietary) Limited (45%) 506 300
Lusan Holdings (Proprietary) Limited (50%) 8 378 2 588
Proportional interest in joint ventures 15 736 10 147
The group’s interest in the assets and liabilities of the joint ventures is as follows:
Property, plant and equipment 155 450 156 709
Current assets 52 451 54 372
Total assets 207 901 211 081
Non-current liabilities 186 998 196 760
Current liabilities 5 167 4 174
Total liabilities 192 165 200 934
Net assets 15 736 10 147
Net interest consolidated 15 736 10 147
The group’s interest in the income and expenditure of the joint ventures is as follows:
Sales revenue 40 150 40 452
Net profit after taxation 9 042 7 178
The group’s interest in the cash flow statements of the joint ventures is as follows:
Cash retained from operating activities 8 317 10 520
Cash utilised in investment activities (5 959) (6 707)
Net cash flow 2 358 3 813
Note:
All joint ventures are incorporated in South Africa.
2004 2003R’000 R’000
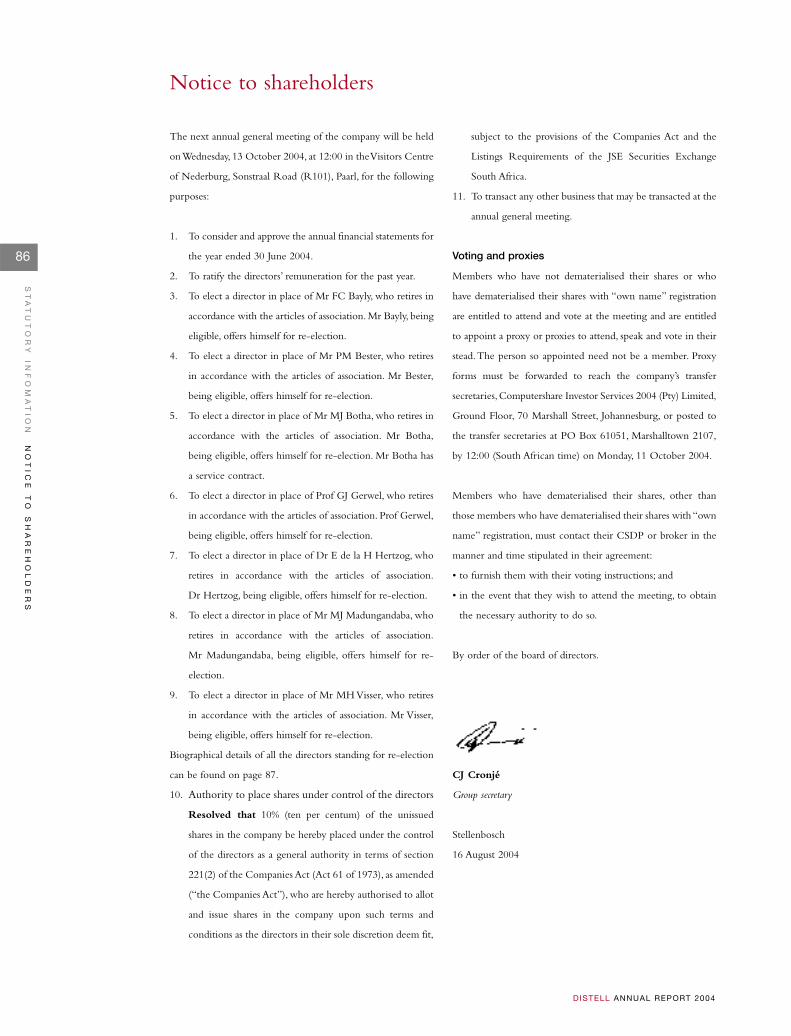
86
ST
AT
UT
OR
Y
IN
FO
MA
TI
ON
NO
TI
CE
T
O
SH
AR
EH
OL
DE
RS
D ISTELL ANNUAL REPORT 2004
Notice to shareholders
The next annual general meeting of the company will be held
on Wednesday, 13 October 2004, at 12:00 in the Visitors Centre
of Nederburg, Sonstraal Road (R101), Paarl, for the following
purposes:
1. To consider and approve the annual financial statements for
the year ended 30 June 2004.
2. To ratify the directors’ remuneration for the past year.
3. To elect a director in place of Mr FC Bayly, who retires in
accordance with the articles of association. Mr Bayly, being
eligible, offers himself for re-election.
4. To elect a director in place of Mr PM Bester, who retires
in accordance with the articles of association. Mr Bester,
being eligible, offers himself for re-election.
5. To elect a director in place of Mr MJ Botha, who retires in
accordance with the articles of association. Mr Botha,
being eligible, offers himself for re-election. Mr Botha has
a service contract.
6. To elect a director in place of Prof GJ Gerwel, who retires
in accordance with the articles of association. Prof Gerwel,
being eligible, offers himself for re-election.
7. To elect a director in place of Dr E de la H Hertzog, who
retires in accordance with the articles of association.
Dr Hertzog, being eligible, offers himself for re-election.
8. To elect a director in place of Mr MJ Madungandaba, who
retires in accordance with the articles of association.
Mr Madungandaba, being eligible, offers himself for re-
election.
9. To elect a director in place of Mr MH Visser, who retires
in accordance with the articles of association. Mr Visser,
being eligible, offers himself for re-election.
Biographical details of all the directors standing for re-election
can be found on page 87.
10. Authority to place shares under control of the directors
Resolved that 10% (ten per centum) of the unissued
shares in the company be hereby placed under the control
of the directors as a general authority in terms of section
221(2) of the Companies Act (Act 61 of 1973), as amended
(“the Companies Act”), who are hereby authorised to allot
and issue shares in the company upon such terms and
conditions as the directors in their sole discretion deem fit,
subject to the provisions of the Companies Act and the
Listings Requirements of the JSE Securities Exchange
South Africa.
11. To transact any other business that may be transacted at the
annual general meeting.
Voting and proxies
Members who have not dematerialised their shares or who
have dematerialised their shares with “own name” registration
are entitled to attend and vote at the meeting and are entitled
to appoint a proxy or proxies to attend, speak and vote in their
stead.The person so appointed need not be a member. Proxy
forms must be forwarded to reach the company’s transfer
secretaries,Computershare Investor Services 2004 (Pty) Limited,
Ground Floor, 70 Marshall Street, Johannesburg, or posted to
the transfer secretaries at PO Box 61051, Marshalltown 2107,
by 12:00 (South African time) on Monday, 11 October 2004.
Members who have dematerialised their shares, other than
those members who have dematerialised their shares with “own
name” registration, must contact their CSDP or broker in the
manner and time stipulated in their agreement:
• to furnish them with their voting instructions; and
• in the event that they wish to attend the meeting, to obtain
the necessary authority to do so.
By order of the board of directors.
CJ Cronjé
Group secretary
Stellenbosch
16 August 2004
87
ST
AT
UT
OR
Y
IN
FO
MA
TI
ON
NO
TI
CE
T
O
SH
AR
EH
OL
DE
RS
D ISTELL ANNUAL REPORT 2004
FC BAYLY
Duimpie Bayly (64) BSc, MSc
Duimpie is director of Duimpie Bayly & Associates, consultant
and advisor to the wine industry.
PM BESTER
Peter Bester (63) BSc, MBL
Peter retired as executive chairperson of Cadbury Schweppes
(SA) Limited in 2001. He is currently director of ABI,
Anglovaal Industries, Suidwes Beleggings, National Brands and
Vetsak Limited.
MJ BOTHA
Merwe Botha (51) Hons BCom (Taxation), Hons BCompt,
CA(SA)
Merwe served articles for three years and thereafter joined
Distillers Corporation in 1980. He held various positions in the
financial department until he was appointed financial
director in 1997 and to his present position at Distell in
December 2000.
GJ GERWEL
Prof Jakes Gerwel (58) BA, BA (Hons), LicGermPhil, DLitt et Phil
Jakes taught at the University of the Western Cape where
he subsequently was vice chancellor from 1987 to April 1994.
From May 1994 to June 1999 he served as director-general
in the Office of President Mandela and secretary of the Cabinet
in the Government of National Unity. He chairs the boards
of trustees of the Nelson Mandela Foundation, the
Mandela Rhodes Foundation and the African Centre for
the Constructive Resolution of Disputes. Jakes presently serves
on the boards of Naspers, Old Mutual and Goldfields. He
is also non-executive chairperson of Africon Engineering
International, Brimstone and Educor and chairperson of
the Human Sciences Research Council. He is chancellor
of Rhodes University.
E DE LA H HERTZOG
Dr Edwin Hertzog (55) MB ChB, MMed, FFA
After practising as private anaesthetist for three years, Edwin
joined Rembrandt Group by invitation in January 1983. At
the end of 1983 he became managing director of Medi-Clinic
Corporation and chairperson in 1991. Edwin currently
serves on the boards of Remgro, Total SA and Trans Hex
Group and is also chairperson of the Council of the
Stellenbosch University.
MJ MADUNGANDABA
Joe Madungandaba (46) CFA(SA)
Joe is chief executive officer of Community Investment
Holdings. He is chairperson of Marine Data Systems and
deputy chairperson of Transtel Audit Committee, executive
director of Jasco Electronic Holdings Limited and non-
executive director of Air Liquide Healthcare. He lectured
at the University of Potchefstroom, Faculty of Commerce
for Small Business Advisory Bureau.
MH VISSER
Thys Visser (50), BCom (Hons), CA(SA)
Thys is a chartered accountant who qualified with Arthur Young
& Company in Cape Town before joining Rembrandt Group
where he held a number of positions, including those of financial
director in 1991 and managing director in 1992. He is currently
deputy chairman and chief executive officer of Remgro Limited.
Thys currently serves on the boards of British American Tobacco
PLC, Nampak Limited, Rainbow Chicken Limited, Remgro
Limited and Unilever BestfoodsRobertsons Holdings LLC.

88
DISTELL ANNUAL REPORT 2004
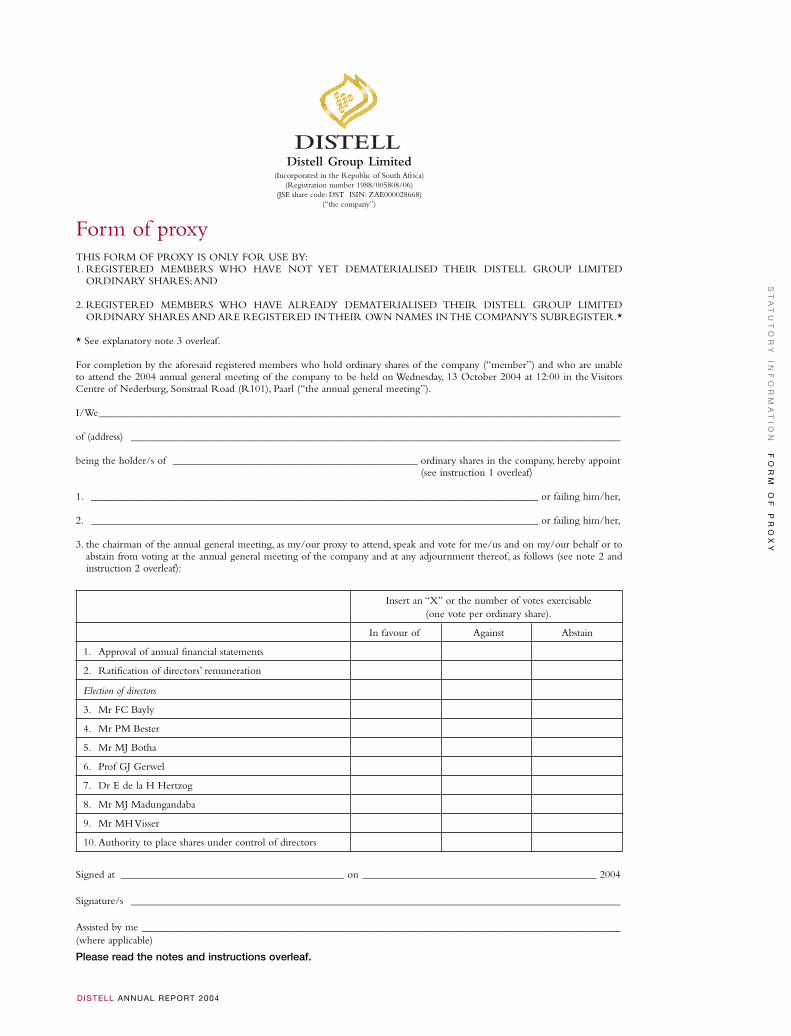
ST
AT
UT
OR
Y
IN
FO
RM
AT
IO
NF
OR
M
OF
P
RO
XY
D ISTELL ANNUAL REPORT 2004
Form of proxyTHIS FORM OF PROXY IS ONLY FOR USE BY:1. REGISTERED MEMBERS WHO HAVE NOT YET DEMATERIALISED THEIR DISTELL GROUP LIMITED
ORDINARY SHARES;AND
2. REGISTERED MEMBERS WHO HAVE ALREADY DEMATERIALISED THEIR DISTELL GROUP LIMITEDORDINARY SHARES AND ARE REGISTERED IN THEIR OWN NAMES IN THE COMPANY’S SUBREGISTER.*
* See explanatory note 3 overleaf.
For completion by the aforesaid registered members who hold ordinary shares of the company (“member”) and who are unableto attend the 2004 annual general meeting of the company to be held on Wednesday, 13 October 2004 at 12:00 in the VisitorsCentre of Nederburg, Sonstraal Road (R101), Paarl (“the annual general meeting”).
I/We__________________________________________________________________________________________________
of (address) ____________________________________________________________________________________________
being the holder/s of ______________________________________________ ordinary shares in the company, hereby appoint(see instruction 1 overleaf)
1. ____________________________________________________________________________________ or failing him/her,
2. ____________________________________________________________________________________ or failing him/her,
3. the chairman of the annual general meeting, as my/our proxy to attend, speak and vote for me/us and on my/our behalf or toabstain from voting at the annual general meeting of the company and at any adjournment thereof, as follows (see note 2 andinstruction 2 overleaf):
Insert an “X” or the number of votes exercisable(one vote per ordinary share).
In favour of Against Abstain
1. Approval of annual financial statements
2. Ratification of directors’ remuneration
Election of directors
3. Mr FC Bayly
4. Mr PM Bester
5. Mr MJ Botha
6. Prof GJ Gerwel
7. Dr E de la H Hertzog
8. Mr MJ Madungandaba
9. Mr MH Visser
10. Authority to place shares under control of directors
Signed at __________________________________________ on ____________________________________________ 2004
Signature/s ____________________________________________________________________________________________
Assisted by me __________________________________________________________________________________________(where applicable)
Please read the notes and instructions overleaf.
Distell Group Limited(Incorporated in the Republic of South Africa)
(Registration number 1988/005808/06)(JSE share code: DST ISIN: ZAE000028668)
(“the company”)
ST
AT
UT
OR
Y
IN
FO
RM
AT
IO
NF
OR
M
OF
P
RO
XY
D ISTELL ANNUAL REPORT 2004
Form of proxy
Notes:
1. A member entitled to attend and vote at the annual general
meeting is entitled to appoint one or more proxies to
attend, speak and vote in his/her stead. A proxy need not
be a registered member of the company.
2. Every member present in person or by proxy and entitled
to vote at the annual general meeting of the company shall,
on a show of hands, have one vote only, irrespective of the
number of shares such member holds. In the event of a
poll, every member shall be entitled to that proportion of
the total votes in the company which the aggregate
amount of the nominal value of the shares held by such
member bears to the aggregate amount of the nominal
value of all the shares issued by the company.
3. Members registered in their own names are members who
elected not to participate in the Issuer-Sponsored
Nominee Programme and who appointed Computershare
as their Central Securities Depository Participant (CSDP)
with the express instruction that their uncertificated shares
are to be registered in the electronic sub-register of
members in their own names.
Instructions on signing and lodging the form of proxy:
1. A member may insert the name of a proxy or the names of
two alternative proxies of the member’s choice in the
space/s provided overleaf, with or without deleting “the
chairman of the annual general meeting”, but any such
deletion must be initialled by the member. Should this
space be left blank, the proxy will be exercised by the
chairman of the annual general meeting. The person
whose name appears first on the form of proxy and who is
present at the annual general meeting will be entitled to
act as proxy to the exclusion of those whose names follow.
2. A member’s voting instructions to the proxy must be
indicated by the insertion of an “X”, or the number of
votes exercisable by that member, in the appropriate spaces
provided overleaf. Failure to do so will be deemed to
authorise the proxy to vote or to abstain from voting at the
annual general meeting, as he/she thinks fit in respect of all
the member’s exercisable votes. A member or his/her
proxy is not obliged to use all the votes exercisable by
him/her or by his/her proxy, but the total number of votes
cast, or those in respect of which abstention is recorded,
may not exceed the total number of votes exercisable by
the member or by his/her proxy.
3. A minor must be assisted by his/her parent or guardian
unless the relevant documents establishing his/her legal
capacity are produced or have been registered by the
transfer secretaries.
4. To be valid, the completed forms of proxy must be lodged
with the transfer secretaries of the company, Computershare
Investor Services 2004 (Proprietary) Limited at Ground
Floor, 70 Marshall Street, Johannesburg, South Africa, or
posted to the transfer secretaries at PO Box 61051,
Marshalltown 2107, South Africa, to be received by them
not later than Monday, 11 October 2004 at 12:00 (South
African time).
5. Documentary evidence establishing the authority of a
person signing this form of proxy in a representative
capacity must be attached to this form of proxy unless
previously recorded by the transfer secretaries or waived by
the chairman of the annual general meeting.
6. The completion and lodging of this form of proxy will
not preclude the relevant member from attending the
annual general meeting and speaking and voting in person
thereat to the exclusion of any proxy appointed in terms
hereof, should such member wish to do so.
7. The completion of any blank spaces overleaf need not be
initialled. Any alterations or corrections to this form of
proxy must be initialled by the signatory/ies.
8. The chairman of the annual general meeting may accept
any form of proxy which is completed other than in
accordance with these instructions provided that he is
satisfied as to the manner in which a member wishes to vote.
DISTELL ANNUAL REPORT 2004
ST
AT
UT
OR
Y
IN
FO
RM
AT
IO
ND
AT
ES
O
F
IM
PO
RT
AN
CE
T
O
SH
AR
EH
OL
DE
RS
A
ND
A
DM
IN
IS
TR
AT
IO
N
G R A P H I C O R3 1 1 4 2
Dates of importance to shareholders
Annual general meeting October 2004
Financial report
Interim report February 2005
Preliminary announcement of annual results August 2005
Annual financial statements September 2005
Ordinary dividends
Interim dividends
declaration February 2005
payable March 2005
Final dividends
declaration August 2005
payable September 2005
Administration
Distell Group Limited
Incorporated in the Republic of South Africa
(Registration number: 1988/005808/06)
ISIN: ZAE000028668
JSE share code: DST
Secretary
CJ Cronjé
REGISTERED OFFICE
Distell
Aan-de-Wagen Road, Stellenbosch 7600
PO Box 184, Stellenbosch 7599
Telephone: 021 809 7000
Facsimile: 021 886 4611
E-mail: [email protected]
Transfer secretaries
Computershare Investor Services 2004 (Proprietary) Limited
70 Marshall Street, Johannesburg 2001
PO Box 61051, Marshalltown 2107
Telephone: 011 370 7700
Facsimile: 011 836 0792
Auditors
PricewaterhouseCoopers Inc.
Stellenbosch
Listing
JSE Securities Exchange South Africa
Sector: Non-cyclical consumer goods – Beverages
Sponsor
Rand Merchant Bank (a division of FirstRand Bank Limited)
Corporate Finance
Website
www.distell.co.za

DISTELLwww.distell.co.za