DISSSIN PAPER SERIES - ftp.iza.orgftp.iza.org/dp11865.pdf · Instead, Veiga and Veiga (2018),...
24
DISCUSSION PAPER SERIES IZA DP No. 11865 Marco Alberto De Benedetto Maria De Paola Term Limit Extension and Electoral Participation: Evidence from a Diff-in-Discontinuities Design at the Local Level in Italy SEPTEMBER 2018
Transcript of DISSSIN PAPER SERIES - ftp.iza.orgftp.iza.org/dp11865.pdf · Instead, Veiga and Veiga (2018),...

DISCUSSION PAPER SERIES
IZA DP No. 11865
Marco Alberto De BenedettoMaria De Paola
Term Limit Extension and Electoral Participation: Evidence from a Diff-in-Discontinuities Design at the Local Level in Italy
SEPTEMBER 2018

Any opinions expressed in this paper are those of the author(s) and not those of IZA. Research published in this series may include views on policy, but IZA takes no institutional policy positions. The IZA research network is committed to the IZA Guiding Principles of Research Integrity.The IZA Institute of Labor Economics is an independent economic research institute that conducts research in labor economics and offers evidence-based policy advice on labor market issues. Supported by the Deutsche Post Foundation, IZA runs the world’s largest network of economists, whose research aims to provide answers to the global labor market challenges of our time. Our key objective is to build bridges between academic research, policymakers and society.IZA Discussion Papers often represent preliminary work and are circulated to encourage discussion. Citation of such a paper should account for its provisional character. A revised version may be available directly from the author.
Schaumburg-Lippe-Straße 5–953113 Bonn, Germany
Phone: +49-228-3894-0Email: [email protected] www.iza.org
IZA – Institute of Labor Economics
DISCUSSION PAPER SERIES
IZA DP No. 11865
Term Limit Extension and Electoral Participation: Evidence from a Diff-in-Discontinuities Design at the Local Level in Italy
SEPTEMBER 2018
Marco Alberto De BenedettoUniversità degli Studi di Messina and Birkbeck College
Maria De PaolaUniversità degli Studi della Calabria and IZA

ABSTRACT
IZA DP No. 11865 SEPTEMBER 2018
Term Limit Extension and Electoral Participation: Evidence from a Diff-in-Discontinuities Design at the Local Level in Italy
We study the effect of term limits on voter turnout in local Italian elections. Since 2014
the Italian law allows mayors in municipalities with a population size lower than 3,000
inhabitants to re-run for a third term, whereas mayors in cities with a number of residents
above the cutoff still face a two-term limit. The introduction of the reform permits us
to implement a difference-in-discontinuities design exploiting the before/after with the
discontinuous policy change. We find that voters negatively react to the introduction of
the reform and in particular electoral participation decreases by about 5 percentage points
in municipalities eligible to the treatment compared to municipalities in the control group.
This negative effect is essentially driven by a decrease in the political competition. We also
find that relaxing term limits does not improve the quality of politicians running for election.
JEL Classification: C21, D72, H70, J78
Keywords: diff-in-discontinuities, voter turnout, political competition
Corresponding author:Maria De PaolaDepartment of Economics, Statistics and FinanceUniversity of CalabriaVia Ponte Bucci87036 Arcavacata di Rende (CS)Italy
E-mail: [email protected]

2
1. Introduction
In modern democracies, commonly characterized by universal suffrage, one way citizens actively use to
participate in political life is to cast their vote. Participation at elections is then fundamental for a well-working
political system, as through their representatives, citizens take part in public decision making process. As
voting is costly (acquisition of information, cost of displacement, etc.), while for each single elector the
probability of affecting the electoral outcome is close to zero (Dows, 1957), understanding why people decide
to vote is a challenging question. In order to give an explanation of the so-called “paradox of voting”,
describing the fact that in spite of the theoretical prediction of a very low turnout many people go to the polls
(Fiorina, 1976), several determinants of the electoral participation have been investigated in the literature,
focusing both on population’s characteristics and on candidates’ features (see among others McDermott, 2005;
Sigelman et al.,1995; De Benedetto and De Paola, 2016; De Benedetto and De Paola, 2017; De Paola et al.,
2014; Kousser and Mullin, 2007). The impact of different institutional features has also been investigated with
works analyzing the impact of electoral systems, voting mechanisms and electoral closeness (Nickerson, 2007;
Kousser and Mullin, 2007; Funk, 2010, Cox and Munger, 1989; Denver and Hands, 1974; De Paola and
Scoppa, 2013). On the other hand, little is known about the effect produced by term limits.
Studying the effect of term limits on voters’ behavior is relevant in any representative democracy, especially
at the local level, since many elected officials, who usually have a direct connection with electors, can obtain
too much power or authority over time, making their representation of the citizens less effective.
Moreover, politicians might have developed over time a reputation for being corrupt and unconcerned with
their constituents. The common thread with most politicians that have become more corrupt seems to be the
length of time they have served (see for instance, Gamboa-Cavazos et al., 2008; Campante et al. 2009; Coviello
and Gagliarducci, 2017). The absence (or relaxation) of term limits can contribute to this phenomenon as it
prolongs the time a politician can be influenced by the power of the office s\he holds. Further, allowing local
politicians to re-run for the same position could affect participation at the polls through other channels. For
instance, extending term limits might decrease electoral competition, forcing freshmen candidates to not run
for elections, and discourage voters to go to the polls and cast their votes (Nalder, 2007). On the other hand,
allowing politicians to stay in office might increase institutional quality and through this channel increase
electoral participation. In fact, the absence of term limits allows high quality and experienced representatives
to hold their position. In addition, by increasing the benefits deriving from political careers, absent or relaxed
term limits can induce new high quality entrants to run for election.
The aim of this paper is to provide new evidence of the effect of term limits focusing on Italian local
elections. Our identification strategy relies on an exogenous institutional change introduced by a law (Law
April 2014 no.56) allowing mayors to re-run for a third term in municipalities with a population size lower
than 3,000 inhabitants. Before the reform all municipalities were subject to a term limit of two consecutive
mandates. The change introduced by this law allows us to use a difference-in discontinuities design by

3
combining the before/after with the discontinuous policy variation and to identify the impact of relaxing term
limits both on turnout and institutional quality.
We contribute to the existing literature in different ways. First, the literature investigating the effect of term
limits on electoral participation is scant, especially for European countries. To the best of our knowledge there
are only a few papers stressing this kind of relationship, highlighting mixed results. Hajnal and Lewis (2003),
using data obtained through a mail questionnaire proposed to city clerks in California find no effect of term
limits on voter turnout. Nadler (2007), also using California data, considers state legislative races from 1976
to 2004 and finds that term limits decrease voter turnout. Instead, Veiga and Veiga (2018), analyzing data at
the local level in Portugal and using a difference-in-differences approach, highlight a positive effect of term
limit on electoral participation.
These mixed results might be due to the fact that in some of the contexts considered in these works, term
limits were not exogenously imposed, leading to a reverse causality issue. Similarly to Veiga and Veiga (2018),
we exploit a national reform that has affected all Italian municipalities with less than 3,000 inhabitants. Thanks
to the richness of our data set, that also provides information on a number of candidates’ characteristics, we
are able to further contribute to this literature by investigating whether term limit extensions lead to an increase
in the institutional quality, allowing high quality representatives to remain in office. At this aim we investigate
whether in response to term limit extensions high quality incumbents tend to re-run for election. As term limit
extensions also increase the returns deriving from political career we also investigate the effects produced on
the quality of new entrants.
Our results at the local level in Italy are in line with those found for Portugal and show that extending the
term limit for mayors decreases voter turnout by about 5 percentage points. The channel through which the
implementation of the policy negatively affects voters’ behavior is a reduction in the political competition
(larger electoral margin) characterizing those electoral races in which the exiting mayor who has already served
for two consecutive mandates is allowed to re-run for the third time. We show that term limit extension has no
effect on institutional quality as all candidates’ observable characteristics remain substantially unchanged.
These results hold true when we choose different optimal bandwidths and when we use both a fractional
model as well as a beta regression model to take into account that our outcome variable is measured by a
proportion. Moreover, we do not find any statistically significant effect when focusing on a fake population
thresholds and on fake years, reassuring us that the effects found when we correctly specify our model are
causal and not driven by chance.
The paper is organized as follows. In Section 2 we describe the Italian institutional setting, whereas in
Section 3 we illustrate our data set, the methodology used and some validity tests on the diff-in-discontinuities
design. In Section 4 we discuss our main empirical results. Section 5 investigates the impact of relaxing term
limits on institutional quality. Section 6 describes some robustness checks and Section 7 concludes.

4
2. Italian local institutional settings and data The system currently regulating municipal elections in Italy has been introduced in 1993 (DL 25 March 1993,
no. 81). It has established the direct election of the mayor and the adoption of the plurality rule, with some
differences according to the size of the city. For municipalities with a population lower than 15,000 inhabitants,
elections are held with single ballot and plurality rule: the winning candidate is awarded a majority premium
of at least two-thirds of the seats in the council. For cities with a population above 15,000, elections are held
using a dual ballot system (where the second ballot is held only if none of the candidates obtains an absolute
majority of votes in the first ballot). Only the two leading candidates at the first round compete in the second
ballot and the winning candidate is awarded a majority premium of at least 60 percent of the seats in the
council.
Municipal elections in Italy are held every 5 years1 and Municipal governments cannot choose the election
schedule. In certain circumstances, the legislature may not survive until the end of its legislative term, e.g.
because of a mayor’s early resignation. In these cases, elections are held before the natural schedule, and, as a
consequence, all subsequent elections will be held at different times from other municipalities that have
completed the foreseen legislative term.
Municipalities have a registry of eligible voters, which is revised whenever there is an election and all
citizens aged 18 or above on the election date are automatically registered to vote. Voting takes place in polling
stations organized by the local authorities. Elections are organized according to a traditional paper ballot
system.
Moreover, at local level, legislative population thresholds establish a number of institutional features (such
as council size and executive committee size, electoral rules, etc.) and a vast array of national policies (for
instance, those concerning public transfers). Among these policies there is one defining mayors’ wage that
sharply changes in proximity of 9 population thresholds, including the cutoff exploited in our design.
Since 1993, mayors have been subject to a two-term limit, while members of the Executive Committee and
of the Municipal Council, endowed with legislative power, can be re-elected indefinitely. The system has then
remained unchanged until April 2014 when a new law approved by the Italian Parliament (Law n.56) has
allowed mayors in municipalities with a number of inhabitants lower than 3,000 to re-run for a third term (they
are subject to a three-term limit). The change introduced by this legislative intervention has been motivated by
the difficulty faced in finding high quality administrators available to run for a mayor position in small
municipalities. The same law has also introduced an upward change in the number of councilors within the
municipal apparatus: municipalities with a population size lower than 3,000 inhabitants must have 10
councilors, whereas for those cities with a number of residents between 3,001 and 10,000 the number of
councilors is set at 122. We will take this into account in our investigation.
1 With the exception of the years between 1993 and 1999, when the electoral mandate had a duration of 4 years. 2 Before 2011, municipal councils were composed by 12 members in municipalities below 3,000 inhabitants and by 16 members in cities with a population size between 3,001 and 10,000. In 2011 the law established a reduction in the number of councilors, passing from 12 to 9 for cities with a population below 3,000 and from 16 to 12 for cities with a population
5
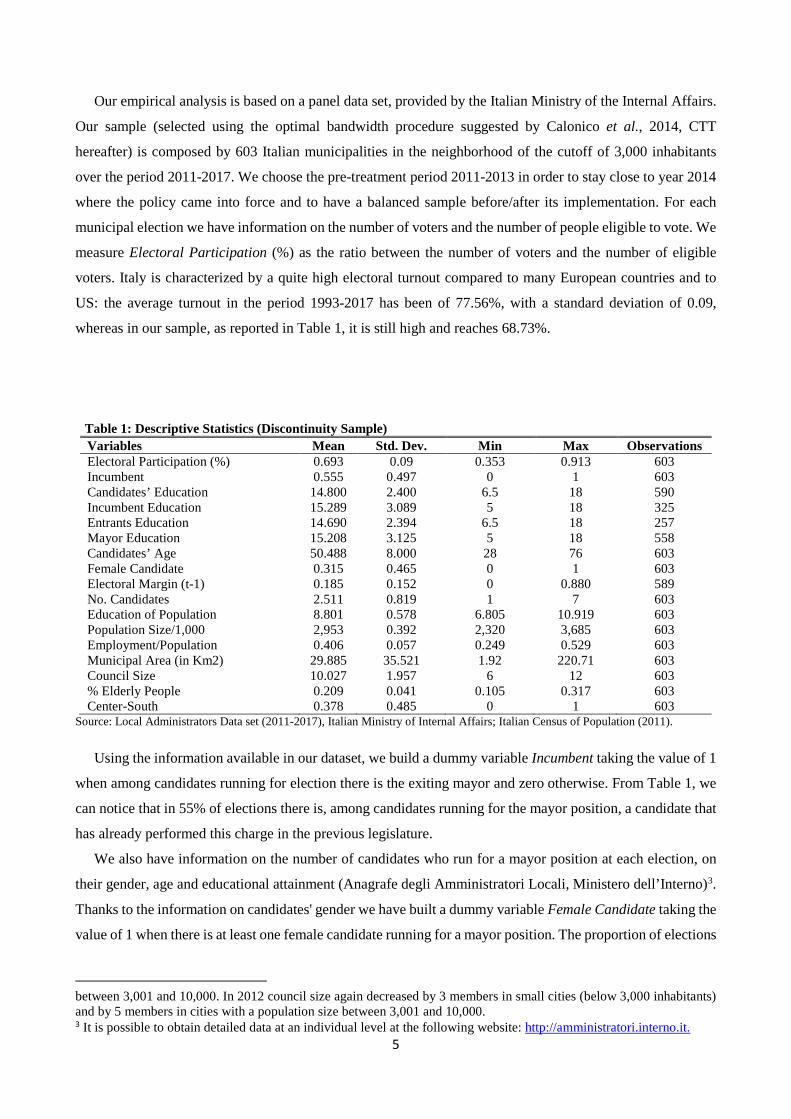
Our empirical analysis is based on a panel data set, provided by the Italian Ministry of the Internal Affairs.
Our sample (selected using the optimal bandwidth procedure suggested by Calonico et al., 2014, CTT
hereafter) is composed by 603 Italian municipalities in the neighborhood of the cutoff of 3,000 inhabitants
over the period 2011-2017. We choose the pre-treatment period 2011-2013 in order to stay close to year 2014
where the policy came into force and to have a balanced sample before/after its implementation. For each
municipal election we have information on the number of voters and the number of people eligible to vote. We
measure Electoral Participation (%) as the ratio between the number of voters and the number of eligible
voters. Italy is characterized by a quite high electoral turnout compared to many European countries and to
US: the average turnout in the period 1993-2017 has been of 77.56%, with a standard deviation of 0.09,
whereas in our sample, as reported in Table 1, it is still high and reaches 68.73%.
Table 1: Descriptive Statistics (Discontinuity Sample) Variables Mean Std. Dev. Min Max Observations Electoral Participation (%) 0.693 0.09 0.353 0.913 603 Incumbent 0.555 0.497 0 1 603 Candidates’ Education 14.800 2.400 6.5 18 590 Incumbent Education 15.289 3.089 5 18 325 Entrants Education 14.690 2.394 6.5 18 257 Mayor Education 15.208 3.125 5 18 558 Candidates’ Age 50.488 8.000 28 76 603 Female Candidate 0.315 0.465 0 1 603 Electoral Margin (t-1) 0.185 0.152 0 0.880 589 No. Candidates 2.511 0.819 1 7 603 Education of Population 8.801 0.578 6.805 10.919 603 Population Size/1,000 2,953 0.392 2,320 3,685 603 Employment/Population 0.406 0.057 0.249 0.529 603 Municipal Area (in Km2) 29.885 35.521 1.92 220.71 603 Council Size 10.027 1.957 6 12 603 % Elderly People 0.209 0.041 0.105 0.317 603 Center-South 0.378 0.485 0 1 603
Source: Local Administrators Data set (2011-2017), Italian Ministry of Internal Affairs; Italian Census of Population (2011).
Using the information available in our dataset, we build a dummy variable Incumbent taking the value of 1
when among candidates running for election there is the exiting mayor and zero otherwise. From Table 1, we
can notice that in 55% of elections there is, among candidates running for the mayor position, a candidate that
has already performed this charge in the previous legislature.
We also have information on the number of candidates who run for a mayor position at each election, on
their gender, age and educational attainment (Anagrafe degli Amministratori Locali, Ministero dell’Interno)3.
Thanks to the information on candidates' gender we have built a dummy variable Female Candidate taking the
value of 1 when there is at least one female candidate running for a mayor position. The proportion of elections
between 3,001 and 10,000. In 2012 council size again decreased by 3 members in small cities (below 3,000 inhabitants) and by 5 members in cities with a population size between 3,001 and 10,000. 3 It is possible to obtain detailed data at an individual level at the following website: http://amministratori.interno.it.

6
in which there is at least a woman participating at the electoral competition is of about 31.5% with a standard
deviation of 0.465. The average educational attainment of candidates is about 15 years (Candidates’
Education), and this highlights how the majority of candidates has at least obtained a high-school diploma.4
Moreover, we also observe the education of incumbents, new entrants and mayors that is on average about 15
years each respectively. Finally, candidates are on average 50 years old. The number of candidates running for
a mayor position on average is equal to 2.51 with a standard deviation of 0.821.
Our data set also allows us also to build some proxies of the degree of competition characterizing each
electoral race. We use the number of votes obtained by each candidate to create a variable Electoral Margin
as the absolute difference between votes obtained by the two leading candidates (divided by the number of
voters). Electoral Margin represents an inverse measure of expected electoral closeness, and since it is
potentially endogenous, we take its lagged value (which is on average equal to 0.185, with a maximum of
0.88 and a minimum of 0).5 To control for municipalities’ demographic characteristics, we use the 2011 Italian
Census of Population. As shown in Table 1, the average population size is 2,953, the average educational
attainment of population, by considering only people aged 6 or above, is about 9 years. Further, the fraction of
employed people in the population is 40%, the proportion of elderly people (over 65) in the population is on
average 20%. Roughly 38% of municipalities in the sample are located in the Center-South.
3. Econometric model and Validity Test
3.1 Methodology The standard RD design allows identification of the effect of term limit extension on electoral participation
only if there are no other policies changing sharply at the threshold of 3,000 inhabitants. In the Italian local
setting this is not the case, since the salary earned by mayors and local councilors changes in the neighborhood
of the same cutoff. However, these differences existed before the Law n.56 was passed in 2014, since the salary
policy came into force in the 1960s.
Then, to recover the casual effect of mayor term limit extension on electoral turnout, our empirical design
combines the RD with a before-after comparison in the spirit of Grembi et al. (2016). Formally, we restrict the
sample to municipalities in the interval 𝑃𝑃𝑖𝑖∈ [𝑃𝑃𝑐𝑐 − h, 𝑃𝑃𝑐𝑐 + h], by choosing an optimal bandwidth as suggested
by Calonico et al. (2014)6 and we estimate the following model by means of OLS with fixed effects at province
level (Local Linear Regression, LLR henceforth):
4 In Italy, it takes 13 years to attain a High-School Degree while 17-18 years are necessary to attain a College Degree. Moreover, the educational attainment of people with a PhD or a Master degree is always 18 years in our sample. 5The value of zero characterizes few elections in which the two candidates obtained exactly the same number of votes. 6 As we show in Section 6, using as optimal bandwidths those proposed both by Imbens and Kalyanaraman (2016) as well as by Ludwig and Miller (2007) the sample size increases and results are still substantially the same.

7
𝐸𝐸𝐸𝐸𝐸𝐸𝐸𝐸𝐸𝐸𝐸𝐸𝐸𝐸𝐸𝐸𝐸𝐸 𝑃𝑃𝐸𝐸𝐸𝐸𝐸𝐸𝑃𝑃𝐸𝐸𝑃𝑃𝑃𝑃𝐸𝐸𝐸𝐸𝑃𝑃𝐸𝐸𝑃𝑃 𝑖𝑖𝑖𝑖 = 𝛽𝛽0 + 𝛽𝛽1𝑃𝑃𝐸𝐸𝑃𝑃_3,000𝑖𝑖 + 𝛽𝛽2𝐴𝐴𝐴𝐴𝐸𝐸𝐸𝐸𝐸𝐸𝑖𝑖 + 𝛽𝛽3𝐸𝐸𝐸𝐸𝐸𝐸𝐸𝐸𝐸𝐸𝐸𝐸𝐸𝐸𝐸𝐸𝑃𝑃𝐸𝐸𝑃𝑃𝐸𝐸𝑖𝑖𝑖𝑖 + 𝛽𝛽4𝑍𝑍𝑖𝑖𝑖𝑖 + 𝛽𝛽5𝑋𝑋𝑖𝑖𝑖𝑖 + 𝛽𝛽6𝑃𝑃𝑖𝑖 + 𝜑𝜑𝑝𝑝 +
µ𝑖𝑖 + 𝜀𝜀𝑖𝑖𝑖𝑖, [1]
where 𝐸𝐸𝐸𝐸𝐸𝐸𝐸𝐸𝐸𝐸𝐸𝐸𝐸𝐸𝐸𝐸𝐸𝐸 𝑃𝑃𝐸𝐸𝐸𝐸𝐸𝐸𝑃𝑃𝐸𝐸𝑃𝑃𝑃𝑃𝐸𝐸𝐸𝐸𝑃𝑃𝐸𝐸𝑃𝑃𝑖𝑖𝑖𝑖 is a variable measuring the (%) electoral turnout (number of voters on
number of eligible electors) in municipality i in election year t; 𝑃𝑃𝐸𝐸𝑃𝑃_3,000𝑖𝑖 is a dummy for municipalities
below 3,000, 𝐴𝐴𝐴𝐴𝐸𝐸𝐸𝐸𝐸𝐸𝑖𝑖 an indicator for the post-treatment period, and 𝑃𝑃𝑖𝑖= 𝑃𝑃𝑖𝑖-𝑃𝑃𝑐𝑐 the normalized population size.
The coefficient 𝛽𝛽3 is the diff-in-disc estimator and identifies the treatment effect of extending mayor term
limit, as the treatment is 𝐸𝐸𝐸𝐸𝐸𝐸𝐸𝐸𝐸𝐸𝐸𝐸𝐸𝐸𝐸𝐸𝑃𝑃𝐸𝐸𝑃𝑃𝐸𝐸𝑖𝑖𝑖𝑖 = 𝑃𝑃𝐸𝐸𝑃𝑃_3,000𝑖𝑖 ∗ 𝐴𝐴𝐴𝐴𝐸𝐸𝐸𝐸𝐸𝐸𝑖𝑖. We also include interaction terms between
𝑃𝑃𝑖𝑖 and 𝑃𝑃𝐸𝐸𝑃𝑃_3,000𝑖𝑖, 𝐴𝐴𝐴𝐴𝐸𝐸𝐸𝐸𝐸𝐸𝑖𝑖 and 𝐸𝐸𝐸𝐸𝐸𝐸𝐸𝐸𝐸𝐸𝐸𝐸𝐸𝐸𝐸𝐸𝑃𝑃𝐸𝐸𝑃𝑃𝐸𝐸𝑖𝑖𝑖𝑖 respectively.
Furthermore, 𝑍𝑍𝑖𝑖𝑖𝑖 is a vector of controls at political competition level. In particular, it includes
𝐸𝐸𝐸𝐸𝐸𝐸𝐸𝐸𝐸𝐸𝐸𝐸𝐸𝐸𝐸𝐸𝐸𝐸𝐸𝐸𝐸𝐸𝐸𝐸𝐸𝐸𝑃𝑃𝑃𝑃𝑖𝑖𝑖𝑖−1, which measures the degree of political competition as the difference in votes (%)
between the winner and his/her closest challenger during the previous election, and the number of candidates
running for a mayor position; 𝑋𝑋𝑖𝑖𝑖𝑖 is a vector which contains controls for municipal characteristics at the time
of elections (population size, the average educational attainment of inhabitants, the proportion of employed
people in the population, the proportion of elderly people, municipal area in squared kilometers and council
size), φp and µt are respectively a province and an electoral year fixed effect, whereas 𝜀𝜀𝑖𝑖𝑖𝑖 is the stochastic
error term of the model. The fixed effects 𝜑𝜑𝑝𝑝 accounts for time-invariant characteristics of the province, either
observable or unobservable.
In all regressions standard errors are robust to heteroskedasticity and are clustered at the municipal level to
take into account the fact that voters’ behavior in the same municipality may be affected by common shocks.
In all regressions we also control for council size. In fact, as explained before, the law we exploit in our
identification strategy has also led to a change in council size. Since there are two policies sharply changing at
the same threshold, one might be concerned that the effect driven by the mayor term limit extension is
confounded by the increase in the number of councilors within the municipal apparatus. Nonetheless, we do
not think this is a major concern in our analysis as council size is unlikely to affect voters’ behavior in our
setting. In municipalities considered in our sample, voters directly elect the mayor and 2/3 of the seats are
assigned to the councilors in the list. Voters can express only one preference for candidates running for a city
councilor position. Consequently, council size should not affect directly voters’ decision to go to the polls and
cast their vote. Anyway, to take into account this potential problem, we always control for council size in our
specifications and as a robustness check we directly test the effect of council size on electoral participation, by
focusing on specific years where the only policy that has changed in proximity of 3,000 cutoff was the number
of councilors, and finding no significant effects.
3.2 Validity of the Diff-in-Discontinuities Design As a first specification test of our design, we check the continuity of the forcing variable, i.e. population size,
nearby the cutoff of 3,000 inhabitants performing a McCrary test by running a kernel local linear regressions
of the log of the density separately on both sides of the threshold (McCrary, 2008). If there were any

8
discontinuities at the cutoff point, one might be concerned that mayors are able to manipulate the assignment
variable and sort below the threshold in order to be able to re-run for a third time at next elections. In fact, if
units of observation have a great deal of control over the assignment variable and if there is a perceived benefit
to a treatment, one would certainly expect units of observation on one side of the threshold to be systematically
different from those on the other side.
However, in principle, in Italy it is very hard to manipulate population size at municipal level for different
reasons. First, Census is run independently by the National Statistical Office, so that false reporting should be
ruled out; second, mayors willing to sort below 3,000 to stay in power for a longer period of time would pay
the price of cutting their wage; third, the Law came into force in 2014, while the Census is run in 2011 when
no mayors could predict the introduction of a policy allowing them to re-run for a third time. As we can see in
Figure 1, the log-difference between the frequency of population size in 2011 to the right and to the left of the
threshold is not statistically significant at conventional levels (it is equal to 0.0601 with a standard deviation
of 0.0984).7
Figure 1: McCrary test- Manipulation of Population Size (2011)
As in any standard RD design we present a second specification test in which we check whether the
introduction of the policy in 2014 is predictive of a set of control variables. In particular, we perform the
balance test by implementing a diff-in-discontinuity regression, with a CCT optimal bandwidth and with a
linear polynomial of the forcing variable along with a first order interaction term, in which we consider as
outcome variable a number of municipal characteristics (municipal area, altimetry, average educational
7 Since the afore mentioned law assigns municipalities to the treatment and control groups based on the 2011 Census and since we focus on elections from 2011 onwards, we would not need to test the continuity of the difference in the assignment variable between 2001 and 2011 Census. However, for the sake of completeness, in the Appendix of the paper, we also report the cross-sectional density tests for 2001 (Figure A1) and the test for the continuity in the density at 3,000 between the 2011 and 2001 Census (Figure A2). Also in these cases, there is no evidence of manipulation.
0.00
01.00
02.00
03.00
04
0 5000 10000

9
attainment of residents, employment rate , proportion of elderly people) and some electoral characteristics
(margin of victory and number of candidates at the electoral race).
Results reported in Table 2 highlight how all of these variables are balanced around the 3,000 threshold
before/after 2014, since the coefficients attached to the diff-in-disc estimators are not statistically significant
at conventional levels.8
Table 2: Balance Test on Control Variables
Variables LLR Optimal
Bandwidth
Obs.
Municipal Area (In Km2) -7.5073 (5.3851)
603
Altimetry -0.0092 (0.2579)
603
Center-South 0.0662 (0.1156)
603
Education of Population 0.0207 (0.1168)
603
Employment/Population 0.0079 (0.0074)
603
% Elderly People -0.0045 (0.0087)
603
No. Candidates 0.0788 (0.2660)
603
Electoral Margin (t-1) -0.0492 (0.0573)
603
Note: Municipalities between 2,326 and 3,674 inhabitants. Baseline Diff-in-discontinuities estimates. We control for province and year fixed effects and we focus on the period 2011-2017. Estimation method: LLR with a first order polynomial of the forcing variable and a linear interaction term. Standard Errors are robust to heteroscedasticity and are cluster at municipal level (reported inside the brackets). Significance at the 10% level is represented by *, at the 5% level by **, and at 1% level by ***.
4. Main Empirical Results Table 4 shows the main diff-in-discontinuities estimates results. In each specification we control for a linear
polynomial of the normalized forcing variable along with a population size interaction term of the first order,
and for province and year fixed effects. In column (1) where results from our baseline specification are
8 As a final specification test, we report in the Appendix a further check on the absence of manipulation assessing whether a municipalities with certain fixed characteristics (Municipal Area, Center-South) moved from the right to the left of the threshold from 2001 to 2011. In particular, in the vein of Grembi et al (2016), we implement a difference-in-discontinuities estimations with time-invariant characteristics as outcome variable in which we use 2001 Census for the pre-treatment period (2011-2013) and 2011 Census after (2014-2017). Results reported in Table A1 do not show any statistically significant jump nearby the 3,000 cutoff for all the time-invariant characteristics.

10
reported, we find that relaxing term limits reduces turnout by about 4.6 percentage points. In column (2) we
add among controls council size and find qualitatively the same results. In columns (3) and (4) we add our
control variables at municipal and political competition level respectively. The effect of our diff-in-
discontinuity estimate is always negative, statistically significant at 5 percent level and stable across
specifications.
In particular, our results highlight how the introduction of the mayor term limit extension negatively affects
voter participation at the polls by about 5 percentage points in cities below the cutoff (those with a population
size lower than 3,000 inhabitants) compared to municipalities in the control group (cities with a population
above 3,000 cutoff).
Table 4: Diff-in-disc estimates on Electoral Participation (LLR) (1) (2) (3) (4) VARIABLES Term Limit Extension -0.0460** -0.0462** -0.0473** -0.0488** (0.0219) (0.0220) (0.0219) (0.0221) After -0.0668*** -0.0730*** -0.0685*** -0.0517*** (0.0198) (0.0208) (0.0207) (0.0155) Less than 3000 inhabitants 0.0529** 0.0855*** 0.0755** 0.0762** (0.0230) (0.0313) (0.0303) (0.0312) Council Size 0.0159 0.0121 0.0121 (0.0114) (0.0110) (0.0111) Education Population 0.0120 0.0110 (0.0097) (0.0099) Employment 0.0050 0.0125 (0.2676) (0.2685) Municipal Area 0.0002 0.0002 (0.0002) (0.0002) % Elderly People -0.4486** -0.4645** (0.1808) (0.1835) # Candidates 0.0093** (0.0039) Electoral Margin (t-1) -0.0330 (0.0212) Constant 0.6837*** 0.4986*** 0.5202*** 0.5094*** (0.0169) (0.1326) (0.1866) (0.1933) Province and year dummies Yes Yes Yes Yes Interaction Term First First First First Population Polynomial First First First First Bandwidth CTT CTT CTT CTT Observations 603 603 603 589 R-squared 0.443 0.445 0.473 0.478
Notes: The dependent variable is the electoral turnout (number of total ballots on the number of electors). In all the regressions we control for electoral period and province dummies (not reported). Pre-treatment period is 2011-2013. Standard errors (corrected for heteroskedasticity and clusterized at the municipality level) are reported in parentheses. The symbols ***, **, * indicate that coefficients are statistically significant, respectively, at the 1, 5, and 10 percent level.
Our estimation results are also consistent with the descriptive graph presented in Figure 2, where we plot
the estimated difference between post-treatment (2014-2017) electoral participation and pre-treatment (2011-
2013) values against population size close to the 3,000 threshold. This graph allow us to check whether the

11
difference in the outcome variable shows a discontinuity in the neighborhood of the 3,000 cutoff. As we can
notice, the difference in voter turnout sharply changes at 3,000.
Figure 2: LLR estimates
As far as our control variables are concerned, we find the expected correlations (see column 3). Voter
turnout increases with the educational attainment of the population, employment rate and municipal area (even
if the coefficients attached to these control variables are not statistically significant at conventional levels),
while it decreases with the proportion of elderly people. Furthermore, council size does not have any
statistically significant impact on our outcome variable. Finally, the number of candidates running for a mayor
position is positively correlated with turnout.
The negative effect of term limit extension on voter turnout can be explained through two main different
channels. First, term limit relaxation might decrease electoral participation by making electoral races less
competitive, since incumbents can re-run for elections discouraging new candidates to run (incumbents have
some advantages over their challengers, i.e. greater name recognition and familiarity to voters, influence over
redistricting to maintain friendly constituency groups, various organizational and informational advantages
that come from having already run and won in the constituency). Second, relaxing term limit might negatively
affect voters’ mobilization because incumbents, having spent more time in office, can use their power to get
bribes, or to waste public funds by means of red-tape procedures, and in turn it may inspire less citizen trust
into political life.
In the following table we investigate the first channel. Given the staggered scheduling of local electoral
races, not all Italian municipalities with a population below 3,000 inhabitants were affected by the reform in
the same way. The law extending the term limit from two to three consecutive mandates has implied an
immediate main change especially for those municipalities where the incumbent mayor has already been in
charge for two mandates. In addition, it is likely that electors have perceived the change more intensively when
the exiting mayor has decided to run for being re-elected. Then, to investigate whether the term limit extension
has produced differentiated effects on treated municipalities according to the presence among candidates of
the incumbent mayor, we have built an interaction term between the dummy variable Incumbent (taking the
-0.1
15-0
.106
-0.0
97-0
.088
-0.0
79D
iffer
ence
Ele
ctor
al P
artic
ipat
ion
3,000 4,000 5,0002,0001,000Population Size

12
value of one when among candidates running for election there is the exiting mayor and zero otherwise) and
Term Limit Extension.
In column (1) of Table 5 we replicate specification (2) of Table 4 adding among regressors the variables
Incumbent and Incumbent*Term Limit Extension. We find that in the absence of the incumbent among
candidates the term limit extension produces a negative but not statistically significant (at conventional levels)
effect. Instead, in municipalities where the incumbent is running for election the effect is negative and
statistically significant (0.0354+0.0209, p-value: 0.012). In column (2) we also consider the presence among
candidates of a mayor who has already been in office for two consecutive mandates by including among
regressors the dummy variable Incumbent_Second_Term, which takes the value of one when among candidates
there is the exiting mayor who has already served for two mandates and zero otherwise9. It should be noticed
that the variable Incumbent_Second_Term always takes the value of zero for municipalities with more than
3,000 inhabitants and for elections held before 2014. Again we find a negative effect of the extended term limit
that is larger when an incumbent is among candidates (-5.02 percentage points, p-value: 0.021) and even larger
when the incumbent has already served for two consecutive mandates (-7.22 percentage points, p-value:
0.005).
In column (3) to better stress these effects we take a different strategy and exclude from the sample of
treated municipalities those in which there is no incumbent among candidates. We find that in treated
municipalities, where the incumbent is running for election, relaxing the term limit has produced a reduction
in turnout by about 4 percentage points compared to control municipalities. A much larger effect is found when
we only consider as treated municipalities those in which among candidates there is the exiting mayor who has
already served for two consecutive mandates (column 4). In these municipalities the term limit extension has
reduced turnout by 9 percentage points roughly.
Table 5: Diff-in-disc estimates on Electoral Participation (LLR) (1) (2) (3) (4) VARIABLES Term Limit Extension -0.0354 -0.0360 -0.0429* -0.0942* (0.0234) (0.0234) (0.0258) (0.0500) Incumbent 0.0150** 0.0150* 0.0097 0.0089 (0.0078) (0.0078) (0.0088) (0.0091) Incumbent* Term Limit -0.0209* -0.0159 Extension (0.0119) (0.0123) Incumbent Second Term -0.0203 (0.0147) Constant 0.5048*** 0.5033** 0.5958*** 0.5664* (0.1947) (0.1960) (0.2248) (0.3156) Province and year dummies Yes Yes Yes Yes Full set of Controls Yes Yes Yes Yes Interaction Term Yes Yes Yes Yes Polynomial Population First First First First Bandwidth CTT CTT CTT CTT
9 This variable always take the value of zero for the pre-treatment period.
13
Observations 589 589 470 311 R-squared 0.479 0.482 0.491 0.513
Notes: The dependent variable is the electoral turnout (number of total ballots on the number of electors). In all the regressions we control for electoral period and province dummies (not reported). Pre-treatment period is 2011-2013. Standard errors (corrected for heteroskedasticity and clusterized at the municipality level) are reported in parentheses. The symbols ***, **, * indicate that coefficients are statistically significant, respectively, at the 1, 5, and 10 percent level.
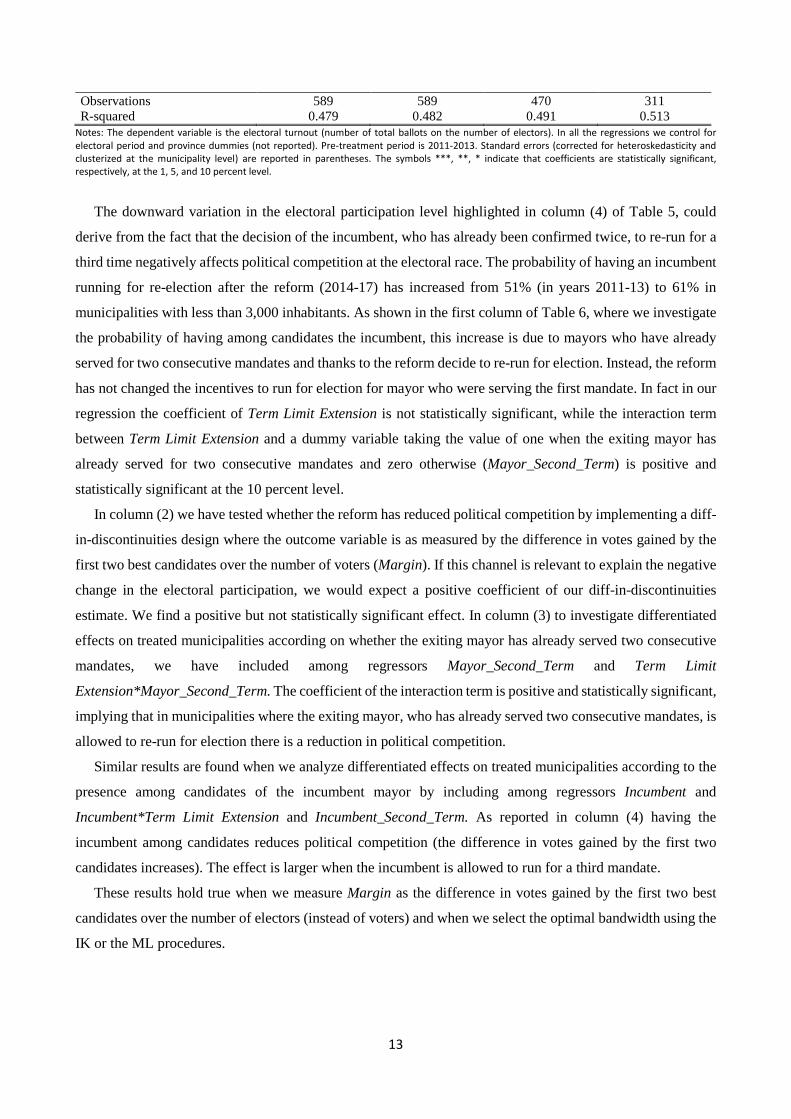
The downward variation in the electoral participation level highlighted in column (4) of Table 5, could
derive from the fact that the decision of the incumbent, who has already been confirmed twice, to re-run for a
third time negatively affects political competition at the electoral race. The probability of having an incumbent
running for re-election after the reform (2014-17) has increased from 51% (in years 2011-13) to 61% in
municipalities with less than 3,000 inhabitants. As shown in the first column of Table 6, where we investigate
the probability of having among candidates the incumbent, this increase is due to mayors who have already
served for two consecutive mandates and thanks to the reform decide to re-run for election. Instead, the reform
has not changed the incentives to run for election for mayor who were serving the first mandate. In fact in our
regression the coefficient of Term Limit Extension is not statistically significant, while the interaction term
between Term Limit Extension and a dummy variable taking the value of one when the exiting mayor has
already served for two consecutive mandates and zero otherwise (Mayor_Second_Term) is positive and
statistically significant at the 10 percent level.
In column (2) we have tested whether the reform has reduced political competition by implementing a diff-
in-discontinuities design where the outcome variable is as measured by the difference in votes gained by the
first two best candidates over the number of voters (Margin). If this channel is relevant to explain the negative
change in the electoral participation, we would expect a positive coefficient of our diff-in-discontinuities
estimate. We find a positive but not statistically significant effect. In column (3) to investigate differentiated
effects on treated municipalities according on whether the exiting mayor has already served two consecutive
mandates, we have included among regressors Mayor_Second_Term and Term Limit
Extension*Mayor_Second_Term. The coefficient of the interaction term is positive and statistically significant,
implying that in municipalities where the exiting mayor, who has already served two consecutive mandates, is
allowed to re-run for election there is a reduction in political competition.
Similar results are found when we analyze differentiated effects on treated municipalities according to the
presence among candidates of the incumbent mayor by including among regressors Incumbent and
Incumbent*Term Limit Extension and Incumbent_Second_Term. As reported in column (4) having the
incumbent among candidates reduces political competition (the difference in votes gained by the first two
candidates increases). The effect is larger when the incumbent is allowed to run for a third mandate.
These results hold true when we measure Margin as the difference in votes gained by the first two best
candidates over the number of electors (instead of voters) and when we select the optimal bandwidth using the
IK or the ML procedures.

14
Table 6: Diff-in-disc estimates on the probability of having the Incumbent among candidates and on Political Competition (Margin) (LLR) (1) (2) (3) (4) VARIABLES Incumbent Margin Margin Margin Term Limit Extension -0.1129 0.0285 0.0041 0.0279 (0.1458) (0.0356) (0.0356) (0.0393) Mayor Second Term -0.5267*** -0.0399*** (0.0475) (0.0116) Mayor Second Term* 0.1475* 0.0572*** Term Limit Extension (0.0911) (0.0215) Incumbent 0.0245** (0.0118) Incumbent* Term Limit -0.0064 Extension (0.0229) Incumbent Second Term 0.0394* (0.0236) Constant -0.4262 0.2584 0.2471 0.2714 (1.008) (0.2380) (0.2371) (0.3156) Province and year dummies Yes Yes Yes Yes Full set of Controls Yes Yes Yes Yes Interaction Term Yes Yes Yes Yes Polynomial Population First First First First Bandwidth CTT CTT CTT CTT Observations 589 566 566 566 R-squared 0.208 0.084 0.103 0.098
Notes: In all the regressions we control for electoral period and province dummies (not reported). Pre-treatment period is 2011-2013. Standard errors (corrected for heteroskedasticity and clusterized at the municipality level) are reported in parentheses. The symbols ***, **, * indicate that coefficients are statistically significant, respectively, at the 1, 5, and 10 percent level.
5. The impact of term limit extension on politicians’ quality In this Section we investigate whether term limit extension leads to an increase in the institutional quality,
allowing high skilled representatives to remain in office.
As it is common in the literature, we consider politicians’ education as a proxy for their quality (De Paola
and Scoppa, 2010; Baltrunaite et al., 2014; Galasso and Nannicini, 2011). Hence, we measure the quality of
candidates at the electoral race as the average number of years of education of candidates running for the mayor
position in municipality i at time t. We use this measure of quality as dependent variable in our diff-in-
discontinuities models.
As shown in column 1 of Table 7, we find a negative but not statistically significant effect of term limit
extension on politicians’ quality. In column (2) we investigate whether in response to term limit extension high
quality incumbents tend to re-run for election. At this aim we consider as outcome variable the number of years
of education of the incumbent running for re-election. We find that relaxing term limit does not produce any
increase in the quality of incumbents who decide to re-run for election: the effect is instead negative, but not
statistically significant at conventional levels. In column (3) we add among control variables the dummy
variable Incumbent_Second_Term, which takes the value of one when among candidates there is the exiting
mayor who has already served for two consecutive mandates and zero otherwise. We find that the quality of
mayors running for the third time is on average worst compared to the educational attainment of other
incumbents: the variable Incumbent_Second_Term attracts a negative coefficient that is statistically significant
at the 10 percent level. In column (5) we investigate the effects produced by term limit extension on the quality

15
of new entrants and we do not find any statistically significant effect. Finally, in column (6) we consider as
dependent variable the number of years of education of the elected mayor. Again, we find no effect.
Table 7: Diff-in-disc estimates on Electoral Participation (LLR). Candidates’ Characteristics (1) (2) (3) (4) (5) Educ.
Candidates Educ.
Incumbent Educ.
Incumbent Educ.
Entrants Educ. Mayor
VARIABLES Term Limit -0.4658 -1.6351 -1.3537 0.9096 -0.8892 Extension (0.7705) (1.4518) (1.4471) (1.5972) (1.0823) Incumbent Second Term -1.5708** (0.7771) Province and Year Dummies Yes Yes Yes Yes Yes Full set of controls Yes Yes Yes Yes Yes Interaction Term First First First First First Population Polynomial First First First First First Bandwidth CTT CTT CTT CTT CTT Observations 576 315 315 252 543 R-squared 0.099 0.031 0.047 0.124 0.062
Notes: The dependent variable is the electoral turnout (number of total ballots on the number of electors). In all the regressions we control for electoral period and province dummies (not reported). Pre-treatment period is 2011-2013. Standard errors (corrected for heteroskedasticity and clusterized at the municipality level) are reported in parentheses. The symbols ***, **, * indicate that coefficients are statistically significant, respectively, at the 1, 5, and 10 percent level.
These results hold true also when we select the optimal bandwidth using the procedure proposed by Imbens
and Kalyanaraman (2014) (IK hereafter) and when we use the cross-validation algorithm as proposed by
Ludwig and Miller (2007) (CV hereafter).
We have also analyzed whether relaxed term limits produce any impact on other candidates’ characteristics.
More precisely, we have looked at gender and age. We do not find any effect on the average age of candidates
(neither entrants nor incumbents). Instead, we find that extended term limits reduce the probability of having
female candidates running for election (significant at 10 percent level). However, this result only holds when
choosing the optimal bandwidth using the CCT procedure (results not reported and available upon request).
All in all results presented in this section show that relaxing term limits does not contribute at increasing
institutional quality.
6. Robustness Checks As a first robustness check, we estimate specifications reported in Table 4 choosing as optimal bandwidth that
proposed by IK. This alternative method leads to an optimal bandwidth of 2,480 inhabitants above and below
the threshold of 3,000. Results using the same specifications of Table 4 are reported in Table 8. The impact of
relaxed term limits is always negative and statistically significant at the 5 percent level, even if the magnitude
is smaller (about 2 percentage points).
Results consistent with those reported in Table 5 are also found when we investigate the impact of the term
limit extension in municipalities in which the incumbent mayor runs for re-election. We find that the extended
term limit has reduced turnout by about 7 percentage points when we only consider as treated municipalities

16
those in which the exiting mayor who has already been in office for two consecutive mandates runs for re-
election (results are reported in Table A2 of the Appendix)10. Table 8: Diff-in-disc estimates on Electoral Participation (LLR)
(1) (2) (3) (4) VARIABLES Term Limit Extension -0.0228** -0.0218** -0.0235** -0.0235** (0.0109) (0.0110) (0.0111) (0.0111) Province and year dummies Yes Yes Yes Yes Council Size No Yes Yes Yes Municipal Characteristics No No Yes No Election Characteristics No No No Yes Interaction Term First First First First Population Polynomial First First First First Bandwidth IK IK IK IK Observations 2,720 2,720 2,577 2,577 R-squared 0.317 0.317 0.367 0.367
Notes: The dependent variable is the electoral turnout (number of total ballots on the number of electors). In all the regressions we control for electoral period and province dummies (not reported). Pre-treatment period is 2011-2013. Standard errors (corrected for heteroskedasticity and clusterized at the municipality level) are reported in parentheses. The symbols ***, **, * indicate that coefficients are statistically significant, respectively, at the 1, 5, and 10 percent level.
Since our dependent variable, i.e. electoral participation, is a proportion and in turn lies between zero and
one, OLS may not be the most accurate method to estimate our model. For this reason, as an additional
robustness check, we implement our empirical design by using two different methods accommodating the
outcome variable to be greater than zero and lower than one: the fractional probit model and the beta regression
estimator (Ferrari and Cribari-Neto, 2004). Results are reported in Table 9. We use alternatively the CCT
(columns 1 and 4), the IK (columns 2 and 5) and CV optimal bandwidths (columns 3 and 6). Findings are very
similar in terms of sign and magnitude to those presented in the previous section.11 Electoral participation
decreases by 2 to 5 percentage points (according to the specification) in treated municipalities compared to
municipalities in the control group, exclusively due to the introduction of the policy reform in 2014.
Table 9: Diff-in-disc Estimates: Fractional Probit and Beta Regression Results
(1) (2) (3) (4) (5) (6) Fractional
Probit Fractional
Probit Fractional
Probit Beta
Regression Beta
Regression Beta
Regression VARIABLES Term Limit Extension
-0.0511** -0.0233* -0.0288** -0.0507** -0.0241* -0.0298**
(0.0227) (0.0129) (0.0139) (0.0206) (0.0132) (0.0138) Province and year dummies
Yes Yes Yes Yes Yes Yes
Full set of Controls Yes Yes Yes Yes Yes Yes InteractionTerm First First First First First First PopulationPolynomial
First First First First First First
Bandwidth CTT IK CV CTT IK CV Log-likelihood -352.36 -1,565.87 -1,132.92 824.10 3,062.92 2,365.48
10 The same results hold true when we choose the cross-validation algorithm (CV). In this case we end up with an optimal bandwidth of 1,915 inhabitants above and below the cutoff. 11 Since the estimated coefficients of fractional probit and beta regression models are not easy to interpret, we directly report marginal effects.

17
Observations 582 2,577 1,868 582 2,577 1,868 Notes: The dependent variable is the electoral turnout (number of total ballots on the number of electors). In all the regressions we control for electoral period and province dummies (not reported). Pre-treatment period is 2011-2013. The symbols ***, **, * indicate that coefficients are statistically significant, respectively, at the 1, 5, and 10 percent level.
As another robustness check, in Table 10 we carry out a falsification exercise in the spirit of Lee (2008).
We firstly use a fake threshold where no policy is expected to sharply change, in order to evaluate the
possibility that our results depend on random chance rather than causal relationship. In particular, we choose
a fake population threshold of 1,500 inhabitants (results are still the same when we use different fake
population cutoffs) and we replicate diff-in-disc estimations presented in the previous section with
alternatively the CCT and the IK optimal bandwidths (municipalities with a population size between 954 and
2,046 and between 482 and 2,518 respectively), a linear polynomial of the forcing variable along with a first
order interaction term. Results are presented in columns (1) and (2) of Table 10. We can notice that the diff-
in-disc estimate is positive but far from being statistically significant.
In columns (3) and (4) (using respectively the CCT and the IK bandwidth) instead of considering a fake
population threshold we exploit the introduction of the policy used in our design in different years as an
experiment to test for the absence of any differential response around the population threshold of 3,000
inhabitants. In particular, we choose year 2008 (with 2006-2007 as pre-treatment period) because no policy
has been introduced in Italy that year at the local level, and as a consequence we should observe no effect of
our diff-in-disc estimates on the electoral participation. We do not find any statistically significant impact of
the main variable of interest on the outcome variable.
Furthermore, a potential concern of our empirical design is that there is another institutional feature
(introduced in 2014 by Law April n. 56) that sharply changes in proximity of the 3,000 threshold, i.e. council
size. Hence, the effect found in the previous section might be confounded by the presence of this further policy.
In order to check whether the negative and statistically significant diff-in-discontinuities estimates are due to
the introduction of a mayor term limit extension or to a change in the council size, we use 2011 (with 2008-
2010 as pre-treatment period) and 2012 (with 2009-2011 as pre-treatment period) as fake years, since in these
years the Italian law established a reduction in the number of councilors, passing from 12 to 9 for cities with a
population below 3,000 and from 16 to 12 for cities with a population between 3,001 and 10,000 in 2011, and
passing from 9 to 6 for cities with a population below 3,000 and from 12 to 7 for cities with a population
between 3,001 and 10,000 in 2012. In other words, in 2011 and 2012 the only institutional feature sharply
changing around the 3,000 cutoff is the council size12. If council size affects electoral participation, we would
expect a statistically significant effect of diff-in-disc estimates on voter turnout. By implementing the same
methodology as before, results displayed in column (5) and (6) of Table 9 confirm our expectation: the diff-
in-discontinuities estimate is not statistically significant at conventional levels, and in turn the negative effect
12As explained before, mayors’ wage also changes in proximity of the same cutoff, but this policy was introduced in the 1960s.
18
produced by the policy reform in 2014 is likely to be exclusively related to the introduction of a third term for
mayors in cities with a population size lower than 3,000 inhabitants13.
Table 10: Diff-in-disc estimates on Electoral Participation (LLR). Fake population threshold and fake reform year (1) (2) (3) (4) (5) (6) (7) (8) 1,500
threshold 1,500
threshold 2008 fake
year 2008 fake
year 2011 year 2011 year 2012 year 2012 year
VARIABLES Term Limit 0.0164 0.0043 0.0084 0.0050 0.0015 -0.0123 -0.0263 -0.0055 Extension (0.0194) (0.0144) (0.0222) (0.0105) (0.0267) (0.0115) (0.0260) (0.0113) Province and Year Dummies
Yes Yes Yes Yes Yes Yes Yes Yes
Full set of controls
Yes Yes Yes Yes Yes Yes Yes Yes
Interaction Term First First First First First First First First Population Polynomial
First First First First First First First First
Bandwidth CTT IK CTT IK CTT IK CTT IK Observations 814 1,560 1,560 6,759 1,296 5,659 1,253 5,432 R-squared 0.404 0.509 0.509 0.439 0.551 0.466 0.555 0.465
Notes: The dependent variable is the electoral turnout (number of total ballots on the number of electors). In all the regressions we control for electoral period and province dummies (not reported). Standard errors (corrected for heteroskedasticity and clusterized at the municipality level) are reported in parentheses. The symbols ***, **, * indicate that coefficients are statistically significant, respectively, at the 1, 5, and 10 percent level.
7. Concluding Remarks The debate about pros and cons in using legislative term limits is still open both among academics and policy
makers. On the one hand, term limits seem to be beneficial to democracies because they might encourage more
people to come out to vote allowing more freshman candidates to run for legislative positions presenting new
ideas, and limit the potential of corruption and lobbying by forcing incumbents in power to leave their office.
On the other hand, term limits could be detrimental for societies that decide to adopt them because good leaders
are forced to leave the political arena even if they deserve to stay in office, they discourage professional
networking benefits and create rogue politicians.
Only a few papers have focused on voters’ behavior at the polls during elections characterized by binding
and/or slack legislative term limits, finding however mixed results. In this paper we provide new evidence on
the effect of term limits exploiting an exogenous source of variation introduced by an Italian law allowing
mayors in small municipalities (below 3,000 cutoff) to re-run for a third time after being confirmed for two
consecutive terms after 2014. This change in the institutional setting has permitted us to combine a before/after
with the discontinuous policy variation, implementing a difference-in-discontinuities design.
Findings highlight how extending mayor term limit at the local level in Italy decreases voter turnout in
cities affected by the reform by about 5 percentage points compared to municipalities in the control group.
Voters negatively reacted to the introduction of the reform due to a decrease in the political competition at the
electoral races, given that incumbent politicians can re-run for a third time at local elections. In other words,
13 Results displayed in Table 9 are replicated in Table A3 of the Appendix, in which the CV algorithm proposed by Ludwig and Muller (2007) is used.

19
the reform did not give any fighting chance to opposition candidates, hence deteriorating both competition
among candidates as well as instrumental value attached to voting process.
We also show the impact of relaxing term limits on the quality of candidates running for a mayor position,
finding no significant effect. The same results hold true when we look separately at the average educational
attainment of incumbents and new entrants. The effect of the term limit extension is negative and significant
only for those incumbents who decide to re-run for the third time. Therefore, our findings highlight the
inefficacy of the Italian law that was meant to attract high skilled politicians at the electoral races in small
municipalities, usually characterized by high levels of financial constraints.
References Baltrunaite, A, Bello, P, Casarico, A, and Profeta, P. 2014. Gender quotas and the quality of politicians. Journal
of Public Economics 118, 62–74. Calonico, S., Cattaneo, MD., Titiunik, R., 2014. Robust nonparametric confidence intervals for regression-
discontinuity designs. Econometrica 82 (6): 2295–2326. Campante, F., Chor, D., and Do, Q. 2009. Instability and the incentives for corruption. Economics & Politics,
21, 42-92. Coviello, D., Gagliarducci, S. 2017. Tenure in office and public procurement. American Economic Journal:
Economic Policy 9, 59-105. Cox, G.W., Munger, M.C. 1989. Closeness, expenditures and turnout in the 1982 US house elections.
American Political Science Review 83 (1), 217-230. De Benedetto, M.A., De Paola, M. 2016. The impact of incumbency on turnout. Evidence from Italian
municipalities. Electoral Studies 44, 98-108. De Benedetto, M.A., De Paola, M. 2017. Candidates’ education and turnout: evidence from Italian municipal
elections. German Economic Review 18, 22-50. De Paola, M., and Scoppa, V. 2010. Political competition and politician quality: Evidence from Italian
municipalities. Public Choice, 148 (3-4), 547-559. De Paola, M., Scoppa, V. 2013. The causal impact of closeness on electoral participation exploiting the Italian
dual ballot system. Public Choice 160 (3-4), 467-479. De Paola, M., Scoppa, V., De Benedetto, M.A. 2014. The impact of gender quotas on electoral participation:
evidence from Italian municipalities. European Journal of Political Economy 35, 141-157. Denver, D.T., Hands, G.H.T. 1974. Marginality and turnout in British general elections. British Journal of
Political Science 4, 17-35. Downs, A. 1957. An economic theory of democracy. New York: Harper and Row. Ferrari, S.L.P., Cribari-Neto, F., 2004. Beta regression for modeling rates and proportions. Journal of Applied
Statistics 31, 799–815. Fiorina, M., P. 1976. The voting decision: instrumental and expressive aspects. Journal of Politics 38, pp. 390–
413. Funk, P. 2010. Social incentives and voter turnout: evidence from the Swiss mail ballot system. Journal of the
European Economic Association, 8(5), 1077-1103. Galasso, V., Nannicini, T. 2011. Competing on good politicians. American Political Science Review, 105 (1),
79–99. Gamboa-Cavazos, M., Garza-Cantu, V., and Salinas, C.E. 2007. The organization of corruption: political
horizons and special interests. Mimeo. Grembi, V., Nannicini, T., Troiano, U. 2016. Do fiscal rules matter? American Economic Journal: Applied
Economics 8, 1-30. Hajnal, Z., Lewis, P., 2003. Municipal institutions and voter turnout in local elections. Urban Affairs Review
38 (5), 645–668. Imbens, G., Kalyanaraman, K., 2012. Optimal bandwidth choice for the regression discontinuity estimator.
Review of Economic Studies 79 (3), 933-959.

20
Kousser, T., Mullin, M. 2007. Does voting by mail increase participation? Using matching to analyze a natural experiment. Political Analysis 15, 428-445.
Lee, D.S. 2008. Randomized experiments from non-random selection in U.S. House elections. Journal of Econometrics, 142(2), 675-697.
Ludwig, J., Miller, D.L. 2007. Does head start improve children’s life chances? Evidence from a regression discontinuity design. Quarterly Journal of Economics 122 (1), 159-208
McCrary, J., 2008. Manipulation of the running variable in the regression discontinuity design: a density test. Journal of Econometrics 142, 698–714.
McDermott, M.L. 2005. Candidate occupations and voter information shortcuts. The Journal of Politics 67 (1), 201-219.
Mooney, C. Z. 2009. Term limits as a boon to legislative scholarship: A review. State Politics and Policy Quarterly, 9 (2), 204-228.
Nalder, K., 2007. The effect of state legislative term limits on voter turnout. State Politics and Policy Quarterly 7 (2), 187–220.
Nickerson, D. 2007. Does email boost turnout?. Quarterly Journal of Political Science 2, 369–379. Sigelman, C.K., Sigelman, L., Walkosz, B.J., Nitz, M. 1995. Black candidates, white voters: understanding
racial bias in political perceptions. American Journal of Political Science 39 (1), 243-265. Veiga, F.J., Veiga, L.G. 2018. Term limits and voter turnout. Electoral Studies 53, 20-28.

21
Appendix Figure A1: McCrary test- Manipulation of Population Size (2001 Census)
Figure A2: McCrary test- Manipulation of Population Size (Difference between 2001-2011 Census)
Table A1: Balance Test on Time-invariant Characteristics
VARIABLES Time-invariant characteristics
LLR Optimal Bandwidth
(CCT)
Obs.
Municipal Area (in Km2) 3.1303
(6.6221) 602
Center-South 0.0647 (0.1156)
602
Note: Municipalities between 2,326 and 3,674 inhabitants. Baseline Diff-in-discontinuities estimates. We control for year dummies and we focus on the period 2011-2017. Estimation method: LLR with a first order polynomial of the forcing variable and a linear interaction term. Standard Errors are robust to heteroscedasticity and are cluster at municipal level (reported inside the brackets). Significance at the 10% level is represented by *, at the 5% level by **, and at 1% level by ***.
0.0
001
.000
2.0
003
.000
4
0 5000 10000
0.00
0000
.000
010.
0000
20.0
0002
0.00
003
Diff
eren
ce in
Den
sity
201
1-20
01
1000 2000 3000 4000 5000Population Size

22
Table A2: Diff-in-disc estimates on Electoral Participation (LLR) (1) (2) (3) (4) VARIABLES
Term Limit Extension -0.0168 -0.0155 -0.0260* -0.0745*** (0.0118) (0.0118) (0.0137) (0.0274) Incumbent 0.0116*** 0.0096** 0.0080* 0.0051
(0.0041) (0.0041) (0.0045) (0.0045) Incumbent* Term Limit Extension
-0.0128** (0.0063)
-0.0073 (0.0067)
Incument Second Term 0.0265 (0.0107) Incumbent Second Term* Term -0.0397*** Limit Extension (0.0130) Province and year dummies Yes Yes Yes Yes Full set of Controls Yes Yes Yes Yes Interaction Term Yes Yes Yes Yes Polynomial Population First First First First Bandwidth IK IK IK IK Observations 2,577 2,577 1,831 994 R-squared 0.369 0.371 0.390 0.449
Notes: The dependent variable is the electoral turnout (number of total ballots on the number of electors). In all the regressions we control for electoral period and province dummies (not reported). Pre-treatment period is 2011-2013. Standard errors (corrected for heteroskedasticity and clusterized at the municipality level) are reported in parentheses. The symbols ***, **, * indicate that coefficients are statistically significant, respectively, at the 1, 5, and 10 percent level.
Table A3: Diff-in-disc estimates on Electoral Participation (LLR) (1) (3) (5) (7) 1,500
threshold 2008 fake
year 2011 year 2012 year
VARIABLES Term Limit -0.0111 0.0043 -0.0179 -0.0086 Extension (0.0147) (0.0118) (0.0150) (0.0085) Province and Year Dummies Yes Yes Yes Yes Full set of controls Yes Yes Yes Yes Interaction Term First First First First Population Polynomial First First First First Bandwidth CV CV CV CV Observations 1,532 4,979 4,177 4,009 R-squared 0.405 0.459 0.489 0.489
Notes: The dependent variable is the electoral turnout (number of total ballots on the number of electors). In all the regressions we control for electoral period and province dummies (not reported). Standard errors (corrected for heteroskedasticity and clusterized at the municipality level) are reported in parentheses. The symbols ***, **, * indicate that coefficients are statistically significant, respectively, at the 1, 5, and 10 percent level.


![COMPARATIVE COLD-ROLLING TESTS OF OPEN- HEARTH …] TestsofO.H.SteelandElectrolytic-IronStrip 303 therefore, not sufficientlysensitive tobringout any differencein the two types of](https://static.fdocuments.us/doc/165x107/5ea97ced079f78130026e878/comparative-cold-rolling-tests-of-open-hearth-testsofohsteelandelectrolytic-ironstrip.jpg)