Dissimilar trend of nonlinearity in ultrasound transducers ...
24
Accepted Manuscript Dissimilar trend of nonlinearity in ultrasound transducers and systems at reso- nance and non-resonance frequencies Negareh Ghasemi, Firuz Zare, Pooya Davari, Mahinda Vilathgamuwa, Arindam Ghosh, Christian Langton, Peter Weber PII: S0041-624X(16)30203-7 DOI: http://dx.doi.org/10.1016/j.ultras.2016.09.023 Reference: ULTRAS 5387 To appear in: Ultrasonics Received Date: 26 February 2015 Revised Date: 12 August 2016 Accepted Date: 30 September 2016 Please cite this article as: N. Ghasemi, F. Zare, P. Davari, M. Vilathgamuwa, A. Ghosh, C. Langton, P. Weber, Dissimilar trend of nonlinearity in ultrasound transducers and systems at resonance and non-resonance frequencies, Ultrasonics (2016), doi: http://dx.doi.org/10.1016/j.ultras.2016.09.023 This is a PDF file of an unedited manuscript that has been accepted for publication. As a service to our customers we are providing this early version of the manuscript. The manuscript will undergo copyediting, typesetting, and review of the resulting proof before it is published in its final form. Please note that during the production process errors may be discovered which could affect the content, and all legal disclaimers that apply to the journal pertain.
Transcript of Dissimilar trend of nonlinearity in ultrasound transducers ...

Accepted Manuscript
Dissimilar trend of nonlinearity in ultrasound transducers and systems at reso-
nance and non-resonance frequencies
Negareh Ghasemi, Firuz Zare, Pooya Davari, Mahinda Vilathgamuwa, Arindam
Ghosh, Christian Langton, Peter Weber
PII: S0041-624X(16)30203-7
DOI: http://dx.doi.org/10.1016/j.ultras.2016.09.023
Reference: ULTRAS 5387
To appear in: Ultrasonics
Received Date: 26 February 2015
Revised Date: 12 August 2016
Accepted Date: 30 September 2016
Please cite this article as: N. Ghasemi, F. Zare, P. Davari, M. Vilathgamuwa, A. Ghosh, C. Langton, P. Weber,
Dissimilar trend of nonlinearity in ultrasound transducers and systems at resonance and non-resonance frequencies,
Ultrasonics (2016), doi: http://dx.doi.org/10.1016/j.ultras.2016.09.023
This is a PDF file of an unedited manuscript that has been accepted for publication. As a service to our customers
we are providing this early version of the manuscript. The manuscript will undergo copyediting, typesetting, and
review of the resulting proof before it is published in its final form. Please note that during the production process
errors may be discovered which could affect the content, and all legal disclaimers that apply to the journal pertain.

1
Negareh Ghasemi1,*
, Firuz Zare2, Pooya Davari
3, Mahinda Vilathgamuwa
1, Arindam Ghosh
4, Christian Langton
5,
Peter Weber6
1Science and Engineering Faculty, Queensland University of Technology, Brisbane, Australia 2Faculty of Engineering, Architecture and Information Technology, University of Queensland, Brisbane, Australia
3Faculty of Engineering and Science, Aalborg University, Aalborg, Denmark 4Department of Electrical and Computer Engineering, Curtin University, Perth, Australia
5Faculty of Science and Engineering, Queensland University of Technology, Brisbane, Australia 6Ultrasound-System-Development, Fraunhofer Institute for Biomedical Engineering, St. Ingbert, Germany
* Corresponding Author: Negareh Ghasemi, Science and Engineering Faculty, Queensland University of Technology,
George St, GPO Box 2434, Brisbane QLD 4001, Australia, Email: [email protected], Tel:+61-7-31384234
Abstract— Several factors can affect performance of an ultrasound system such as quality of
excitation signal and ultrasound transducer behaviour. Nonlinearity of piezoelectric ultrasound
transducers is a key determinant in designing a proper driving power supply. Although, the
nonlinearity of piezoelectric transducer impedance has been discussed in different literatures, the
trend of the nonlinearity at different frequencies with respect to excitation voltage variations has
not been clearly investigated in practice. . In this paper, to demonstrate how the nonlinearity
behaves, a sandwich piezoceramic transducer was excited at different frequencies. Different
excitation signals were generated using a linear power amplifier and a multilevel converter
within a range of 30 V- 200V. Empirical relation was developed to express the resistance of the
piezoelectric transducer as a nonlinear function of both excitation voltage and resonance
frequency. The impedance measurements revealed that at higher voltage ranges, the piezoelectric
transducer can be easily saturated. Also, it was shown that for the developed ultrasound system
composed of two transducers (one transmitter and one receiver), the output voltage measured
across receiver is a function of a voltage across the resistor in the RLC branches and is related to
the resonance frequencies of the ultrasound transducer.
Index Terms High power ultrasound transducer, nonlinear behaviour, ultrasound system excitation,
power electronic converters
Dissimilar trend of nonlinearity in ultrasound transducers and systems at
resonance and non-resonance frequencies

2
1. INTRODUCTION
High power converters utilized in ultrasound systems play a significant role in different
applications where an energy conversion at different ranges of voltage and frequency is required.
In such a system, a high power ultrasound transducer converts electrical energy to mechanical
energy (ultrasound wave) and vice versa [1-7]and the transducers can be employed as
transmitters, receivers or both. As shown in Fig. 1, as a transmitter, the ultrasound transducer
converts an electrical energy (vinput) to a mechanical energy (ultrasound waves) and as a receiver
it converts a mechanical energy back to an electrical energy (voutput) [2].
Fig. 1. Block diagram of the ultrasound system
To achieve a high power energy conversion, a transmitter should be excited by a high power
signal tuned at a specific frequency. Power electronic converters are key technology to converter
different power types – DC or AC DC or AC – and generate a desirable voltage and/or
frequency suitable for many applications including the ultrasound system. The associated control
system generates a desired reference signal through an output feedback for which the accuracy of
such a control system highly depends on the load behaviour. The nonlinearity of the load can
affect the accuracy of the system and hence a proper control system needs to be developed based
on the load and system characteristics [8]. A high power ultrasound system as a load for a power

3
electronics converter can deteriorate the performance of the system and increase the power
consumption if its nonlinear behaviour is not well understood. Thus, to attain a better control, the
behaviour of the ultrasound system should be studied.
The system characteristic can be affected by the characteristic of the ultrasound transducer. The
intensity of the generated ultrasound wave is highly related to the mechanical deformation of a
material within the transducer which depends on the applied electrical energy across the
ultrasound transducer. In this case, to have a better performance, an appropriate excitation signal
with high quality (low distortion) is required [2, 3, 8].
In high power ultrasound systems used in industrial and biomedical applications [9, 10], a
flexible power supply is required to convert an electrical energy into a desirable signal with
adjustable amplitude and frequency in order to efficiently excite the high power transducer [11].
Thereby, investigating the ultrasound transducer behaviours at both device and system levels
within different voltage and frequency ranges can give a better insight in maximizing the energy
conversion performance.
An ultrasound transducer has several resonance frequencies in which its lowest electrical
impedance results in a high efficient energy conversion compared to non-resonant frequencies
(high impedances) [12-14]. Usually the resonant frequencies are represented and modelled by a
parallel combination of RLC legs. Several electrical models of an ultrasound transducer are
introduced in literature [12, 15-17]. Fig. 2 illustrates the most well-known models. The Van Dyke
model is the basic model of the transducer which is a parallel connection of a series RLC leg and
a capacitor [17]. The Sherrit model proposes a parallel combination of a series LC leg and a
capacitor. The Easy model is another type of electrical model in which a resistor and a capacitor
are in series with a parallel RLC leg [12]. An electrical model of the ultrasound transducer with

4
multiple resonance frequencies is shown in Fig. 2(d) and is used for further analysis through this
paper.
(a)
(b)
(c)
(d)
Fig. 2. Electrical model of an ultrasound transducer (a) Van Dyke model [12] (b) Sherrit model [12] (c) Easy model
[17] and (d) extended Van Dyke model for a device with multiple resonance frequencies
According to Fig. 2 (d), is the total input impedance of the transducer which is given
in (1).
(1)

5
where is the total impedance of piezoelectric transducer, , , and are the
equivalent impedance, resistance, inductance and capacitance of the transducer respectively at
and is the ith
resonant frequency of the transducer.
Since at each resonance frequency of the transducer, the inductor and the capacitor reactance
(XL and XC) of that particular leg are opposite and equal, hence they cancel each other. In this
case, the resistor of that particular leg represents as an element to converter an electrical energy
to a mechanical energy.
Thereby, as it is shown in Fig. 3, in an ultrasound system the resistor of the transmitter is a
function of the input voltage ( ) and the resonant frequency ( ) and it is given in (2). Also,
it shown that the output voltage ( ) across the second transducer (receiver), is directly
related to the generated mechanical energy which in turn is a function of the resistor of the
transmitter at the resonant frequency and it is given in (3).
Fig. 3. Circuit diagram of the ultrasound system includes two ultrasound transducers
(2)
(3)

6
with being the resistance of the ultrasound transducer at the i
th resonant frequency, fi
frequency of the ith
resonant frequency, the voltage across
and the output voltage
of the ultrasound system.
If the input voltage is a sinusoidal signal with a fundamental frequency close to one of the
resonant frequencies of the ultrasound transducer for instance resonance frequency, is
proportional to . However if it is excited by multiple frequency signal (such as a square wave),
is proportional to resistor voltage drops at multiple frequencies. Therefore, at each
resonant frequency, the electrical impedance behaviour of the ultrasound transducer is related to
the resistor characteristic at that frequency. One of the important factors that can affect the
physical property of the transducer is the excitation voltage that can make the behaviour of the
transducer even more nonlinear. This needs to be investigated based on different modelling and
tests. In the ultrasound system, energy conversion can be affected by the system characteristics.
In a real case, the system characteristics can be influenced by the ultrasound transducer
characteristics, temperature, time etc [18-20].
In order to find out the resonant frequencies and the electrical impedance of an ultrasound
transducer at different frequencies several tests are performed [21, 22]. Due to a constraint of a
network analyzer which operates at low voltage, other methods are used to measure the electrical
impedance of the ultrasound transducer at higher voltage ranges.
In this paper, a high power ultrasound system is developed in order to investigate its behaviour
at both system and device levels. In this regard, the electrical impedance of the high power
ultrasound transducer and the voltage ratio of the high power ultrasound system are measured.
Since a high power ultrasound system can perform energy conversion in low and high voltage
ranges based on different applications, the implemented high power ultrasound system is tested

7
at different voltage ranges. Also, to study the behaviour of the ultrasound transducer at its
resonant and non-resonant frequencies, the ultrasound transducer is excited within a wide range
of frequencies. Different methods are used to evaluate the characteristics of the high power
ultrasound transducer and the ultrasound system – with two ultrasound transducers – which are
classified in Table I:
Table I. Excitation methods
Low voltage measurement
(≤ 30 V)
High voltage measurement
(> 30 V)
Network Analyzer
(electrical impedance measurement) Function Generator
Switched-mode
Power Converter
The rest of this paper is organized as follows. In section 2, different impedance measurement
methods are applied for the purpose of studying the impedance characteristic of the ultrasound
transducer. The behaviour of the ultrasound system in different voltage and frequency ranges is
studied in section 3. Finally, conclusion is drawn in section 4.
2. IMPEDANCE CHARACTERISTIC OF THE ULTRASOUND TRANSDUCER
In order to find out the resonant frequencies of an ultrasound transducer and measure its
electrical impedance, a sandwich piezoelectric transducer composed of two piezoelectric ceramic
elements and a vector network analyzer (R&S ZVL3) are used. The transducer specifications are
given in Table II.
Since the voltage range of network analyzer is limited (< 2 V), another test is required to
measure the electrical impedance of the ultrasound transducer in a higher voltage range (2 V<V≤
30 V). In this regard, a sinusoidal signal is generated to drive the ultrasound transducer using an

8
EZ Digital FG 7020A function generator and a power amplifier (OPA549). Then the voltage and
the current of the ultrasound transducer are measured to compute its electrical impedance. Due to
the voltage limitation of the power amplifier, a switched-mode power converter is used to
generate a high voltage signal (30 V <V≤ 200 V).
Table II. Transducer specifications
Design: Sandwich piezoceramic transducer
Piezoceramics: PZT8
Piezoceramic Diameters: 35 mm
Piezoceramic thickness: 5.1 mm
Vibration mode: Thickness Vibration
2.1. Using a Vector Network Analyzer (R&S ZVL3)
A vector network analyzer drives the ultrasound transducer by applying an input signal then
measures the voltage and the feedback current to obtain the electrical impedance of the
ultrasound transducer. The experimental setup and the measured electrical impedance of the high
power ultrasound transducer are shown in Fig. 4.
As it is clear in Fig. 4(b), the ultrasound transducer has several resonance frequencies in which
its electrical impedance amplitude is minimum compared to non-resonance frequencies. Based
on the minimum amplitudes of the electrical impedance, maximum values of the output power
are attained at these resonance frequencies. Among these resonance frequencies, only at
one frequency the lowest electrical impedance is achieved and this frequency is defined as the
main resonance frequency of the ultrasound transducer. Table III presents the impedance
amplitudes achieved at the resonance frequencies of the transducer.
9
(a) (b)
Fig. 4. Ultrasound transducer electrical impedance measurement (a) experimental test using network analyser (b)
measured impedance amplitude
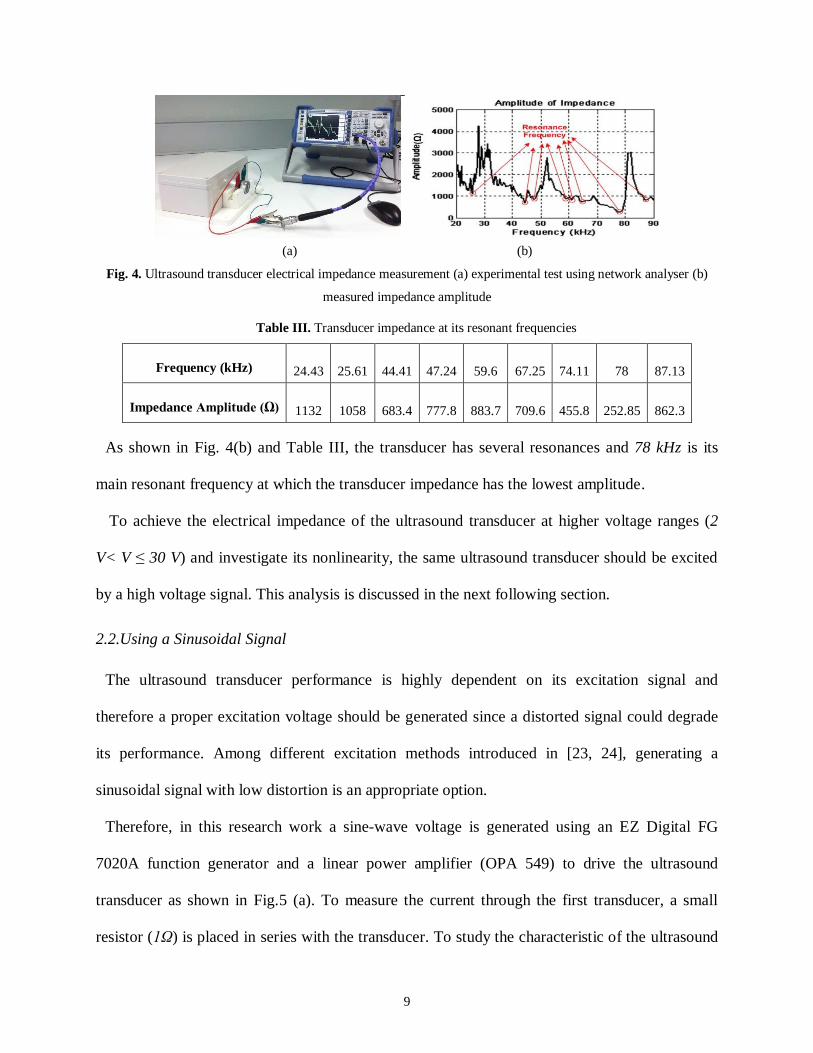
Table III. Transducer impedance at its resonant frequencies
Frequency (kHz) 24.43 25.61 44.41 47.24 59.6 67.25 74.11 78 87.13
Impedance Amplitude (Ω) 1132 1058 683.4 777.8 883.7 709.6 455.8 252.85 862.3
As shown in Fig. 4(b) and Table III, the transducer has several resonances and 78 kHz is its
main resonant frequency at which the transducer impedance has the lowest amplitude.
To achieve the electrical impedance of the ultrasound transducer at higher voltage ranges (2
V< V ≤ 30 V) and investigate its nonlinearity, the same ultrasound transducer should be excited
by a high voltage signal. This analysis is discussed in the next following section.
2.2.Using a Sinusoidal Signal
The ultrasound transducer performance is highly dependent on its excitation signal and
therefore a proper excitation voltage should be generated since a distorted signal could degrade
its performance. Among different excitation methods introduced in [23, 24], generating a
sinusoidal signal with low distortion is an appropriate option.
Therefore, in this research work a sine-wave voltage is generated using an EZ Digital FG
7020A function generator and a linear power amplifier (OPA 549) to drive the ultrasound
transducer as shown in Fig.5 (a). To measure the current through the first transducer, a small
resistor (1Ω) is placed in series with the transducer. To study the characteristic of the ultrasound

10
transducer and the electrical impedance at different frequencies, the frequency of the excitation
signal is adjusted to 39 kHz and 60 kHz. The voltage across transducer and the current
through it are measured to calculate its electrical impedance using (4).
(4)
where is the resonant frequency of the transducer.
Since the electrical impedance of the ultrasound transducer is computed based on the measured
voltage and current at each frequency, it is expected that the electrical impedance variations
remain the same regardless of the amplitude changes of the input voltage for a linear ultrasound
transducer. To investigate its linear characteristic, the superposition law is used.
Principle of Superposition
According to the principle of the superposition, the sum of the responses of a linear system to
the individual inputs is equal to the response of the system to the sum of the inputs [25]. This
principle is shown by:
(5)
This general pattern holds true for the ultrasound transducer electrical impedance if its measured
values are the same for the following excitation conditions:
Test Condition 1: Exciting by two separate input sinusoidal signals (39 kHz, 60 kHz)
Test Condition 2: Exciting by two simultaneous input sinusoidal signals (39 kHz and
60 kHz)
The experimental prototype developed for this test and the block diagram of this setup are
depicted in Fig. 5(a) and (b). To meet the test condition 1, two input sinusoidal signals with

11
different fundamental frequencies (39 kHz and 60 kHz) are generated to excite the ultrasound
transducer individually. The amplitude of these signals are adjusted at 30 V using the amplifier.
The responses of the ultrasound transducer to these individual input signals are added together in
the frequency domain.
In the next step, two sinusoidal signals at 39 kHz and 60 kHz are generated simultaneously
using two function generators and then added together using the op-amp (OPA 549). The
amplitudes of these signals are adjusted at 30 V same as the previous case. The comparison
between the calculated electrical impedances makes it clear whether the ultrasound transducer
has a linear or a nonlinear characteristic. As shown in Fig. 5(c), the magnitudes of the ultrasound
transducer impedances achieved for test conditions 1 and 2 are different at 39 kHz while at
60 kHz, the impedances are almost the same. At this stage due to the power amplifier limitations,
it is not possible to increase the voltage and the power of the power supply in order to investigate
the transducers performance at different voltage and power levels. However, these test results
verify that the impedance of the ultrasound transducer can be a function of the excitation input
signal (voltage and frequency) and the resonant frequencies of the transducer.
(a)
(b)
(c)
Fig. 5. Electrical impedance measurement of the ultrasound transducer (a) experimental prototype (b) block diagram
of setup (c) test results.

12
2.3.Using a Two-Level Inverter
According to different applications, an ultrasound transducer could be used in different ranges
of voltage and frequency. For instance, an ultrasound transducer is used in low voltage range in
diagnostic applications, whereas it is also used at higher voltage and power ranges for
therapeutic applications [1, 26]. To attain a better performance of the ultrasound transducer,
studying its characteristic at higher voltage and power ranges is necessary.
As it was mentioned, the maximum sinusoidal signal voltage generated by the linear amplifier
is limited to the electrical characteristic of the power amplifier. To overcome the voltage
limitation of the excitation signal, a two-level inverter is implemented to generate an appropriate
high voltage signal (≤ 200 V). The block diagram and a laboratory setup of this test are shown in
Fig. 6(a) and Fig. 6(b) respectively. The square wave signal consists of a fundamental frequency
and its harmonics and it cannot be considered as a pour sinusoidal signal.
Since the minimum electrical impedances and the maximum output powers of each ultrasound
transducer are achieved at its resonance frequencies, the power converter is controlled in such a
way to generate the square wave signal with the fundamental frequency, matching the resonant
frequency of the ultrasound transducer which is depicted in Fig.6(c). The response of the
ultrasound transducer is measured at different voltage and frequency ranges by changing the DC
link voltage and the fundamental frequency of the inverter, respectively. The quality of the
excitation signal is really important because a poor quality signal can affect the performance of
the ultrasound transducer by increasing the harmonic contents and deliver power at undesired
frequency ranges [27]. To investigate and analyse this issue, the fundamental frequency of the
inverter output signal (finv) is adjusted at finv=39 kHz while the second harmonic of the signal is at
finv=78 kHz which is exactly at the resonant frequency of the transducer. The DC link voltage

13
values are changed (50 V, 100 V and 200 V) in order to measure the impedance of the transducer
at different voltage and power levels. In this test, two differential voltage probes are used to
measure the voltage across transducer (Vtrans) and the current through it (itrans). Then the electrical
impedance is computed using the measured voltage and current values in time domain from the
laboratory test and then Fast Fourier transform (FFT) analysis by MATLAB software. The
results of these tests are depicted in Fig. 6(d).
The analysis shows the nonlinearity of the ultrasound transducer as the impedance of the
transducer is changed when the vinput is increased. The result also shows that the transducer has
been excited by multi-input voltages whose magnitude and frequencies can be calculated by (6).
(6)
where is the DC voltage and is the fundamental frequency of the inverter and is the
order of the harmonic.
Thus, the test results verify that the electrical impedance amplitude is changed based on the
amplitude variations of the input voltage signal. This has be described in Eq.(2) such a way that
the resistors in each parallel branch can be affected by other resonant frequencies and energies
which means each resistor in the RLC branch is a function of multi frequencies not a single
frequency.
In Fig. 6(d), if the input voltage is changed from 50 V to 100 V and then to 200 V, the electrical
impedance amplitude of the ultrasound transducer at 39 kHz is changed from 362.7 Ω to 372 Ω
and then to 351.5 Ω. This variation is explained due to the nonlinearity of the ultrasound
transducer; otherwise the electrical impedance amplitude should be the same for a linear system.
14
It is also important to measure and analysis the impedance of the transducer at 78 kHz (the
second harmonic of the applied signal) which is exactly at the main resonant frequency of the
transducer. At 78 kHz, if the input voltage is changed from 50 V to 100 V and then to 200 V the
transducer impedance is changed form 91.7 Ω to 97.29 Ω and then to 71.7 Ω. Although the
fundamental frequency of the generated signal is adjusted to 39 kHz, some higher harmonics are
generated such as the third harmonics at 3x 39 kHz= 117 kHz. The higher order harmonics are
not within the main characteristic of the transducer and it cannot influence the transducer
characteristic. In some applications such as therapeutic one, the performance of the ultrasound
transducer should be controlled to achieve maximum energy conversion at desired frequency
ranges so undesired effects of sidebands are not acceptable. For instance, as shown in Fig. 6(d),
when the transducer is excited with a multi-frequency input signal, the energy conversion
happens at 39 kHz and 78 kHz while the fundamental frequency of excitation signal is adjusted to
39 kHz to achieve the energy conversion only at 39 kHz not at 78 kHz. In such case the sideband
harmonics should be filtered to avoid undesired effects. According to these experimental results,
it can be concluded that at higher voltage range, the ultrasound transducer could be saturated and
will have a nonlinear behaviour. Overall, the nonlinearity of the ultrasound transducer is
concluded from these test results.
In addition, the hysteretic behaviour of the transducer is studied through an experimental test
for which the piezoelectric transducer is excited at different voltage levels. In this test, the
impedance of the transducer has been measured with respect to the change in the amplitude of
the excitation signal. All measured impedances associated with the excitation signal changes are
tabulated in Table IV and the transducer impedance behaviour is shown in Fig. 7.

15
(a)
(b)
(c)
(d)
Fig. 6. Test with two-level converter (a) block diagram of setup (b) experimental setup (c) output of two-level
converter (d) impedance of transducer for

16
Table IV. Transducer impedance with respect to excitation signal changes
Excitation Voltage (V) 300 600 200 50 600 300
Transducer Impe an e (Ω) 1491 1486 1361 916.7 1471 1477
Fig.7. Impedance behaviour of the transducer with respect to excitation signal changes
3. ULTRASOUND SYSTEM CHARACTERISTIC
As shown in Fig. 1, in an ultrasound system, the transmitter generates ultrasound waves
(mechanical energy) related to the applied electrical energy (input voltage) and then some parts
of these ultrasound waves are converted to the electrical energy (output voltage) by the receiver.
Other parts of the generated ultrasound wave which are not converted to the electrical energy
might be absorbed or dispersed. Different mediums can be used to couple these two ultrasound
transducers in the ultrasound system such as water, oil and etc [28]. The intensity of the
generated mechanical energy (ultrasound wave) depends on the applied input voltage and can
affect the generated output voltage. Therefore, the efficiency of the ultrasound system can be
analyzed according to the comparison of the input and the output voltages of the system. In this
regard, the voltage across transmitter is measured as an input voltage signal and the output
voltage is measured across the receiver. Several tests are carried out to study the characteristic of

17
the ultrasound system. The responses of the second ultrasound transducer to the input voltages
with different amplitudes are measured to illustrate the characteristic of the system.
3.1. Using a Sinusoidal Signal
Undesired distortion (poor quality) of the excitation signal can deteriorate the performance of
the ultrasound transducer, which can affect the performance of the ultrasound system as well.
Therefore, a sinusoidal signal with lower distortion could be a proper option to drive the
ultrasound transducer.
The block diagram of the ultrasound system with two transducers – transmitter and receiver –
including a sinusoidal power supply is shown in Fig. 8(a). In this test, the transducer 1 plays a
role of a transmitter and the transducer 2 is applied as a receiver. Two sinusoidal signals with
different fundamental frequencies (39 kHz and 60 kHz) are generated individually using the
power amplifier (OPA 549). To study the quality of the input and the output signals and compare
the performance of the ultrasound system at different frequencies, test results shown in Fig. 8(b)
are illustrated in the frequency domain.
Based on (5), the ultrasound system is linear if its responses to the test condition 1 and the test
condition 2 – mentioned in section 2.2 are the same. To meet the test condition 1, the ultrasound
system is excited by two individual input signals with different frequencies (39 kHz and 60 kHz).
The responses of the system to these input signals are added together in frequency domain.
Based on the test condition 2, two input sinusoidal signals with the amplitudes of 30 V and the
fundamental frequencies of 39 kHz and 60 kHz are added together in order to generate a new
signal to drive the ultrasound system.
As a linear system, the output of the system should be a function of its input. Therefore, it is
expected that the output voltage variations of the ultrasound system should be almost the same

18
based on test conditions 1 & 2. As shown in Fig. 8(b), the amplitudes of the output signals at
39 kHz are different while at 60 kHz are almost the same when a single and a double sinusoidal
excitation are applied to the system. For a linear system the output voltage amplitude should be
related to the amplitude of the input voltage. The performance of the ultrasound transducer varies
at different frequencies. Therefore, the responses of the system (including the ultrasound
transducer) to the input signals verifies the nonlinear behaviour of the transducers and the
system. The differences between test results verify that this system does not obey the
superposition rule so it is a nonlinear system.
(b)
Fig. 8. Ultrasound system excitation using sinusoidal signal (a) a block diagram of the setup (b) experimental
results
3.2. Using a Two-Level Inverter
To study the characteristics of the ultrasound system at higher voltage ranges another test is
required to generate a high voltage signal to excite the ultrasound system. In this regard, the

19
power converter is used to generate a high voltage square wave signal which contains some
harmonics and it is not a pure sinewave. The block diagram of the experimental test and
developed experimental prototype are shown in Fig. 9(a) and (b) respectively.
The voltages across the transducer 1 and the transducer 2 are measured as the input and the
output voltages respectively using two differential voltage probes. The captured data of this test
are analyzed in frequency domain using MATLAB. The generated signal has a fundamental
component at 39 kHz and some harmonics as it is not a pure sinusoidal signal. To study the effect
of these harmonics on the performance of the ultrasound transducer, the fundamental frequency
of the input signal is adjusted to 39 kHz. Therefore, its second harmonic appears at 78 kHz which
is the main resonance frequency of the ultrasound transducer. In this test, the DC link voltage is
adjusted to 50 V, 100 V and 200 V therefore the responses of the ultrasound system to the input
voltage signals with different amplitudes can be studied.
To have a better comparison, the amplitudes of the input and the output voltages are normalized
at 50V dividing by factors of 1, 2 and 4. Despite the input voltage signals, the normalized output
voltages do not match each other and some differences can be seen in Fig. 9(c). For example, at
39 kHz the response of the system to the input voltage signal with the amplitude of 200 V is a
factor 1.5 but the response to 100 V input voltage signal is a factor of 1.7. If the ultrasound
system under the test is linear, then the measured voltages across the second transducer should be
consistent with the applied input voltages, but the results of this test show that this system does
not obey this rule and has nonlinear behaviour.

20
(a)
(b)
(c)
Fig. 9. Ultrasound system excitation using a two-level converter (a) block diagram (b) experimental prototype
(c) experimental result
4. CONCLUSION
It is important to consider electrical characteristic of a high power ultrasound transducer in
order to design an efficient high power converter to excite the ultrasound system. The
characteristic of the high power ultrasound transducer and the ultrasound system in low and high
voltages (30 V- 200 V peak) are investigated in this paper. In this regard, an ultrasound system
including two high power ultrasound transducers (78 kHz) is developed and excited at different
voltage and frequency ranges. According to the test results, it is concluded that at each resonant
frequency of the transducer, the equivalent resistor of each RLC branch delivers the
electromechanical power to the output side of the ultrasound system. Therefore, the behaviour of
the ultrasound transducer at each resonance frequency is influenced by the characteristic of the
equivalent resistor at that resonant frequency. A low voltage sinusoidal signal and a high voltage

21
square wave signal are generated to excite the ultrasound transducer and system in different
frequency ranges (30 kHz – 90 kHz). The test results present a nonlinear behaviour of the
ultrasound transducer especially in high voltage ranges. This is due to the fact that the amplitude
of the transducer electrical impedance changes by the amplitude variations of the input voltage
signals. Also, the characteristic of the ultrasound system is analyzed in low and high voltage
ranges based on the voltage ratio of the ultrasound system. The nonlinearity of the ultrasound
system has been observed in the test results where the measured output voltage amplitudes of the
system are not commensurate with the amplitude changes of the input voltage signals. According
to the superposition law, the ultrasound system has different behaviours when it is excited by
multi-sinusoidal signal. Thus, in order to improve the quality and the efficiency of the ultrasound
system, it is recommended to investigate main resonant frequencies of the ultrasound transducer
and design a proper power converter with high quality output signal and with low harmonic
orders.
References
[1] F. J. Fry, "Biological effects of ultrasound—A review," Proceedings of the IEEE, vol. 67, pp. 604-
619, 1979.
[2] A. A. Vives, Piezoelectric Transducers and Applications vol. 2. Aufl.;2;2nd;. Dordrecht: Springer-Verlag,
2008.
[3] P. Davari, N. Ghasemi, F. Zare, P. O'Shea, and A. Ghosh, "Improving the efficiency of high power piezoelectric transducers for industrial applications," Science, Measurement & Technology, IET, vol. 6, pp.
213-221, 2012.
[4] I. G. Mina, H. Kim, I. Kim, S. K. Park, K. Choi, T. N. Jackson, et al., "High frequency piezoelectric
MEMS ultrasound transducers," IEEE Transactions on Ultrasonics, Ferroelectrics, and Frequency
Control, vol. 54, pp. 2422-2430, 2007.
[5] O. M. Al-Bataineh, K. Lweesy, and L. Fraiwan, "Noninvasive transdermal insulin delivery using
ultrasound transducers," in 2011 1st Middle East Conference on Biomedical Engineering, 2011, pp. 316-
319.
[6] M. Thomson, G. Gouws, and P. Harris, "Detection of surface cracks in fibre reinforced composites using
ultrasonic Rayleigh waves," in Sensing Technology (ICST), 2011 Fifth International Conference on, 2011,
pp. 446-451. [7] L. Faa-Jeng, D. Rou-Yong, and Y. Jyh-Chyang, "An ultrasonic motor drive using a current-source parallel-
resonant inverter with energy feedback," IEEE Transactions on Power Electronics, vol. 14, pp. 31-42,
1999.
[8] S. Ozeri and D. Shmilovitz, "High frequency resonant inverter for excitation of piezoelectric devices," in
2008 IEEE Power Electronics Specialists Conference, 2008, pp. 245-249.

22
[9] L. G. Garretón and J. A. Gallego-Juarez, "International Congress on Ultrasonics, Santiago de Chile,
January 2009High-power ultrasonic processing: Recent developments and prospective advances," Physics
Procedia, vol. 3, pp. 35-47, 2010/01/01 2010.
[10] J. A. Gallego-Juárez and K. F. Graff, Power Ultrasonics : Applications of High-Intensity Ultrasound vol.
66. Burlington: Woodhead Publishing, 2014.
[11] N. Ghasemi, "Improving ultrasound excitation systems using a flexible power supply with adjustable voltage and frequency to drive piezoelectric transducers," Dissertation/Thesis, Queensland University of
Technology 2012.
[12] G. Mingjie and L. Wei-Hsin, "Studies on the circuit models of piezoelectric ceramics," in Information
Acquisition, 2004. Proceedings. International Conference on, 2004, pp. 26-31.
[13] Y. Zhang and Q. Wang, "Statistical analysis of resonance frequency error for ultrasonic welding machine
transducer," in Technology and Innovation Conference, 2006. ITIC 2006. International, 2006, pp. 50-55.
[14] I. Akiyama, N. Yoshizumi, and K. Nakamura, "Multiple-frequency ultrasonic imaging using a multiple-
resonance transducer," in 2009 IEEE International Ultrasonics Symposium, 2009, pp. 2712-2717.
[15] S. Ben-Yaakov and N. Krihely, "Modeling and driving piezoelectric resonant blade elements," in Applied
Power Electronics Conference and Exposition, 2004. APEC '04. Nineteenth Annual IEEE, 2004, pp. 1733-
1739 Vol.3.
[16] J. Kim, B. L. Grisso, J. K. Kim, D. S. Ha, and D. J. Inman, "Electrical modeling of Piezoelectric ceramics for analysis and evaluation of sensory systems," pp. 122-127.
[17] A. Arnau, Y. Jimenez, and T. Sogorb, "An extended Butterworth Van Dyke model for quartz crystal
microbalance applications in viscoelastic fluid media," IEEE Transactions on Ultrasonics, Ferroelectrics,
and Frequency Control, vol. 48, pp. 1367-1382, 2001.
[18] an ma e a a e a , and M. Lozano, "High-Frequency Ultrasonic Atomization
With Pulsed Excitation," Journal of Fluids Engineering, vol. 125, pp. 941-945, 2004.
[19] P. Fabijanski and R. Lagoda, "Series resonant converter with sandwich-type piezoelectric ceramic
transducers," in Industrial Technology, 1996. (ICIT '96), Proceedings of The IEEE International
Conference on, 1996, pp. 252-256.
[20] P. Fabijanski, Genetic Identification of Parameters the Piezoelectric Transducers for Digital Model of
Power Converter in Ultrasonic Systems: InTech, 2010. [21] H. Huang and D. Paramo, "Broadband electrical impedance matching for piezoelectric ultrasound
transducers," IEEE Transactions on Ultrasonics, Ferroelectrics and Frequency Control, vol. 58, pp. 2699-
2707, 2011.
[22] T. Jian-wen, L. Rui-jin, W. Hua, L. Long, and Q. Sheng-ze, "Time domain electrical impedance
measurement method for ultrasound transducer," in Bioelectronics and Bioinformatics (ISBB), 2011
International Symposium on, 2011, pp. 279-282.
[23] K. Agbossou, J. L. Dion, S. Carignan, M. Abdelkrim, and A. Cheriti, "Class D amplifier for a power
piezoelectric load," IEEE Transactions on Ultrasonics, Ferroelectrics and Frequency Control, vol. 47, pp.
1036-1041, 2000.
[24] S. C. Tang and G. T. Clement, "A harmonic cancellation technique for an ultrasound transducer excited by
a switched-mode power converter," IEEE Transactions on Ultrasonics, Ferroelectrics and Frequency
Control, vol. 55, pp. 359-366, 2008. [25] A. Tustin, "A method of analysing the behaviour of linear systems in terms of time series," Electrical
Engineers - Part IIA: Automatic Regulators and Servo Mechanisms, Journal of the Institution of, vol. 94,
pp. 130-142, 1947.
[26] M. S. Vijaya, "Medical Applications of Piezoelectric Materials," in Piezoelectric Materials and Devices,
ed: CRC Press, 2012, pp. 109-124.
[27] N. Ghasemi, F. Zare, A. A. Boora, A. Ghosh, C. Langton, and F. Blaabjerg, "Harmonic elimination
technique for a single-phase multilevel converter with unequal DC link voltage levels," Power Electronics,
IET, vol. 5, pp. 1418-1429, 2012.
[28] N. Ghasemi, F. Zare, P. Davari, C. Langton, P. Weber, and A. Ghosh, "Power electronic converters for
high power ultrasound transducers," in Industrial Electronics and Applications (ICIEA), 2012 7th IEEE
Conference on, 2012, pp. 647-652.

23
Highlights
At high voltage range (>100 V), the ultrasound transducer could be saturated.
The impedance of the transducer is changed when the excitation signal is increased.
Nonlinearity of the ultrasound transducer is concluded from experimental results.
The ultrasound system is nonlinear because it does not obey the superposition rule.