Dissertation ReportFINAL
26
1 | Page A DISSERTATION PROJECT REPORT ON BRAND PREFERENCE OF MOBILE PHONE AMONG COLLEGE STUDENTS A report submitted in partial fulfillment of the requirement for MBA Program of IISWBM CHETAN GUPTA ROLL No. : 107/MBA/111021 REGISTRATION No. : 004686 of 2006-2007 MAJOR: MARKETING MINOR: FINANCE SESSION: 2011-2013 MBA (D) 4TH SEMESTER Indian Institute of Social Welfare and Business Management
Transcript of Dissertation ReportFINAL
1 | P a g e
A DISSERTATION PROJECT REPORT ON
BRAND PREFERENCE OF MOBILE PHONE
AMONG COLLEGE STUDENTS
A report submitted in partial fulfillment of the requirement for
MBA Program of IISWBM
CHETAN GUPTA
ROLL No. : 107/MBA/111021
REGISTRATION No. : 004686 of 2006-2007
MAJOR: MARKETING
MINOR: FINANCE
SESSION: 2011-2013
MBA (D) 4TH SEMESTER
Indian Institute of Social Welfare and Business Management

2 | P a g e
Acknowledgement
I take this opportunity to express my gratitude to the people who have been instrumental in the successful completion of this project. It was the continuous guidance and useful suggestions of Dr. A. Sharma,
which helped me in successfully completing the project work. I wish to express my deep sense of gratitude to her. I would also like to thank Dr. Tanima Ray for their advice, encouragement and cooperation. I also take immense pleasure in thanking my respective faculty members from IISWBM (Indian Institute of Social Welfare & Business Management) for their timely guidance in the conduct of this project work. I am grateful for their constant support and help. Without their encouragement and guidance this project would not have materialized. Also, my special gratitude to friends and family, without whose
support and motivation this work could not have been completed
successfully.
3 | P a g e
PREFACE
The project gives an insight of the telecom sector. It basically helps
understanding the brand preference of students with regard to mobile
phones. It helps us to know on what basis a student chooses a
particular brand when he/she purchases a new handset.
The project will help to learn about the growing telecom sector in
India. The research will also bring to light what all factors a student
considers at the time of purchase of a new mobile phone.

4 | P a g e
Table of Contents
1. INTRODUCTION .................................................................................................... 5
a. Definition of Cellular/Mobile phone ............................................................ 5
b. Telecom Industry in India ............................................................................... 6
c. The Key players in the Telecom Market in India....................................... 7
d. Objectives of the Study ....................................................................................... 8
2. RESEARCH METHODOLOGY .......................................................................... 9
a. SAMPLING METHODOLOGY: .......................................................................... 9
b. RESEARCH DESIGN: - ....................................................................................... 9
c. DATA COLLECTION:.......................................................................................... 9
3. DATA ANALYSIS AND INTERPRETATION ......................................................... 10
4. FINDINGS ............................................................................................................ 21
5. RECOMMENDATIONS ..................................................................................... 22
6. LIMITATIONS ....................................................................................................... 23
7. BIBLIOGRAPHY ................................................................................................... 23
8. ANNEXURE .......................................................................................................... 24

5 | P a g e
1. INTRODUCTION
a. Definition of Cellular/Mobile phone
The Cellular telephone (commonly "mobile phone" or "cell phone") is a
long-range, portable electronic device used for mobile communication.
In addition to the standard voice function of a telephone, current mobile
phones can support many additional services such as SMS for text
messaging, email, packet switching for access to the Internet, and MMS
for sending and receiving photos and video. Most current mobile phones
connect to a cellular network of base stations (cell sites), which is in turn
interconnected to the public switched telephone network (PSTN) (the
exception is satellite phones. Cellular telephone is also defined as a type
of short-wave analog or digital telecommunication in which a subscriber
has a wireless connection from a mobile telephone to a relatively nearby
transmitter. The transmitter's span of coverage is called a cell. Generally,
cellular telephone service is available in urban areas and along major
highways. As the cellular telephone user moves from one cell or area of
coverage to another, the telephone is effectively passed on to the local
cell transmitter. A cellular telephone is not to be confused with a cordless
telephone (which is simply a phone with a very short wireless connection
to a local phone outlet). A newer service similar to cellular is personal
communications services (PCS).
6 | P a g e
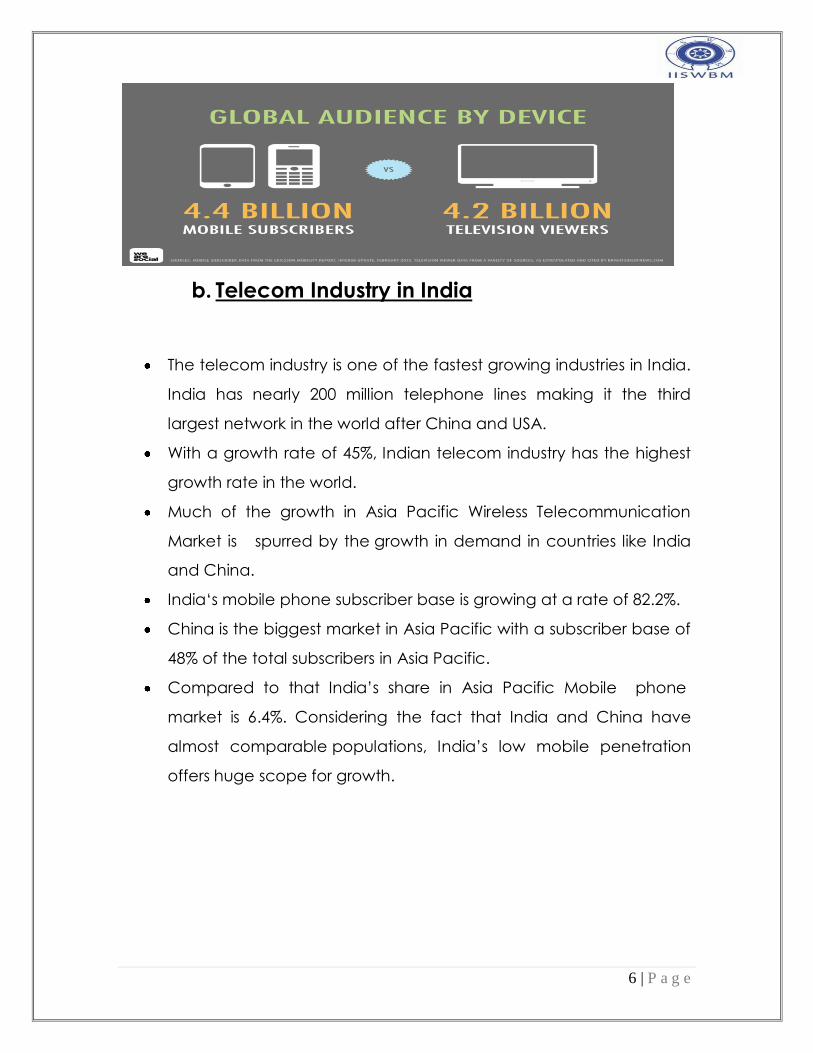
b. Telecom Industry in India
The telecom industry is one of the fastest growing industries in India.
India has nearly 200 million telephone lines making it the third
largest network in the world after China and USA.
With a growth rate of 45%, Indian telecom industry has the highest
growth rate in the world.
Much of the growth in Asia Pacific Wireless Telecommunication
Market is spurred by the growth in demand in countries like India
and China.
India‘s mobile phone subscriber base is growing at a rate of 82.2%.
China is the biggest market in Asia Pacific with a subscriber base of
48% of the total subscribers in Asia Pacific.
Compared to that India’s share in Asia Pacific Mobile phone
market is 6.4%. Considering the fact that India and China have
almost comparable populations, India’s low mobile penetration
offers huge scope for growth.
7 | P a g e
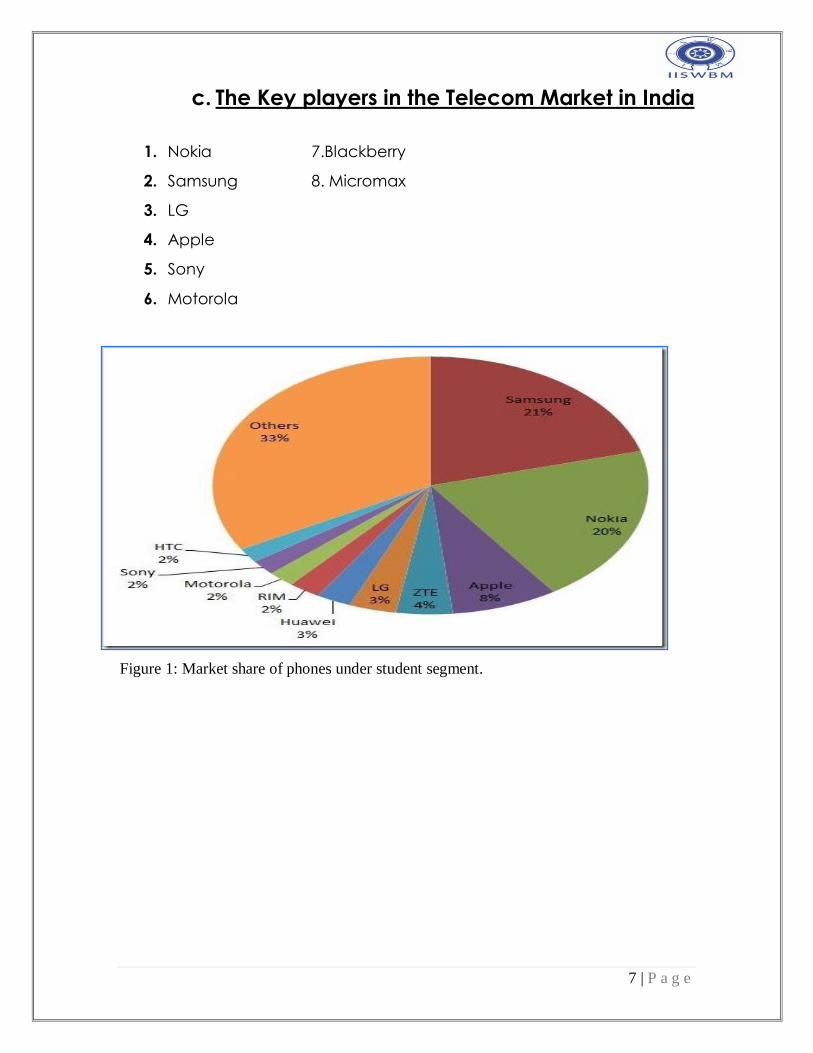
c. The Key players in the Telecom Market in India
1. Nokia 7.Blackberry
2. Samsung 8. Micromax
3. LG
4. Apple
5. Sony
6. Motorola
Figure 1: Market share of phones under student segment.

8 | P a g e
d. OBJECTIVES OF THE STUDY
The Primary Objective was to study the perception & buying behavior of
students towards various mobile brands.
The Secondary Objectives of this study were to identify:
To know about the student preference level associated with
different mobile phones.
To find out the students satisfaction towards the various mobile
phones.
Major features, which a customer looks for in a mobile before
making a purchase.
Factors that influence decision-making in purchasing a mobile
phone.
To know which advertisement media puts more impact on the
buying decision of students.
Factors, which help in increasing the sale of mobile phones.

9 | P a g e
2. RESEARCH METHODOLOGY
a. SAMPLING METHODOLOGY:
Sample Size —160 respondents
Sample Unit- Students of Graduation and the Post Graduation have been
taken as sample unit.
Sampling Area – Kolkata
Sampling Technique – convenient Sampling technique
b. RESEARCH DESIGN: -
• Visited the students across Kolkata (College Street) & gathered
information required as per the questionnaire.
• The research design is probability research design and is descriptive
research.
c. DATA COLLECTION:
• Primary data has been used by me in the form of Questionnaire &
Observation, which are the two basic methods of collecting primary
data, which suffices all research objectives.
• Secondary data sources like catalogue of the company, product range
book of the company & various internet sites such as google & shopping
sites have been used.

10 | P a g e
3. DATA ANALYSIS AND INTERPRETATION
Occupation of the Respondents’ Father
Occupation
%
1 Service
45%
2 Professional
12%
3 Business
28%
4 Others
15%
Total 100%
Figure2 Occupation of the Respondents’ Father
Interpretation
The graphical representation of the table shows that out of the 160
respondents, 45 % respondents belong to the service family, 28 % were
from business, 12 % were from the professional and 15 % were from the
others family.
11 | P a g e
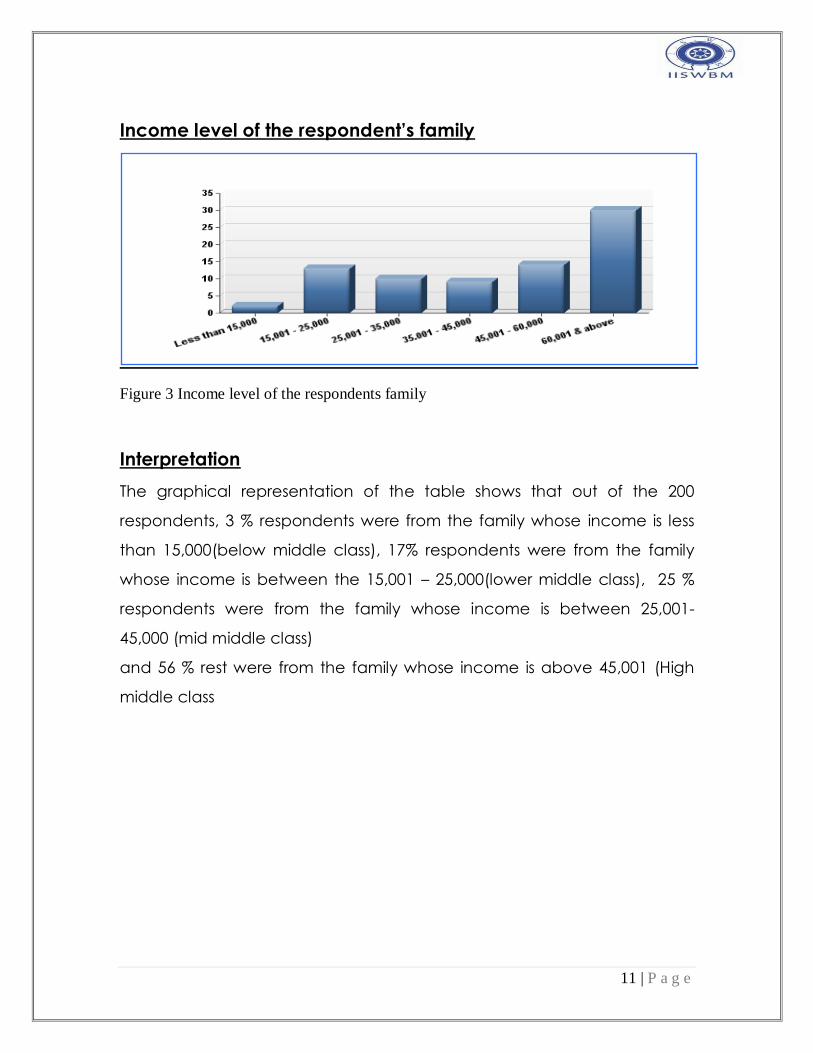
Income level of the respondent’s family
Figure 3 Income level of the respondents family
Interpretation
The graphical representation of the table shows that out of the 200
respondents, 3 % respondents were from the family whose income is less
than 15,000(below middle class), 17% respondents were from the family
whose income is between the 15,001 – 25,000(lower middle class), 25 %
respondents were from the family whose income is between 25,001-
45,000 (mid middle class)
and 56 % rest were from the family whose income is above 45,001 (High
middle class
12 | P a g e
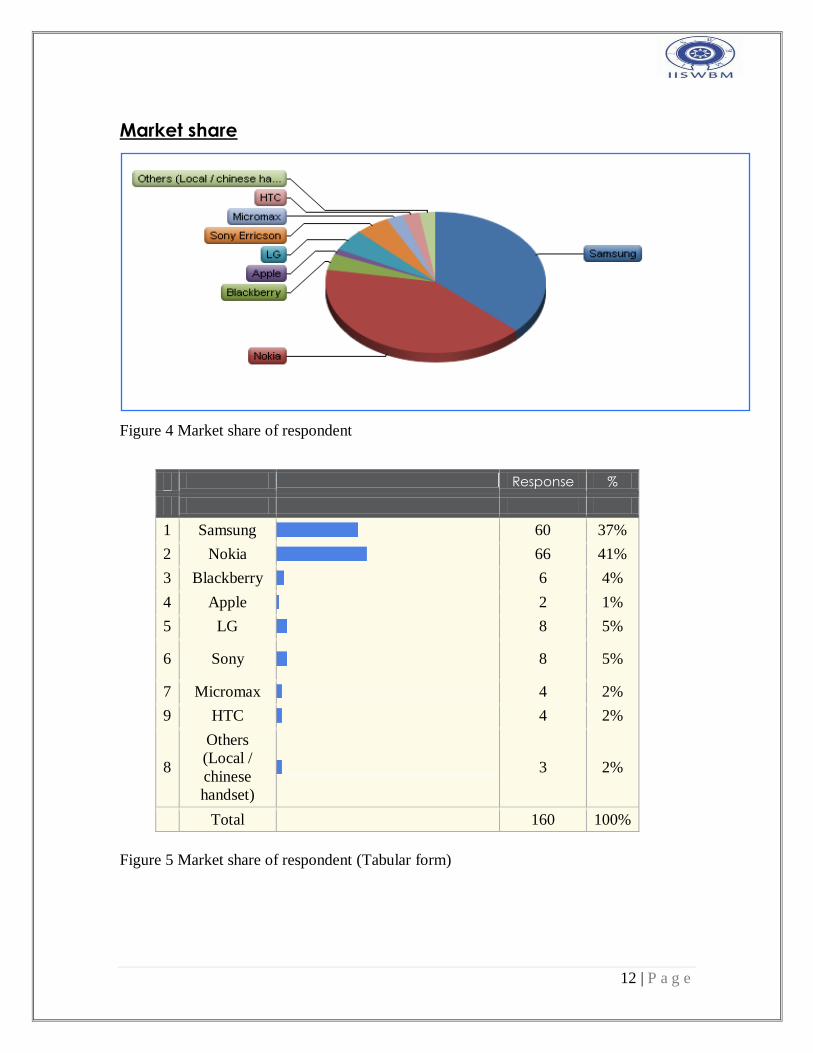
Market share
Figure 4 Market share of respondent
Response %
1 Samsung
60 37%
2 Nokia
66 41%
3 Blackberry
6 4%
4 Apple
2 1%
5 LG
8 5%
6 Sony
8 5%
7 Micromax
4 2%
9 HTC
4 2%
8
Others
(Local /
chinese
handset)
3 2%
Total 160 100%
Figure 5 Market share of respondent (Tabular form)
13 | P a g e
Interpretation
Out of the 160 respondents, Major handset used by students are Nokia &
Samsung. Samsung has emerged as a new market leader. Nokia has
gradually lost its market share over the years. New players had joined the
league naming Chinese handsets. Blackberry has entered Indian market
with big swings. Though Blackberry portrays itself as YOUTH brand but it is
being used by few respondents and rest of all share a more or less
equitable share among students.
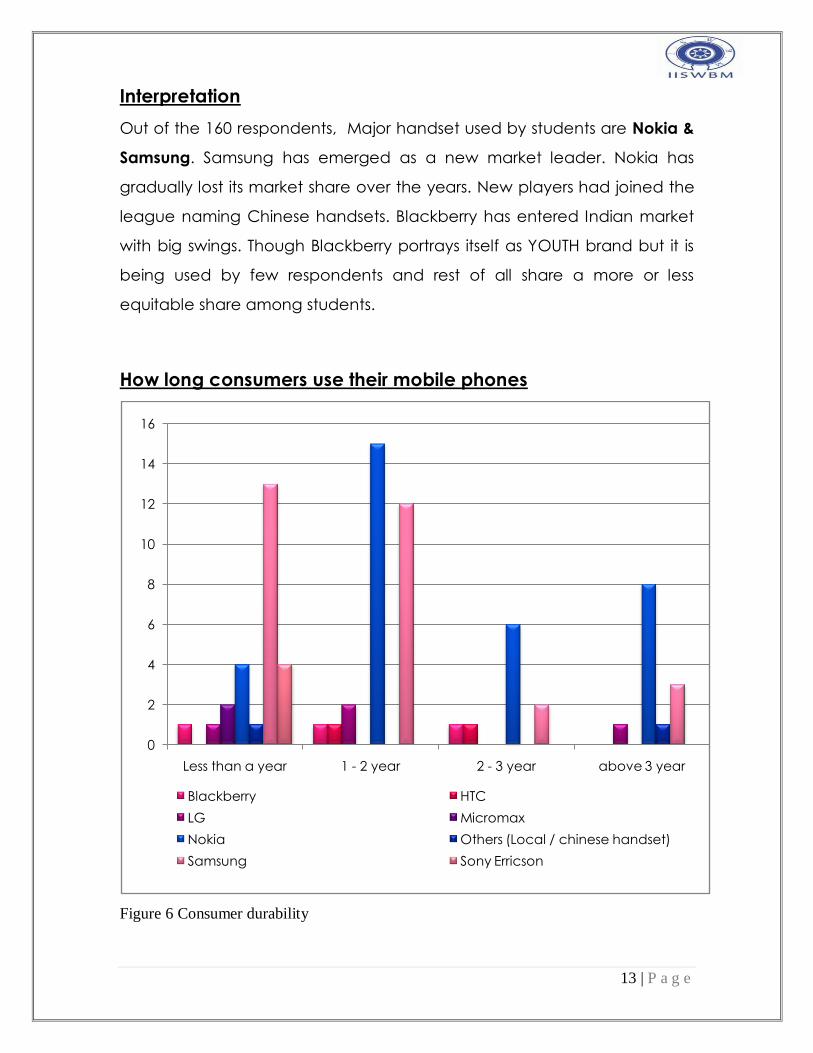
How long consumers use their mobile phones
Figure 6 Consumer durability
0
2
4
6
8
10
12
14
16
Less than a year 1 - 2 year 2 - 3 year above 3 year
Blackberry HTC
LG Micromax
Nokia Others (Local / chinese handset)
Samsung Sony Erricson

14 | P a g e
Interpretation
Out of the 160 respondents
Nokia & LG users predominantly uses there handset for 1-2 years but
strikingly a huge respondent are there who use it for more than 3 years in
both cases.
Samsung have almost the same repurchase in Less than a year & 1-2
years and people do not prefer using their handset for long period as
noticed for Nokia.
Blackberry & HTC users are almost same in every year category i.e. ,
unpredictable buying behavior
How often consumer change your mobile phone?
Figure 7 Consumer- changes mobile phone
0%
5%
10%
15%
20%
25%
30%
35%
40%
1 - 2 years
2-3 years
3 - 4 years
Depends on other
factors
Less than a Year

15 | P a g e
Interpretation
Out of the 160 respondents around 35 % consumers change their phone
within 1-2 years and so on but there is other factors on which consumer
change their phone which is about 30 % i.e., new technology , service
facilities. Online support for gaming and applications availability
Repurchase intention for existing brand (Brand loyalty)
Figure 8 Consumer- Repurchase Intensions
Interpretation:
The graphical representation shows that there is high repurchase
intentions among existing APPLE & HTC users rest followed by Micromax
which is among every two users one person have the affinity for
repurchase, whereas market leaders like NOKIA & SAMSUNG are lagging
with 42 % & 43% respectively.
100
43 42
0
50
25
100
0%
10%
20%
30%
40%
50%
60%
70%
80%
90%
100%
Apple Samsung Nokia Sony Micromax LG HTC
Repurchase Intentions Not Interested

16 | P a g e
Likability among Smartphone’s users
Figure 9 Consumer- Likability for smartphones
Interpretation:
SAMSUNG still leads the smartphone segment with 31.25% followed by
apple in consumers mind , Blackberry which first came up with the
smartphone device is laaging very behind in the consumers perceptual
space.
Samsung, 31.25Apple, 23.75
Nokia, 11.25
HTC, 4.5 Micromax, 10 LG, 0.16
Sony, 0.03
Blackberry, 13.75
17 | P a g e
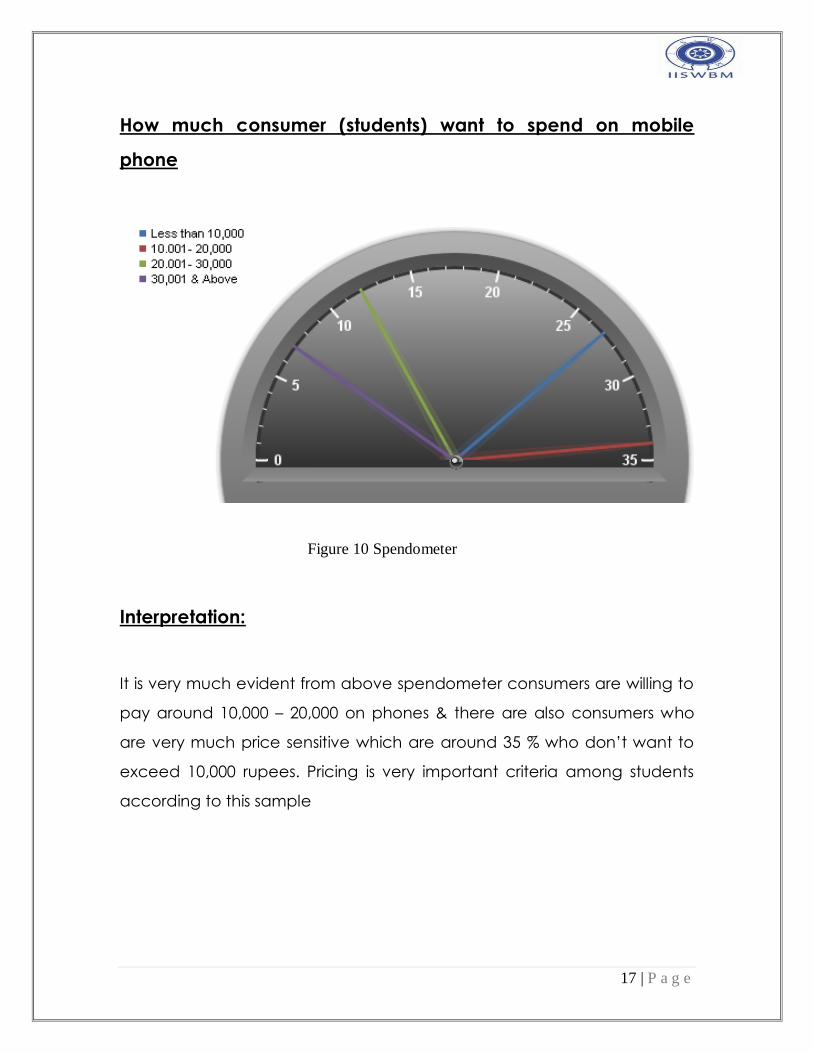
How much consumer (students) want to spend on mobile
phone
Figure 10 Spendometer
Interpretation:
It is very much evident from above spendometer consumers are willing to
pay around 10,000 – 20,000 on phones & there are also consumers who
are very much price sensitive which are around 35 % who don’t want to
exceed 10,000 rupees. Pricing is very important criteria among students
according to this sample

18 | P a g e
Preference over weight , breadth & size of phone among
consumer
Figure 11 Consumer- preferences
Interpretation:
Preference among size ,weight & breadth of mobiles phone is a big
factor for consideration while buying as it’s a portable device , here
consumers prefer having midsized phone which should be light weighted
and when comes people have a mix opinion over slim and thick breadth
phones

19 | P a g e
What is the factor that influence the buyer most
Min Value
Max Value
Average Value
Standard Deviation
Responses
Advertisement 1 5 2.96 1.27 75
Appearance 1 5 4.12 0.95 78
Price 1 5 4.19 0.91 78
Functions 2 5 4.59 0.75 78
Quality 2 5 4.65 0.64 80
Brand Image 2 5 4.06 0.9 78
Service 2 5 4.39 0.76 77
Recommended by Friends 1 5 3.01 1.18 74
Others 1 5 2.7 1.28 60
Figure 11 Buying influencers
0%
20%
40%
60%
80%
100%
120%
140%

20 | P a g e
Interpretation:
Out of the 160 respondents, consumers are mostly influenced by TV
Advertisement & recommendation by friends, word of mouth. Other
factors like Brand Image, Appearances, and Price are sensitive issue while
influencing the buyers.
Effective Media in terms of communicating values
Figure 12 Message Media
Interpretation:
The most effective media for communicating message is Television and
social networking sites for student segment, online shopping sites &
newspaper also used for the same but is not so effective and rest of the
media vehicle is big flop in communicating the message like radio,
billboards, magazine and like.
0
20
40
60
80
24
5848
204
4774

21 | P a g e
4. FINDINGS
Samsung and apple is the most favorite brand of the college
student.
39% student change their mobile phones within 1 to 2 years & 33 %
changes within a year.
43% students are ready to pay for a mobile phone in the range of
Rs. 10,000 to 20,000. This amount is proportional to their family
income.
Mostly students use the mobile phones for SMS, Android gaming &
application, GPS navigation and to access social networking sites.
Students prefer buying phones which provides free handsfree,
Memory card and USB data cable.
Almost all students are aware about the voice recognition, retina
scrolling, air waves charging, etc.
Most favorite brand among the college students is samsung and
the least favorite brand is HTC.
Appearance, Price, Brand Image, recommendation by friend and
advertisement are the important factors for the students while
purchasing mobile phones.
Mostly students prefer slim, low/medium in weight and medium in
size handset
Mostly students see advertisement on television
Mostly students prefer cellphones which supports WASSUP
application.

22 | P a g e
5. RECOMMENDATIONS
Nokia should provide better service and try to solve the hanging
Problem
Samsung being one of the market leader in student segment should
focus on customer retention since consumers repurchase intension
for its envy, Apple is 100% as compared to Samsung.
Company should focus on customer retention since loyalty among
student segment is very low. They should focus on converting
customer to more brand loyal by building a strong brand.
Cellular companies should increase the awareness about the 3G-
4G & other advances internet connectivity services.
Consumer preference for free accessories drives consumer buying
behavior sentiments.
Focus should persist on Android gaming and other advance next
generation applications like play store.
A new feature like waterproofing is becoming a fad amongst
buyers after release of new Sony Xperia smart phone.
Companies should offer more range of Rs. 20,000 - 5000 to cater
student mass.
All companies should adept to innovative technologies to add
more features like voice recognition, retina scrolling, air waves
charging, etc.
Companies should focus on promotional activities through different
media as consumers are more influenced by word of mouth only.
23 | P a g e
6. LIMITATIONS
A small sample size of 160 students is taken, so we cannot draw
inferences about the population from this sample size.
Time period is short and resource constraints.
The scope of the project is limited to the city of Kolkata So, we
cannot say that the same response will exist throughout India.
This study is based on the prevailing student’s satisfaction. But the
student’s satisfaction may change according to time, fashion,
technology, development, etc.
7. BIBLIOGRAPHY
BOOKS:
MARKETING MANAGEMENT - P. Kotler
RESEARCH METHODOLOGY - C.R.Kothari,
Malhotra & Dash
Web Resources:
www.trai.gov.in
http ://www.nokia.com/t-aboutus-ttsl-organization. aspx
http://www.samsung.co
.in/webapp/Aboutus/aboutushome.js
http ://www.LG.com/LG.portal?
nfpb=true&pageLabel=LG Page AboutLG
www.google.com
24 | P a g e
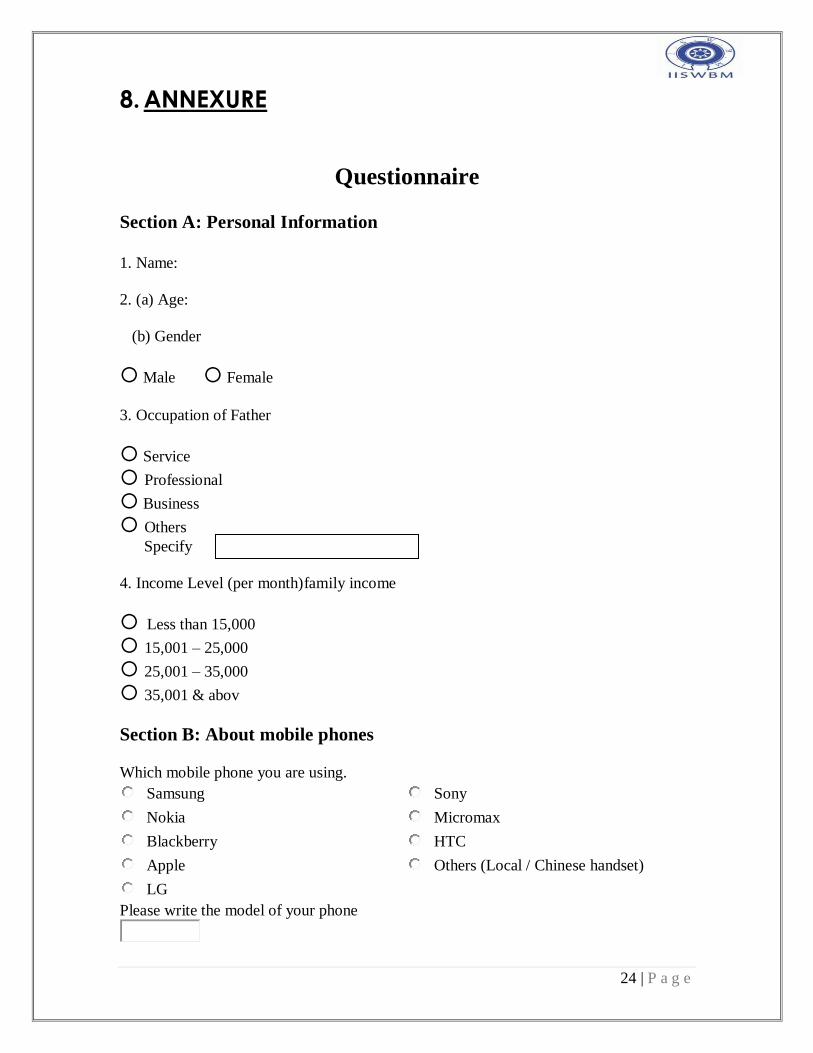
8. ANNEXURE
Questionnaire
Section A: Personal Information
1. Name:
2. (a) Age:
(b) Gender
Male Female
3. Occupation of Father
Service
Professional
Business
Others
Specify
4. Income Level (per month)family income
Less than 15,000
15,001 – 25,000
25,001 – 35,000
35,001 & abov
Section B: About mobile phones
Which mobile phone you are using.
Samsung Sony
Nokia Micromax
Blackberry HTC
Apple Others (Local / Chinese handset)
LG
Please write the model of your phone
25 | P a g e
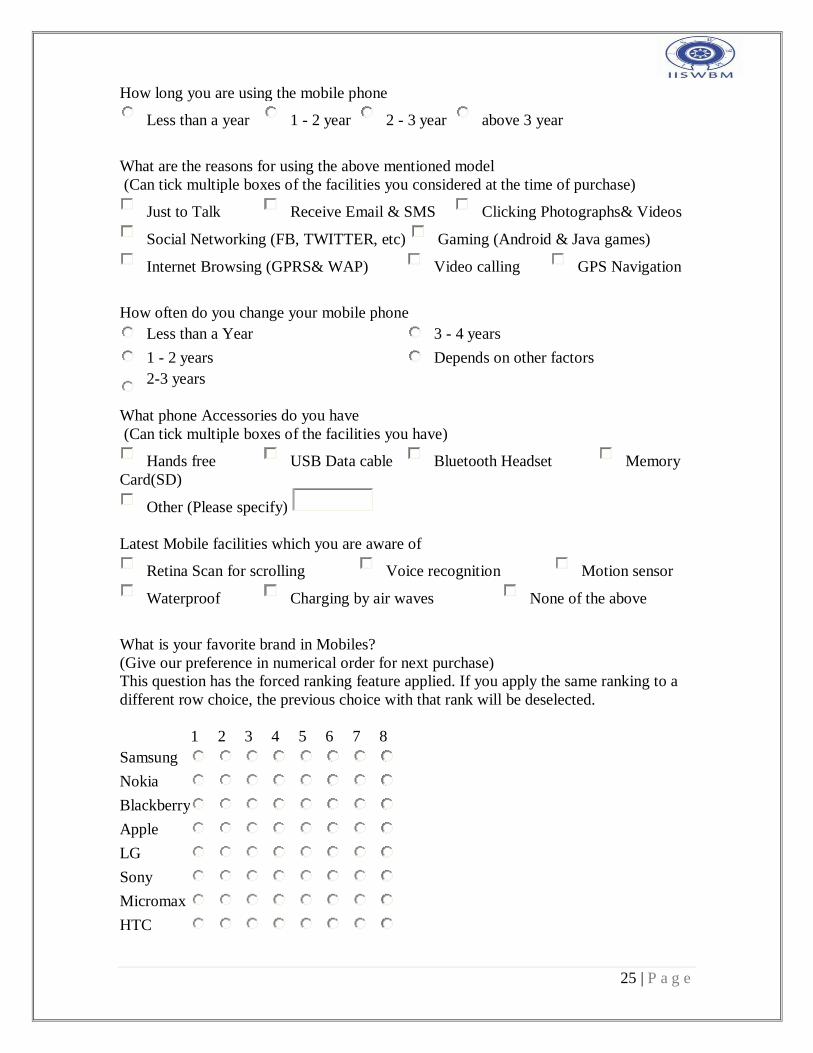
How long you are using the mobile phone
Less than a year 1 - 2 year 2 - 3 year above 3 year
What are the reasons for using the above mentioned model
(Can tick multiple boxes of the facilities you considered at the time of purchase)
Just to Talk Receive Email & SMS Clicking Photographs& Videos
Social Networking (FB, TWITTER, etc) Gaming (Android & Java games)
Internet Browsing (GPRS& WAP) Video calling GPS Navigation
How often do you change your mobile phone
Less than a Year 3 - 4 years
1 - 2 years Depends on other factors
2-3 years
What phone Accessories do you have
(Can tick multiple boxes of the facilities you have)
Hands free USB Data cable Bluetooth Headset Memory
Card(SD)
Other (Please specify)
Latest Mobile facilities which you are aware of
Retina Scan for scrolling Voice recognition Motion sensor
Waterproof Charging by air waves None of the above
What is your favorite brand in Mobiles?
(Give our preference in numerical order for next purchase)
This question has the forced ranking feature applied. If you apply the same ranking to a
different row choice, the previous choice with that rank will be deselected.
1 2 3 4 5 6 7 8
Samsung Nokia Blackberry Apple LG Sony Micromax HTC

26 | P a g e
Why you like the brands you chose above?
(Please indicate the important of below factors when you choose the brands. 5-very
important, 4-somewhat important, 3-neither important nor unimportant, 2-less important,
- 1 - unimportant.)
Advertisement
Appearance
Price
Functions
Quality
Brand Image
Service
Recommended by Friends
Others
Do you prefer phones to be?
Weight Light Medium Heavy
Size Small Medium Large
Breadth Slim Medium Thick
What would you be willing to pay for a mobile phone
Less than 10,000 10.001- 20,000 20.001- 30,000
30,001 & Above
Where did you often see the mobile advertisement?
Television social networking sites
Newspaper outdoor
Magazine online shopping sites
Radio
Are there any general comments you would make about what you like/dislike about
mobile phones?
(This could be pricing, location of sales, reception, colour, memory, or anything else.)