Dissertation 11 22 file - escholarship.org
180
UC Merced UC Merced Electronic Theses and Dissertations Title Approaches To Integrating A HIgh Penertration Of Solar PV and CPV Onto The Electrical Grid Permalink https://escholarship.org/uc/item/6vq9z0mk Author Hill, Steven Craig Publication Date 2013 Peer reviewed|Thesis/dissertation eScholarship.org Powered by the California Digital Library University of California
Transcript of Dissertation 11 22 file - escholarship.org

UC MercedUC Merced Electronic Theses and Dissertations
TitleApproaches To Integrating A HIgh Penertration Of Solar PV and CPV Onto The Electrical Grid
Permalinkhttps://escholarship.org/uc/item/6vq9z0mk
AuthorHill, Steven Craig
Publication Date2013 Peer reviewed|Thesis/dissertation
eScholarship.org Powered by the California Digital LibraryUniversity of California
i
UNIVERSITY OF CALIFORNIA, MERCED
This is the Title of My Dissertation
A dissertation submitted in partial satisfaction of the requirements for the degree Doctor of Philosophy
In
Approaches To Integrating A High Penetration Of Solar PV and CPV Onto The Electrical Grid
By
Steven Craig Hill
Committee in charge:
Assistant Professor Elliott Campbell, Chair
Assistant Professor Yanbao Ma
Associate Professor Jay Sharping
Professor Roland Winston
2013

ii

The Dissertation of Steven Craig Hill is approved, and it is acceptable in quality and form for publication on microfilm and electronically:
University of California, Merced
2013

iv
Acknowledgement
First I would thank my parents Lloyd and Beverly Hill. My mother was a perfect homemaker who always gave kind words of encouragement and always could see the good and potential in us. Dad was a great engineering leader for the United States Steel Corporation who transferred his practical engineering skills to helping neighbors with their landscaping, sprinkling systems, building projects and even animal control problems. Dad has always been the best neighbor I have ever known.
Next I would like to thank my wife Lynn, the light of my life, and son Michael for their sacrifice in putting up with my absence the past six years. I appreciate their loyalty, patience and desire for me to finish the task. I express my love to the rest of the children Andy, Jenny, Rob and Craig and their wonderful spouses Cami, Mark, Amanda and Leanne. They have given me fourteen wonderful grandchildren: Drew, Brady, Addison, McKenna, Samantha, Abigail, Lidia, Molly, Charlotte, Jane, Max, McKenzie, Thomas and Evrett. I hope my effort will motivate them to seek a good education and serve the world well with their learning.
I would like to especially acknowledge and thank Professor Roland Winston, my advisor and mentor. Without him I would have never begun or continued this adventure of the past six years. He inspires me to keep thinking. I express my appreciation to Professor Elliott Campbell, Professor Yanbao Ma, and Professor Jay Sharping for their time in serving on my Committee. Their comments have been very constructive and helpful in focusing my efforts. I also express thanks to Professor Gavilan, Shannon Adamson and Carrie King who have helped me acquire teaching assignments as well as Professor Tom Harmon, Lei Yue and Bob Rice for allowing me to help them teach. I also appreciate the Research Team from UC Merced consisting of” Paul Thompson, Hatem Elgaili, Guadalupe Martinez Chavez, Neekole Acorda, Brian Weikel, Luis Perez,Elizabeth Rivera, and Erika Marie Generoso for all their help in contacting staff of the Waste Water Treatment plant in California.
I would like to thank past working colleagues Joel Yoder and Walt Swain from Westinghouse and Northrup Grumman, Roger Vanhoy and Greg Salyer from Modesto Irrigation District, Larry Gilbertson from Turlock Irrigation District , Jim Pope, Hari Modi, Ron Yuen, Tom Lee and Scott Tomashefsky from Northern California Power Agency and John Carrier from CH2MHill for their comments, encouragement and support.
I express my thanks to Dr. Peter Reischl at San Jose State University who encouraged me to pursue this course twenty years ago and Kaye Larsen, my Provo High School math teacher, who took an interest and motivated me forty five years ago.
v
Abstract
The United States has ample potential renewable energy resources, especially in wind and solar having a combined 15,000 Gigawatts of potential capacity [1,2].
For the past 30 years, California has led the nation in promoting and using energy efficiency programs and has led the nation with the most aggressive Renewable Portfolio Standard (RPS) goals. Energy efficiency and demand response programs are key strategies for addressing climate change and meeting AB 32 (California ‘s 33% RPS law ). RPS goals have been adopted by 43 states that require on average 20% of energy delivered to customers by 2020 by from renewable resources [140].
Solar cost reductions, increasing cost of traditional resources, and Renewable Portfolio Standards have created the possibility of significant levels of distributed solar generation being installed on the grid and specifically, the distribution system [127]. Federal law requires grid modernization to enable an increased dependency on variable and distributed energy resources [143]. This means that existing market and grid control systems, based on traditional centralized resources and one-way distributed power flows, require new operational paradigms, systems architectures and market structures. California’s utility rate design and the NEM program for rooftop solar will also require future changes.
Land use challenges, both local and remote, may lead to new applications of installing solar PV on water. Studies performed by the California Transmission Planning Group (CTPG) have shown the proposed “high potential” transmission upgrades may be insufficient, by themselves, to allow California to meet its 33% RPS goal. Because integrating a high penetration of distributed resources on to the distribution network is evolving with its own unique challenges, a floating water-borne solar PV design is discussed to assist in bridging the gap to assist in meeting RPS goals, energy efficiency goals and the Governor’s goal to achieve 12,000MW of distributed generation in California. The floating water-borne PV system is capable of installation on waste water treatment plant (WWT) settling ponds. California has more than 800 WWT plants and estimates predict floating water-borne PV on WWT ponds could potentially generate greater than 1000 MW without the need to build additional transmission.

vi
Table of Contents
1.0 Introduction ................................................................................................. 1
2.0 Challenges and Opportunities for Integrating Solar PV into Resource Portfolios to meet California’s RPS goals ............................................................. 6
2.1 Regulation and POlicy Challenges for solar PV .......................................................... 6
2.1.1 Utility Rate Design and NEM .................................................................................... 7
2.1.2 Exclusion of Rooftop Solar PV from RPS Eligibility ................................................... 9
2.1.3 Distribution Reliability Problems ........................................................................... 10
2.2 High PV Penetration on Utility Distribution Systems ............................................... 12
2.2.1 Limitations Due To Clouds ..................................................................................... 12
2.2.2 Voltage Regulation ................................................................................................. 15
2.3 The Land Challenge for Solar ................................................................................... 15
2.4 A LOCAL PV DEVELOPMENT OPTION‐ A BRIDGE TO THE FUTURE ............................. 20
2.5 Specification for a Water‐borne System .................................................................. 22
2.5.1 Design for Life Cycle Cost ....................................................................................... 23
2.5.2 Structure ................................................................................................................ 23
2.5.3 Cabling .................................................................................................................... 24
2.5.4 Tracking .................................................................................................................. 24
2.5.5 Reliability and warranty ......................................................................................... 24
2.5.6 Electrical, Controls & Protection ............................................................................ 25
2.5.7 Maintainability ....................................................................................................... 26
2.5.8 Performance Tests ................................................................................................. 26
2.5.9 OTHER .................................................................................................................... 26
3.0 Floating Water-Borne PV application Consideration for Utility Application in California ............................................................................................................ 28
3.1 Waste Water Treatment Plants ............................................................................... 28
3.1.1 Activated Sludge .................................................................................................... 28
3.1.2 Fixed‐Growth Biological Systems ........................................................................... 29
3.1.3 Oxidation Ponds ..................................................................................................... 29
3.2 Floating Water‐Borne CPV System .......................................................................... 30
3.3 ALGAE IN WASTE WATER TREATMENT .................................................................... 31
vii
3.4 Potential for CPV Water‐Borne Systems .................................................................. 35
3.5 Validation of the Water‐Borne System .................................................................... 37
4.0 Cost Benefit Validation for Water-Borne CPV System .............................. 39
4.1 Cost Benefit Analysis Background and Perspective ................................................. 40
4.2 Cost Benefit Analysis Requirement ......................................................................... 40
4.3 Cost Benefit Steps ................................................................................................... 41
4.4 Cost Benefit Application for a PV Water‐Borne System ........................................... 42
5.0 Power System Integration Studies for Larger Solar PV Installations Connected to Transmission Lines ...................................................................... 44
5.1 Power Flow Analysis Methodology ......................................................................... 46
5.1.1 Steady State Power Flow Analysis ......................................................................... 46
5.1.2 Short Circuit Duty Analysis ..................................................................................... 47
5.1.3 System Protection Analysis .................................................................................... 47
5.1.4 Reactive Power Deficiency Analysis ....................................................................... 47
5.1.5 Dynamic Stability Analysis...................................................................................... 49
5.1.5.1 Dynamic Modeling ............................................................................................. 50
5.1.6 Substation Evaluation ............................................................................................ 50
5.1.7 Transmission Line Evaluation ................................................................................. 51
5.2 CTPG Study Results ................................................................................................. 51
5.3 Summary of Power Flow and Application White Slough WWT ................................ 53
6.0 High PV Penetration Impacts on Utility Distribution Systems ................... 54
6.1 Managing Energy Flows to Improve System Value .................................................. 54
6.2 Solar photovoltaic Distributed Energy Resources (DER) Integration Assessment ..... 56
6.2.1 Interconnection Standards and Guides ................................................................. 56
6.2.2 Distribution System Modeling ............................................................................... 56
6.2.3 Modeling Algorithms and Networks ...................................................................... 58
6.3 Control of Photovoltaic generators in a Distribution Network ................................. 60
6.3.1 Control of Utility Interactive Inverters ................................................................... 60
6.3.1.1 Maximum Power Point Tracking ........................................................................ 60
6.3.1.2 Grid Synchronization .......................................................................................... 60
6.3.1.3 Anti‐Islanding ..................................................................................................... 61

viii
6.3.2 Current Regulation ................................................................................................. 62
6.3.3 PWM ...................................................................................................................... 63
6.3.4 Desired PV Inverter Features ................................................................................. 63
6.4 Off‐Grid (Stand‐Alone) PV Power System Control ................................................... 65
6.5 Future Power System Control ................................................................................. 66
6.5.1 Control Framework ................................................................................................ 69
6.6 Transition in Control Strategy for increased Penetration ......................................... 70
6.6.1 CASE Study optimization based on cooperative control ....................................... 72
6.6.1.1 Communication Topology .................................................................................. 72
6.6.1.2 Case Study Results ............................................................................................. 73
6.6.2 Other Future Distribution System Configurations and Characteristics ................. 74
7.0 Summary and Future Work ....................................................................... 75
7.1 Future Research ...................................................................................................... 76
References ......................................................................................................... 82
Appendix A Concentration and Efficiency in Solar Photovoltaic Applications 101
A.1 Background .......................................................................................................... 101
A.2 Nonimaging Optics ............................................................................................... 104
A.3 FRESNEL LENS DESIGN .......................................................................................... 108
A.3.1 Minimum Deviation ............................................................................................. 109
A.3.2 Nonimaging Fresnel Lens Design ......................................................................... 114
A.3.3 Flux Density .......................................................................................................... 115
A.3.4 Solar Disk Size and Brightness .............................................................................. 117
A.3.5 Refractive Indices ................................................................................................. 119
A.3.6 Spectral Color Dispersion ..................................................................................... 120
A.3.7 Summary of Fresnel Lens Concentrators For Photovoltaic Applications ............. 121
A.4 Concentrator Cell Efficiency .................................................................................. 122
A.5 Geometrical Losses ............................................................................................... 124
A.6 Multijunction Devices ........................................................................................... 124
A.5.1 Device Architectures ............................................................................................ 128
A.7 Metal Semiconductor Contacts ............................................................................. 129
A.8 Principles of operation under concentrated Sunlight ............................................ 131

ix
A.9 Nonimaging Secondary Concentrators for Photovoltaic Applications .................... 135
A.10 Environmental Testing and Reliability .................................................................. 136
Appendix B Waste Water Treatment Plants in California .............................. 137
Appendix C Grid Synchronization, PI Control and the DQ Transformation ....... 150
Appendix D PWM Techniques .......................................................................... 157
Appendix E Solar Storms and Effect on the Grid .......................................... 165
x
List of Figures
List of Figures ................................................................................................................................... x
Figure 2.1 Renewable Energy Zones in California .......................................................................... 17
Figure 2.2 Potential Renewable Energy Zones in Southwestern U.S. ............................................ 18
Figure 3.1 Floating CPV Modules ................................................................................................... 31
Figure 3.2 DNI for the Lodi ............................................................................................................. 34
Figure 3.3 Aerial view of the Lodi Energy Center and the Lodi White Slough Facilities. ............... 35
Figure 3.4 Pyron Solar’s Water‐Borne CPV Prototype at SDG&E Test Site .................................... 37
Figure 5.1 Transmission Map near LEC .......................................................................................... 45
Figure 5.2 Equivalent Circuit for modeling .................................................................................... 49
Figure 6.1 Model of Inverter connections to grid .......................................................................... 61
Figure 6.2 Market mechanisms in feedback control loop ............................................................. 69
Figure 6.3 Control Architectures .................................................................................................... 71
Figure A.1 Relationship between sun and earth .......................................................................... 102
Figure A.2 Concept of and maximum 2D concentration .............................................. 105
Figure A.3 Conceptual illustration of Fresnel lens ....................................................................... 108
Figure A.4 Fresnel lens details ..................................................................................................... 109
Figure A.5 Maximum Deviation Prism ......................................................................................... 110
Figure A.6 Dispersion of a prism .................................................................................................. 111
Figure A.7 Demonstration of f‐number ....................................................................................... 114
Figure A.8 Cosine loss .................................................................................................................. 116
Figure A.9 Flux Density factor ...................................................................................................... 117
Figure A.10 Brightness distribution of solar flux .......................................................................... 118
Figure A.11 Flux density factors for non‐imaging Fresnel lens .................................................... 118
Figure A.12 Refractive indices BK 7 glass & PMMA ..................................................................... 120
Figure A.13 I‐V characteristic of solar cells .................................................................................. 123
Figure A.14 Efficiency histograms of last 5 generations of terrestrial cells ................................. 125
Figure A.15 Planned improvement in economics of multijunction cells ..................................... 126
Figure A.16 Contour map showing cost with improvements in cell efficiency............................ 127
Figure A.17 Epitaxial structure improvements ............................................................................ 129
Figure A.18 Curves for cell fill factor and efficiency as a function of concentration ................... 132
Figure A.19 Maximum power efficiency vs. concentration ......................................................... 133
Figure A.20 Open Circuit voltage vs. temperature and concentration ........................................ 133
Figure A.21 Open circuit temperature coefficients vs. concentration ........................................ 134
Figure C‐1a Clarke’s Transformation............................................................................................ 151
Figure C‐1b Park’s Transformation .............................................................................................. 152
Figure C‐2a VSI Power Topology .................................................................................................. 153
Figure C‐2b Equivalent Circuit for the VSI .................................................................................... 153
Figure C‐3 Cross‐coupling of the d & q components ................................................................... 155

xi
Figure C‐4a Current control of VSI feed‐forward decoupling method ........................................ 156
Figure C‐4b Feed‐forward decoupling block ................................................................................ 156
Figure C‐5a Current Control of VSI Feedback decoupling method .............................................. 156
Figure C‐5b Feedback decoupling block ...................................................................................... 156
Figure D‐1 Topology three‐leg voltage source inverter ............................................................... 158
Figure D‐2(a) Topology V1(pnn) of voltage source inverter ........................................................ 158
Figure D‐2b Zero output voltage topologies ................................................................................ 158
Figure D‐3 zero voltage vectors in the , plane ........................................................................ 159
Figure D‐4a Output voltage vector in the , plane ................................................................... 159
Figure D‐4b Output line voltages in the time domain ................................................................. 160
Figure D‐5 Synthesis of required output voltage in sector 1 ....................................................... 160
Figure D‐6 Phase gating signals for SVM2 Symmetric Sequence ................................................. 161
Figure D‐7 Space Vector Modulation Divisions and Positions ..................................................... 162
Figure D‐8 3 phase NPC Circuit .................................................................................................... 164
Figure E.1 Salem N.J. Nuclear Plant GSU Transformer Damage .................................................. 166
Tables
Table 2.1 Cost PacifiCorp’s Gateway Central Line ............................................. 19
Table 2.2 Target Budget ..................................................................................... 26
Table 4.1 NCPA Member Waste Water Treatment Plants .................................. 39
Table 4.2 Floating CPV Benefit to Cost Ratios ................................................... 43
Table A.1 Work Function for metallic contacts.................................................. 130

xii

1
1.0 INTRODUCTION
The United States has ample potential renewable energy resources. Land-based wind, the most readily available for development, totals more than 8000 GW of potential capacity. The capacity of concentrating solar power is nearly 7,000 GW in seven southwestern states [1][2]. The generation potential of photovoltaic (PV) resources is limited only by the land area devoted to it, 100-250 GW/100 km2 [1][2]. The challenge is how to utilize these potential resources in an economical and reliable manner.
According to a recent solar development project in the California’s central valley it takes about 154 acres to produce 25 MW of solar PV (about 6 acres/MW). An idea presented in this dissertation describes how a water-borne solar application can decrease the area to 3 acres/MW and potentially generate greater than 1000 MW of power by floating PV on the ponds of Waste Water Treatment plants in California.
A challenge with solar PV is the amount of valuable land it requires for installation unless it is mounted on rooftops or unless it is remotely located in areas where the solar irradiance is high, but where the land is worth much less. Also when many PV generators are concerned, there is a relationship between the land occupation and energy yield; increasing land occupation reduces mutual shading and therefore increases energy yield, however it comes with an additional price because of the extra land required. Hence, the study of the relationship between land occupation and energy yield is a key point in the design of larger PV plants.
Chapter 2 will discuss the land use issues including: 1-an introduction to the problem with integrating a high penetration of rooftop solar PV onto the grid 2- the issues of connecting to remotely located renewable resources including permitting challenges and transmission construction costs 3- An introduction to a water-borne solar PV application that can effectively reduce or mitigate the issues of high local penetration and remote access to renewable resources. The water-borne application is presented to reduce the land use problem associated with PV, develop localized renewables, and improve energy efficiency all of which help reduce the amount of long distance transmission required to import renewable energy sources.
Solutions to these challenges and opportunities is largely motivated by how utilities are going to meet the aggressive state renewable portfolio standards (RPS) and energy efficiency goals in a cost effective and timely manner. For the past 30 years, California has led the nation in promoting and using energy efficiency programs. Energy efficiency and demand response programs are key strategies for addressing climate change and meeting AB 32 goals for greenhouse gas emissions as explained in the CEC 2011 Integrated Energy
2
Policy Report [10]. The Energy Commission has coupled energy efficiency with promotion of solar photovoltaic systems through its New Solar Homes Partnership. According to the Association, solar is the fastest-growing clean energy technology available today.
The electric utility industry has been transitioning for over 30 years in terms of increasing diversity and distribution of resources. To date, 43 states representing more than 80% of the US population have enacted renewable portfolio standards or goals that require on average 20% of energy delivered to customers by 2020 [140]. The positive results are environmentally cleaner resources, better utilization of the grid and more efficient use of electricity by customers. However, as a consequence the grid has become increasingly complex and stressed by the variability that has been introduced by intermittent wind and solar photovoltaic (solar PV) resources and this is expected to increase with millions of distributed energy resources (DER) [113].
Energy efficiency programs are a top priority of the CEC and new project permits must address energy efficiency as a project alternative as part of the approval process. The California Long-term Energy Efficiency Strategic Plan, published in 2008 and updated in 2011 by the California Public Utilities Commission (CPUC), sets ambitious efficiency goals for the state. A core focus of the Strategic Plan is continued engagement with the broader stakeholder community, including manufacturers, contractors, local governments and others. The Plan addresses several main sectors: Residential, Commercial, Industrial and Agricultural.
The industrial sector provides great opportunity for achieving energy efficiency savings and other benefits such as greenhouse gas (GHG) reductions through resource management. Playing major roles in both driving California’s economy and consuming energy, industrial users account for 16 percent of electricity use, 22 percent of energy use (33 percent of natural gas use alone) and 20 percent of end-use CO2 emissions in the state [12]. Chapters 2 and 3 will discuss a water-borne PV application for Waste Water Treatment (WWT) plants and its potential role in meeting California’s RPS and energy efficiency goals. Chapter 4 will discuss cost benefit analysis and the application of such an analysis to a water-borne PV system. The water-borne application is presented to reduce the land use problem associated with PV, develop localized renewables, and improve energy efficiency all of which help reduce the amount of long distance transmission required to import renewable energy sources.
The California Transmission Planning Group (CTPG) consisted of a group of electric utility planning engineers from the major utilities throughout the state of California. A major purpose of the CTPG studies initiated in mid-2009 was to examine potential corridors for new transmission lines to transport renewable energy resources in order to meet RPS goals and achieve GHG reductions and to provide a foundation for a state-wide transmission plan to identify the

3
transmission infrastructure needed to reliably and efficiently meet the state’s 33% Renewable Portfolio Standard (RPS) goal by the year 2020 [15][16][17][18].
The CTPG utilized the GE Positive Sequence Load Flow (PSLF) software
and base cases established the Western Electric Coordinating Council (WECC), the National Renewable Energy Laboratory (NREL) and the California Transmission Planning Group (CTPG) to perform various studies in California and the Western United States. These studies were to analyze and determine the most probable sites where significant amounts of wind and some solar might be integrated and the effect it would have on the reliability and stability of the transmission grid in the region. Because of the complexity of the study effort, a phased approach was undertaken by the CTPG [15]. Some of the significant findings of these studies are summarized in Chapter 5. Chapter 5 will also discuss the methodology for conducting these transmission planning studies.
The CTPG study results indicate that building new transmission lines
alone (assuming they can be permitted and built) will not solve California’s mandatory RPS requirements [15][16][17][18].
In addition to the CTPG findings, a couple of other points should also be
considered when thinking about integrating solar and other renewable resources onto the electrical grid:
1. The recent FERC Order 1000 regarding cost allocation has introduced
some challenges for public utilities involved with transmission planning and construction. This may spur more local resource development [19].
2. Caltech research suggests that adoption of solar PV in California could
reach between 15%-50% by 2020 [140]. Although small penetrations of renewable generation on the grid can
generally be smoothly integrated, higher PV penetrations can be problematic and a one size fits all answer does not apply [112]. Chapter 6 will cover various examples and studies [21, 112] that specifically address this problem and potential solutions of integrating a high penetration of solar onto distribution networks.
A 21st century grid (transmission and/or distribution) will have to balance
fluctuating power flows from wind and solar generation, small-scale distributed sources, and quite possibly plug-in electric vehicles. The increasing penetration of renewable resources brings new challenges including technical issues, power quality, reliability and security as well as other non-technical issues.

4
These challenges are compounded by utility industry structure and California regulatory structure [11] and problems that the renewable energy industry has in technically integrating and seamlessly operating renewable sources on the grid.
Much of the grid is at or approaching the end of its expected life. The
Brattle Group estimated transmission and distribution infrastructure investment could reach nearly $1 trillion through 2030 in the U.S. [140]. Federal law requires grid modernization to enable an increased dependency on variable and distributed energy resources [143]. This means that existing market and grid control systems, based on traditional centralized resources and one-way distributed power flows, require new operational paradigms, systems architectures and market structures.
The transformation of the grid is the most ambitious reconstitution since its inception more than a century ago and the change will pose serious challenges affecting all of society. This is happening worldwide due largely to legislation and regulatory mandates to increase renewable energy in response to concerns about global warming, air pollution and peak oil prices. Maintaining grid stability, reliable energy supplies and affordability will require solutions in technology, public policy, markets, data communications and public understanding.
It is worth a quick mention that solar storms also have an impact on the stability and reliability of the electrical grid. It is interesting the application and implications that Liousville’s theorem, the same theorem that expresses the conservation of the generalized along the ray path for an optical system, and an important principle in understanding solar concentration (reference Appendix A), has on the apparent brightness temperatures of solar radio bursts to the propagation of radio waves through the solar corona, [9] useful in understanding solar storms. Solar storms can and have caused damage to the electrical grid and its components. While not the subject of this Dissertation, this is mentioned for the sake completeness in understanding the potential reliability issues and impacts that solar phenomena can have on the grid. This issue is receiving considerable attention by the Federal Energy Regulatory Commission (FERC), the National of Electrical Reliability Corporation (NERC) and the utility industry as explained further in Appendix E.
Chapter 7 will provide a summary and future work and research that needs to be done.
In summary this Dissertation is to provide the following contributions:

5
1. Provide a background to motivate policy change and present a new and creative solution that provide increased distributed generation, improve energy efficiency, increase renewable energy reliably without the need for additional transmission and help meet AB32.
2. Provide an integrated source of information, or reference for engineers, managers, legislators, and regulators involved with integrating renewable energy, particularly photovoltaic systems, into the electrical system.
3. Describe the limitations in integrating a high penetration of solar PV onto the grid and addresses some potential solutions and further studies that are required.
4. Discuss the potential issues facing rooftop solar installations. 5. Discuss the flaw of omitting grid reliability from RPS policy. The
separation of RPS and CSI legislation creates a reliability gap as well as RPS gap.
6. Provide a solution to land use issues for larger PV installations by proposing a water-borne installation. Appendix A describes the principles behind a concentrated PV system (CPV). Chapter 2 contains a high level specification for developing water-borne PV independent of technology and provides a cost target and budget to motivate more rapid development and deployment of such systems.
7. Provide a water-borne PV system application to Waste Water treatment (WWT) plants in California. Such an application will be relatively easy to permit, improve plant efficiency, and contribute to the Governor’s distributed generation goal. Potential conflicts of harvesting algae in WWT facilities will be examined.
8. Motivate policy development for the development for water-borne PV systems and integration of PV onto distribution networks.

6
2.0 CHALLENGES AND OPPORTUNITIES FOR INTEGRATING SOLAR PV INTO RESOURCE PORTFOLIOS TO MEET CALIFORNIA’S RPS GOALS
2.1 REGULATION AND POLICY CHALLENGES FOR SOLAR PV
Four state-level entities are responsible for major aspects for California’s electricity structure: the California Public Utilities Commission (CPUC), the California Air Resources Board (CARB), the California Energy Commission (CEC), and the California Independent System Operator (CAISO). The CPUC and CEC are the two primary state agencies responsible for implementing programs to encourage the development, installation and purchase of renewable electricity; however the CAISO has also expanded its activities with various initiatives relating to renewable and distributed resources. This creates some problems and challenges because California has no single agency, law, regulatory decision, or document that describes all policies and programs for the development of renewable power resources.
Data compiled by the CPUC shows total statewide expenditure on electricity costs will grow by nearly 50% between 2010 and 2020. Of these forecasted costs, the largest share is for new transmission and distribution (much of which is driven by renewable needs), the second largest is for renewables, and the third is for new fossil fuel-related costs [11].
In January 2006, the CPUC adopted a program- the California Solar Initiative (CSI) - to provide more than $3 billion in incentives for solar projects with the objective of achieving participation levels accounting for 3,000 MW of solar capacity by 2017. Senate Bill 1 was signed by the Governor in August 2006, expanding the CSI to include publicly-owned utilities with a total ratepayer –funded budget of $3.5 billion. As of May of this year 968 megawatts have been installed on existing homes, businesses and other buildings. This program’s goal is achieve 1,940 megawatts by the end of 2016 [11].
The issues with rooftop solar PV in California are:
1) Utility rate design and NEM; 2) Exclusion of rooftop solar PV from renewable portfolio standard (RPS)
eligibility; and 3) Distribution reliability problems due to future high penetration levels of
solar PV and distributed generation.

7
2.1.1 UTILITY RATE DESIGN AND NEM
Net energy metering (NEM) has been a core public policy credited with California’s leading market success in the installation of solar PV generation, and it has been adopted in 43 U.S. states. Net metering is a billing arrangement for customers who install on-site renewable distributed generation, typically solar PV that is interconnected to the grid systems. Simply stated, with NEM, the customer’s meter runs both forward and backward, and at the end of the billing period the customer pays for the net energy used, or receives a credit at the retail rate if more energy is produced than consumed. If the customer did not export power to the grid and 100% of PV generation was consumed on-site, there would be no need for NEM. The California legislature restricted the CPUC’s ability to set cost-based rates as a result of the failed deregulation attempt leading to California’s electricity crisis. Low tier rate caps enacted during the crisis limit electricity rate increases, despite growing costs, for low-usage and low-income residential customers. Independent Owner Utilities’ (IOUs-such as Pacific Gas & Electric (PG&E), Southern California Edison (SCE) and San Diego Gas &Electric (SDG&E)) customers who are economically able to install PV panels on their home rooftops can use the NEM program to effectively opt out of rate increases for higher electricity tiers, despite potential heavy consumption, and instead receive electric service at the protected low-tier rates net of their self-generation. California IOU residential rates have a four-or five tiered pricing structure that increases the per unit rate above certain monthly consumption thresholds. The current rate design means that heavy users effectively cross-subsidize low-usage customers. Though current policies are encouraging rapid PV deployment in the short term, the rate imbalances being created could be limiting the broader, market-driven scale-up of these key technologies by aligning utility and consumer interests against them. Regulators must ensure that customer rates are both “just and reasonable” and utilities are concerned about not only the rate impact from NEM but also the erosion of their revenue streams.
The California Investor Owned Utilities (PG&E, SCE and SDG&E) and others contend that NEM causes a significant cost shift from customers who install solar to other, non-participating ratepayers [21]. Severin Borenstein, the E.T. Grether Professor of Business and Public Policy at the Haas School of Business, U.C. Berkeley, and the Director of the U.C. Energy Institute, stated at a California Energy Commission hearing (May 2012) that the “fundamental

8
problem isn’t net metering, but rather marginal prices that greatly exceed marginal cost”.1
The challenge in the Commercial and Industrial (C&I) markets is to reduce the use of rate design elements such as demand charges that solar customers cannot easily avoid, which undervalue the avoided-cost benefits of NEM exports to the grid. Removal of these rate design barriers in the C&I market would hasten the day when solar is cost-effective for participants in the C&I market without significant tax credits or other direct incentives. The California Public Utilities Commission (CPUC) interpreted California’s statutory 5% cap on NEM systems to allow more than 5,000 MW of NEM systems allowing significant growth in the solar market beyond the 2,300 MW of PV systems that will be installed in the IOU service territories under the CSI. However, at the same time the CPUC also announced that it would suspend NEM as of the end of 2014 unless it has developed new rules for NEM prior to that date.2
Most legislation for net metering programs place caps on enrollment. In the absence of changes to inverter design or distribution system architecture, as the penetration of PV and distributed generation increases, future solar PV customers will likely face alternate metering strategies or limits on supply of power to the grid [88]:
1. Net meters may be replaced with dual meters, which allow the utility to apply one rate for power supplied to the customer and a lower rate for power provided by the customer. Alternatively, net meters may be replaced by meters that only turn one way, giving no credit for power supplied to the grid.
2. Time-of-use rates (TOU) may be imposed. TOU rates were briefly
imposed on new, net-metered, residential solar system in California. The high rates for power from sunset to 9 pm greatly reduced the
1 Severin Borenstein, “Rate Design and Renewables,” presentation to the May 22, 2012 Lead Commissioner Workshop on Renewable Energy Costs for the 2012 Integrated Energy Policy Report Update (CEC Docket #12‐IEP‐01), at Slide 8. Available at http://www.energy.ca.gov/2012_energypolicy/documents/2012‐05‐22_workshop/presentations/05_Borenstein_UC_Berkeley_2012‐05‐22.pdf 2 See CPUC Decision No. 12‐05‐036, issued May 24, 2012
9
value of PV systems, and demand for new systems declined rapidly. Interesting that study results shown in [21] suggest that encouraging more residential NEM customers to adopt TOU rates would increase NEM benefits to non-participating ratepayers.
3. As deployment of distributed PV systems increases, many customers are likely to be subject to time-of -use rates and demand charges, and will be paid less for energy delivered to the utility at a particular time of day than they will be charged for energy delivered by the utility at that same time [88].
4. VAR reactive power charges are likely to be imposed on users unless PV generation can supply the VARs (unit for reactive power) at the source.
2.1.2 EXCLUSION OF ROOFTOP SOLAR PV FROM RPS ELIGIBILITY
The second solar PV problem in California is that while many of California’s renewable programs procure power that is “RPS eligible” – the power that counts towards the 33% RPS requirement – other programs are “RPS ineligible,” either because the energy produced under the program is difficult to measure or because it is not purchased by a utility directly. One example of an ineligible program is the previously mentioned California’s Solar Initiative program (also known as the “Million Solar Roofs” program), which subsidizes the cost of installing rooftop solar panels. While the renewable energy PV production that is on the customer side of the meter reduces the amount of energy that the customer purchases from the utility, and thus lowers the utility’s overall RPS obligation (which is based on system-wide energy usage), utilities must still plan for the total amount of RPS renewable (intermittent) energy on their system. The CEC has estimated that as of 2011, there were 127,000 customer-side solar projects; totaling roughly 1,300 MW [11] (not counted towards RPS).
The intermittent nature of renewable energy sources presents both planning and operational challenges for a utility. It is essential for grid reliability

10
to account for all renewables regardless of what program they may fall under. This will become increasingly more important as penetration levels of these resources continue to increase. Current regulatory policy does not address this reliability impact caused by the high penetration levels of distributed generation including solar PV on to the electrical grid. It should also be pointed out that the NERC (North American Electric Reliability Corporation) Reliability Standards approved by the by Federal Energy Regulatory Commission (FERC) also do not currently address this potential problem.
2.1.3 DISTRIBUTION RELIABILITY PROBLEMS
Renewable Portfolio Standards have created the possibility of significant levels of distributed solar generation being installed on distribution systems contributing to instabilities and possibly unsafe operations due to one or several of the following design and operational characteristics [88].
The third solar PV problem (including other distributed generation) deals with the issue of high and maximum penetration of these resources on the grid before reliability and stability problems are encountered.
There are utility concerns that a high penetration of inverter-based solar energy systems along with other distributed generation sources on distribution lines will contribute to instabilities and possibly unsafe operations due to one or several of the following design and operational characteristics [88]:
1. Because PV energy production does not always coincide with the times when it is most economical for utilities to use it, it can negatively impact utility operating economics.
2. From the utility perspective, net-metered, flat rate customers, especially those whose net demand approaches zero, do not pay a fair share of their costs as discussed above.
3. Power production from an individual PV system may increase or decrease rapidly due to cloud passages. In most cases, the rate of change of the collective output from PV systems will be moderated by the geographic dispersal of the systems. However, in a case where
11
the service area is relatively small and where rapid weather changes can occur, PV output power can change dramatically. Measurements by Tucson Electric Power show that a rapidly-passing cloud bank can essentially eliminate all solar generation across Tucson in less than 5 minutes, thus increasing the increased need and control of spinning reserves.
4. The addition of a large numbers of inverters has shown to increase the probability of islanding, during which inverters continue to supply local loads after a utility fault [88, 114]. Inverters are limited in their ability to introduce high levels of short
circuit current, but the addition of large systems or many small systems can sum to large short circuit currents.
Utility protection relays are designed to detect a fault. The relays briefly disconnect to allow the line to clear, and then reconnect to provide continuing service. If islanding detection fails and inverters remain on line then the inverters may 1- be damaged by the reconnect 2- continue to supply current to maintain the fault 3-cause safety issues because of power being supplied to the load side of disconnects of downed power lines.
5. Large power flow into distribution systems that were designed for one-way flow may impact regulation and protection. The following potential issues have been identified due to the effects of high penetration of PV and other distributed generation on distribution system operation: Reverse power flow can interfere with voltage regulation. High PV
penetration power downstream from the voltage regulation system on a radial line will make line loading appear to be low. Power injected just downstream of voltage regulation will
cause customers at the end of the line to experience low voltage
Power injected near the end of the line, will cause high voltage to occur at that point
Fuses protect the current carrying capability of a line, but injection of power downstream from the fuse will not be detected, leading to the potential for overload.
Power electronics of the inverters inject higher order harmonics that may interfere with distribution equipment without the additional cost of filtering.
Phase to neutral overvoltage will be worsened with high penetration of PV distributed systems due to 1- no dispatchability or interactive control 2- disproportionate installation on single phase systems.

12
2.2 HIGH PV PENETRATION ON UTILITY DISTRIBUTION SYSTEMS
Maximum renewable penetration on the grid is effected by voltage stability, dynamic stability, economic stability, but each can cause a different level of penetration. Stability effects due to clouds and voltage regulation and their effects on network stability and reliability will be discussed in this section.
2.2.1 LIMITATIONS DUE TO CLOUDS
PV cloud effects on voltage stability have been investigated mainly in either a large scale transmission level or an individual unit control with a simple network. Yun Tiam and Kirschen [122] implemented a PV reactive power control method for voltage regulation to deal with voltage fluctuations during large irradiation changes, but it is still at a transmission level. Low voltage distribution networks have their special characteristics namely: unbalanced nature, line drop compensation, dynamic loads (small induction motors and thermostats), high R/X ratio, etc. Steady and reliable performance in a large-scale transmission system does not necessarily mean the same performance can be achieved in a geographically small distribution system [87, 110, 123]. The following scenarios listed below show the effect of clouds on several different distribution networks.
One of the first issues studied was the impact on power system operation caused by PV system output fluctuations due to cloud transients at a central-station plant. A 1985 study [103, 164] in Arizona examined cloud transient effects where PV was deployed at a central station plant and found that the maximum tolerable system level penetration of PV was approximately 5%. The limit was imposed by the transient following capabilities (ramp rates) of the conventional generators. Another paper published in that same year [124] about the operating experience of the Southern California Edison central station PV plant at Hesperia, California, reported no such problems, but suggested the plant had a very stiff connection to the grid and represented a very low PV penetration level at its point of interconnection.
Cloud cover or shading levels are the main reasons for solar ramping and produce the fastest ramp rate output power fluctuation. One needs to know how
13
many types of cloud patterns exist, the shadowing coverage area, the cloud height, and optical transmission rates, in addition to the speed at which the clouds are moving [125, 20]. Studies have shown that squall line clouds and cumulus clouds produce the worst problems for PV. The squall line type, described as a solid line of dark clouds, produces almost a complete loss of PV generation. Conversely, cumulus types, which are faster moving and more well-defined with clear skies between them, in turn producing less ground shading area, produce a smaller percentage loss of PV output but at a much more random rate of change. This may be worst case since voltage regulation devices may not have time to operate. The intermittency caused by cumulus clouds is much less predictable than the squall line clouds. Sources available that will predict cloud coverage over a defined area are found in references [125, 20].
In 1988, a study dealt with voltage regulation issues with the Public Service Company of Oklahoma system when clouds passed over an area with high PV penetration levels, when the PV was distributed over a wide area (south Tulsa, Oklahoma) [103, 105]. At penetration levels of 15% cloud transients caused significant but solvable power swing issues at the system level, and thus 15% was deemed the maximum system-level penetration.
Another cloud transient study was released in March 1990 [106]. A Kansas utility quantified the impact of geographic distribution of PV on allowable PV penetration level at the system level. Most of the utility’s generation was slow-responding coal-fired units. It was concluded the utility’s load-following capability limited PV penetration to only 1.3% if the PV were in central station mode; the limitation was caused by unscheduled tie-line flows that unacceptably harmed the utility’s economics. However the allowable penetration rose to 18% if the PV were spread over a 100 km2 and to 36% if the PV were scattered over a 1000 km2 area.
The impact of high penetrations of PV on grid frequency regulation appeared in a 1996 paper from Japan [163]. This study used modeled PV systems that respond to synthetically generated short-term irradiance transients caused by clouds. The study looked at system frequency regulation and the break even cost, which accounts for fuel savings when PV is substituted for peaking or base load generation and PV cost. The paper reaches three interesting conclusions: (1) the break-even cost of PV is unacceptably high unless PV penetration reaches 10% or so; (2) the thermal generation capacity used for frequency control increases more rapidly than first thought; and (3) a 2.5% increase in frequency control capacity over the no-PV case is required
14
when PV penetration reaches 10%. For penetration of 30%, the authors found that a 10% increase in frequency regulation capacity was required, and that the cost of doing this exceeds any benefit. Based on these two competing considerations, the authors conclude that the upper limit on PV penetration is 10%.
Distribution networks were designed for heavy loading conditions without any PV integration, but they still can operate well with low PV penetration levels. A simulation study by Saha and Yan [123], produced some interesting results:
PV penetration is proportionate to its load. For example for 10% PV penetration, PV installation at each bus is 0.1 times the load of that bus. This result correlates with a series of reports produced by an International Energy Agency Working Group on Task V of the Photovoltaic Power Systems Implementing Agreement dealt with voltage rise [118].
Cloud effects on voltage stability became a serious concern for the studied system when 40% power (penetration level) was contributed from PV systems in a geographically small area. The study concedes that the 40% level may not be identified properly because the loads are modeled as static loads. Detailed dynamic load models are therefore recommended for PV integration studies.
With 20% storage units, which are controlled to smooth PV power fluctuations, voltage stability can be maintained. However, storage locations should be carefully chosen for maintaining voltage stability.
The PV inverter reactive power control scheme was extremely effective for fast voltage support
A primary result of a series of reports produced by an International Energy Agency Working Group on Task V of the Photovoltaic Power Systems Implementing Agreement dealt with voltage rise [106]. Three configurations of high-penetration PV in the low-voltage distribution network were discussed: (all PV on one feeder, PV distributed among all feeders on a medium-voltage distribution/low voltage (MV/LV) transformer, and PV distributed on all MV/LV transformers on an MV ring). The study concludes that the maximum PV penetration will be equal to whatever the minimum load is on that specific feeder. That minimum load was assumed to be 25% of the maximum load on the feeder [106], and if the PV penetration were 25% of the maximum load, only insignificant overvoltage occurred (study assumed no automatic load tap transformers).

15
As can be seen from the studies listed above maximum penetration due to cloud effects, voltage regulation, frequency regulation and load can vary from 5-40%. The minimum load criteria and geographic diversity are important guidelines and rules of thumb to follow in determining maximum penetration for initial planning purposes.
2.2.2 VOLTAGE REGULATION
In August 2003 two major distributed generation studies were conducted by GE [106]. Only the first study will be summarized here because the distributed generators (DGs) interfaced to utilities through inverters. Key results of the first study [106] include:
For DG penetration levels of 40% such that the system is heavily dependent on DGs to satisfy loads, voltage regulation can become a serious problem. The sudden loss of DGs, particularly as a result of false tripping during voltage or frequency events, can lead to unacceptably low voltages in parts of the system.
The simulated distribution system was assumed to employ step
voltage regulators (SVRs), which are essentially autotransformers with an automatically adjustable tap on the series winding. During periods of low load but high generation and with certain distribution circuit configurations, the reverse power flow condition could cause the SVRs to malfunction. Again, voltage regulation becomes a problem.
A voltage regulation function, implemented, through reactive power
control, would significantly increase the benefits of inverter-based DGs to the grid. Unfortunately, this function would interfere with most anti-islanding.
2.3 THE LAND CHALLENGE FOR SOLAR
Prime farmland in California is protected from development by the Williamson Act and by the California Environmental Quality Act. Even when land is available, because of the amount of land required to develop utility-scale projects, special-status species (plant and animal) are often impacted. Urban

16
land is expensive and so most renewable energy zones tend to be located in more remote areas. Figures 2.1 and 2.2 show the renewable energy zones for California and the Southwestern United States.
These energy zones require transmission lines to transfer the power to the load centers. The cost of transmission lines is expensive. The recently completed Sunrise Transmission Powerlink Project completed by San Diego Gas & Electric (SDG&E) and PacifiCorp Gateway Central Line Project provide a good overview and reference point.
The Sunrise Powerlink project runs 150 miles between the Imperial Valley to San Diego. The Imperial County region has significant solar, geothermal and wind resources (see Figure 2.1) [156].
According to SG&E, the transmission line would have the capacity to ensure up to 1,000 megawatts to meet its obligations to purchase certain amounts of energy from renewable generation sources. SDG&E estimates the cost of the project to be $1.9 billion [156,157]. The costs include a 500 kV line, several 220kV lines, the Suncrest substation and updates to seven other substations.
A few key dates are presented to show the length of time it takes to
construct a project [156]. Applications for the project submitted to the CPUC on
December 14, 2005 and August 4, 2006 Project approved CAISO on August 3, 2006 The CPUC voted on December 18,2008 to approve the Final
Environmentally Superior Southern Route and the Bureau of Land Management (BLM) issued a Record of Decision approving the same route on January 20, 2009.
Construction to occur in 25 segments. Construction of these segments was authorized the fourth quarter of 2010 and the first quarter of 2011.
Sunrise Powerlink Transmission Line, including the 500 kV and 230 kV links energized on June 15-17, 2012.

17
Figure 2.1 Renewable Energy Zones in California
18
Figure 2.2 Potential Renewable Energy Zones in Southwestern U.S. (Courtesy of USE)
A study titled ”Capital Costs For Transmission And Substations Recommendations For WECC Transmission Expansion Planning” [155] shows that baseline transmission costs range from $1-3 million/mile based on the following assumptions:
Aluminum Conductor Steel Reinforced (ACSR) conductors Tubular (230kV)/Lattice (345kV and 500 kV) pole/tower structure Lines longer than 10 miles
If high tensile low sag conductors were used, a multiplier of 3.6 would
need to be applied. A Terrain multiplier for forested land would also add a multiplier of 2.25. In addition to the capital costs for transmission line equipment and difficulty of construction based on terrain, there are costs associated with acquiring land for the transmission line. In some cases, right of way costs can come to 10% of total project costs. This proportion varies between projects and is dependent on right of way widths for each voltage class and right of way costs per acre. Substation costs also vary with size. These costs are given as “overnight” costs, i.e. the cost if the project could be engineered, procured and constructed overnight without financing or overhead costs. A category called Allowance for Funds Used During Construction (AFUDC) and overhead is added to the transmission and substation costs to produce a realistic project cost.
Table 2.1 shows the actual cost breakdown of PacifiCorp’s Gateway central Line (Populus-Terminal Segment). This 345-kV double circuit line segment is centered in Utah, and extends from the new Populus substation in southeastern Idaho to the existing Terminal substation in the Salt Lake City area.
19
It was completed in 2010. The most notable characteristic of this line is that it crosses a significant amount of mountainous terrain and urban and suburban terrain around Salt Lake City [155]. The examples provided are meant to show that transmission lines are costly and take from 7-10 years to build.
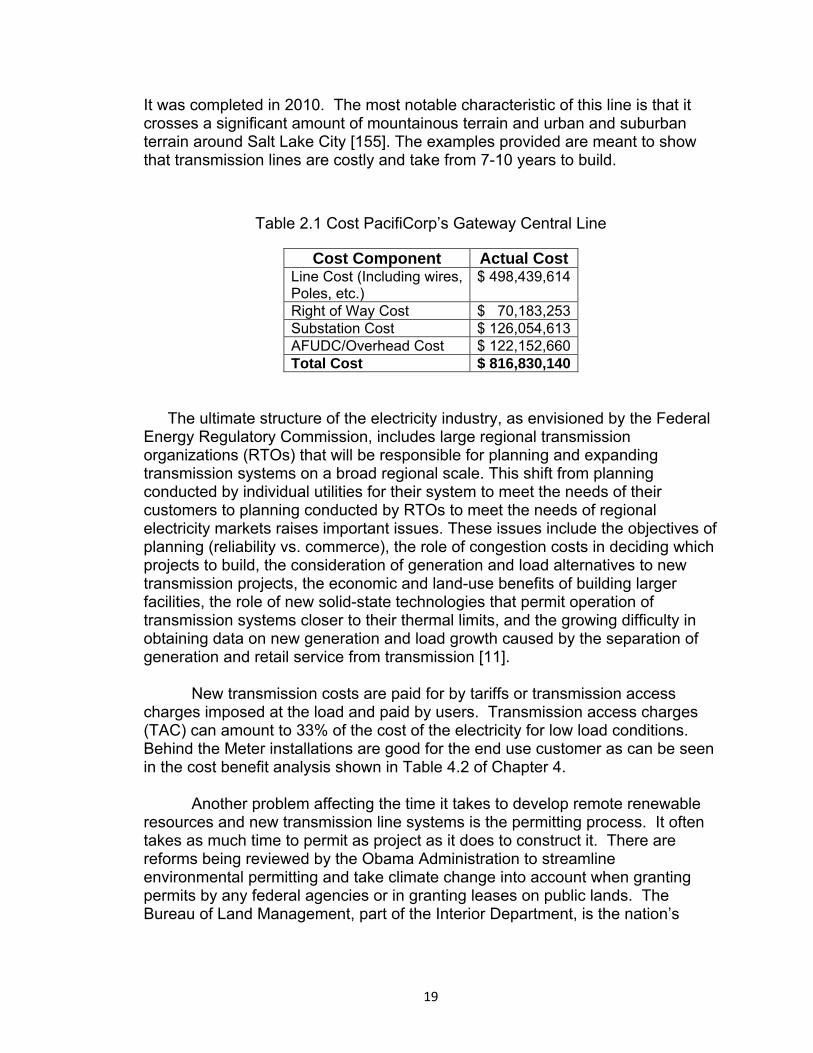
Table 2.1 Cost PacifiCorp’s Gateway Central Line
Cost Component Actual Cost Line Cost (Including wires,Poles, etc.)
$ 498,439,614
Right of Way Cost $ 70,183,253 Substation Cost $ 126,054,613 AFUDC/Overhead Cost $ 122,152,660 Total Cost $ 816,830,140
The ultimate structure of the electricity industry, as envisioned by the Federal Energy Regulatory Commission, includes large regional transmission organizations (RTOs) that will be responsible for planning and expanding transmission systems on a broad regional scale. This shift from planning conducted by individual utilities for their system to meet the needs of their customers to planning conducted by RTOs to meet the needs of regional electricity markets raises important issues. These issues include the objectives of planning (reliability vs. commerce), the role of congestion costs in deciding which projects to build, the consideration of generation and load alternatives to new transmission projects, the economic and land-use benefits of building larger facilities, the role of new solid-state technologies that permit operation of transmission systems closer to their thermal limits, and the growing difficulty in obtaining data on new generation and load growth caused by the separation of generation and retail service from transmission [11].
New transmission costs are paid for by tariffs or transmission access
charges imposed at the load and paid by users. Transmission access charges (TAC) can amount to 33% of the cost of the electricity for low load conditions. Behind the Meter installations are good for the end use customer as can be seen in the cost benefit analysis shown in Table 4.2 of Chapter 4.
Another problem affecting the time it takes to develop remote renewable
resources and new transmission line systems is the permitting process. It often takes as much time to permit as project as it does to construct it. There are reforms being reviewed by the Obama Administration to streamline environmental permitting and take climate change into account when granting permits by any federal agencies or in granting leases on public lands. The Bureau of Land Management, part of the Interior Department, is the nation’s

20
biggest landlord, controlling 20 million acres of ideal solar potential, mostly west of the Rockies [13]. California has the largest renewable market in the US outside of Colorado [14].
While reform has been underway in California for some time, the process for permitting large scale solar is extremely rigorous and thorough, according to SolarReserve, which spent a significant amount of money permitting their Rice Solar Energy Project, in Riverside, California with the California Energy Commission [13].
Peter Weiner, chair of the environmental and energy regulatory practice at Paul Hastings has handled a number of the recent utility-scale solar energy permitting, with over 6 GW in projects. He said, “Large scale solar and wind are so much better for the planet when it comes to greenhouse gases. On the other hand they (large scale solar and wind) have very large footprints and a lot of the siting of these larger facilities has been in areas which have not had a lot of development, such as the desert. As a result the wildlife agencies-which are not very much involved in fossil fuel production became very involved” [13].
2.4 A LOCAL PV DEVELOPMENT OPTION- A BRIDGE TO THE
FUTURE
Governor Brown’s goal is to develop 12,000 MW of distributed generation by 2020 [20]. The question is, what is an effective way to meet the governor’s goal to increase distributed generation as well as meet RPS goals. It has already been mentioned that the CSI and NEM are not applicable to RPS.
A logical option to avoid installing solar PV on land, avoid the rate
structure issues of the CSI and avoid reliability and stability issues due to high penetration on distribution networks is to install solar PV on water. This can also help achieve Goal 1 of the Strategic Plan i.e. focusing on integration with other water, air quality and GHA resource management and energy efficiency strategies [12].
The water-borne application can effectively assist in the development of localized renewable distributed generation, and improve energy efficiency thus reducing the amount of long-distance transmission required to import renewable energy sources and minimize the land use issue. It can decrease the area required for solar PV installations by 50%, from 6 acres/MW to 3 acres/MW, and potentially generate greater than 1000 MW of power by floating PV on the ponds of wastewater treatment plants in California. Because of the geographic

21
diversity, the high penetration issues with rooftop solar on distribution networks can be avoided.
What was claimed to be the world’s first floating photovoltaic system was installed in 2007 by SPG Solar on a pond at Far Niente Winery in NAPA California [165].
The idea of a floating water-borne Concentrated PV (CPV) system was conceived nearly a decade ago. However, the first large scale, tracking and floating CPV prototype was built and deployed by Pyron Solar in collaboration with San Diego Gas & Electric at the Mission Hills Training Center in San Diego in early 2011 [75].
K-water has installed a 100kW floating PV system on the water surface of Hapcheon dam reservoir in October 2011 for operation, K-water followed up this project with an additionally installed 500kW floating PV system on another location nearby in July 2012 [164]. This begs the question of why was such a system can be built in South Korea and not in the U.S. or California.
Several different design methods for floating water-borne PV systems have been proposed (including both flat panel photovoltaic and concentrated photovoltaic (CPV) systems) using various configurations and components. Some designs resemble land ground based systems installed on floating docks or specially designed floaters, others differentiate themselves by their collection system including tracking system and profile above the water surface, but all require some type of mooring system and marine cabling systems. A number of companies including Pyron Solar, Topsun Co. Ltd., Ciel & Terre, Phoenix Solar, GEITIS, Apex Energy Teterow GmbH, SPG, Novaton [149], K-water and Sunengy are developing systems to install on water; however while some have developed impressive proposals, commissioned capacity is still insignificant.
Wastewater treatment plant settling ponds can provide opportunistic sites for floating PV installations. These are relatively protected sites with calm water
22
near distribution/transmission lines. Based on a survey conducted for the energy baseline study for municipal wastewater treatment plants sponsored by Pacific Gas and Electric (PG&E), there are approximately 480 wastewater treatment (WWT) facilities in the PG&E service territory [74]. There are more than 800 plants in California and more than 21,600 in the United States.
2.5 SPECIFICATION FOR A WATER-BORNE SYSTEM
The intent of this section is not to favor a specific technology or design,
but present some ideas and principles that could be included in a specification.
Concentrated solar PV (CPV) only makes sense if it can increase performance and economics. CPV with dual axis tracking are designed to yield the highest efficiency, but that may also come with a higher cost. Pyron Solar developed a CPV system that floats on water [75] that embodies the principles and technology discussed in Appendix A.
The current cost projections for a 10 MW size CPV plant is scaled to approximately $3.30/watt. This design utilizes dual axis tracking and a concentration greater than 1000x on multijunction cells with an overall efficiency of 29%. The Pyron concept has some very innovative design features; however the low cost of flat panels and their increasing efficiency has really dampened the concentrated solar PV market.
The proven flat panel designs have an efficiency of 19% (although new designs: Sun Power’s X22 and X24 series, are reported to be 22% and 24% efficient respectively).
The efficiency of both flat panel and CPV designs are increasing, so the important question in selecting a system is which system has the best life cycle costs for an equivalent amount of capacity and energy.
Life Cycle Assessment (LCA) is a structured, comprehensive method of quantifying material and energy flows and their associated impacts in the life cycles of products. The intent is for a product to be able to transform more energy as an output than what was required to produce it. Ref [161] includes detailed inputs and outputs of four technologies (mono- and multi-crystalline Si, DcTe and high concentration PV (HCPV) using III/V multijunction cells) for which there are well-established Life Cycle Inventories (LCI). These include detailed inputs and outputs during manufacturing of cell, wafer, module, and balance-of-system (i.e., structural and electrical-components) that were estimated from actual production and operation facilities. The LCA indicators in ref [161] are: Energy Payback Times (EPBT), Greenhouse Gas (GHG) emissions, SO2, NOX,
23
and heavy metals. The life –cycle of photovoltaics starts from the extraction of raw materials and ends with the disposal or recycling and recovery of the PV components.
When a PV plant or installation is proposed it should include an LCA. This includes the LCA for the modules and panels as well as the Balance of System
Balance of System (BOS) becomes more important in evaluating cost and environmental analysis or LCA as module and panel costs and environmental impacts decrease. For instance, a recent analysis of a large PV installation at the Springerville Generating Station in Arizona affords a detailed materials and energy balance for a ground-mounted BOS. Tucson Electric Power prepared the BOS bill of materials and energy consumption data for their mc-Si PV installations. The life expectancy of the PV metal support structures is assumed to be 60 years. Inverters and transformers are considered to last for 30 years, but parts must be replaced every 10 years, amounting to 10% of their total mass. The inverters are utility-scale, Xantrex PV-150 models with a wide-open frame, allowing failed parts to be easily replaced [162].
2.5.1 DESIGN FOR LIFE CYCLE COST
The system shall be designed for 25 years and shall be designed to minimize life cycle cost, including the ability to incorporate future technological upgrades. Product documentation shall include engineering structural, electrical and mechanical drawings, maintenance manuals, operating and commissioning manuals, and recommended spare parts lists. The system design shall provide an availability of 0.9. All components shall be off the shelf and shall be hardened or packaged as necessary for a marine environment.
2.5.2 STRUCTURE
The supporting structure shall be modular for easy field assembly designed for transport on a flat- bed truck no longer than 50 ft. long. Support structure can be circular or rectangular, must be capable of supporting 20-30 kW and weigh no more than 3,000 kg with all equipment installed. All structures must be corrosion resistant and electrical enclosures must be moisture proof. The design shall be low profile so that it does not extend more than 2 meters above the surface of the water. Test reports must show the design can withstand winds of 140 km/hr. The structure must be designed to support single axis azimuthal tracking; provide space, support and protection for 30 minutes of battery backup for all control functions; provide space, support and protection for the MPPT and DC/DC conversion; provide space, support and protection for all protective

24
devices (relays, fuses, breakers; raceways for cable management. Field assembly time from truck offload to crane hookup for pond placement shall not exceed 16 manhours per 25 kW module assembly. A suitable tethering mechanism must be provided. While the structure shall be designed for adjustable fix tilt placement of panels (flat panel design), it shall also be provided with a manual reset switch and appropriate mechanisms and linkages so that all panels can be directed to the horizontal position for cloudy and overcast days.
2.5.3 CABLING
All cabling shall be marine grade, be able to withstand 1000 vdc minimum and be supplied with waterproof connectors and splice kits. Cables and raceway design shall be coordinated and properly labeled for neat and reliable cable management. Cabling shall be designed so that all field cabling can be connected from the module to the inverter once placed in the pond up to 1000 meters distance. Cable and wire connection and termination, system checkout and commissioning shall be specified as a separate line item of the proposal. Ground faults management is of great concern especially in a water-borne environment; therefore cable management is critical. PV source-circuit conductors must be secured in a safe and serviceable manner; away from sharp edges, mounting hardware etc. Cable ties are not allowed for cable positioning, only hardware that ensures good positioning over the service life of the PV system is acceptable. Provide insulated bushings or smooth rounded entries at raceway and cable terminations to reduce insulation failure that may cause ground faults.
2.5.4 TRACKING
For flat panel design single axis is required (azimuthal tracking is preferred [148, 150, 151, 152]). Panels shall be able to be fixed at an angle from 0-25 degrees. If concentrated solar PV is provided dual axis tracking is required.
2.5.5 RELIABILITY AND WARRANTY
A 25 year warranty shall be provided for trackers, cables and protection devices. Inverters and batteries shall be warranted to 10 years. The warranty on PV panels and modules is negotiable depending on the price and efficiency of the module or panel. The goal is to design and install a system for the least life cycle cost.
25
2.5.6 ELECTRICAL, CONTROLS & PROTECTION
Controls for vertical or azimuthal tracking shall be included. Even though
an adjustable fixed tilt position mechanism is to be provided for panel placement; a manual and remote manual switch shall be provided to move the panels to the horizontal position on cloudy days.
Electrical System design and installation shall comply with NEC (2008 or later). The following sections of the NEC shall apply: Article 110: Requirements for Electrical Installations; Article 230: Disconnect Means; Article 240: Overcurrent Protection; Article 250: Grounding; Article 300: Wiring methods; Article 480: Storage Batteries; Article 690 Solar Photovoltaic Systems and chapters 2 & 3 on Wiring methods and materials and Protection. UL 1741 shall also apply to all water-borne installations in that all grid-tied as well as non-grid tied inverters, regardless of size, should have full functionality for ground faults meaning that they will detect the ground fault, interrupt the fault current, indicate that a ground fault has occurred and disconnect the faulted part of the array. Photovoltaic source circuits and photovoltaic output circuits shall not be contained in the same raceway, cable, junction box or similar fitting as feeders or branch circuits of other systems.
Inverters shall be identified for use in solar PV systems (inverters listed to UL 1741) and be suitably packaged for marine application. AC modules shall have appropriate markings, overcurrent protection, disconnect means and Ground fault protection.
The dc circuit ground connection shall be made at a single point on the photovoltaic output circuit as close as possible to the power source to better protect the system from voltage surges due to lightning.
PV fuse links shall be fully tested to meet or exceed the requirements of IEC 60269-6 and also meet the requirements of UL 2579, thus being suitable for protecting PV modules in reverse current situations. Where three or more strings are connected in parallel, a fuse link on each string shall be included on each string to protect the conductors and modules from overcurrent faults and help minimize any safety hazards and also isolate the faulted string so that the rest of the PV system can continue to generate electricity. A fuse link on each sub-array will protect the conductors from fault current and help minimize any safety hazards. It will also isolate the faulted sub-array so that the rest of the PV system can continue to generate electricity. A fuse link positioned in the cable that carries the combined output of a number of strings should be protected by sub-array fuse links. If a number of sub-arrays are subsequently combined then a further fuse link should be incorporated. This would be termed the array fuse link.
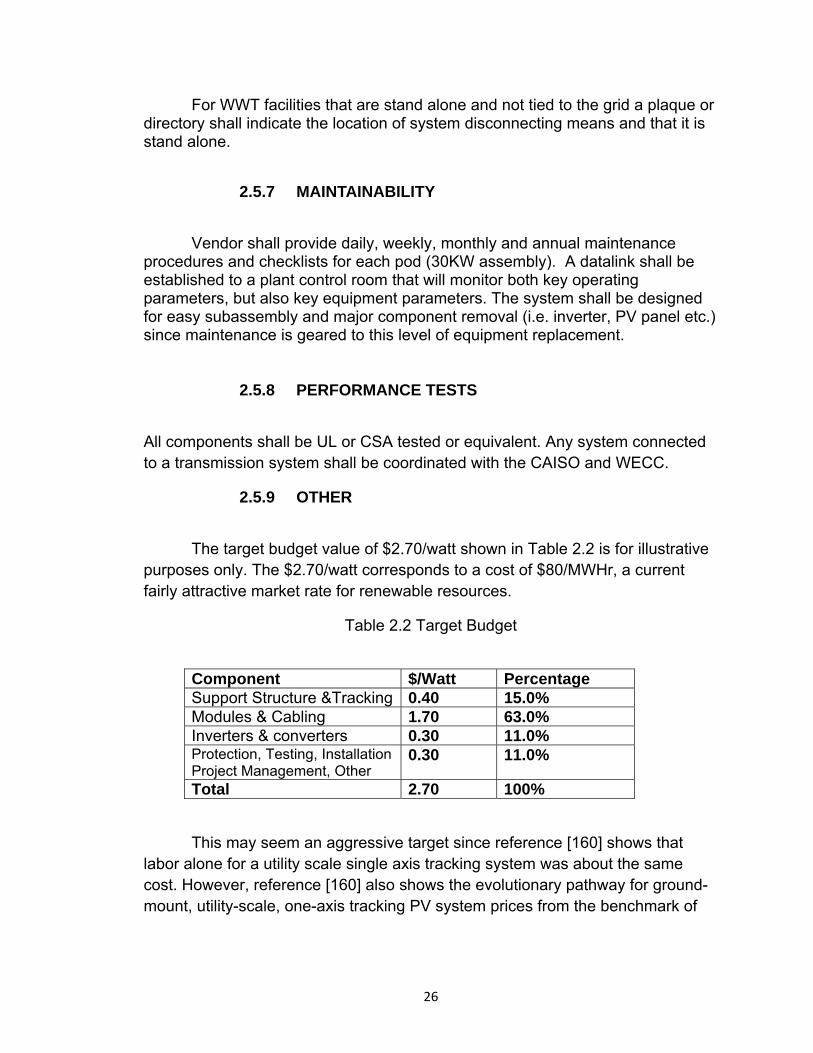
26
For WWT facilities that are stand alone and not tied to the grid a plaque or directory shall indicate the location of system disconnecting means and that it is stand alone.
2.5.7 MAINTAINABILITY
Vendor shall provide daily, weekly, monthly and annual maintenance procedures and checklists for each pod (30KW assembly). A datalink shall be established to a plant control room that will monitor both key operating parameters, but also key equipment parameters. The system shall be designed for easy subassembly and major component removal (i.e. inverter, PV panel etc.) since maintenance is geared to this level of equipment replacement.
2.5.8 PERFORMANCE TESTS
All components shall be UL or CSA tested or equivalent. Any system connected to a transmission system shall be coordinated with the CAISO and WECC.
2.5.9 OTHER
The target budget value of $2.70/watt shown in Table 2.2 is for illustrative purposes only. The $2.70/watt corresponds to a cost of $80/MWHr, a current fairly attractive market rate for renewable resources.
Table 2.2 Target Budget
Component $/Watt Percentage Support Structure &Tracking 0.40 15.0% Modules & Cabling 1.70 63.0% Inverters & converters 0.30 11.0% Protection, Testing, Installation Project Management, Other
0.30 11.0%
Total 2.70 100%
This may seem an aggressive target since reference [160] shows that labor alone for a utility scale single axis tracking system was about the same cost. However, reference [160] also shows the evolutionary pathway for ground-mount, utility-scale, one-axis tracking PV system prices from the benchmark of

27
$4.40/Wp DC in 2010 to $1.91/ Wp DC in 2020. It also shows the DOW SunShot utility-scale target of $1.20/Wp DC for comparison so while the target of $2.70 is aggressive it is within reason. Crystalline silicon modules (panels) mounted on one axis trackers may experience a capacity factor benefit of between 25-30% (Campbell 2010b) in high solar resource locations, although the capital (system) penalty may be between 10-20%. In the future, (2020), as prices of (one-axis) trackers come down, the net-benefit of tracking c-Si modules in high resource areas may approach 20%. Because capacity factor and module efficiency are linearly correlated, the modified SunShot target for one-axis c-Si modules is estimated to be approximately $1.20/Wp DC [160].

28
3.0 FLOATING WATER-BORNE PV APPLICATION CONSIDERATION FOR UTILITY APPLICATION IN CALIFORNIA
The Northern California Power Agency (NCPA) is a Joint Power Agency that supplies power to its thirteen members and several other participants. One of the Power Plants NCPA operates is the Lodi Energy Center The plant is contiguous to the City of Lodi’s White Slough Water Pollution Control Facility and utilizes the treated water from the facility for its cooling tower operations.
Eight of NCPA’s thirteen members are municipalities that own and operate waste water treatment facilities (Refer to Table 4.1). The City of Lodi (an NCPA member) operates the White Slough Water Pollution Control Facility that has approximately 50 acres of settling ponds (Figure 3.3). Figure 3.2 shows the location and the DNI of the Lodi Facility in relation to the surrounding area. This could be a good test site for installing a floating solar PV system as it could potentially float up to 15 MW of solar PV and is in close proximity to both electrical transmission and distribution.
3.1 WASTE WATER TREATMENT PLANTS
Based on a survey conducted for the Energy Baseline Study For Municipal Wastewater Treatment Plants sponsored by Pacific Gas and Electric (PG&E) there are approximately 480 wastewater treatment (WWT) facilities in the PG&E service territory [73]. Water and wastewater plants represent large electric and gas loads. Overall, wastewater treatment consumes approximately 1.5% of the total US electric power [74]. Other data suggest that waste water treatment facilities consume 4% of the country’s total electricity [63]. After labor, electricity is the largest operating cost at wastewater treatment plants, typically 25 to 40% of total operating costs. The California Energy Commission reported that wastewater treatment plants are usually the single largest electricity user in local governments [74].
The following common methods for WWT are presented [74]: • Aerobic activated sludge systems • Trickling filter (fixed media or fixed film reactor) systems • Oxidation pond systems
3.1.1 ACTIVATED SLUDGE
Aerobic activated sludge is the most commonly used wastewater treatment process consisting of primary treatment, secondary treatment, optional tertiary treatment, disinfection and sludge processing. Details of the processes for activated sludge WWT could be found in Hammer and Hammer (2004) and Metcalf and Eddy (2003). Major energy users in these processes include:

29
electric drives, various types of pumps, blowers, mixers, mechanical aerators, UV lamps and presses [74].
3.1.2 FIXED-GROWTH BIOLOGICAL SYSTEMS
Fixed growth biological systems are systems that cause contact of wastewater with microbial growth attached to the surface of supporting media. In these systems wastewater is distributed over a bed of rock, slag or synthetic media. Alternatively the media can move through the wastewater. Based on Hammer and Hammer (2004) these systems are categorized as:
• Tricking filter, where water is distributed over a bed of crushed rock
or slag • Biological tower, where synthetic media is used in place of rock
with a greater depth • Biological tower, where a series of circular plates on a common
shaft are slowly rotated while partly submerged in wastewater.
Major energy users in these processes include: pumps for transport of wastewater, electrical drives for rotating the rotary wastewater distributors and hydraulic (water) drives for rotating the rotary wastewater distributors [74].
3.1.3 OXIDATION PONDS
Oxidation ponds, also called stabilization ponds or lagoons are utilized for smaller communities. According to Hammer and Hammer (2004), oxidation ponds are classified as facultative, tertiary, aerated and anaerobic according to the type of biological activity that takes place in them [74].
Facultative ponds are the most common type of ponds employed for
municipal wastewater treatment. The bacterial reactions include both aerobic and anaerobic decomposition. Waste organics are decomposed by bacteria releasing carbon dioxide, nitrogen and phosphorous. Algae use these compounds, along with energy from sunlight for growth, releasing oxygen to the solution, which is in turn used by bacteria. These are shallow pools with 2-5 feet of depth [74].
Tertiary ponds also referred to as maturation ponds serve as third-stage
processing of effluent from activated sludge or trickling filter secondary treatment. Stabilization by retention and surface aeration reduces suspended solids, BOD (Biochemical Oxygen Demand), microorganisms and ammonia. The water depth is generally limited to 2-3 feet for mixing and sunlight penetration.
Aerated ponds are completely mixed units, usually followed by facultative
ponds. These are used for first stage treatment of high-strength municipal
30
wastewaters and for pretreatment of industrial wastewater. The basins are 10-12 feet deep and are aerated with pier-mounted floating mechanical units. The biological process does not include algae. BOD removal is a function of aeration period, temperature and nature of wastewater.
Major energy users in oxidation ponds include: pumps for transport of
wastewater and electrical drives for surface aeration. As previously stated, Waste Water Treatment plants can consume large
amounts of power. This also means that many have transmission and distribution in close proximity. The high cost of power is a motivating factor for these facilities to implement the latest energy efficiency techniques some of which are described in the above mentioned studies commissioned by PG&E [73, 74].
3.2 FLOATING WATER-BORNE CPV SYSTEM
As mentioned in section 2.4, the idea of a floating water-borne CPV system was conceived nearly a decade ago. However, the first scale, tracking, floating CPV prototype was built and deployed by Pyron Solar in collaboration with San Diego Gas & Electric at the Mission Hills Training Center in San Diego in early 2011 as shown in Figure 3.4. The twelve month demonstration of the floating CPV solution provided proof-of principle validation of the technology [75]. All modules were connected to a neutrally buoyant substructure that floats just below the water’s surface. The substructure was made of composite plastic material and connects all modules to a 50 foot diameter tracking ring and support structure as shown in Figure 3.1. The tracking ring was equipped with an azimuth and an elevation drive motor controlled by a microprocessor. The purpose in showing the design is not to promote a specific technology, but to show the low profile and basic structure that are attractive features regardless of the technology employed.
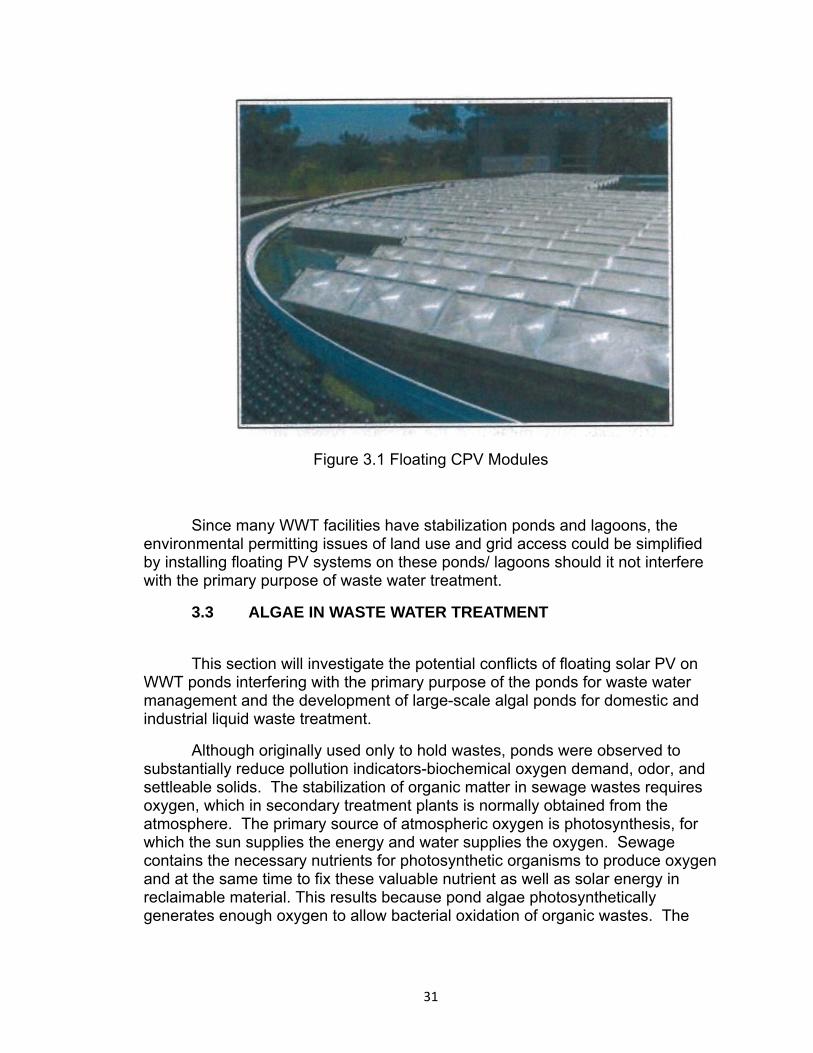
31
Figure 3.1 Floating CPV Modules
Since many WWT facilities have stabilization ponds and lagoons, the environmental permitting issues of land use and grid access could be simplified by installing floating PV systems on these ponds/ lagoons should it not interfere with the primary purpose of waste water treatment.
3.3 ALGAE IN WASTE WATER TREATMENT
This section will investigate the potential conflicts of floating solar PV on WWT ponds interfering with the primary purpose of the ponds for waste water management and the development of large-scale algal ponds for domestic and industrial liquid waste treatment.
Although originally used only to hold wastes, ponds were observed to substantially reduce pollution indicators-biochemical oxygen demand, odor, and settleable solids. The stabilization of organic matter in sewage wastes requires oxygen, which in secondary treatment plants is normally obtained from the atmosphere. The primary source of atmospheric oxygen is photosynthesis, for which the sun supplies the energy and water supplies the oxygen. Sewage contains the necessary nutrients for photosynthetic organisms to produce oxygen and at the same time to fix these valuable nutrient as well as solar energy in reclaimable material. This results because pond algae photosynthetically generates enough oxygen to allow bacterial oxidation of organic wastes. The

32
released nutrients (carbon dioxide, ammonia, phosphate, etc.) are converted into algal biomass [83]. Design equations have been developed to relate pond area requirements to sewage strength and flows, as well as local solar insolation and climatic conditions [84]. This engineering research has resulted in the wide-spread adoption of algal ponds (known as oxidation ponds) in many countries, including the United States, Australia, Israel, South Africa, and India.
Almost all presently used oxidation ponds are the “facultative” type- one to three meters in depth and arranged in cells of up to 50 hectares (hectare is 2.47 acres), and mixed only by wind action and perhaps recirculation of effluent. The bottom of these ponds are thus anaerobic (anoxic), resulting in fermentation of the settled sludge and algae, while the surface is kept aerobic by the algae, preventing odors from developing. The liquid detention time (days required to displace one pond volume) is long, from weeks to months (These are often referred to as Type 1 Oxidation ponds). This design may be optimal for waste treatment but not for algal growth.
If algal biomass production is to be maximized, the ponds must be shallow (30-50 cm), have short detention times (1-4 days in summer; up to 6 days in winter- these would be referred to as Type 2 Oxidation ponds), and be mechanically mixed (to minimize algal settling and prevent thermal stratification).
It should be pointed out that Type 1 ponds require about 18 acres of pond area for a flow of one million gallons of sewage per day while the acreage required to handle the same flow for a Type 2 pond would be about 9 acres or half that amount.
High rate ponds (1-6 days detention) produce well above 100 mg l-1 of algae (dry weight) and even facultative ponds normally have effluents of above 50 mg l-1 [83,84]. These levels of suspended solids are higher than those allowed by present US waste treatment plant discharge regulations; thus algae must now be removed from oxidation pond effluents. This step is also required for conversion of algal biomass into usable fuels.
Integrating floating PV onto waste water treatment ponds with Type 1 oxidation ponds or conventionally designed waste stabilization ponds would create little or minimal interference. Larger units of this type furnish oxygen by dilution and are comparable to natural lakes because their physical size is so great that they may receive wastes with little depletion of their oxygen reserves. Type 1 ponds would lend themselves well to floating PV application.
For Type 2 Oxidation ponds, Advanced Integrated Wastewater Pond Systems and systems designed to produce large amounts of algae for fuel harvesting, floating PV systems on ponds may be a competing system for light. Combined use systems for floating PV and algae harvesting would require further study. The photosynthetic oxygenation process requires consideration of influences of light, temperature, pond depth, heat content of the algal cell

33
material, and other limiting factors. Algal growth requires radiation in the visible range that will penetrate a smooth water surface. This represents only about 1/3 of the total radiation of the solar spectrum. According to Vannevar Bush, a plot of the influence of saturation intensity on light utilization by algae shows that as the incident light intensity increases, the fraction of available light utilized decreases regardless of the value of saturation light intensity [84]. It therefore appears possible that some combination of the two systems to coexist is feasible, but in what proportion would require further study.
Advanced Integrated Wastewater Pond Systems (AIWPS) have a series of four types of ponds [142]. The first series is the Advanced Facultative Ponds, followed Algal High rate ponds (HRP). The third series consists of Algae Settling Ponds followed lastly by Maturation Ponds. It may not be practical to install floating PV on HRP series of ponds for AIWPS, but it should be practical for the other pond series of AIWPS. Three such AIWPS plants have been so identified in California (Delhi, St. Helena and Hollister ) [158] . These systems have great promise for waste water treatment plants because they do not require sludge management and use very little energy.
Another interesting project potentially involving Waste Water Treatment Plants is known as OMEGA- Offshore Membrane Enclosures For Growing Algae [25]. OMEGA is a system of photo-bioreactors (PBRs) filled with municipal wastewater, floating in seawater. It is constructed of flexible plastic with internal gas-permeable membranes diffusing CO2 into cultures and external forward osmosis (FO) membranes concentrating nutrients in wastewater and dewatering the algae for harvesting. The FO membranes also clean the water released into seawater. The OMEGA modules float at the sea surface. The surrounding seawater provides structural support, temperature control and containment. Waves and bubbling provide mixing. OMEGA produces biomass for biofuel, food, and fertilizer, while treating wastewater and sequestering carbon [25].
It is generally agreed that microalgae are the most promising biofuels crop [25]. Photosynthesis for waste reclamation may have intrinsic values to the national economy when one considers that sewage is not truly a waste. Derived from the most nutritive photosynthate harvested from the land, sewage contains the low energy forms of every element critical to life. It has been stated that excreted, organic matter has undergone little more than a reduction in its chemical energy content, and it would be surprising if it were not an ideal medium for algal growth [84].
Several questions arise: 1- can the new algae cultivation methods be scaled up to meet the needs for biofuels 2- can they avoid competing with
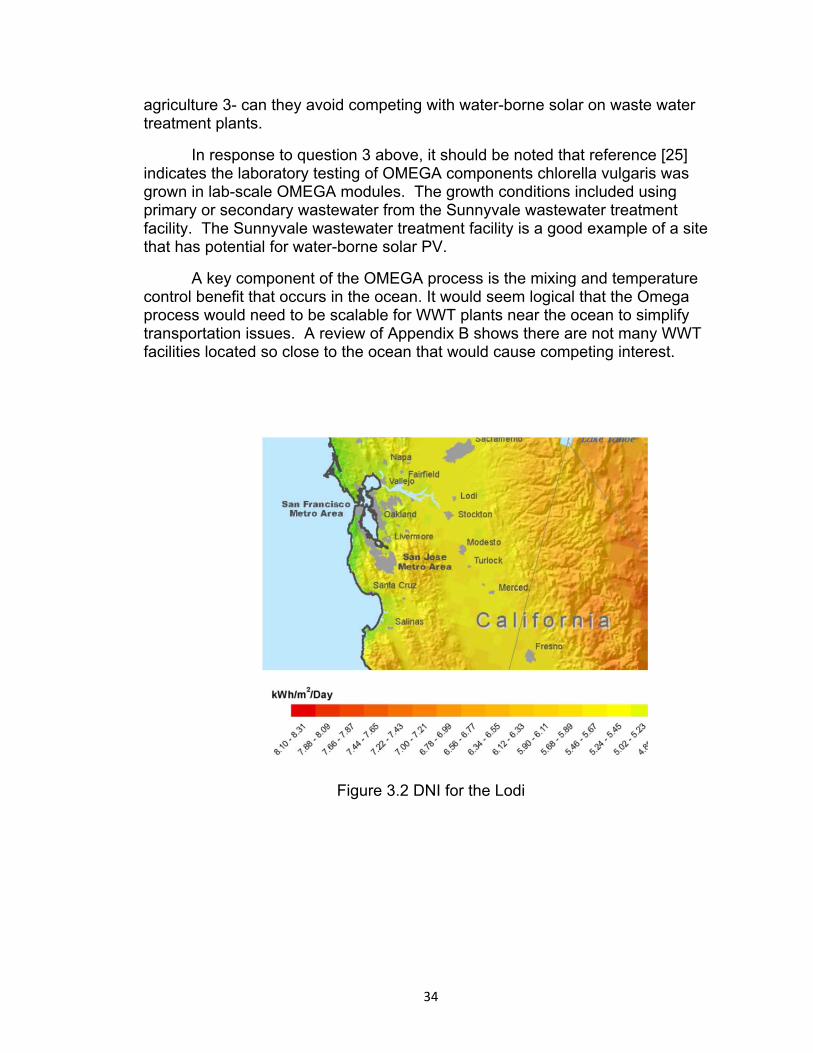
34
agriculture 3- can they avoid competing with water-borne solar on waste water treatment plants.
In response to question 3 above, it should be noted that reference [25] indicates the laboratory testing of OMEGA components chlorella vulgaris was grown in lab-scale OMEGA modules. The growth conditions included using primary or secondary wastewater from the Sunnyvale wastewater treatment facility. The Sunnyvale wastewater treatment facility is a good example of a site that has potential for water-borne solar PV.
A key component of the OMEGA process is the mixing and temperature control benefit that occurs in the ocean. It would seem logical that the Omega process would need to be scalable for WWT plants near the ocean to simplify transportation issues. A review of Appendix B shows there are not many WWT facilities located so close to the ocean that would cause competing interest.
Figure 3.2 DNI for the Lodi

35
Figure 3.3 Aerial view of the Lodi Energy Center and the Lodi White Slough Facilities. (Photo courtesy of NCPA)
3.4 POTENTIAL FOR CPV WATER-BORNE SYSTEMS
Water-borne systems can provide the following advantages for large
industrial or utility sized projects:
• Provide passive cooling for concentrated PV designs • Simplify the structural components and associated control
(tracking) systems (Figure 3.4) • Provide water source for cleaning lenses or panels • Provide denser pack layout • Mitigate the land use issue. Prime land is not required • Helps mitigate building new transmission and distribution because it
is usually readily available at the site
The amount of support structure that is required is another huge
advantage. A comparable 20kW ground-mounted PV arrays typically weighs 25,000-50,000 pounds. In contrast, the floating composite plastic prototype has a dry-weight of less than 5,000 pounds [75].

36
Since the system would be installed on WWT ponds there would be no land costs involved
If each facility in the Energy Baseline Study for Municipal Wastewater Treatment (WWT) Plants in the PG&E service territory had six acres of settling ponds, that could yield almost 3000 acres of space available for water-borne solar installation in Central California. There are over 800 publicly operated wastewater treatment plants in California. If one were to include the water treatment facilities in addition to WWT facilities, there would be more than 1200 located in PG&E’s service territory [74].
The EPA estimates that water and wastewater capacity will need to grow
by 5 to 8% annually over the next decade. If the numbers are further extrapolated to gain 1 MW of peak solar
capacity for every 3 acres this would represent approximately 1000 MW of peak capacity.
Extending the same reasoning to all 800 sites could yield 4800 MW peak
capacity or 10,500 GWhs of energy assuming on average 6 hrs/day of sunlight. This represents 20% of the “net short” renewable energy projected in California for 2020. Of course not all waste water treatment plants are of the design with lagoons or oxidation ponds. Research is still ongoing to contact each of the 800 WWT in California to verify their design, pond acreage, grid access, energy requirements and feeder connection points.
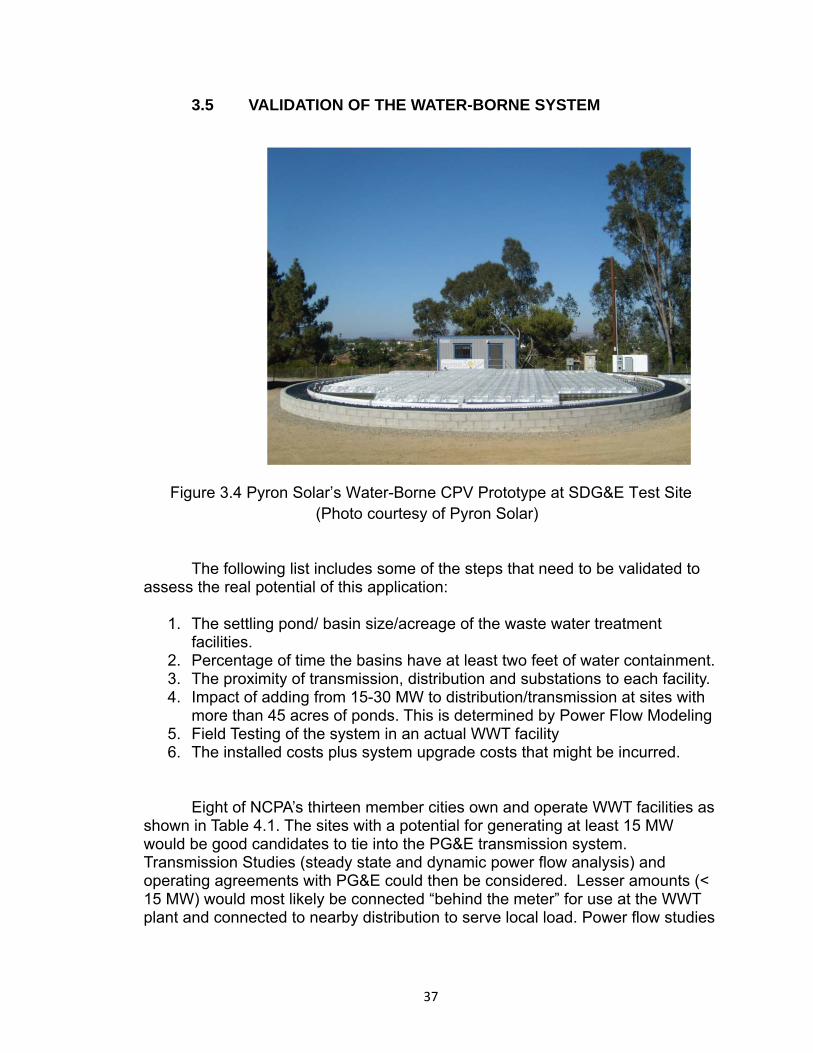
37
3.5 VALIDATION OF THE WATER-BORNE SYSTEM
Figure 3.4 Pyron Solar’s Water-Borne CPV Prototype at SDG&E Test Site (Photo courtesy of Pyron Solar)
The following list includes some of the steps that need to be validated to
assess the real potential of this application:
1. The settling pond/ basin size/acreage of the waste water treatment facilities.
2. Percentage of time the basins have at least two feet of water containment. 3. The proximity of transmission, distribution and substations to each facility. 4. Impact of adding from 15-30 MW to distribution/transmission at sites with
more than 45 acres of ponds. This is determined by Power Flow Modeling 5. Field Testing of the system in an actual WWT facility 6. The installed costs plus system upgrade costs that might be incurred.
Eight of NCPA’s thirteen member cities own and operate WWT facilities as
shown in Table 4.1. The sites with a potential for generating at least 15 MW would be good candidates to tie into the PG&E transmission system. Transmission Studies (steady state and dynamic power flow analysis) and operating agreements with PG&E could then be considered. Lesser amounts (< 15 MW) would most likely be connected “behind the meter” for use at the WWT plant and connected to nearby distribution to serve local load. Power flow studies

38
would also need to be performed for connection to the distribution system. The power flow modeling studies are essential to investigate any upgrades to the transmission/distribution system. Any system upgrade costs would need to be included in the Cost Benefit Analysis; however for the cost benefit study discussed in chapter 4, system upgrades costs were not included.
Appendix B provides a list of many of the 480 WWT in the PG&E Service
Territory as well as approximately 500 other sites located in California.

39
4.0 COST BENEFIT VALIDATION FOR WATER-BORNE CPV SYSTEM
It is a requirement for projects of public entities to conduct cost benefit analysis. Since most waste-water treatment (WWTs) are owned and operated by public entities, this becomes an essential requirement. The promising NCPA member WWT sites for floating PV application shown in Table 4.1 include: Biggs WWTP, Gridley WWTP, Healdsburg City WWTP, White Slough Water Pollution Control Facility in Lodi, and the San Jose/ Santa Clara Water Pollution Control Plant.
Table 4.1 NCPA Member Waste Water Treatment Plants
Facility Name Facility Street Facility
City Phone Contact Comments Pond Acre
Grid connect
Biggs WWTP 3016 Sixth Street 95917 Biggs
(530)868-5493
Hayden Wasser 530‐693‐0568
Good Potential site
3 acres+70*
Gridley WWTP East Gridley Place 95948 Gridley
(530)846-3631
Tim Hill 518‐2989
Good Potential site 2 acres 0.5 MW
Healdsburg City WWTP
Felta Road 95448
(707)431-3346/3369
Ryan Kirchner
Great Site Advanced plant
3 acres + 40 *acres 13 MW
Palo Alto Regional WQCP
250 Hamilton Ave 94301 Palo Alto
(650)329-2598
James Allen/Phil Bobel Maybe
No ponds; 2 acre marsh 0 MW
White Slough Water Pollution Control Facility
12751 North Thornton Road, 95242 Lodi
(209)333-6749
Karen Owner
Excellent potential site
40+ acres 13 MW
Lompoc Regional WWTP
West 1801 Central Avenue, 93436 Lompoc
(805)736-5083
Robert Archer 315‐7020
Must dredge each yr./ no fixed pumping system
2‐3 Acres 1 MW
Dry Creek WWTP Pleasant Grove WWTP
316 Vernon Street 95678 Roseville
(916)746‐1800
Bob Lawrence 1902/1802
Not a Potential Site
Basins, but not filled; 0 MW
San Jose/Santa Clara Water Pollution Control Plant
700 Los Esteros Road, San Jose, 95134
Santa Clara
(408)635‐6600
Joanna DeSa/ Ron Nichols (electrical) Pam Good Potential site Good Site
The City of Biggs WWTF is undergoing some redesign that will include an additional 70 acres of storage ponds. These new ponds will be located within a quarter mile of a 60 KV Sub-transmission line so this site also has great potential. The City of Lompoc’s Regional WWTP may have potential; however due to annual dredging that is required some special design and operating requirements would need to be implemented.
40
NCPA member sites with WWTs that would not qualify include : The City of
Palo Alto since its process requires no ponds or lagoon’s; likewise the City of Roseville’s Dry Creek and Pleasant Grove plants have acres of lagoons, but they seldom contain water; hence they are not suitable. These later sites underscore the need to validate each facility for suitability.
4.1 COST BENEFIT ANALYSIS BACKGROUND AND PERSPECTIVE
Cost benefit analysis (CBA), sometimes called benefit–cost analysis (BCA), provides an economic evaluation of a potential product or technology. The idea of this economic accounting originated with Jules Dupuit, a French engineer in 1848. The formal concepts were formulated by the British economist, Alfred Marshall, but the practical development came as a result of the Federal Navigation Act of 1936. This act required that the U.S. Corps of Engineers carry out projects for the improvement of the waterway system when the total benefits of a project to whomsoever they accrue exceed the costs of that project. [82]. While the methods are still being resolved and refined even today, it is a requirement that public entities employ this type of analysis for project evaluation. The Benefit/cost (B/C) ratio is normally used for proposals to assess the potential of a project or new regulation.
An interesting CBA point to ponder is that for the past ten years federal
agencies have issued approximately 4,000 new regulations per year. The Crane & Crane study conducted for the Small Business Administration estimates the total annual compliance cost for all Federal regulations at $1.7 trillion (about 12% of the Gross Domestic Product). The interpretation is that we give up about 12% of the goods and services that we would otherwise have had available for consumption or investment in order to “buy” the “benefits” of regulation. The Crane study does not estimate the value of benefits of regulations [76, 77]. This underscores a couple of potential problems with applying a CBA; namely the categorization and honest accounting of all costs and benefits.
4.2 COST BENEFIT ANALYSIS REQUIREMENT
The U.S. Chamber of Commerce supports the use of cost-benefit
analyses by federal agencies so the public can assess the likely impact of projects and of regulatory proposals, establish priorities, consider alternatives, and target resources to those activities that will most effectively use public
41
resources to achieve the maximum protection of human health and the environment. Executive Order 12866 requires federal agencies to prepare cost-benefit analyses for all significant regulatory actions. The U.S. Chamber of Commerce’s Center for Capital Markets Competitiveness (CCMC) released a report written by Ohio State law professors Paul Rose and Christopher Walker entitled, “The Importance of Cost-Benefit Analysis in Financial Regulation,” which finds that while regulators sometimes fail to use cost-benefit analyses appropriately, financial regulation grounded in rigorous, transparent, analytical standards is not only more efficient and effective, but is required by law [78, 79].
Benefit–cost analysis is a systematic process for calculating and comparing benefits and costs of a project, decision or government policy (hereafter, "project"). BCA has two purposes:
1. To determine if it is a sound investment/decision (justification/feasibility)
2. To provide a basis for comparing projects. It involves comparing the total expected cost of each option against the total expected benefits, to see whether the benefits outweigh the costs, and by how much.
In BCA, benefits and costs are expressed in monetary terms, and are adjusted for the time value of money, so that all flows of benefits and flows of project costs over time (which tend to occur at different points in time) are expressed on a common basis in terms of their "net present value."
4.3 COST BENEFIT STEPS
The US Army Cost Benefit Analysis Guide outlines eight steps of a CBA
or BCA: 1- Define the problem / opportunity 2- Define the scope; formulate facts and assumptions 3- Define alternatives 4- Develop cost estimate for each alternative 5-Identify quantifiable and non-quantifiable benefits 6- Define alternative selection criteria 7- Compare alternatives 8-Report results and recommendations [80].
Typically a favorable benefit-cost (B/C) ratio would be greater than 1;
however it is important to remember the following when performing or reviewing a cost benefit analysis. It can sometimes be a deficiency reviewing a benefit cost ratio to always hold the view that the higher the ratio the better the project and vice versa. While this may be the intent, the ratio can be misrepresented or manipulated by a decision maker on whether to classify an item as a cost or dis-benefit. Another common mistake is the fallacy of merely comparing proposals for change with a continuation of a present condition. Perhaps the most common failure of a cost benefit analysis is not including all the costs and mischaracterizing the benefits. [81]

42
4.4 COST BENEFIT APPLICATION FOR A PV WATER-BORNE
SYSTEM
The results of a cost benefit analysis (CBA) show the Benefit Cost ratio (B/C) by comparing the cost of the water-borne PV systems to a market alternative similar to the renewable portfolio standard (“RPS”) PCC 1 or the bucket 1 category3.
The CBA analysis included a 4% discount rate, 10% financing charge and
$100K annual maintenance budget (increasing at 2.5%/year) for a 25 year operating period. The analysis was performed for two cases: 1- Installations connected to the grid and 2- installations connected “behind the meter”.
The installed costs reflected in the benefit cost ratios shown in Table 4.1
include all costs up to the inverter. Costs from the inverter to the substation, or metering panel are not included, but thought to minimal for “Behind the meter” installations. Any potential storage costs are also not included in the cost study.
“Behind-the-Meter Generation” means an electric generation unit that is
interconnected on the load side of a load meter settlement location and which reduces net interchange at the load meter settlement location. Effectively, the generator is interconnected to the distribution system behind the Point of Interconnection where the load is interconnected to the transmission system, and at which point the amount of load consumed is metered.
As can be seen from the results in Table 4.1 below, the cost benefit ratio
for the behind the meter installation is approximately 10% greater than for grid connections. This is because “behind the meter” installations do not need to pay transmission access and wheeling charges.
3 Portfolio Content Category 1 (PCC1) also known as “Bucket 1” – energy from renewable resources connected to California distribution or California Balancing Authority transmission systems, or renewable energy scheduled directly (without substitution) into a California Balancing entity. This is generally the most expensive compliance product (up to $100/MWh or more).
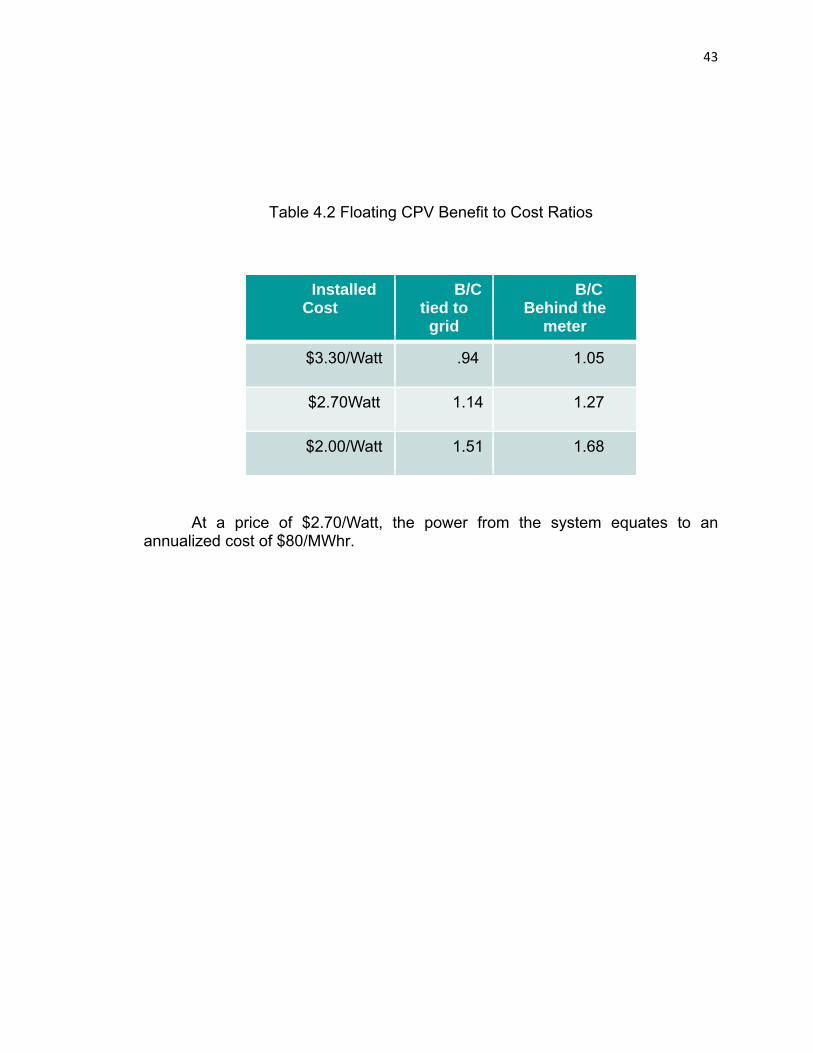
43
Table 4.2 Floating CPV Benefit to Cost Ratios
Installed Cost
B/C tied to grid
B/C Behind the
meter
$3.30/Watt .94 1.05
$2.70Watt 1.14 1.27
$2.00/Watt 1.51 1.68
At a price of $2.70/Watt, the power from the system equates to an
annualized cost of $80/MWhr.

44
5.0 POWER SYSTEM INTEGRATION STUDIES FOR LARGER SOLAR PV INSTALLATIONS CONNECTED TO TRANSMISSION LINES
Large solar system installation (> 15 MW) might be examined for connection to a sub-transmission or transmission system. Smaller systems can be connected to a distribution network. This section will discuss the steps involved in integrating a system into the transmission network. Section 6 will focus on integrating systems into distribution networks. While power flow assessment studies are somewhat different for transmission systems and distribution systems, both are required to determine the impact of adding additional resources and load onto the system.
Mitigation measures may need to be applied if there is a significant change in reliability to the grid. The cost of mitigation needs to be reflected in the overall project cost in determining the suitability of a project for a given site location; hence the need for power flow system study is essential in project planning and evaluation.
Power System Studies can be classified as Steady-State, Dynamic and Transient. Steady-State studies can be further divided into the following: Production Cost Modeling, Load (Power) Flow, Voltage Regulation, Power Transfer and Short-Circuit Study. Dynamic studies can be divided into Voltage Stability and Power Angle Stability studies. Transient studies can be divided into Transient Stability and Harmonics. Steady State studies look at time spans ranging from years to minutes; Dynamic Studies look at time spans from minutes to seconds and Transient Studies look at time spans from seconds to milliseconds.
Transmission system studies are performed from a transmission system base case. The National Electricity Reliability Corporation (NERC) requires they be performed for selected demand levels over the range of forecast system demands. Hence to satisfy this requirement two system base cases are studied for each annual assessment.
The purpose of these studies is to [85]:
1. Identify transmission system impacts caused solely by the addition of the
proposed Project.
2. Identify system reinforcements necessary to mitigate adverse impacts of the Project, if any, under various system conditions.
3. Identify the level of deliverability of the Project by means of a Deliverability Assessment, conducted by CAISO.

45
4. Provide cost estimates and work scope for the Interconnection Facilities
necessary to interconnect the Project to the CAISO Controlled Grid.
5. Provide cost estimates and work scope for the Network Upgrades necessary to mitigate adverse impacts of the Project, if any, under various system conditions.
6. These studies form the basis of the Interconnection Facilities Study Agreement (IFASA); they define the scope, content, assumptions, and terms of reference. If for example 15-20 MW of solar PV were to be added at the White
Slough Water Pollution Control Facility, and the project’s economics favored connection to the transmission over local distribution, the Project could either interconnected to Pacific Gas and Electric Company’s (PG&E’s) Gold Hill – Lodi Stig and Lodi Stig – Eight Mile Road 230 kV Lines via the existing NCPA Lodi switching station or alternately connect into the Gold Hill – Eight Mile Road 230 kV line.
Figure 5.1 Transmission Map near LEC

46
5.1 POWER FLOW ANALYSIS METHODOLOGY
Power flow analysis is used to evaluate thermal and voltage performance of the system under NERC category A normal (all elements in-service) conditions and various NERC category B emergency (one element out of service), and Category C contingencies [86].
Usually a minimum of two power flow base cases are used to evaluate the feasibility of the proposed interconnection and the transmission system impacts on the CAISO Controlled Grid. While it is impractical to study all combinations of system load and generation levels during all seasons and at all times of the day, these two base cases represent extreme loading and generation conditions.
5.1.1 STEADY STATE POWER FLOW ANALYSIS
Power Flow analysis used to simulate the impact of the Project covers the transmission facilities within PG&E’s Sacramento, Sierra, Stockton, and Stanislaus planning areas.
The single (CAISO Category “B”) and selected multiple (CAISO
Category “C”) contingencies include the following outages [85]: CAISO Category “B” All single generator outages within the study area. All single (60 - 230 kV for this case) transmission circuit outages
within the study area. All single (60 - 230 kV for this case) transformer outages within
the study area. Overlapping single generator and transmission circuit outages
for the transmission lines and generators within the study area. CAISO Category “C” Selected bus (60-230 kV for this case) outages within the study
area. Selected outages caused by selected breaker failures
(excluding bus tie and sectionalizing breakers) at the same above bus section.

47
Selected combination of any two-generator/transmission line/transformer outages (except ones included above in Category “B”) within the study area.
Selected outages of double circuit tower lines (60-230 kV for this case) within the study area.
Normal thermal loading is only reported when a transmission component is loaded above 90% of the appropriate MVA rating (as entered in the power flow database). Emergency thermal loading was only reported when a transmission component was loaded over 90% of its appropriate emergency MVA rating (as entered in the power flow database). In addition, both normal and emergency thermal loadings were only reported if the change in flow between the pre-disturbance case and the post-disturbance case exceeded 2 percent [86].
Reported normal voltage violations were limited to the conditions where per unit (p.u) voltages were less than 0.95 or greater than 1.05. Reported emergency voltage violations were limited to the conditions where per unit voltages were less than 0.90 or greater than 1.10. In addition, only voltage deviations greater than 5% between the pre and post-contingency states are reported [86].
5.1.2 SHORT CIRCUIT DUTY ANALYSIS
Short circuit studies are performed to determine the maximum fault currents on various buses in the vicinity of the Project. This will assess the impact of increased fault duty resulting from the added generation. Equipment that may become overstressed as a result of increased fault duty will be identified.
5.1.3 SYSTEM PROTECTION ANALYSIS
Preliminary system protection requirements are normally provided based on the scope and assumptions outlined in the study plan and technical information provided by the Interconnection Customer.
5.1.4 REACTIVE POWER DEFICIENCY ANALYSIS
With a proposed project included in the system model, CAISO Category “B” and “C” contingencies are analyzed to identify any reactive power deficiency:

48
• Whether the results show voltage drops of 5% or more from the pre-project levels
• Whether the results fail to meet applicable voltage criteria.
A post-transient power flow analysis will be performed, if deemed necessary, after considering the network topology or power transfer paths involved when a significant amount of power transfer occurs.
The power system study at an early stage of validation will most likely be limited to steady-state load flow studies. Dynamic modeling typically cannot be performed without specific vendor knowledge of the inverter system. The determination of the steady state power flow problem, also called load flow, generally aim at the following:
Determine the state of the power system. Determine the system voltages, currents, the active and reactive
powers and power factors. Determine the basic steady-state operating conditions
Generation supplies the load plus losses on the system Maintain bus voltage near nominal or rated value Generation operates within specified real and reactive power
constraints Determine that Transmission and Distribution lines are not
overloaded It essentially involves finding the steady state voltages at each
node, given a set of generation and load conditions.
There are two popular numerical methods for solving the power-flow equations. These are the Gauss-Siedel (G-S) and Newton-Raphson (N-R) Methods.
The N-R method exhibits faster convergence; however its “flat start”
characteristic is not always possible since the solution at the beginning can oscillate without converging toward a solution. In order to avoid this problem, the load-flow solution is often started with a G-S algorithm followed by the N-R algorithm after a few iterations.
PV, Steady-State is typically modeled as a constant power source
(P) with no reactive power component (Q). Figure 5.2 shows how a PV system is converted to an equivalent model for load flow simulation.
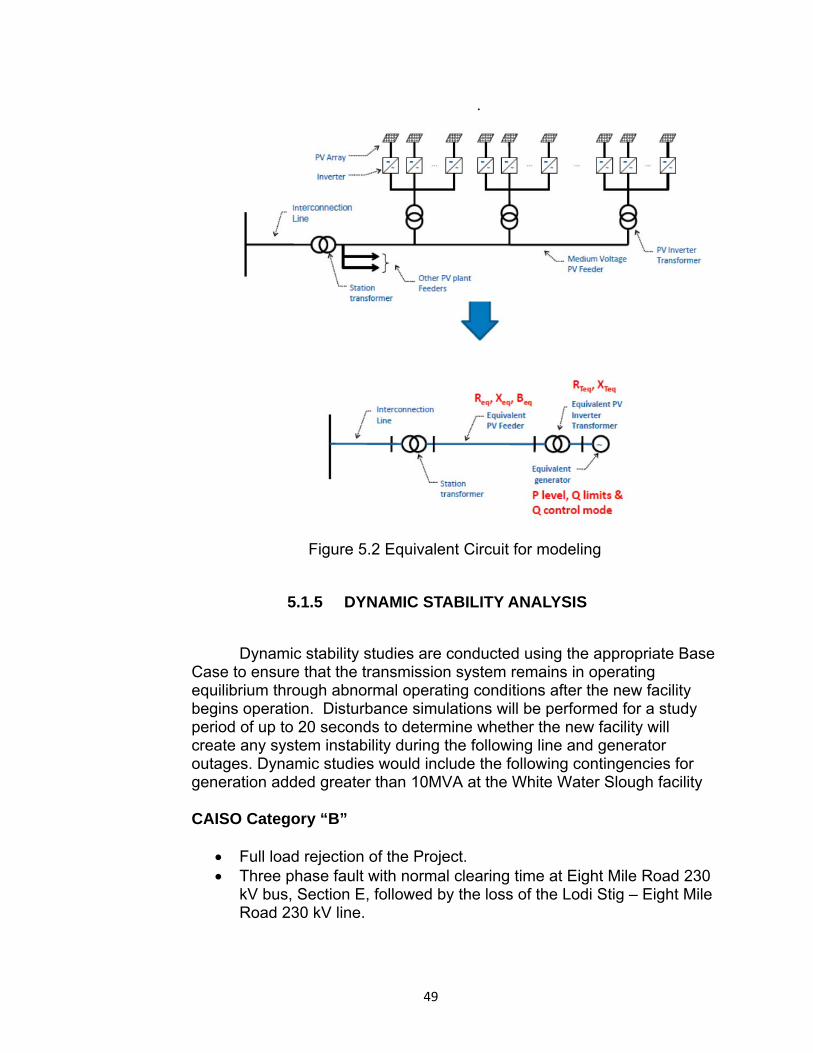
49
.
Figure 5.2 Equivalent Circuit for modeling
5.1.5 DYNAMIC STABILITY ANALYSIS
Dynamic stability studies are conducted using the appropriate Base Case to ensure that the transmission system remains in operating equilibrium through abnormal operating conditions after the new facility begins operation. Disturbance simulations will be performed for a study period of up to 20 seconds to determine whether the new facility will create any system instability during the following line and generator outages. Dynamic studies would include the following contingencies for generation added greater than 10MVA at the White Water Slough facility
CAISO Category “B”
Full load rejection of the Project. Three phase fault with normal clearing time at Eight Mile Road 230
kV bus, Section E, followed by the loss of the Lodi Stig – Eight Mile Road 230 kV line.

50
Three phase fault with normal clearing time at Gold Hill 230 kV Bus #1, followed by the loss of the Gold Hill – Lodi Stig 230 kV line.
CAISO Category “C”
Three phase fault at Eight Mile Road Substation 230 kV bus, Section E, with normal clearing time
Three phase fault at Gold Hill Substation 230 kV bus, with normal clearing time.
Three phase fault at Eight Mile Road 230 kV bus, Section E, with normal clearing time followed by the loss of Eight Mile Road – Stagg 230 kV and Eight Mile Road – Tesla 230 kV Line.
5.1.5.1 DYNAMIC MODELING
Dynamic modeling typically includes modeling the exciter system, turbine governor and synchronous machine. The dynamic models for PV systems are still under development, but current models are based on IEEE-STD 1547 compliant inverters. Future updates may include Voltage Regulation (VR) and Low Voltage Ride through (LVRT).
Dynamic PV models typically include a constant power source with no
reactive power, but include protective set points for voltage and frequency. Dynamic Modeling for stability analysis is required prior to permitting a
project and entering into an Interconnection Agreement. Dynamic modeling usually requires proprietary inverter information from vendors and is usually not available until contracts are finalized.
Transient studies are performed to determine if the system will remain in synchronism following major disturbances such as faults, sudden loss or gain of load, loss of generation, or line switching. Transient stability studies generally focus on 1 to 10 second period after a disturbance.
Transient PV models are dependent on control algorithms used in the
inverter.
5.1.6 SUBSTATION EVALUATION
The substation evaluation identifies any existing equipment requiring upgrades to mitigate overstress or overload caused by the Project

51
5.1.7 TRANSMISSION LINE EVALUATION
Transmission line evaluation identifies any existing transmission lines or equipment requiring upgrades to mitigate overload or overstress caused by the Project.
5.2 CTPG STUDY RESULTS
The CTPG Study that was discussed in the Introduction also used the
same Power Flow methodology described above for a statewide study. A few of the significant results of that study are included below.
The CTPG utilized the GE Positive Sequence Load Flow (PSLF) software
and base cases established by the Western Electric Coordinating Council (WECC), the National Renewable Energy Laboratory (NREL) and the California Transmission Planning Group (CTPG) to perform various studies in California and the Western United States. These studies were to analyze and determine the most probable sites where significant amounts of wind and solar might be integrated and the effect it would have on the reliability and stability of the transmission grid in the region. Because of the complexity of the study effort, a phased approach was undertaken by the CTPG [15].
In Phase 1, CTPG used the 2020 energy forecast of the CEC’s 2009
integrated Energy Policy Report (IEPR), which resulted in an estimated 289,697 GWh of retail load in the state of California subject to the state’s renewable goal. Under that assumption, assuming a 33% RPS goal in year 2020, LSEs (Load Serving Entities i.e. Turlock Irrigation District, Modesto Irrigation District, Pacific Gas & Electric, Southern California Edison, Los Angeles Department Water Power, Sacramento Municipal Utility District etc.) would be required to obtain a total of 95,600 GWh of renewable energy in order to meet the target; or approximately 53,605 GWh would be acquired from resources over and above existing and new renewable resources and other miscellaneous additions. This is referred to as the Net Short [15].
This Phase 2 study modified the Net Short to 52,764 GWh. This number
also reflects the CEC’s projection of the impact of the California Solar Initiative (CSI), and other behind-the-meter distributed generation, on retail loads [16].

52
The Phase 3 study identified high commercial interest CREZs4. Those transmission line segments and transformers that were needed to connect the high ranking CREZs to the network, to facilitate the ability of the network to deliver the energy to the aggregate load, and/or were needed to reduce congestion that currently exists on the interconnected system but is exacerbated by the resources in a CREZ, were considered “high potential” transmission upgrades [17].
In Phase 4 the CTPG developed criteria for identifying “high potential”
transmission corridors that may provide options going forward in response to the uncertainty of the eventual locations of the renewable resources that will be procured by the state’s LSEs [18].
It is not the purpose here to summarize all the results, but it is worth
mentioning three significant findings:
1. The Phase 3 studies assumed that the output of fossil-fueled generation was decremented based on heat rate (as a proxy for relative operating costs) to achieve load-resource balance as the renewable resources were added to the resource dispatch. The results showed the proposed “high potential” transmission upgrades are insufficient, by themselves, to allow California to meet its 33% RPS goals without reliability criteria violations [17].
2. The Phase 4 analysis used to estimate the capability of the “high potential” transmission upgrades to accommodate renewable energy development indicated that the pattern of fossil generation re-dispatch significantly impacts the point at which increasing levels of renewable energy production will result in contingency-based reliability criteria violations [18].
3. Fossil generation decrementing patterns that are based only on
eliminating reliability criteria violations may require the continued operation of coastal generation using Once Through Cooling (OTC) technologies and/or other relatively inefficient generation that could possibly be retired provided other infrastructure such as transmission and/or generation were constructed. Variables such as state policy, cost, and/or environmental concerns must be considered in determining the future disposition of older, fossil-fired
4 ‘CREZ’ is the acronym for ‘Competitive Renewable Energy Zones’, which are geographic areas in which renewable energy resources and suitable land areas are sufficient to develop generating capacity from renewable energy technologies.

53
generators. There is a cost to employing a fossil-fired generation decrementing strategy that deviates from strict merit-order. A different pattern of fossil fueled resource decrements might suggest a different set of high potential transmission upgrades than what the Phase 3 studies indicate [17].
The CTPG studies clearly point out the need for a multi-disciplined approach to solving complex systems and environmental problems. Engineering, regulatory, legal, industry and legislative organizations must work together to effectively implement renewable goals. While integrating renewables onto transmission systems is important; it is
also important to develop renewables at the local level so they can be cost effectively installed behind the meter on local distribution networks and integrated as energy efficiency programs for industrial applications.
5.3 SUMMARY OF POWER FLOW AND APPLICATION WHITE SLOUGH WWT
The above methodology is applied to all power flow studies and transmission line assessments. From previous studies conducted while permitting NCPA’s Lodi Energy Center (LEC) adjacent to the City of Lodi’s White Slough Water Treatment Facility, it was determined that additional power could not be added to the ) Gold Hill – Lodi Stig and Lodi Stig – Eight Mile Road 230 kV line without suitable mitigation to the lines. For instance the LEC can supply 319 MW under proper weather conditions, but is only permitted to operate at 280 MW. Connecting to the Gold Hill – Eight Mile Road 230 kV line may be an option, but a separate power flow study would be required and an additional switchyard would need to be constructed so this option would not be the most economical at this time.
The best solution at this time for the White Slough Water WWT would be
to install the system “behind the meter”. The White Water Slough WWT would benefit from increased energy efficiency by direct connection the water borne solar plant and the City of Lodi could benefit from the clean power by connected to their distribution system.
54
6.0 HIGH PV PENETRATION IMPACTS ON UTILITY DISTRIBUTION SYSTEMS
The electric utility industry has been transitioning for over 30 years in terms of increasing diversity and distribution of resources. Solar cost reductions, increasing costs of traditional sources, and Renewable Portfolio Standards have created the possibility of significant levels of distributed solar generation being installed on distribution systems [90,93,99]. The positive results are environmentally cleaner resources, better utilization of the grid and more efficient use of electricity by customers. However, the grid has become increasingly complex and stressed by the variability that has been introduced due to the addition of intermittent wind and solar photovoltaic (solar PV) resources. This trend is expected to increase with more distributed energy resources (DER) coming on line in the future leading to high-penetration scenarios. To aid in the evaluation and help with this expansion of solar resources, there needs to be significant changes in the way that the electric power infrastructure is designed and operated [127].
In a distribution network that contains a high level of penetration of PV units, but has an insufficient number of storage devices, a sudden disturbance such as the change in sunlight due to a passing cloud/storm could trigger a rapid disconnection of these PV generators or the reduction of their operating capacity, resulting in a significant loss of active power support [89].
There are two main types of electrical distribution systems: radial and network. Most areas of the United States use simpler radial distribution systems to distribute electricity, but larger metropolitan areas like New York City typically use more complicated networks to increase reliability in large load centers. Unlike the radial distribution system, where each customer receives power through a single feeder and single transformer, a network delivers power to each customer through several parallel feeders and transformers [95] and requires different analysis.
6.1 MANAGING ENERGY FLOWS TO IMPROVE SYSTEM VALUE
This section lists some ideas to enable high penetration of PV into the current distribution infrastructure while improving PV system value and utility system reliability. If grid-connected PV power systems were negligibly cheap, the system operator would prefer to curtail power production (and waste available irradiant power) when demand drops [96]. However, all generating plants have some capital cost and their owners would prefer to operate them at full capacity to maximize revenue. The system operator must throttle back generation or increase the rate of storage (where available e.g. water pumping) when demand

55
drops, or the frequency will climb too high. This condition is currently managed by the system operator, who uses a combination of carrot (pricing) and stick (regulation) actions. As these types of actions that curtail power production are applied to grid-connected PV power systems; therefore designers have to choose between discarding available power and adding storage [96].
The following thoughts are under consideration that may give system operators some additional tools:
1. Improve communication capabilities to interactively control connection of the inverter/controller to the grid. One approach is to replace the current anti-islanding approach with interactive dispatch so the utility can command an inverter to ride through voltage sag, rather than having a large number of inverters go off-line while leaving the loads on-line [88]. An interesting and associated challenge is how to provide security to the cyber assets (i.e. networks, computers and controllers) that provide this control to prevent malicious hacking attempts to gain access and control of the bulk electric system. These attacks are on the rise.
2. Manage power flows to keep high power flows off the distribution
system when they could interfere with system regulation and protection; therefore direct loads to operate when solar energy is available and not to operate during peak demand periods when solar is not available. Design and direct inverters to produce reactive power.
These ideas could be summarized to optimize value by dispatching loads to operate in concert with the availability of solar energy and/or cheap utility power. This is inclusive of energy efficiency strategies and storage. For buildings with demand charges, addition of storage has been shown to add value to the PV system [88]. Storage can enable the building to continue to operate critical loads during a utility outage.
3. Consider the rate structure when establishing the orientation (azimuth and tilt) of the PV modules. For example, for regions where utility demand peaks in the summer and time-of-use rate apply, having a portion of the array facing west may provide more value to the customer, even though total energy delivered may be lower.
4. Develop PV inverters to supply VARs at the source for businesses
and industrial sites.

56
6.2 SOLAR PHOTOVOLTAIC DISTRIBUTED ENERGY RESOURCES (DER) INTEGRATION ASSESSMENT
6.2.1 INTERCONNECTION STANDARDS AND GUIDES
Impact studies for solar photovoltaic integration assessment are different than conventional induction or synchronous generators as a result of the different operational mode capabilities, with each one affecting the distribution system significantly different.
There are several standards available to provide information and assistance regarding DER interconnections with the distribution system. Most noteworthy is the IEEE 1547 series of interconnection standards. These include rules and interconnection polices for voltage limits, voltage regulation, flicker levels, harmonics, frequency, disconnection rules fault and protection considerations [87]. The Southern California Edison (SCE) Interconnection Handbook [130] and California Rule 21 [131] also provide general design, interconnection and operating requirements for connecting and operating DER generation facilities.
6.2.2 DISTRIBUTION SYSTEM MODELING
Distribution systems are complex to analyze because many are radial, with unbalanced impedances, unbalanced distributed loads, large number of nodes and branches, wide-ranging resistance, and high R/X ratio. Many programs of real-time applications in the area of distribution automation, such as network optimization planning, switching, state estimation, and so forth, require a robust power flow method. Most distribution analysis software packages use unbalanced phase impedance matrices and load flow solutions [87].
These features cause the traditional power flow methods used in transmission systems, such as the Gauss Siedel and Newton-Raphson techniques, to fail to meet the requirements in both performance and robustness aspects in the distribution system applications [111].
Some of the power flow algorithms specifically designed for distribution systems are: 1- Classical Newton-Raphson 2- Ratio-Flow 3-Forward Backward Substitution and 4- Ladder Network Theory.
Shirmohammadi et, al, [98, 12] have presented a compensation-based power flow method for radial distribution network and/or weakly meshed structure using a multi-port compensation technique and basic formulations of Kirchhoff’s Laws. The radial part is solved by a straightforward two step procedure in which the branch currents are first computed (backward sweep) and then the bus

57
voltages are updated (forward sweep). In the improved version by Luo [98, 13], branch power flow was used instead of branch complex currents for weakly meshed transmission and distribution systems. In [98, 16], G. Renato Cespedes makes use of the bi-quadratic equation which, for every branch, relates the voltage magnitude at the receiving end to the voltage at the sending end and branch power flows. In [98,21] the authors proposed a Ratio- flow method which is based on forward-backward ladder equation for complex distribution systems by using voltage ratio for convergence control. Ladder network Theory is similar to the Forward-Backward Substitution method. In Ladder Network Theory, the currents in each branch are computed by KCL. In addition to the branch currents, the node voltages are also computed by KVL in each iteration. Thus magnitude of the swing bus voltage is also determined. The calculated value of the swing bus is compared with its specified value. If the error is within the limit, the procedure is stopped.
The convergence ability of distribution system load flow methods which are widely used for distribution system analysis is compared. The methods analyzed are: 1- Classical Newton-Raphson 2- Ratio-Flow 3-Forward Backward Substitution and 4- Ladder Network Theory [98]. The results were evaluated under different tolerance values, different voltage levels, different loading conditions and different R/X ratio, under a wide range of the exponents of the loads in a 30 buss radial distribution system. The results show that the Ratio-Flow method is simple and has fast convergence ability. It required less iterations and is less sensitive to distribution system parameters than Forward-Backwards substitution method and Ladder Network Theory, The Classical newton-Raphson method did not converge for the 30 bus system.
In [111] a direct approach for distribution power flow was proposed. The idea is that the LU decomposition and forward/backward substitution for the Y admittance matrix required in the traditional Newton Raphson and Gauss implicit Z matrix algorithms are not necessary. Two developed matrices, the bus-injection to branch current matrix (BIBC) and the branch-current to bus voltage matrix (BCBV), and a simple matrix multiplication are utilized to obtain power flow solutions. One of the major reasons, which make the power flow program diverge, is the ill-conditioned problem of the admittance (Y) matrix. It usually occurs when the system contains some very short lines or very long lines. Test results showed that the new direct approach had almost the same accuracy as the commonly used forward/backward method, and that for a 270-node systems was 24 times faster.
This above research on distribution engineering tools, however still does not really address the support for PV modeling. Until just recently, tools to model the behavior of multiple systems or PV fleets, has been lacking [127]. PV in the distribution system can be considered a “negative load” like other distributed generation sources, but its output is more complicated because it varies every hour. Its output is dependent upon several factors, such as hourly solar

58
irradiance, hourly ambient temperature, hourly sun angle, array azimuth and tilt, and PV module and inverter characteristics. In high penetration PV scenarios, the hours of maximum line loading do not necessarily correspond with maximum consumption. While conventional load flow studies are primarily concerned with the hour of greatest load (demand), this rule does not necessarily follow on circuits with high penetration of PV. For example, during lightly loaded hours with high solar production (such as weekends), there may be significant back-feed on some sections of the line. The highest loading may actually occur in these “off-peak” hours.
Incorporating PV and DER can also introduce bidirectional kW and kVAR power flows. The software needs to calculate voltage rise due to reverse kW flow and voltage drop due to forward kVAR flow on different phases. The voltage imbalance is also important since the interconnection standards list requirements pertaining to maximum or minimum voltage or flicker levels, and therefore violations may occur on only one phase rather than all three.
Traditional distribution planning makes use of a single point in time load flow analyses, which is adequate for peak power planning. Time series simulations using a batch process are required where both customer loads and PV outputs at various times of the day or in certain steps can be run in sequence to analyze the time-varying nature between them. Active and reactive power flow directions and levels can change every minute due to the intermittency of renewable generation such as PV DER [87].
PV cells rely on a clear sky with no haze, rain, or humidity to generate their rated power. Items such as inverter efficiency, AC and DC wiring losses, snow or ice buildup and transformer losses need to be applied to obtain a derating factor.
6.2.3 MODELING ALGORITHMS AND NETWORKS
A modern grid involves a shift in the operating paradigm on four
dimensions: increased variability, shorter time cycles, resource diversity and resource dispersion. Large and small scale intermittent generation, like solar PV as well as wind and responsive demand from EVs and smart appliances, necessitate a change from traditional deterministic to stochastic methods for planning and controls [140].
Modeling needs to support high-penetration include (1) Utility distribution modeling and (2) Solar side modeling. The following general utility concerns are
59
broken into the need to quantify the impacts of distributed resources on protection, operation and planning and engineering studies.
From a protection standpoint software capabilities need to address: loadability- ability to serve load without tripping; selectivity- the system protective devices nearest the fault isolate the fault before more remote devices operate to isolate the fault; and sensitivity- the ability to sense faults. Some of the concerns include: improper coordination, nuisance few blowing, DR stability during faults, islanding, reclosing out of synchronism, transfer trip and equipment overvoltage [127].
From an operational standpoint software capabilities need to address the following concerns: voltage regulation malfunctions, substation load monitoring errors, switching impacts resulting from large levels of solar generation, protection and coordination with inverters, including sectionalizer miscounts, forecasting/planning for peak and light load, economic impacts on operations energy and capacity, financial impact on capital and O&M, cold load pickup with and without DERS, flicker, harmonics, stability during faults, and long feeder steady state stability [127].
From a planning and engineering standpoint software capabilities need to address the following concerns: distribution planning models that reflect actual system operation with high levels of DER generation, economic analysis of losses, generation planning and operation for both capacity and energy, including production profile throughout the year and type of production, the amount of generation (penetration level) that can be installed on a distribution feeder [127].
Modeling systems will need detailed PV inverter models in order to study impacts of high-penetration solar generation. These models need to be developed for power flow, short circuit and dynamic studies. Modeling should include programmable drag and drop solar inverter models that can accommodate solar input measurements to facilitate the study of high penetration of PV as part of the normal utility planning and operation process. Inverter models will also need to accept time sequence measurement data for load estimation and power flow. Load modeling studies will need to be made across time-varying load curves, such as 8,760 hourly time points. Modeling systems needs to be capable of stepping through an operational time sequence that is granular enough to capture the operational movement of all active elements within the circuit, such as time delays for voltage regulation, protective device operation, etc. [127]
Another categorization is to consider installations as PV clusters within minigrids. The PV cluster structure is commonly encountered in the sub-urban areas where many houses with rooftop PV installations are integrated into a local distribution network. In this configuration, the grid acts as an energy buffer to
60
firm up the variable output power of the PV. Typically about 100 to 300 PV houses would be connected to one lateral of a MV feeder that supplies thousands of houses. Current PV mini-grids are usually isolated power distribution networks that utilize PV in conjunction with other generation sources, mainly diesel generators, for rural and remote community electrification. These are isolated areas or geographical islands with no connection to the utility grid. Neither the PV cluster nor the remote community mini-grid completely represents the mini-grid of the future, which will operate in both autonomous and utility interconnected modes to supply multiple users [91]. Mini-grids of the future will need to be modeled in distribution networks.
6.3 CONTROL OF PHOTOVOLTAIC GENERATORS IN A DISTRIBUTION NETWORK
6.3.1 CONTROL OF UTILITY INTERACTIVE INVERTERS
It is important to understand several concepts in conjunction with inverter control: MPPT, Grid synchronization, anti-islanding, current regulation and PWM in order to understand potential future concepts of controlling the grid with high penetration of solar PV.
6.3.1.1 MAXIMUM POWER POINT TRACKING
The amount of solar energy available is subject to change with irradiance, temperature, and aging of PV panels or modules. Shading frequently occurs that also affects the performance of the array. The inverter, (that which converts the DC electric energy from the solar panels or modules into AC) needs to automatically adjust the power output to draw maximum available power at any time. The algorithm to draw maximum power available from the solar PV is called a maximum power point tracking (MPPT). The desired MPPT algorithm quickly adjusts the inverter to a maximum power condition during transients and without oscillating at steady state conditions [114].
6.3.1.2 GRID SYNCHRONIZATION
A phase tracking system is an important part of the control system. It affects synchronization to the grid, power factor control and harmonic content of the inverter output current. Many algorithms have been proposed. Ideally the phase tracking system algorithm should respond quickly to changes in the utility phasing, but should reject noise and higher harmonics in the utility voltage. The easiest implementation is based on zero crossing detection of the inverter output current being synchronized to the utility during zero crossings of the utility voltage. Phase-locked loop (PLL) techniques are used to estimate the phase of
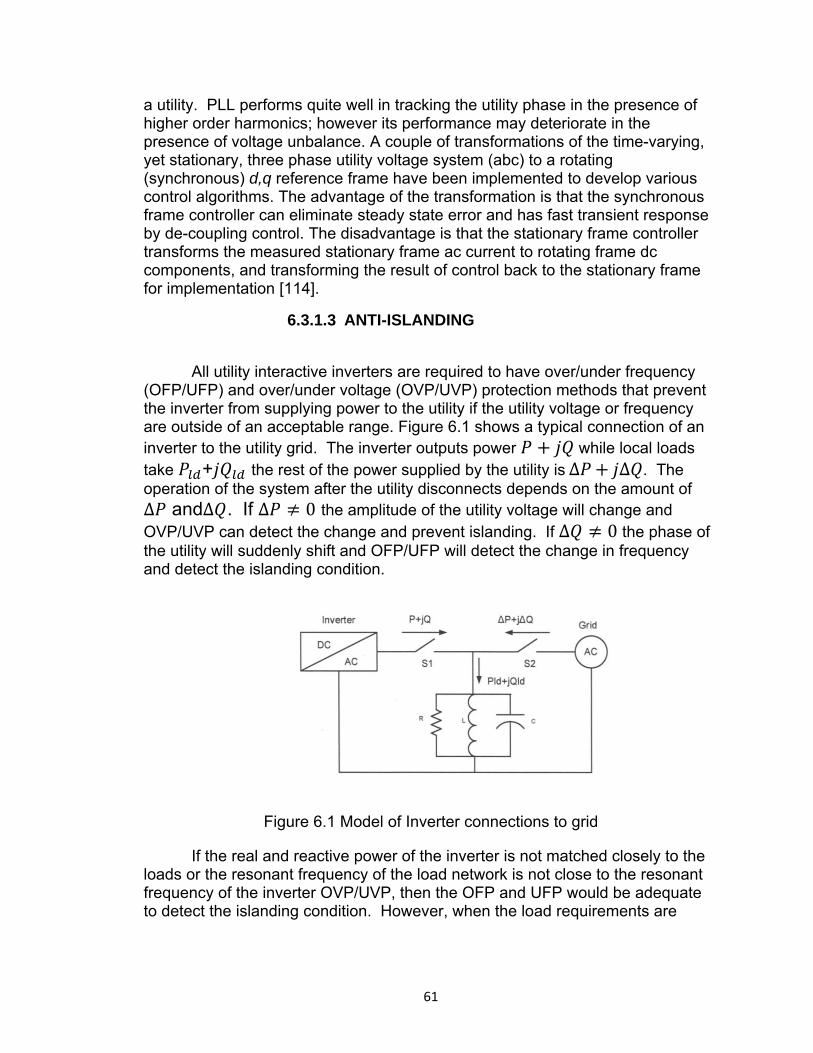
61
a utility. PLL performs quite well in tracking the utility phase in the presence of higher order harmonics; however its performance may deteriorate in the presence of voltage unbalance. A couple of transformations of the time-varying, yet stationary, three phase utility voltage system (abc) to a rotating (synchronous) d,q reference frame have been implemented to develop various control algorithms. The advantage of the transformation is that the synchronous frame controller can eliminate steady state error and has fast transient response by de-coupling control. The disadvantage is that the stationary frame controller transforms the measured stationary frame ac current to rotating frame dc components, and transforming the result of control back to the stationary frame for implementation [114].
6.3.1.3 ANTI-ISLANDING
All utility interactive inverters are required to have over/under frequency (OFP/UFP) and over/under voltage (OVP/UVP) protection methods that prevent the inverter from supplying power to the utility if the utility voltage or frequency are outside of an acceptable range. Figure 6.1 shows a typical connection of an inverter to the utility grid. The inverter outputs power while local loads take + the rest of the power supplied by the utility is∆ ∆ . The operation of the system after the utility disconnects depends on the amount of ∆ and∆ . If ∆ 0 the amplitude of the utility voltage will change and OVP/UVP can detect the change and prevent islanding. If ∆ 0 the phase of the utility will suddenly shift and OFP/UFP will detect the change in frequency and detect the islanding condition.
Figure 6.1 Model of Inverter connections to grid
If the real and reactive power of the inverter is not matched closely to the loads or the resonant frequency of the load network is not close to the resonant frequency of the inverter OVP/UVP, then the OFP and UFP would be adequate to detect the islanding condition. However, when the load requirements are
62
being satisfied by the inverter only, detection of an islanding condition becomes more challenging.
The non-detection zone (NDZ) concept [120] is developed to determine the effectiveness of the anti-islanding algorithm for a given ∆ and∆ .
There are many active and passive methods that have been developed to detect an islanding condition. The Sandia frequency and voltage shift algorithms are effective in detecting islanding if implemented at the same time [121]
The Sandia algorithm adds a small amount of positive feedback to both voltage and frequency regulation by the inverter, so the inverter is continuously trying to destabilize the utility. It can work well if the utility is stiff; however, it can be problematic with a deep penetration of renewable resources [114].
6.3.2 CURRENT REGULATION
The amount of desired output power delivered to the utility is controlled through the current regulation algorithm. The accuracy of the current regulation algorithm is important for effective maximum power processing [114]. While many control algorithms have been proposed to control inverter output current for utility interactive operations, three major classes of regulators have been developed over the last few decades: hysteresis regulators, linear PI regulators, and predictive dead-beat regulators [115]. Many control algorithms have been proposed to control inverter output current for utility interactive operations. An algorithm that works harmoniously with grid synchronization methods and is also applicable to multilevel inverters is shown Appendix C along with its mathematical development. The algorithm can be used for both three-phase and single-phase systems once the dynamics are transferred into the rotating d, q reference frame [114]. The PI controller has the transfer function:
(6.1)
Digital implementation of the PI Controller can be realized with a z transformation [126].
(6.2)

63
6.3.3 PWM
The Pulse Width Modulation (PWM) generation algorithm produces duty ratios for individual inverter switches. PWM generation is modeled such that it can produce the switching positions for inverters of 2, 3, 4 and 5 levels. The current controller produces a reference voltage (Vref) between -1 and 1 that is scaled based on the number of levels in the topology; m denotes the number of levels. A multilevel comparator produces the switch position output between 0 to m-1 [114].
While PWM techniques provide independent control for each individual inverter phase leg, for three phase inverters it is possible to control all three inverter phase legs together to better use the available DC bus voltage.
Multilevel inverters generate their output voltage from three or more discrete voltage levels. For an m-level inverter the switching function for each phase takes on values between 0 to m-1. The phase leg voltage is:
∗1
Each switching state produces uniquely defined three phase line voltages. If the switching positions for the three phases are i, j, k, respectively, then the inverter output voltages can be represented by the switching vector as:
Switching vectors can be produced by the different switching positions of the inverter. For balanced output voltages, the sum of the line-to-line voltages must be zero; therefore the switching vectors can be represented in two dimensions. The reference voltage Vref can be realized as an inverter output voltage by application of the three closest vectors consecutively during one cycle. The main objective of the modulator is to select the switching positions of the inverter and the duration of how long each switch position needs to be applied by the inverter in order to produce the reference voltage. Appendix D shows the switching position vectors in coordinates for a three level inverter and provides extra background on the space-vector modulation algorithm for multilevel three-phase converters [114].
6.3.4 DESIRED PV INVERTER FEATURES
The following advanced inverter features for PV control include voltage regulation, VAR control, power curtailment, ramp rate control as suggested in the Southern California Photovoltaic Project [127].
64
Voltage regulation should regulate the voltage at the point of common coupling during PV output fluctuations. The PV inverter can potentially act as an active filter to mitigate power quality issues caused by non-linear loads, such as flicker, voltage sag/swell, and voltage variations especially for installations as the end of the feeder. Several changes are anticipated to implement this change:
Hardware may include changes to increase capacitor size and rating on the power electronic switches.
Complexity of interconnection studies will increase due to higher degree of interaction with other voltage regulating devices, supervisory control and coordination requirements
PV inverter control algorithms may change to droop control or output impedance synthesis.
Communication among devices to enable status update of other voltage regulating devices and regulating voltage at a selected point of the feeder.
VAR control could be designed to control reactive power output of a PV inverter to sink or source reactive power as a function of PV active power output variations, changes in the system. Dynamic VAR control is to smooth out voltage fluctuations caused by power intermittency of PV inverters. Dynamic VAR control can also be utilized to compensate for voltage drop on part of a feeder to achieve a flat voltage profile or reduce feeder losses. Emergency VAR control is also being contemplated. In this control mode, upon distribution operator request, each PV inverter supplies the maximum available reactive power output without reducing the active power output or violating the voltage limits. Expected positive impacts include: eliminating the effect of PV inverters on feeder voltage increase, reducing the number of tap-changer operations for LTCs, voltage regulators, and capacitor banks. The potential adverse impacts include: complexity in system design and interconnection studies, potential for dynamic interactions among multiple PV inverters with different control modes and responses from varying manufacturers, complexity in calculating availability and reliability of reactive power capacity for emergency use. Power Curtailment is a feature to provide some degree of dispatchability in PV inverters in terms of active power output reduction. The primary application is aimed at enabling utility operators to control the aggregated effect of total generation on distribution feeders during contingency conditions. A distribution operator could throttle back fast-acting generation to an aggregated reduced level rather than shutting down PV inverters or transmission connected systems. Expected benefits include: additional degree of flexibility for utility operators, reducing the voltage rise effect, managing unexpectedly large reverse power flow due
65
to sudden loss of load, and loss reduction. The potential adverse impacts include: potential voltage drop and under-voltage issues on part of a feeder, and loss of a large amount of renewable energy generation if there is no provision for energy storage resulting in uncaptured revenue for the PV system owner. Ramp rate control can be used during fast power fluctuations caused by cloud effects for start-up and shut-down of large PV inverters to balance the level of generation and load in the entire system. The maximum ramp rate of a system is typically determined by available spinning reserve and has to be oversized if there is no provision for power and load balancing by addition of PV systems. Expected benefits include:
Reducing the overall spinning reserve capacity requirements Minimizing downtime of renewable energy sources Contribution to frequency regulation of a system Low voltage and fault ride-through Islanding and microgrid operation capability
The principal objective of low voltage and fault ride-through is to prevent frequent disconnection of PV inverters during system transients that may cause significant voltage and frequency variations. Characteristics of low voltage and fault ride-through for distribution application are not well defined yet.
Incorporating intentional islanding and microgrid operation in a PV inverter requires a means of frequency regulation and load following capability. Although the control feature already exist in stand-alone PV inverters with battery storage, it is not typically implemented on large scale PV inverters due to the cost of energy storage and the additional components to perform simultaneous voltage/frequency regulation. The inverter and microgrid protection methodology and fast/accurate islanding detection schemes are some barriers that are not well established.
6.4 OFF-GRID (STAND-ALONE) PV POWER SYSTEM CONTROL
In the absence of the utility grid (standalone operation), it must be assured the inverter has an adequate supply of energy to draw upon. Unless there is battery backup in the system, the system cannot work on the principle of maximum power extraction from the source since this would lead to a sustained power imbalance. In standalone operation, power transfer is dictated primarily by the needs of the local loads and the losses within the inverter. If there is enough energy available at the source the local loads are fully supported by the inverter. If the demand from the loads is higher than the available energy at the source

66
then lower priority loads are needed to be shed to make energy available for supporting the higher priority loads [96,114].
There are parallels between the surge and demand variability characteristics of off-grid PV power systems and demand variation concerns faced by an electric power grid’s system operator; however a couple of significant differences are important to mention. One difference is that the off-grid PV power system has a relatively small number of loads, many of which are significant by comparison with the generating capacity, so variations in load tend to be relatively large and abrupt. The grid has millions of loads many of which are tiny by comparison with the generation capacity, so variation tends to be smooth. The other difference is that the grid can store energy by reducing consumption of generating plant fuel. Solar power cannot be conserved this way for later use for off-grid systems hence the need for a storage subsystem to keep some power for low-light conditions. When the storage is full the PV power conversion is throttled back and available energy is discarded.
6.5 FUTURE POWER SYSTEM CONTROL
Over the past decade considerable research and architectural development has resulted in a set of architectural principals and reference architectures to address the needs of a modern grid. The convergence of information technology (ICT) and energy technology (ET) to the power grid is the basis for a smart grid and the Ultra Large-Scale (ULS) power System Control Architecture [113].
Much of this architectural foundation was conceived in the early 2000s before social networks and smart phones were launched. Also, with much of the early focus on customer information interactions and relatively modest adoption of distributed energy resources until relatively recently, many of the physical variable distributed energy resources (DER), such as wind, integration issues were focused at the transmission level and most of the customer responsive demand was not tightly linked into real-time control of the grid. Now it has become imperative to address the practical architectural and engineering issues related to modernizing a grid to support the scale and scope of the resources envisioned in existing legislative and regulatory mandates in many parts of the developed world. In essence, the modern grid design brief has changed. It has become clear that we must address the integration of the following four principles [116]:
1. Information and communication networks
2. Markets, especially participation of prosumers (prosumer refers to an
electric customer that consumes energy from the grid as well as produces

67
power from onsite generation i.e. solar PV, fuel cell, etc. that feeds back into the grid) and merchant-provided DER services
3. Social networks as grids become interactive with customers and their smart devices.
4. Power grid (ET) with its inviolable set of physical rules
U.S. policy allows owners of distributed resources to effectively and
reliably provide their services at scale, and operate harmoniously on an interconnected distribution and transmission grid [116]. At scale, DER markets and pricing mechanisms can have a material effect on grid stability and reliability as visible or hidden elements that are tightly coupled within a closed loop of a distribution control system managing reliability and power quality. Market design is an essential element in grid control architectures for a future with significant distributed resources. NERC Reliability Standard Development most likely will also need to contemplate market interaction in the future.
As such, the convergence of the electric grid with ICT, markets and social
networks requires this modern grid [117] to have the following attributes:
Observable – able to determine extended grid state from a set of measurements
Controllable – able to reach any desired status in response to demands of consumers and other allowable control inputs
Automated – intelligent autonomous control functions with human supervision
Transactive – customer and merchant DER devices and systems (non-utility assets) participate in markets and grid operations
Secure – integrated multi-faceted security supporting the first four attributes Three of these five terms (observable, controllable and automated) are
technical terms from control engineering. Earlier efforts to create new grid control architectures based largely on
enterprise IT principles rather than control systems paradigms do not provide the necessary framework to meet the four principles described above [113].
The following three issues highlight changes on current control and operational systems [113]:

68
1. The consequence of the retirement of older fossil fueled generating resources and increase of DER resources as part of the portfolio may result in a net decrease of rotational inertia and therefore grid stability. This reinforces the need for algorithms for fast dynamical control to ensure grid stabilization at both transmission and distribution levels. While stated somewhat differently, this was also one of the findings highlighted in the CTPG studies mentioned earlier in section 5.2 of this Dissertation.
2. The concept of transactive control where customer premises may interact with energy and power markets on a programmed basis puts those markets into the control loops. This raises two issues: one is that price responsive loads may cause price and grid instability and the second is that they may cause “flash crashes” in the energy and power markets, in a fashion similar to what can happen in the stock markets with programmed trading.
3. If we consider the grid control problem then we are concerned with the following functions:
Unit commitment, dispatch, and balance Power flow control Regulation of voltage, reactive power, and system frequency Stabilization and synchronization Variable and distributed energy resources integration, distributed
generation and storage Market integration as a control loop function, including price
responsive loads Responsive load management, including demand response and
EEV charging Market participant behavior
It is becoming necessary to provide a means for coordinating controls at
various levels of the power delivery chain spanning dispatch/balancing, bulk and distributed generation, transmission, distribution and responsive load (customer premises or assets) levels. This does not mean that there should be one giant central control system; this is not feasible for many reasons. It does mean that macro control architecture should begin to embody certain architectural principles across these tiers, and to avoid ad hoc control architectures [113].
Traditionally, distribution was allowed to “float” based on tightly managing
the transmission system since power flowed in one direction. In a future with perhaps 30% of power being provided by solar PV at customer sites these models break down quickly. It is becoming clearer that new distributed market

69
mechanisms are needed. The California Independent System Operator (CAISO) in a recent paper on DER pricing acknowledged that distribution level factors need to be considered. However, the CAISO paper doesn’t recognize the control loop issues and actually suggests a pricing model that is inconsistent with control architecture principles described above [113]. New pricing mechanisms are needed to create effective closed loop systems that are tightly coupled with distribution control systems to ensure reliability and power quality [140].
Current market and pricing policy for most DER generally applies wholesale models to distributed resources that do not reflect distribution level information related to location, reliability or power quality considerations. While this simplifies aspects of wholesale market operations, at scale this approach may create power quality issues at distribution and in the worst case reliability issues. This is because some market designs cause the market function to act as a control element in a feedback control loop, whether intended or not. This loop is closed around a substantial portion of the power delivery system, including multiple operational tiers as illustrated in Figure 6.2 [113]. Note that feedback of state variables (not system outputs) causes the equilibrium price to move so as to re-establish the balance between supply and demand, and moves in the equilibrium price cause changes in available generation.
Figure 6.2 Market mechanisms in feedback control loop
6.5.1 CONTROL FRAMEWORK
Modern economies are not tolerant of grid disruptions and failure to achieve existing policy mandates related to renewable and distributed resources is not acceptable. Taft and Martini [113] propose three steps to resolve this. One of the steps proposed is to apply modern optimization methods to solve problems that allows for competing objectives, multiple constraints, and provides for both control federation and disaggregation so that each utility and energy service

70
organization has the ability to solve its local grid management problems, but within an overall framework that ensure grid stability. One such optimization strategy, a self-organizing strategy is proposed by Zhihua Qu et al [112].
6.6 TRANSITION IN CONTROL STRATEGY FOR INCREASED PENETRATION
The Optimal Power flow (OPF) strategy is the standard approach to dispatch and control of traditional generators in the transmission network [112]. The strategy has also been applied to distribution networks that have a few distributed generators. These results yield centralized controls (Figure 6.3b) by collecting the system-wide information and sending the command globally. For a power system whose transmission and distribution networks have numerous and geographically dispersed DGs, such centralized controls are too expensive to be implemented
A decentralized control mode (Figure 6.3a) such as the maximum photovoltaic power tracking (MPPT), constant VF (Voltage and Frequency) with droop mode, or the feeder power flow control mode, is useful in the distribution network if there are only a few DGs present [112]. However as PV penetration increases, intermittent changes of the PV outputs would also make a decentralized approach impractical to manage a distribution network.

71
Figure 6.3 Control Architectures
A more practical, potentially feasible solution to adequately manage the voltage profile is a distributed control configuration [118] (Figure 6.2c) that uses local communication networks and hence combines the positive features of both centralized and decentralized controls. The distinctive feature is robust with respect to intermittency and latency of its feedbacks, and also tolerates connection and disconnection of network components [118]. In general, the desired control algorithm should be able to manage a large number of DGs but require only local information from neighboring units. By doing so, groups of DGs can be formed autonomously based on the presence of local communication networks, and the power in a distributed network can be more easily dispatched and controlled with the goal that large swings in power outputs can be tolerated. For instance, a solution to the power-output coordination problem is to prescribe a certain utilization profile for all PVs in a group. By applying cooperative control theory of networked systems to power distribution networks, the control can make the PVs in one group converge to any given utilization profile while providing the desired power being dispatched from the group [112].
The basic idea of the proposed distributed control is that by incorporating local communication networks that share information among neighboring units, numerous PV generators autonomously form a number of generation groups and that each group is represented by a virtual generation unit which aggregates all the power generated within. The outputs of these virtual generators can be dispatched and controlled by a high level control (which is equivalent to a
72
transmission and distribution control center). While the latter is similar to the centralized configuration, the proposed control configuration requires much less communication since the numerous distributed generators do not communicate with the higher-level control. Once the power output of each group is dispatched, the proposed cooperative control coordinates all the outputs of PV generators in the same group so that, even though the output capacity of individual PVs may have large swings, a given profile is achieved for their utilization and the sum of their outputs converges to the dispatched value. This makes it possible for all the active PVs to self-organize themselves and be controlled. The local information sharing within one group of PVs may be intermittent, asynchronous, and of varying topology. The proposed control is then robust with respect to possible variations and limitations of communication networks. The utilization profile for PVs in the group can be determined according to such considerations as economic and regulatory policies [112].
6.6.1 CASE STUDY OPTIMIZATION BASED ON COOPERATIVE CONTROL
In the case study outlined in [112] three problems were defined:
1. Problem 1 Design a cooperative control system based on a fair utilization profile such that all the PVs in the group are to be run at the same active and reactive power output ratios.
2. Problem 2 Design the local communication network among the PVs (the S
matrix) in order to ensure efficiency and reliability of the network while minimizing economic costs.
3. Problem 3 Design a high level control based on the solutions of problems
1 and 2 such that, for each group of PVs, the voltage of a critical bus is of a specific value and the active power flow across certain transmission or distribution lines is a fixed amount.
6.6.1.1 COMMUNICATION TOPOLOGY
The topology of the local communication network among the PVs in one group can be time varying and asynchronous, in which case the communications matrix S describing the topology becomes piecewise constant. To ensure that a given utilization profile is achieved among one group of PVs, there needs to be local information sharing among them. The more communication channels there are, the more information propagates within the group, and the faster the convergence to the desired utilization profile. However this quickly becomes an uneconomical solution to the problem. From cooperative control theory [119], it follows that the minimum requirement on communication topologies is the so
73
called sequential completeness condition. For the purpose of distributed control design, the following rule is given for designing local communication networks and scheduling local communications.
Rule: The communication matrix S is piecewise constant, and the corresponding sequence : , , … is sequentially complete.
The sequential completeness condition is a very precise method to schedule local communication, and it is the necessary and sufficient condition for any properly-designed cooperative system to converge [119].
.
6.6.1.2 CASE STUDY RESULTS
Z. Qu et.al. [112] utilized the IEEE 34-bus distribution network to illustrate the effectiveness of the proposed distributed two-level control strategy. The network’s main voltage is 24.9 kV and the network includes 16 PV generators and one gas turbine generator. Detailed results of the simulations are contained in [112]
In this distribution network, the distributed generators (including the gas turbine generator) provide power to not only the local loads but also the external main grid. In the simulation was done using Digsilent software and showed total penetration levels of PVs were increased up to about 220%.
Subsequent studies that were conducted verified the proposed distributed two-layer control can make the system operate well and all the PV generators converge according to the desired utilization profile for the following disturbances: 1- Short-circuit faults 2- Changes in sunlight 3- load changes and intermittent communication interruptions [112].
This proposed two-level control scheme for the power groups of PV generators in the distribution network can autonomously adjust itself to a feasible operating point (after disturbances occur) so that all the PV generators in one group converge to a prescribed utilization profile. The proposed controls require only intermittent information sharing among neighboring generators, and topologies of local communication networks can be time varying. As long as the communication networks meet the minimum information exchange requirement (of the matrix sequence being sequentially complete), the proposed controls ensures convergence. The proposed design methodology is also applicable to distribution networks with different types of DGs including wind [112].
74
6.6.2 OTHER FUTURE DISTRIBUTION SYSTEM CONFIGURATIONS AND CHARACTERISTICS
As part of Southern California Edison’s (SCE) distribution Smart Grid initiatives, SCE has engaged in two projects involving advanced distribution automation and active voltage control that may provide insight into future distribution system designs [127]. The two projects are (1) Avanti circuit of the future [128], and (2) Irvine Smart Grid demonstration (ISGD) project [129].
The Avanti circuit design includes a distribution level dynamic reactive power compensator to provide voltage and VAR support. The circuit is also equipped with solid-state fault current limiter, remote control switches, and fault interrupters to facilitate integration of distributed generation and protection coordination. The project objective was to demonstrate an integrated design, interoperability of various control devices, and operational features that can be achieved in distribution circuits equipped with intelligent devices, coordinated and operated through a SCADA system [127].
The ISGD project serves customer loads distributed on two adjacent feeders that can be operated as a closed or an open loop. Universal remote control interruption devices with two-way communication infrastructure are provisioned to change circuit topology and transfer loads from one circuit to another during faults and contingency conditions. The project also targets specific Smart grid aspects such as (1) automatic volt/VAR control, (2) utilization of community-level energy storage for distribution constraint management, and (3) advanced control and protection strategies for self-healing circuits [129].

75
7.0 SUMMARY AND FUTURE WORK
More renewable energy sources and distributed generation sources are happening. They can reduce the need for long distance transmission systems, but they will cause increased stress on distribution networks.
RPS goals cannot ignore the reliability aspect of integrating renewables onto the grid. Future policy must consider reliability when developing RPS goals. It is recommended that future senate bills such SB1 (CSI) and SB2 (RPS) be reviewed together and preferably combined into a single initiative to account for all the renewables on the grid for reliability purposes. Z. Qu et.al. [4] provide a control strategy for Fair Utilization and Control design for System Coordination based on the application of a cooperative control for power flow control of photovoltaic generators. Their study shows penetration levels can be increased up to about 220% provided that all the PVs are run according to the fair utilization profile and their power factors are also kept the same. This can be a tremendous benefit once it demonstrated on an actual system. It would also be very interesting to add some storage and repeat the simulations. Water-borne PV systems can provide an alternative solution to land use environmental requirements in permitting solar projects. Water borne systems also augment solar rooftop initiatives to add additional distributed generation. Floating PV on WWT plant ponds can be a valuable energy efficiency strategy and can be an effective bridge to mitigate the high penetration issue of installing increasing amounts of renewable generation on distribution networks until new control strategies and storage are developed. The water-borne system can be integrated into the electric grid as well as act as a stand-alone system in behind the meter installations. Because of its unique features, the water-borne system requires 50-70% less area .These water-borne systems are geographically dispersed; therefore the high penetration issue is greatly reduced. Future articles will discuss design criteria for economical water-borne systems and discuss lesson learned from the pilot project installation.
Nonimaging optics is a wonderful development, and its application to CPV may provide path forward for the solar PV industry in conjunction with the continued improvement in efficiency of multijunction cells as discussed in Appendix A. The current low cost of silicon cells has dealt a blow to the CPV market. Flat panel designs are also gaining in efficiency; the latest designs have efficiency of 22%. Water-borne installations designs should consider the lowest
76
life cycle cost in the design approach. The Cost Benefit showed that behind the meter installations are approximately 10% less analysis costly than systems that are integrated on the transmission side of the meter due to wheeling and transmission access charges.
While Chapter 5 discussed the methodology for integrating renewables including PV into the transmission system, many DER installations are more likely to be integrated into the distribution network. The power flow type of analysis needs to solve large scale problems from transmission-level voltages down to secondary service points, including heavily meshed secondary distribution systems. The power flow analysis should address both steady-state and dynamic overload, voltage flicker and control concern. A power flow and voltage drop study should be performed to determine the steady-state loading profile of the system. The power flow should be capable of stepping through time-sequenced operations of the circuitry’s active components, including rapid changes in loading such as system responses to changes in PV outputs and loading associated with rapid configuration changes [127]. New tools for planning engineers need to be developed to address these challenges.
As discussed in chapter 6, integrating renewables and PV into the distribution network can be very challenging. Some of the differences in analysis algorithms were compared for conducting power flow studies and were contrasted with those used in transmission planning studies. New algorithms and software tools will need to be developed for future high penetration because the definition of stability and reliability will include market and social networking variables. Distribution Engineers will need to become versed in alternative control strategies such as cooperative control theory as well as network engineering and cyber security. Market forces will have to be captured into the control system algorithm. As DER and distributed PV continue to gain momentum and increased market acceptance, new and improved control systems and regulatory requirements will become vital and very important. This was demonstrated by the IEEE bus simulation where penetration was able to increase to 220% using a two level cooperative control strategy implementing a fair optimization algorithm.
7.1 FUTURE RESEARCH
Further Areas of research to follow and develop:
1. Complete the list and ranking of the California WWT plant sites for potential installation of the water-borne systems. Expand the study to other western states.

77
2. Assist in the development of a PV water-borne system for installation in a WWT facility.
3. Determine the measures and scale factors to reduce the cost of the water–borne system below $2.70/watt including the inverter.
4. Traditional grid planning is based on worst case deterministic “contingency” scenarios and related risk analyses as discussed in chapter 5. This approach focuses on the loading characteristics of transmission lines, distribution feeders, substations and transformers based on forecasts of generation and customer demand. Today transmission system modeling includes stochastic analysis, but not typically integrated with variable DER or distribution system analysis. Develop software analysis tools that provide numerous dynamic scenarios and energy flows moving in many directions at once across distribution and transmission. These tools also need to account and provide flexibility to include new control system designs and ability to include storage elements.
5. Grid operations in the coming decade will undergo a significant transformation due to increased variability in electric generation production from wind and solar as well as customer load becoming less predictable given onsite generation and responsive loads [140]. Controllability in the context of millions of dynamic resources in a market across transmission and distribution is not yet well understood. There is an urgent need to consider the interactions across the grid and the current operational systems to ensure grid stability and reliability.
6. Given these fundamental changes, can cooperative control be effectively applied to utility distribution networks with variable inputs. A two layer fair utilization profile using cooperative control was briefly discussed in chapter 6 that shows promise in a simulated case, but how does one determine the fair utilization profile to account for market reactions and social networking responses. Perhaps the related risk management techniques adapted from other mission-critical industries should be evaluated.
7. New control schemes as well as storage systems have been shown to help increase the penetration level of distributed renewables on distribution networks. What is the optimum, most efficient, and cost effective combination of these methods.
8. The three pillars of control: observability, controllability, and algorithms are helpful in considering changes to operational systems. Currently, the industry does not have either robust observability strategies or related measurement strategies. Phasor measurement units (PMUs), sensors that monitor power

78
characteristics in very small time increments-30-120 samples per second, are a vast improvement in the fidelity of information with traditional 4 second updates still widely used. A utility with 50 PMUs, 2.5 million smart meters and other sensors will accumulate about 20 billion pieces of grid state data each month [140]. Integrating this data with appropriate controls to see disturbances as they develop so proper corrective action can take place requires further development.
9. With increased penetration of distributed energy resources such as solar PV, treating distributed resources as negative load will not work as additional strain will be placed on transmission side resources to compensate for variability in DERs as well as physical problem on distribution circuits. There is also the potential for significant operational flexibility in the distribution system related to customer loads, which are currently underutilized, that may prove useful in buffering the effects of renewable source variability at the bulk system level. Further research is needed to resolve the questions related to how tightly or loosely coupled distributed resources (generation, storage and demand) should be to maintain overall grid reliability and power quality[140]. This involves the evolution of distributed controls talked about in Chapter 6.
10. The role of system checks, whether human or machine is an important consideration in the discussion of centralized and distributed market designs and possible links to dynamic price signals as significant system control inputs as alluded to in chapter 6. This is because of the potential to enable unintended effects like the financial market flash crashes that have occurred several times over the past five years. Since these can occur in seconds or less, there is a growing recognition that machine-to machine based systems leveraging expert systems and adaptive controls will be needed. A number of architectural issues remain to be resolved including the role of market in grid control systems, multiple time scales, multiple granularity levels, and local versus wide-area controls.
Electric Utility company control centers are evolving from a human-centric operational model to a machine-centric model, much as the aviation industry has evolved to ‘fly-by-wire” systems [140]
11. Use the similarity measure described in the Southern California Edison High-Penetration Photovoltaic Project [127] to develop tools that utility distribution provides and Resource planners can use to analyze the penetration of DER on their distribution systems. The methodology uses geographic and statistical analysis to determine the similarity of a large set of non-studied feeders with respect to a small set of studied feeders.
79
12. How to manage the transition and related operational and market systems in a manner that doesn’t result in an unstable and unmanageable system is a challenge. The likelihood is that for most of the next 20 years the electric system will evolve into a hybrid set of centrally controlled generation, storage and power management devices and a distributed set of resources managed on a more decentralized basis leveraging the self-managed capabilities of DER. A nice advantage of the water-borne system discussed in this Dissertation is that it helps fill the gaps during this transition time.
The current complexity and operational instability issues facing Germany’s electric system may be a good example of challenges ahead [144]. The article [144] suggests that although PV may be able to give some relief to the grids, PV cannot reduce the need for peak capacity and additional PV will cause a considerable growth in the need for regulating capacity. The regulating work which must be made by controllable power sources grows considerably with the growth of wind power and PV. TenneT is one of Germany’s four main grid operators. In the TenneT area, a calculation for April 2011 has shown that wind power alone would extend the regulating range by more than 50 percent, while the actual combination of wind power and PV has doubled the regulating range.
On November 4, 2006, a German 380-kilovolt line had to be temporarily disconnected. Due to insufficient coordination of protection systems, a circuit tripped and started cascading outages. The result was that the continental grid in Europe was divided into three islands and about 17 gigawatts of load was shed. The case demonstrates how a local event in Germany can turn into a widespread European disturbance [144]. Since the German system is heavily stressed, there is good reason for concern.
13. Work to integrate change in regard to integrating inverters into distribution system for voltage control, a key to increased levels of penetration of PV.
14. Increase the reliability of inverters [96] for 20 year life and oversized for grid application. Work to decrease the reluctance to adapt the existing infrastructure and modify traditional practices to allow this to happen through the implementation of successful demonstration projects in the field to show new practices are safe, reliable and beneficial.
15. The latest stage of electricity market evolution involves a thousand-fold increase in the number of spot markets in the largest U.S. markets. This results in creation of more than 20,000 Locational Marginal Pricing (LMP) nodes nationwide. The intent is to provide greater pricing fidelity to generation and transmission operation and investment decisions. LMP markets are spot markets intended to address bulk power system balancing needs that do not reflect appropriate price signals for distributed resource investment or for
80
investment in bulk power generation resources. As such. LMP markets have made large-scale generation resource allocation on shorter time scales quite difficult as both the unit commitment problem is very hard to solve exactly, and long-term capital investment isn’t driven by short-term marginal pricing/profits. Neither investors in generation and transmission nor retail customers want to be exposed to levels of extreme variability and volatility. This is why more than 80% of the energy transacted in North American markets is through long-term bi-lateral contracts between producers and Load Serving Entities. These long term purchase contracts typically set the price by which new generation is built.
The use of dynamic wholesale spot pricing like LMP, for customer demand response, creates challenge. Wholesale spot prices sent to customer devices inherently creates a form of decentralized real-time control, where each customer or aggregator sets device response characteristics based on their preferences. The inherent closed-loop feedback between volatile spot price and aggregate demand could result in undesirable cycling of devices (and feedback into market pricing). These prices do not reflect distribution level information related to location, reliability or power quality considerations and will create issues for distribution systems [140].
Is LMP an appropriate market pricing mechanism for a hybrid electric system with tens of millions of distributed resource actors as envisioned by FERC? Appropriate price and market mechanisms to be developed to value energy at a particular point on a distribution system. New pricing mechanisms are needed to create effective closed loop systems that are tightly coupled with distribution control systems to ensure reliability and power quality as discussed in chapter 6.
16. Network design and new control strategies must be integrated in such a manner to protect against cyber attack. Increasing levels of DER and CPV on distribution networks will require more interconnected networks and control systems. The growing threat of cyber attack to energy related control systems is ever increasing and so cyber security will be vital for future new distribution control systems to accommodate high penetration levels of distributed renewable resources.
17. The U.S. electrical system serves more than 144 million customers through about 6 million miles of wire and cable and some 600,000 distribution circuits originating from an estimated 60,000 substations [145]. Unlike transmission planning, distribution system planning does not typically involve a multi-stakeholder process that considers various proposed uses for the system before engineering is conducted and investments determined. As such, the lack of insight on the potential use of the system can lead to a systematic under valuation and investment, resulting in a failure to achieve societal needs. An early indication of the challenge is the significant growth in the backlog of distributed generation applications [146]. Estimates for fully capable distribution

81
circuits suggest an additional cost of between $2 million and $3.5 million per circuit for physical upgrade and intelligent control systems [147]. Who should pay for these costs? A recent proposal by California utilities for a non-bypassable network use charge is an attempt to address this. However, it is not clear that this type of proposal alone will achieve energy policy objectives or the interests of the utility. For example, non-bypassable charges may accelerate the adoption of onsite energy storage combined with solar photovoltaic systems and home energy management systems. This may make it possible for a customer to leave the grid entirely, echoing another telecom phenomenon: the rise of mobile phone service-only households, which now exceed 30% of the u.S. market, and even higher globally. The paradox is that customers leaving the grid will compound the issue of fixed cost recovery driving rates higher on a declining delivery revenue leading to potentially more customers leaving and ultimately a “death spiral” [140]. Rate redesign is needed to separate fixed costs associated with grid infrastructure using fixed fees from variable costs like energy commodity that are more appropriate for volumetric pricing.
82
REFERENCES
[1] U.S. Renewable Energy Technical Potentials: A GIS-Based Analysis Lopez, A; Roberts, B; Heimiller, D; Blair, N; Porro, G Technical Report
NREL/TP-6A20-51946 July 2012 Available electronically at http://www.osti.gov/bridge
[2] Integrating Renewable Electricity on the Grid A Report by the American Physical Society (APS) Panel on Public Affairs February 2012
Pages: 2,8
[3] Principles of Solar Engineering Second Edition Goswami, D.; Kreith,F; Kreider J
Page: 13
[4] Solar Shield- Protecting the North American Power Grid-NASA Science Phillips, T. October 26, 2010
Pages: 1-3 http://science.nasa.gov/science-news/science-at-nasa/2010/26oct_solarshield/
[5] Solar Superstorm Could Knock Out US Power Grid – Experts Reuters edited by Simao, P October 2, 2012
Pages: 1-5 http://www.reuters.com/article/2012/08/04/us-solar-superstorm-idUSBRE8721K820120804
[6] NERC 2012 Special Reliability Assessment Interim report: Effects of Geomagnetic Disturbances on the Bulk Power System
February 2012 Pages: ii-iv
[7] Nonimagining Optics Winston, R.; Minano, F; Benitez P; contributions from Shatz, N.; Bortz,J
Pages: 46,99 [8] High Collection Nonimagining Optics Welford, W.T.; Winston, R
Pages: 115-116
83
[9] Implications of Liousville’s Theorem on The Apparent Brightness
Temperatures of Solar Radio Bursts Solar Physics 116 (1988) Melrose, D.B; Dulk G.A
Pages: 141-156
[10] The 2011 Integrated Energy Policy Report California Energy Commission CEC-100-001-CMF http://www.energy.ca.gov/2011publications/CEC-100-2011-001/CEC-100-
2011-001-CMF.pdf [11] [155] An Energy Policy Essay Renewable and Distributed Power in
California Simplifying the Regulatory Maze- Making the Path for the Future Carl, J.; Grueneich, D.; Fedor, D.; Goldenberg, C Shultz-Stephenson Task Force on Energy Policy www.hoover.org/taskforces/energy-policy pp 1-48
[12] California Energy Efficiency Strategic Plan Strategic Plan Progress Report Energy Division, pursuant to D.09-09-047 October 2011
Pages: 1-14
[13] How Updating climate-blind environmental laws could speed-up US Solar Development CSP Today (http://social.csptoday.com) April 4, 2013 Pages: 1-4
[14] Streamlining Solar Permitting and Overcoming Environmental Hurdles to
speed-up CSP development in the US CSP Today (http://social.csptoday.com) April 10, 2013 Pages: 1-4
[15] 2010 CTPG Phase 1 Study Report April 21, 2011
Pages: 3 The final 2010 CTPG Phase 1 Study Report is available at http://www.ctpg.us/archived-documents

84
[16] 2010 CTPG Final Study Report Phase 2 May 7, 2010
Pages: 3 The final 2010 CTPG Phase 2 Study Plan is available at http://www.ctpg.us/archived-documents
[17] 2010 CTPG Study Report Phase 3 September 10, 2011
Pages: 3 The final 2010 CTPG Phase 3 Study Plan is available at http://www.ctpg.us/archived-documents
[18] 2010 CTPG DRAFT Phase 4 Study Report DRAFT FINAL February 2, 2011
Pages: 3 The final 2010 DRAFT CTPG Phase 4 Study Plan DRAFT FINAL is available at http://www.ctpg.us/archived-documents
[19] 136 FERC ¶ 61,051 UNITED STATES OF AMERICA FEDERAL ENERGY REGULATORY COMMISSION
Transmission Planning and Cost Allocation by Transmission Owning and Operating Public Utilities
Docket No. RM10-23-000 Pages: 1-15
[20] Renewable Systems Interconnection Study: Distributed Photovoltaic Systems Design and Technology Requirements Whitaker C; Newmiller J; Ropp M; Norris B Sandi Report SAN2008-0946P February 2008 Pages: 4-11
[21] Evaluating the Benefits and Costs of Net Energy Metering in California Beach, R.; McGuire, P Crossborder Energy January 2013 [22] California Energy Efficiency Strategic Plan Strategic Plan Progress Report

85
Energy Division, pursuant to D.09-09-047 October 2011
Pages: 1-14
[23] Reliability Standards for Geomagnetic Disturbances United States of America Federal Energy Regulatory Commission 18 CFR Part 40 [Docket No. RM12-22-000; Order No. 779] May 16, 2013
[24] Principles of Solar Engineering Second Edition Goswami, D.; Kreith,F; Kreider J
Page: 13-14
[25] Offshore Membrane Enclosures For Growing Algae (OMEGA): A System For Biofuel Production, Wastewater Treatment and CO2 Sequestration
Trent et al.
[26] Nonimaging Fresnel Lenses Design and Performance of Solar
Concentrators Leutz, R.; Suzuki, A. Pages 18-25
[27] Nonimagining Optics Winston, R.; Minano,F; Benitez P; contributions from Shatz, N.; Bortz,J
Page: 22 [28] High Collection Nonimagining Optics Welford, W.T.; Winston, R
Pages: 22-29, 223-230
[29] Nonimagining Optics Winston, R.; Minano,F; Benitez P; contributions from Shatz, N.; Bortz,J
Page: 115-116, 415-420
[30] Implications of Liousville’s Theorem on The Apparent Brightness Temperatures of Solar Radio Bursts
Solar Physics 116 (1988) Melrose, D.B; Dulk G.A
Pages: 154-155 [31] API Conference Proceedings 1477, 98 (2012); doi: 10.1063/1.4753843
Solar Cells Design For Low and Medium Concentrating Photovoltiac Systems Baig,H.; Heasman, k; Sarmah, N; Mallick,
86
Page:1
[32] Nonimaging Fresnel Lenses Design and Performance of Solar Concentrators
Leutz, R.; Suzuki, A. Page: 77 [33] Optical Design using Fresnel Lenses Basic Principles and Some Practical
Examples Davis, A.; Kuhnlenz, F Page: 1-8 [34] Nonimaging Fresnel Lens Concentrators For Photovoltaic Applications Leutz, R.; Suzuki, A.; Akisawa, A; Kahiwagi T [35] Optical Design using Fresnel Lenses Basic Principles and Some Practical
Examples Davis, A.; Kuhnlenz, F Pages: 50-51 [36] Principles of Optics Born, M.; Wolf, E. Pergamon, Oxford, 6th edition 1989 [37] Nonimaging Fresnel Lenses Design and Performance of Solar
Concentrators Leutz, R.; Suzuki, A. Pages: 41-44
[38] Nonimaging Fresnel Lenses Design and Performance of Solar Concentrators
Leutz, R.; Suzuki, A. Pages: 51-52,77-92 [39] Nonimaging Fresnel Lenses Design and Performance of Solar
Concentrators Leutz, R.; Suzuki, A. Pages: 101-110,179-181
[40] Nonimaging Fresnel Lens Concentrator-The Prototype Leutz, R.; Suzuki, A.; Akisawa, A.; Kashiwaga, T Pages: 5-
87
[41] Active Solar Collectors and Their Applications Rabl, A
Oxford, New York, 1985
[42] Nonimaging Fresnel Lenses Design and Performance of Solar Concentrators
Leutz, R.; Suzuki, A. Pages: 184-195
[43] Nonimaging Fresnel Lenses Design and Performance of Solar Concentrators
Leutz, R.; Suzuki, A. Pages: 45-49
[44] Acrylic Polymers for Optical Applications Jans, R.W In Proceedings of the SPIE, Physical Properties of Optical Materials,
volume 204, San Diego, Californ1a, August 1979 Pages: 1-8
[45] Schott Computer Gaskatalog version 1.0 Schott Glaswerke, Mainz, 1992
[46] Step Lenses and Step Prisms for Utilization of Solar energy Oshida, I
In New Sources of Energy, Proceedings of the Conference, United Nations, volume 4, August 1961, Rome Italy Pages: S/22. 598-603
[47] Fundamentals of Photovoltaic Conversion of Concentrated Sunlight Photovoltaic Conversion of Concentrated Sunlight Wiley, Chichester, 1997 Grilikhes, V.A.; Andreev, V.M.; Rumyantsev, V.D. editors [48] Transfer and Distribution of radiant Energy in Concentration Systems Photovoltaic Conversion of Concentrated Sunlight Wiley, Chichester, 1997 Andreev, V.M; Grilikhes, V.A.; Rumyantsev, V.D. editors
88
[49] Parameter Analysis on Solar Concentrator Cells Under Nonuniform Illumination In 16th European Photovoltaic Conference and Exhibition, Glasgow, United Kingdom, May 2000 Araki, K.; Yamaguchi, Y.
[50] Estimating and Controlling Chromatic Aberration Losses For Two-Junction, Two Terminal Devices in Refractive Concentrator Systems
In Proceedings of the 25th IEEE Photovoltaic Specialists Conference, Washington, D.C. May 1996 Pages: 361-364
[51] Concentrator Multijunction Solar Cell Characteristics Under Variable
Intensity and Temperature Kinsey, G; Hebert, P; Barbour, K; Krut, D; Cotal, H; Sherif, R Spectrolab Inc. [52] Optical Design Using Fresnel Lenses Basic Principles and Some Practical
Examples Davis, A; Kuhnlenz, F Reflexite Optical Solutions Business Page 2 [53] Concentrator Multijunction Solar Cell Characteristics under Variable
Intensity and Temperature Kinsey, G.S.; Hebert, P.H.; Barbour, K.E; Krut, D. D.; Cotal, H.L.; Sherif,
R.A [54] Reduced Temperature Coefficients for Recent High-Performance Silicon
Solar Cells Prog. in Photovoltaics” Research and Applications,v.2, n.3 1994 Pages:221-225 [55] Reduced Temperature Dependence of High-Concentration photovoltaic
Solar Cell Open-Circuit Voltage (Voc) at High Concentration Levels 24th IEEE Photovoltaic Specialists Conf, v.2 1994 Pages: 1500-1504 [56] Pathways to 40%-Efficient Concentrator Photvoltaics Presented at the 20th European Photovoltaic Solar Energy Conference
and Exhibition, Barcelona, Spain, 6-10 June 2005 King, R.; Law, D; Fetzer, C.; Sherif, R; Edmondson, K.; Kurtz, S.; Kinsey,
G; Cotal, H; Krut, D; Ermer, J; Karam, N
89
[57] Solar Cell Generations over 40% Efficiency Published online in Wiley Online library (wileyonlinelibfrary.com)
DOI:10.1002/pip.1255 King, R.; Bhusari, D.; Larrabee, D.; Liu, X.; Rehder, E.; Edmondson, K.;
Cottal, H.; Jones, R.; Ermer, J.; Fetzer, D.; Law, D.; Karam, N. Presented at 26th EU PVSEC, Hamburg, Germany 2011 [58] III-V Multijunction Solar Cells For Concentrating Photovoltaics Cotal, Hector; Fetzer, C; Boisvert, J.; Kinsey, G.; Hebert, P.; Yoon, H.;
Karam, N Energy Environ. Sci 2009 2 Pages: 174-192 [59] Physics of Semiconductors, Wiley, New York, 2nd edn, 1981 Sze, S.M
Pages: 245-311 [60] J. Electr, Mater., 1991, 20 Ren, A.; Emerson, A.B; Pearton, S. J.;Hobson, W.S.; Fullowan, T.R.;
Lothian, J. Page: 595 [61] Appl. Phys. Lett., 1976, 29 Wada, O.; Yanagisawa,S.; Takanashi, H. Pages: 263-265 [62] J. Appl. Phys. 1986, 60 Lahav ,A.; Eizenberg, M.; Komem, Y. Page:99 [63] Semicond. Sci. Technol., 1999, 14 Nuhoglu, C.; Saglam, M.; Turut, A. Pages:114-117 [64] Appl. Phys. Lett., 1982, 42 Waldrop, J.R. Page: 350 [65] Appl. Phys. Lett., 1984, 44 Waldrop, J.R. Page: 1002 [66] Progress In High-Efficiency Terrestrial Concentrator Solar Cells Jones, R.K.; Hebert, P.; King, R.R.; Bhusare, D.; Brandt, R.; Al-Taher, O.;

90
Fetzer,C.;Ermer.J
[67] Solar Cells: Operating Principle, Technology and System Applications,
Green Prentice Hall, 1982
[68] Advances in High Efficiency III-V Multijunction Concentrator Cells King et al. Advances in OptoElectronics, 2007 [69] Advances in OptoElectronics, 2007 King et al. [70] http://www.fraunhofer.org/News/ISE_PI_e_World%20Recod.pdf [71] New Horizons in III-V Multijunction Terrestrial King, R. et al. [72] High Collection Nonimagining Optics Welford, W.T.; Winston, R
Pages: 192-195 [73] Energy Baseline For Municipal Wastewater Treatment Plants Prepared for Pacific Gas and Electric Company New Construction Energy
Efficiency Program Prepared by: BASE Energy, Inc
San Francisco California September 2006
[74] Municipal Wastewater Treatment Plant Energy Baseline Study Prepared for Pacific Gas and Electric Company New Construction Energy
Efficiency Program Prepared by: M/J Industrial Solutions
San Francisco California June 2003
[75] Benefits of a Water-Borne CPV System 8th International Conference on Concentrating Photovoltaic Systems
AIP Conf. Proc. 1477 Rosenthal, S.; Earl, D
Pages: 297-300
[76] Under Obama, 11,327 Pages of Federal Regulations Added cnsnews.com

91
September 12, 2012 [77] Handout Congressional Research Service Analysis of a 2008 Study
commissioned by the Small Business Administration September 7, 2012
[78] The Importance of Cost-Benefit Analysis in Financial Regulation U.S Chamber of Commerce Center For Capital Markets and Competitive
Fairness Rose, P; Walker, C March 2013 [79] Moritz Professors Present Findings On Cost-Benefit Analysis in
Rulemaking to U.S. Chamber of Commerce The Ohio State University Moritz College of Law March 12, 2013
[80] US Army Cost Benefit Analysis Guide 2nd edition April 8, 2011 Page 19 [81] Principles Of Engineering Economy 6th edtion Grant, E; Ireson, W; Leavenworth, R Pages: 132-141 [82] An Introduction To Cost Benefit Analysis
Thayer Watkins http://www.sjsu.edu/faculty/watkins/cba.htm
[83] Energy Production by Microbial Photosynthesis Beneman, J.R; Weissman, J.C.; Koopman, B.L; Oswald, W. J.
Nature, Vol 268, No. 5615, July 7, 1977 Pages: 19-23
[84] Photosynthesis In Sewage Treatment Oswald, W.J; Gotaas, M. American Society of Civil Engineers Transactions Paper No. 2849 [85] Interconnection Facilities Study Report Generation Interconnection Northern California Power Agency Lodi Energy Center Final Report Completed in coordination with Pacific Gas & Electric January 20, 2009

92
[86] NCPA CIP:002-3 Compliance Project System Studies Report-Summer Peak and Off Peak Final Report Revision 1.1
January 13, 2013
[87] Solar Plant Modeling Impacts on Distribution Systems PV Case Study Shirek, G.J.; Lassiter, B.A [88] Solar Energy Grid Integration Systems “SEGIS”
Sandia National Laboratories, U.S. Department of Energy Efficency and Renewable Energy Program Concept Paper October, 2007
[89] Investigation of Voltage Stability for Residential Customers Due to High
Photovoltaic Penetrations Yan, R,; Saha, T.K IEEE TRANSACTIONS OF POWER SYSTEMS, vol 27, no 2 May 2012 [90] Effects of Large-scale photovoltaic Power Integration on Electricity
Distribution Networks Paatero, J.; Lund, P ScienceDirect available online March 22, 2006 at www.sciencedirect.com [91] Integration of Photovoltaic Power Systems In High Penetration
Clusters For Distribution Networks and Minigrids Katiraei, F.; Mauch, K; Dignard-Bailey, L International Journal of Distributed Energy Resources,
Vol 3 Num 3 July-September 2007 [92] Not Used [93] Secondary Network Distribution Systems Background and Issues Related
to The interconnection of Distributed Resources Behnke, M; Erdman, W; Horgan, S; Dawson, D; Feero, W; Soudi, F.,Smith, D; Whitaker, C; Kroposki, B
Technical Report NREL/TP-560-38079 July 2005
[94] Not Used [95] Interconnecting PV on New York City’s Secondary Network Distribution
System Anderson, K; Coddington, M; Burman, K; Hayter, S; Kroposki, B;
Watson, A Technical Report NREL/TP-7A2-46902 November 2009
93
[96] Renewable Systems Interconnection Study: Distributed Photovoltaic Systems Design and Technology Requirements
Whitaker, C; Newmiller, J.; Ropp, M; Norris, B Sandia Report SAND2008-0946 P February 2008 [97] Not Used [98] Comparison of Distribution Systems Power Flow Algorithms For Voltage
Dependent Loads Eminoglu, U; Hocaoglu, M.H [99] The Effect of Photovoltaic Power Generation on Utility Operation Chalmers, S.; Hitt, M.; Underhill, J.; Anderson, P.; Vogt, P.; Ingersoll, R.
IEEE Transactions on Power Apparatus and Systems; PAS-104,1985 Pages: 524-530
[100] A Study of Dispersed PV Generation on the PSO System Jewell, W.; Ramakumar, R.; Hill, S. IEEE Transactions on Energy Conversion; Vol. 3, 1988 pp.473-478 [101] Not Used
[102] Not Used [103] Limits on Cloud-Induced Fluctuation in photovoltaic Generation Jewell, W.; Unruh, T. IEEE Transactions Energy Conversion; Vol. 5, 1990 pp. 8-14
[104] Not Used [105] Influence of Photovoltaic Power Generation on Required Capacity for
Load Frequency Control Asno, H.; Yajima, K.; Kaya, Y. IEEE Transactions on Energy Conversion; Vol. 11, 1996
pp.188-193
[106] International Energy Agency Report IEA PVPS T5-10:2002, February 2002,
Povlsen, A. Available online at www. iea.org [107] Not Used

94
[108] Not Used [109] Not Used [110] Utility Interconnection Experience with an Operating Central Station MW-
Sized Photovoltaic Plant Patapoff, N.; Mattijetz, D. IEEE Transactions on Power Systems and Apparatus, PAS-104, 1985 pp. 2020-2024 [111] An Effective Approach for Distribution System Power Flow Solution Alsaadi, A.; Gholami, B World Academy of Science, Engineering and Technology 28 2009 pp. 732-736 [112] A Self Organizing Strategy for Power Flow Control of Photovoltaic
Generators in a Distribution Network Xin, H.; Qu, Z., Sueuss, J.; Maknouninejad, A. [113] Ultra Large Scale Power System Control Structure A Strategic Framework For Integrating Advanced Grid Functionality Taft, J.; De Martini, P October 2012 [114] Control of Utility Interactive Inverters Sozer, Y.; Torrey D Pp 1-13 [115] Decoupling Control of d and q Current Components in Three-Phase
Voltage Source Inverter Milosevic, M. pp. 1-11 [116] United States Congress, 2007 Energy Independence & Security act, Title
XIII-Smart Grid, Section 1301- Statement on Policy on Modernization of Electricity Grid
[117] National Energy Technology Lab, Modern grid Strategy: Smart Grid Concepts Presentation US DOE, September 2009
[118] Distributed Control for Identical Dynamically Coupled Systems: A decomposition Approach
Massioni, P.; Verhaegen, M. IEEE Transactions on Automatic Control, vol. 54, no 1 January 2009
Pages: 124-135

95
[119] Cooperative Control of Dynamical Systems Qu, Z. Springer 2009 [120] Evaluation of anti-islanding schemes based on non detection zone
concept Ye, Z.; Kolwalkar, A.; Zhang, Y.; Du, P.; Walling, R. IEEE Trans. On Power Electronics, Vol. 19, No.5 September 2004 Pages: 1171-1176 [121] Development of Testing of Anti-Islanding in Utility-Interconnected
Photovoltaic Systems Stevens, J.; Bonn, R.; Ginn,J.; Gonzalez, S. Sandia National Laboratories, SAND 2000-1939 Report, August 2000 [122] Impact on the Power System of a Large Penetration of Photvoltaic
Generation Yun Tiam, T; Kirschen, D. In Proc. IEEE Power Eng. Soc. General Meeting, 2007 Pages:1-8 [123] Voltage Regulation in Radial Distribution Feeders With High Penetration of
Photovoltaic Tonkoski, R., Lopes, L. In Proc. IEEE Energy 2030 Conf., 2008 Pages: 1-7 [124] The Effects of Moving Clouds On Electric Utilities with Dispersed
Photovoltaic Generation Jewell, W.; Ramakumar, R. IEEE Transactions on Energy Conversion, Vol. EC-2, No. 4, December
1987 [125] Factors Relevant to Utility Integration of Intermittent Renewable
Technologies Yih-huei, W.; Parsons, B National Renewable Energy Laboratory, August 1993 [126] Digital Control of Dynamic Systems 2nd Edition Franklin, G.; Powell, J.; Workman, M ADDISON-WESLEY PUBLISHING COMPANY [127] Southern California Edison High-Penetration Photovoltaic Project –Year 1
96
Mather, B.; Kroposki, B.; Neal, R.; Katiraei, F; Yazdani, A.; Aguero, J.; Hoff, T.;Norris, B.; Parkins, A.; Seguin, R; Schauder, C
Technical Report NREL/TP-5500-50875 Prepared under Task No. ARPB.HT22 June 2011
[128] Circuit of the Future: Interoperability and SCE’s DER Program Hamilton, S., et al In Proceedings of Bulk power System Dynamics and control Conference,
August 19-24, 2007 http://www/cems.uvm.edu/~phines/publications/2007/Hamiltron_2007_IRE
P.pdf [129] SCE press release for Avanti circuit; http://www.edison.com/files/0607_sce_avanti.pdf [130] SCE Interconnection Handbook; available online http://www.sce.com/NR/rdonlyres/851128D1-6820-43DD-BAD4-
B30DE27B0F35/0/Inconnection_Handbook_090317.pdf [131] California’s Rule 21; available online jhttp://www.energy.ca.gov/distgen/interconnection/california_requirements.
html http://www.sce.com/NR/sce/tm2/pdf/Rule21.pdf [132] Carrier Based Single-state PWM Technique In multilevel inverter Van Nho, N.; Hai,Q; Lee, H [133] 2 Space Vector Modulation for Three-Leg Voltage Source Inverters Prasad, V.
1997 scholar.lib.vt.edu/theses/available/etd-2798-1216/.../chap2.pdf
[134] Space Vector Modulation-An introduction
Neacsu, D. The 27th Annual Conference of the IEEE Industrial Electronics Society pp. 1583-1592
[135] Space Vector Modulation in 3-Level Voltage Sourced Neutral Point Clamped Inverter
Durma, E. PQ-Digital Power, March 23, 1013
[136] Review of multilevel voltage source inverter topologies and control schemes
Colak, I.et. al.

97
Energy Conversion and Manage(2010),doi:10.101/ j.enconman.2010.09.006
[137] Space Vector Pulse Width Modulation of Three-Level Inverter Extending Operation Into Overmodulation Region
Mondal, S.; Bose, B.; Oleshuk,V.; Pinto IEEE Transactions on Power Electronics, Vol. 18, No.2, March 2003
[138] Optimised Space Vector Switching sequences for Multilevel Inverters McGrath, B.; Holmes,D.; Lipo, T. Wisconsin Electric Machines & Power Electronics Consortium 2001
[139] Novel Multilevel Inverter Carrier-Based PWM Methods Tolbert, L; Habetler, T IEEE IAS 1998 Annual Meeting, St Louis, Missouri, October 10-15,1998 pp. 1424-1431
[140] Grid 2020: Towards a Policy of Renewable and Distributed Energy
Resources California Institute of Technology Resnick Institute Report
September 2012
[141] Current Control of a Voltage Source Inverter connected to the Grid via LCL Filter Papavasiliou, A.; Papathanassiou, S.; Manias, S.;Demetriadis, G.
[142] Advanced Integrated Wastewater Pond Systems Ertas, T; Ponce, V http://ponce.sdsu.edu/aiwps.html
[143] U.S. Congress. 2007. Energy Independence & Security Act, Title XIII-
Smart Grid, Section 1301-Statement of Policy on Modernization of Electricity Grid
[144] Germany Faces a growing Risk of Disastrous Power Blackouts Bach, P GreenTech Media http://www.greentechmedia.com/articles/read/guest-post-germany-faces-
a-growing-risk-of disastrous-power-blackouts/, May 30, 2012 [145] National Rural Electric Cooperative Association. March 2012. Fact Sheet.
http://www.nreca.coop/members/CoopFacts/Documents/AnnualMeetingFactSheet.pdf

98
ABB Inc. August 2008. Hard to Find Information About Distribution Systems. http://www05.abb.com/global/scot/scot235.nsf/veritydisplay/91ad32 9a50978bf85256c550053db0d/$file/hard.to.find.6th.pdf
[146] Solar Energy Industries Association. February 16, 2012. Petition on
Federal Energy Regulatory Commission Interconnection Standards. http://www.seia.org/researchresources/solar-industry-ferc-filing-small-generator-interconnection-procedure
[147] Estimating the Costs and Benefits of the Smart Grid: A Preliminary
Estimate of the Investment Requirements and the Resultant Benefits of a Fully Functioning Smart Grid. Product ID 1022519.
Electric Power Research Institute. April, 2011 http://my.epri.com/portal/server.pt?space=CommunityPage&cached=true&parentname=ObjMgr&parentid=2&control=SetCommunity&CommunityID=404&RaiseDocID=000000000001022519&RaiseDocType=Abstract_id Cisco Systems. September 2011. Gridonomics. http://www.cisco.com/web/strategy/docs/energy/gridonomics_white_paper.pdf
[148] Solar PV Carousel Trackers For Building Flat Rooftops: Three Case
Studies Frass, L.; Avery, J.; Minkin, L.; Luang, H.; Schneider, H; Larson, D [149] The Solar Island : A Groundbreaking CSP Technology CSP Today Technology Muirhead, J March 28, 2013
[150] Performance Evaluation of Sun Tracking Photovoltaic Systems in Canada
Mehrtash,M.; Quesadaa, G.; Dutil, Y; Rousse, D 20th Annual International Conference on Mechanical Engineering-ISME20112-2329 May 16-18, 2012 pp. 1-4
[151] Tracking and Ground Cover Ratio
Narvarte, L.; Lorenzo, E. Progress in Photovotaics: Research and Applications 2008; 16:703-714 Published online August 7, 2008 in Wiley InterScience (www.Interscience.wiley.com) DOI: 10.1002/pip.847
[152] Feasibility Study of One Axis Three Positions Tracking Solar PV with Low
Concentration ration Reflector Huang, B.; Sun, F.

99
Science Direct Energy Conversion and Management 48 (2007) 1273-1280 Available online at www.sciencedirect.com November 29, 2006
[153] 2012 Special Reliability Assessment Interim Report: Effects of
Geomagnetic Disturbances on the Bulk Power System February 2012 North American Electric Reliability Corporation [154] Calculation Techniques and Results of Effects of GIC Currents as Applied
to Two Large Power Transformers Girgis, R.; Chung-Duck, K.). IEEE Transactions on Power Delivery, vol 7, no.2, April 1992 pp.699-705
[155] Capital Costs For Transmission and Substations Recommendations for
WECC Transmission Expansion Planning Black & Veatch Project No. 176322 Mason, T.; Curry, T.; Wilson, D October 2012
[156] San Diego Gas & Electric’s Sunrise Powerlink www.cpuc.ca.gov/environmental/info/aspen/sunrise/sunrise.htm [157] New Transmission Project will help California Meet Summer Electric
Demand U.S. Energy Information Administration Today In Energy July 11, 2012
www.eia.gov/todayinenergy/detail.cfm?id=7050 [158] Advanced Integrated Wastewater Pond Systems For Nitrogen Removal Oswald, W.J.; Green, F. B.; Lundquist, T.J. EPAA National Wastewater Treatment Technology Transfer Workshop Kansas City Missouri, June 8, 1994 [159] 2012 Special Reliability Assessment Interim Report: Effects of
Geomagnetic Disturbances on the Bulk Power System February 2012 http://www.nerc.com/pa/Stand/Geomagnetic%20Disturbance%20Resources%20DL/2012_GMD_Report_112012.pdf
[160] Residential, Commercial, and Utility-Scale Prices in the United States:
Current Drivers and Cost-Reduction Opportunties Goodrich, A.; James, T.; Woodhouse, M. Technical Report NREL/TP-6A20-53347
100
February 2012 Available electronically at http://www.osti.gov/bridge
[161] Life Cycle Inventories and Life Cycle Assessments of Photovoltaic
Systems Fthenakis, V.; Kim, H.; Frischknecht, R.; Raugei, M.; Parikhit, S; Stucki, M. International Energy Agency Photovoltaic Power Systems Programme IEA PVPS Task 12, Subtask 20, LCA Report IEA-PVPS T12-02:2011 October 2011 [162] Energy Payback and Life-cycle CO2 Emissions of the BOS in an
Optimized 3.5 MW PV installation Maon, J. et al. Progress in Photovoltaics: Research and Applications, 2006. 14 pp. 179-190 [163] New Transmission Project will help California Meet Summer Electric
Demand U.S. Energy Information Administration Today In Energy July 11, 2012
www.eia.gov/todayinenergy/detail.cfm?id=7050
[164] Empirical Research on the efficiency of Floating PV Systems Compared with Overland PV Systems
Choi, Y.; Lee, N.; Kim, K. [165] From Land to Water Thurston, C PV-Magazine Applications & Installations April 2012
http://www.pv-magazine.com/archive/articles/beitrag/from-land-to-water-_/100006317/501/
101
APPENDIX A CONCENTRATION AND EFFICIENCY IN SOLAR PHOTOVOLTAIC APPLICATIONS
A.1 BACKGROUND
The sun is a 13.9 x 10⁵ km diameter sphere comprised of many layers of gases, which become hotter toward its center. The surface is approximately at an equivalent black-body temperature of 5760 °K; however at its center it may be at 20 x 106 °K. The rate of energy emission from the sun is 3.8 x 10²³ kW, which results from the conversion of 4.3 x 10⁹ g/sec (4.7 x 10⁶ ton/sec) of mass to energy [24]. Based on this rate, scientists believe the sun to have a life span of 10 billion years and that it has been burning for approximately 5 billion years. Of this total energy emission from the sun, only a tiny fraction, approximately 1.7 x 10¹⁴ kW, is intercepted by the earth, which is located about 150 million km from the sun [24]. This could also be stated as the amount of energy from the sun striking the earth is over 1.5 x 10²² J (15,000 EJ) each day, more than 104 times the 1.3 EJ daily energy consumption by human activity [72]. Clearly, solar energy is a sustainable resource, with energy input far exceeding the rate it is consumed. It is also, however a dilute source of energy, requiring relatively large collector areas to generate solar electricity compared with the lighting, appliances, vehicles and manufacturing processes that use it.
For solar energy collection we have a source essentially at infinity that
subtends a semi-angle (or half angle) of approximately 0.005 radians ( °),
approximately half of the 0.53° shown below [24]. This is the given value of the collection angle and is important in understanding the development of solar concentrators and determination of maximum concentration values.

102
Figure A.1 Relationship between sun and earth
The two motivations for using for using concentration in solar collectors
are: 1) to improve performance (higher efficiency) and 2) to improve the economics by reducing cost. The economic motivation for employing concentration for PV applications is to reduce overall system cost. Solar cells are quite expensive, and if one has to cover large areas with these expensive transducers, the cost can be prohibitive. However, if one can reduce the area of expensive material per unit aperture area, this cost can be substantially reduced [24].
High efficiency (achieved through concentration) is one of the few effective ways to reduce the module packaging and support costs of solar electricity. A 10% efficient module technology requires 10 m2 worth of materials and manufacturing for module packaging and support to generate 1 kW of electricity under 1000 W/m2 incident intensity, whereas a 25% efficient module requires 2.5 times less, or only 4 m2. As a result and somewhat counter-intuitively, more complicated and expensive PV cell technologies that also confer higher efficiency can frequently be less expensive at the module or full PV system level than modules based on lower efficiency cells [71].
Since the term concentration ratio will be used throughout this dissertation, it is important to distinguish between several important definitions. The limits for the concentration ratio in 2D (two dimensions) and 3D (three dimensions) systems are described in equations A.1 and A.2 below. These upper limits depend only on the input angle and the input and output refractive indices and can be called the theoretical maximum concentration ratio.
An actual system will have entry and exit apertures of dimensions 2a and 2a/ as shown in Figure A.2. These can be width or diameter for linear or rotational systems, respectively. The exit aperture may or may not transmit all
103
rays that reach it, but in any case the ratios or define a geometrical
concentration ratio. The optical concentration ratio is the proportion of incident rays within
the collecting angle that emerge from the exit aperture [28].
In the geometrical optics approximation, the propagation of the totality of light is as if it were a fluid flow in six-dimensional phase. This flow is subject to conservation theorems that are essentially geometric and follow from the law of propagation of light rays. These are loosely referred to as Liousville’s theorem, but they are more properly called the integral invariants of Poincare [7][8]. Liousville’s theorem for radiation implies that the extension in phase along the trajectory through phase space is conserved. For an optical system this may be expressed in terms of the conservation of the generalized along the ray path. This is an important principle in understanding solar concentration.
The goal is to closely approach the theoretical sine law limit to concentration while maintaining high throughput or (optical equivalent of mechanical volume). A useful representation to show this is in “phase space” which is an analogy used both in fluid dynamics as well as optics. Phase space has twice the dimensions of ordinary space and consists of both the positions and momenta of elements of the fluid. In optics, the momenta are the directions of light rays (direction cosines) multiplied by the index of refraction of the medium. In optics, as in fluid dynamics, the volume in this phase space is conserved.
A simple analogy is in transporting a container (the volume in phase space) filled with alphabet blocks spelling out a message illustrates the difference between imaging and nonimaging optics. If the message needs to be preserved, one would have to take care not to shake the container and thereby scramble the blocks and hence the message. But if one merely needs to transport the blocks without regard to the message, the task is easier. This simple analogy distinguishes the difference between using imaging optics (preserving the message of the blocks) verses non-imaging optics (just moving the blocks) for solar concentration.
Concentrator PV systems have several advantages over flat-plate systems. First, concentrator systems reduce the size or number of cells needed. This allows certain designs to use more expensive semiconductor materials which would otherwise be cost prohibitive. Second, a solar cell's efficiency increases under concentrated light. How much that efficiency increases depends largely on the design of the solar cell and the material used to make it. Third, a concentrator can be made of small individual cells. This is an advantage because

104
it is harder to produce large-area, high-efficiency solar cells than it is to produce small-area cells.
Concentrator photovoltaic (PV) systems use less solar cell material than other PV systems. PV cells are the most expensive components of a PV system, on a per-area basis. A concentrator makes use of relatively inexpensive materials such as plastic lenses and metal housings to capture the solar energy shining on a fairly large area and focuses that energy onto a smaller area—the solar cell. One measure of the effectiveness of this approach is the concentration ratio—in other words, how much concentration the cell is receiving. The real key measure however is how the increased concentration produces an increase in efficiency.
Most concentrators must track the sun throughout the day and year to be effective; thus, achieving higher concentration ratios means using tracking mechanisms that require precise controls.
A.2 NONIMAGING OPTICS
Nonimaging optics is an approach to the collection, concentration and
transport of light, largely developed by physicists from the University of Chicago over the past 35 years. The goal of nonimaging optics is not to create an image of the object for photographic accuracy, but the collection of rays incident at the first (entry) aperture of the optical system [7,8]. Nonimaging optics and solar energy go well together because solar energy does not demand imaging qualities, but instead requires flexible designs of highly uniform flux concentrators coping with solar disk size, solar spectrum and tracking errors.
The basic idea is to relax the constraints of point-to point mapping of
imaging optics. This permits the design of optical systems that achieve or closely achieve the maximum geometric concentration for a given field of view. Low to moderate concentrations 2x through 4x can be achieved with stationary (fixed year round) collectors. Slightly higher levels (3x-10x) will usually require occasional (seasonal) adjustment. Higher concentrations (10x-40,000x) will require tracking. In general, wherever concentration of sunlight is desired, nonimaging optics can achieve the highest possible levels with the most relaxed optical tolerances [25].
Figure A.2 shows a generalized schematic of any two-dimensional solar
energy optical system where the geometrical concentration ratio C = 7,8 .
The power accepted by the optical system is determined by the radius of the entry aperture and the acceptance angle , which is the semiangle of the beams accepted. The refractive indices of the material before the entry aperture

105
of the transparent material filling the concentrator are marked and respectively [26].
Figure A.2 Concept of and maximum 2D concentration
In 2D geometry, if the plane in which all the rays are contained is an x = constant plane, then the differential of can be written as . Setting a point P(y,z) of a ray with direction cosines (M.N) anywhere in front of the entry aperture, the movement of P along the y axis, which is the axis of concentration can be written as dy. The changes of direction of the ray relative to the same axis may be written as dM. The influence of the refractive index is considered, and the generalized (or Langrange invariant) for any ray bundle that transverses the system can be written as
, (A.0)
integrating over y and M yields 4 4 ; therefore, the geometrical concentration ratio as
can be written as . Clearly cannot exceed 2⁄ , so the theoretical
maximum concentration ratio is the result shown in equation A.1 [7,8,26].
, (A.1)
For the 3D case, the input ray segment can be represented by the
coordinates of P(x,y,z), and by direction cosines of the ray (L,M,N). The output ray is similarly specified. Small displacements of P can be represented by

106
increments dx and dy to its x and y coordinates. Small changes in the direction of the ray can be represented by increments of dL and dM to the direction cosines for the x and y axes. This generates a beam of area dxdy and angular extent of dLdM for the y section and yields:
.[7,8,28]
Proof or derivation of the generalized theorem (Lagrange
Invariant) has been accomplished in different ways. References [7][8] [28][29] give a proof based directly on optical principles that follow closely the method of Welford (1986), which makes use of the point-eikonal, or characteristic, function of Hamilton. Reference [30] contains a derivation of the Generalized based on Liousville’s theorem or more specifically one of the Invariants
of Poincare.
, (A.2)
Of interest are the upper and lower limits of concentration defined by
practical viewing angle limits-the maximum CR is limited only by the size of the sun’s disk and achieved by continuous tracking. The upper limit of concentration for two and three- dimensional concentrators is as follows [7, 8, 26, 27]:
, ° ≅ 208
.
. ≅° ≅ 312 1.5
, ° ≅ 43,300
.
° ≅ 98,650
The thermodynamic limit of solar concentration can also be deduced with
the help of Figure A.1 and yields the same equations for determining the ideal concentration ratio of solar concentrators as the geometrical approach just described utilizing the application of the edge ray principle.
Assuming that the sun is a blackbody radiator of temperature Ts, the
temperature of the sun’s surface (5777 K), the amount of radiation incident on the earth on the first aperture of the concentrator is
107
→ [26] (A.3a)
where is the radius of the sun, the distance sun-to-earth, and
5.67 ∗ 10 is the Stefan-Boltzmann constant. The size of the solar disk observed by the collector can be expressed in angular terms as [26]
→ (A.3b)
where 0.275° is the half-angle of the sun. Imagine an ideal black
absorber emits radiation at a temperature . This radiation is thought to be completely received at the sun, so that
→ (A.3c) The thermodynamic maximum of concentration can only be reached if
and → → . By setting A.3 b equal to A.3 c if follows that the maximum concentration of the solar image on the absorber of a three-dimensional concentrator is
, 43,400 which is identical to equation A.2 [26].
In practice, these levels of concentration are very difficult to achieve
because of the effects of tracking errors and imperfections in the reflecting or refracting element surface. In an experiment carried out at the University of Chicago where a combination of a paraboloidal concentrator as primary and an ideal nonimaging secondary concentrator were utilized, a concentration ratio of 102,000 was achieved and a higher density than that on the surface of the sun was observed. Even though the energy density was higher than on the surface of the sun, the receiver’s temperature cannot exceed the sun’s temperature [24].
Concentrating photovoltaic (CPV) systems are starting to challenge
traditional flat panel PV modules in terms of cost. Depending on the concentration ratio, application and the type of concentrator, different types of solar cells are utilized for achieving an optimum performance and reliability of the system. The type of Solar cells to be used in the CPV system can be single junction silicon cells, thin films or multi-junction cells [31].
For applications demanding high concentrations like point focused
systems, multi-junction solar cells are needed which can perform under high concentration and extreme temperatures [31].
In high concentration photovoltaic systems, quality optics are key
components towards high module efficiency. Fresnel lenses are usually selected for their potential due to low cost and high scale production with plastic injection

108
technology. A Fresnel lens is essentially a chain of prisms. The nonimaging Fresnel lens is designed with the objective of concentrating light rather than forming an image. The main goal of the design of a nonimaging Fresnel lens is to maximize the amount (energy) and quality (flux uniformity) of solar radiation concentrated by the lens [32].
A.3 FRESNEL LENS DESIGN
Both reflectors and lenses have been used to concentrate light for PV systems The Fresnel lens, uses a miniature sawtooth design to focus incoming light. When the teeth run in straight rows, the lenses act as line-focusing concentrators. When the teeth are arranged in concentric circles, light is focused at a central point. However, no lens can transmit 100% of the incident light. The best that lenses can transmit is 90% to 95%, and in practice, most transmit less.
A Fresnel lens is an optical component which can be used as a cost effective, lightweight alternative to conventional continuous surface optics. The principle of operation is given in that the refractive power of a lens is contained only at the optical interfaces (lens surfaces); therefore the goal is to remove as much of the optical material as possible while still maintaining the surface curvature. Another way to consider it is that the continuous surface of the lens is “collapsed” onto a plane as shown in Figure A.3 [33].
Figure A.3 Conceptual illustration of Fresnel lens
The practical aspect of compressing the lens surface power into a plane surface requires a finite prism pitch, a slope angle component (which acts to refract the rays in the prescribed manner) and a draft component (optically inactive, but necessary to return the surface profile back to the plane) as depicted in Figure A.4. [33]

109
Typical for solar lens concentrators is to orient the grooves towards the solar cell. This minimizes the impingement of solar radiation of the draft and avoids buildup of dirt and debris within the facets [27, 33].
Figure A.4 Fresnel lens details
A.3.1 MINIMUM DEVIATION
Solar light is polychromatic light. The dispersion of a prism is of interest for solar concentration. It can be shown that minimum dispersion occurs at minimum deviation. The minimum deviation prism is to be preferred for solar applications so as to keep the absorber as small as possible [35]. A proof for the congruence of minimum dispersion and minimum deviation is given by Born and Wolf [35][36].
The two surfaces of a prism form the prism angle (Figure 2.5). Due to this angle the deviation produced by the refraction at the first surface is not annulled by the refraction at the second surface as in the case of refraction of the plane-parallel plate, but is further increased. Increasing deviation increases both the chances for total reflection and chromatic dispersion. The total deviation for the two-dimensional prism shown in Figure A.5 is calculated as the sum of the deviations produced at each surface as shown in equation 2.3 [37].
(A.3)
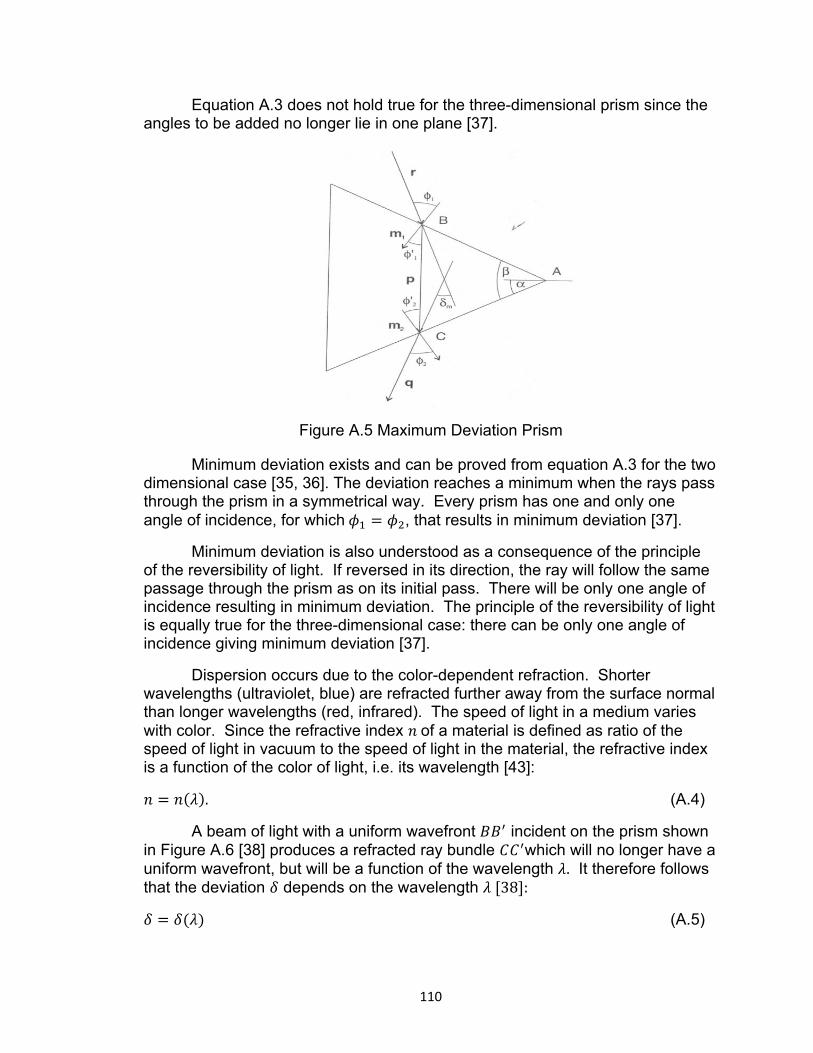
110
Equation A.3 does not hold true for the three-dimensional prism since the angles to be added no longer lie in one plane [37].
Figure A.5 Maximum Deviation Prism
Minimum deviation exists and can be proved from equation A.3 for the two dimensional case [35, 36]. The deviation reaches a minimum when the rays pass through the prism in a symmetrical way. Every prism has one and only one angle of incidence, for which , that results in minimum deviation [37].
Minimum deviation is also understood as a consequence of the principle of the reversibility of light. If reversed in its direction, the ray will follow the same passage through the prism as on its initial pass. There will be only one angle of incidence resulting in minimum deviation. The principle of the reversibility of light is equally true for the three-dimensional case: there can be only one angle of incidence giving minimum deviation [37].
Dispersion occurs due to the color-dependent refraction. Shorter wavelengths (ultraviolet, blue) are refracted further away from the surface normal than longer wavelengths (red, infrared). The speed of light in a medium varies with color. Since the refractive index of a material is defined as ratio of the speed of light in vacuum to the speed of light in the material, the refractive index is a function of the color of light, i.e. its wavelength [43]:
. (A.4)
A beam of light with a uniform wavefront incident on the prism shown in Figure A.6 [38] produces a refracted ray bundle which will no longer have a uniform wavefront, but will be a function of the wavelength . It therefore follows that the deviation depends on the wavelength 38 :
(A.5)

111
Figure A.6 Dispersion of a prism
The dependence of the deviation on wavelength can by the chain rule be expressed as
(A.6)
This deviation can be evaluated in two factors. The first factor, , depends completely on the geometry of the ray and the prisms. The second
factor, , characterizes the dispersive power of the prism material.
For the two-dimensional case, the general equation for the angle of
deviation (A.3) expressed by the outer angles of incidence and refraction is [38]
, (A.7)
and for the inner angles of refraction and incidence is
(A.8)
Keeping the angle of incidence constant and using the equations for the angle of deviation in equations A.7 and A.8 above [38],
, (A.9)
,

112
Snell’s law of refraction can be written as:
(A.10a) (A.10b)
Since is constant, Snell’s law of refraction yields the differentiations
0 (A.11a)
(A.11b)
Combining the equations of A.9 and A.11 yields [38]
∅ ∅ ∅∅
∅ ∅
∅ ∅ ∅ ∅ (A.11c)
For the triangle shown in Figures A.5 and A.6 above and utilizing the Law of Sines:
2.790 ∅ ∅
∅ (A.12)
For the triangle shown in Figures A.5 and A.6 above
∅ (A.13)
The deviation depending on the wavelength reaches a minimum when . The principle of the reversibility of light requires this symmetry. The
same argument from the reversibility of light also requires minimum deviation. Minimum deviation requires minimum dispersion. Every wavelength has its own angle of minimum deviation dependent on its refractive index. Choosing an average wavelength and refractive index for the design of the prisms will

113
minimize the beam spread of white light due to dispersion. In solar energy applications this allows for an absorber of minimum size to be installed.
Using (A.6), (A.11c), (A.12) and (A.13) results in
and (A.14)
The angular dispersion (the angle by which the emergent wave front is rotated when the wavelength is changed by is [38]
(A.15)
If the beam of light completely fills the prism, then , where is the base of the prism. The design of the base of a prism is thus defined by the angle of incidence, and the refractive index of the prism material. Or the design of the shape of a prism should depend on its refractive power [38].
In contrast to the performance of crystalline silicon concentrator cells, the performance of multijunction devices is sensitive to both nonuniform flux and nonuniform color distribution. Flux uniformity over the area of the multijunction device and color flux homogeneity penetrating the cell layers are distinguished as “parallel” and “series” connection types. Both types of intensities are crucial for the optimum performance of the multijunction device. Flux density is defined as the radiant energy crossing an area element. The flux density ratio is for the absorber what the optical concentration ratio if for the lens. But while it may be sensible to average concentration ratio of the lens over the whole lens and still obtain a meaningful figure, the flux density should always be a distribution, with some maxima and an extension [39].
The width of the absorber of the nonimaging Fresnel lens is correlated with the lens height and the cross-sectional acceptance half angle [40]
(A.16)
In the nonimaging 2D lens, the absorber width is usually greater than the cross-section of the area filled by refracted light originally incident at a combination of rays ⁄ . The size of the fraction filled and its location on the absorber must be known in order to evaluate the suitability of the lens for photovoltaic applications, where homogeneous illumination of the absorber in terms of both flux density, and color spectrum is essential for the performance of the system [40].
Focal length and f-number also specify a Fresnel lens. For a lens with prism facets on one side and a flat plane surface on the other (Fresnel lens) the effective focal length is the distance from the prism surface of the lens to the

114
focal point. The f- number is the ratio of the lens focal length f to the clear aperture diameter of the lens. A lens of smaller f-number will concentrate light faster than an equivalent diameter lens of larger f-number (Figure A.7) [26].
Figure A.7 Demonstration of f-number
A.3.2 NONIMAGING FRESNEL LENS DESIGN
The nonimaging Fresnel lens is defined as optimum if the following conditions are fulfilled, resulting in an arched linear lens:
The simulation has to yield minimum deviation prisms for minimum dispersion, and the smallest possible absorber size;
The outer surface of the lens must be smooth to eliminate blocking losses on the outside. Also this allows for cleaning of the lens.
The parameters to control during the design of the nonimaging lens are the following:
The cross-sectional acceptance half-angle pair ; The perpendicular acceptance half-angle pair ; The (horizontal) prism inclination for each prism; The average refractive index of the material ; An error margin for the numerical solution; The angle that divides the aperture of the lens into equal segments (like
the spokes of a wheel) and subsequently defines the pitch by which

115
the projected width of a prism is defined. This also limits the number of prisms constituting the lens. The designer may later set a fraction of this angle as a backstepping angle to start a new prism on the face of the one just finished, thus achieving a finite thickness of the lens
These parameters can be set to fulfill the conditions given above, and
define a two-dimensional, convex shaped, optimum nonimaging Fresnel lens of finite thickness. The nonimaging lens of finite thickness cannot be completely described in analytical terms, and a numerical solution has to be found [38].
Shaped nonimaging Fresnel lenses have been designed according to the edge ray principle, incorporating any combination of two acceptance half angle pairs. Kritchmann et al dismiss the use of nonimaging flat Fresnel lenses on technical grounds; however a flat nonimaging Fresnel lens is possible and represents the logical extreme of a curved lens [38]. Refraction, or the design of lenses may take advantage of nonimaging principles. Lenses have a unique advantage over mirrors in due to prisms’ partial self correction of errors. The refracted ray is affected little, while the reflected ray’s direction angle is changed by double the slope orientation. New plastic materials for lenses offer high transmittance and durability for common wavelengths, while keeping the system inexpensive and lightweight.
Various designs have been researched: point-focus, fixed focal area (blue-edge, and red-edge), statistical or folding focus design, to name a few. However, it is important to remember that the irradiance distribution on the target depends on three factors, the cosine of the impinging ray (its projected width), the dispersion of the lens (the beam width depends on the spectrum of the incident light, and the prism material and angle), and the divergence angle of the source and that the half angle of the solar disk is 0.275° 29 .
A.3.3 FLUX DENSITY
The flux density on the absorber of the linear nonimaging Fresnel lens can be calculated by tracing incident edge rays from each prism of the lens to the absorber. The edge (outermost) rays for any combination of angles of incidence are traced, and their intersections with the absorber plane are found in a cross-sectional projection, resulting in a part of the absorber plane being illuminated. Depending on the distance of the prism from the absorber, a factor describing the spread of the refracted beam is calculated. The prism’s height over the absorber plane defines the cosine losses of the beam when hitting the absorber at an angle other than normal [40]. Figure A.8 below illustrates cosine loss [41][138].
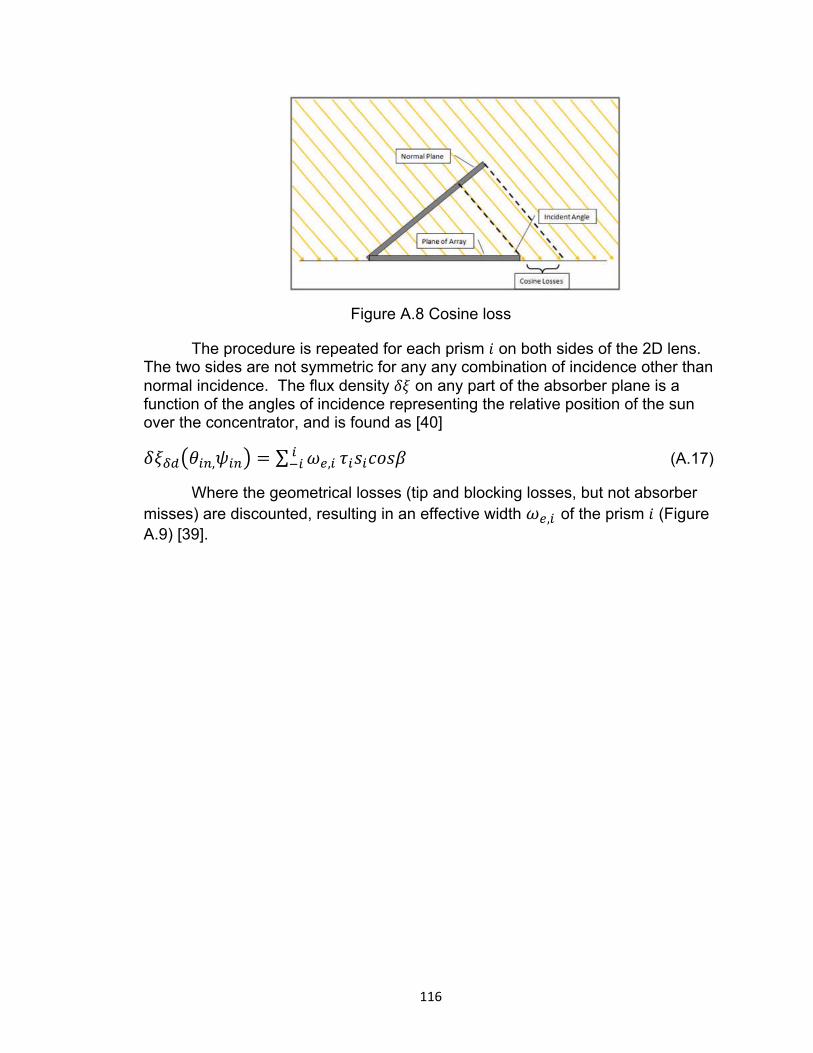
116
Figure A.8 Cosine loss
The procedure is repeated for each prism on both sides of the 2D lens. The two sides are not symmetric for any any combination of incidence other than normal incidence. The flux density on any part of the absorber plane is a function of the angles of incidence representing the relative position of the sun over the concentrator, and is found as [40]
, ∑ , (A.17)
Where the geometrical losses (tip and blocking losses, but not absorber misses) are discounted, resulting in an effective width , of the prism (Figure A.9) [39].

117
Figure A.9 Flux Density factor
Transmittance losses accounting for first order reflections are deducted. Depending on the distance of the prism from the absorber, a factor describing the intensity of the refracted beam on the absorber is calculated as
(A.18)
Closer distance means higher flux density. A factor is introduced to describe this distance, normalized in respect to the lens height [39].
A.3.4 SOLAR DISK SIZE AND BRIGHTNESS
The influence of the solar disk size on the flux density at the absorber of a concentrator can be simulated by ray tracing. Proper simulations for both imaging and nonimaging concentrators with acceptance half-angles approaching
(recall that the radius of the solar disk is, corresponding to the solar disk half-angle 0.275° incorporate the brightness distribution of the solar disk, plotted in Figure 2.10 from Rabl [41,42]. The diffusion over the edge of the solar disk is

118
caused by absorption and scattering of radiation in the photosphere of the sun and the atmosphere of the earth [42].
Figure A.10 Brightness distribution of solar flux
An example showing the insensitivity to solar disk size effects for a lens where the acceptance half-angle is larger than the half-angle of the sun is also shown in Figure A.11 for a lens of acceptance half-angle pairs 2° 12° [42]
Figure A.11 Flux density factors for non-imaging Fresnel lens
119
The solar spectrum is thought to originate equally from all over the solar disk (and circumsolar radiation). Ultraviolet radiation appears to be more strongly attenuated in the sun’s photosphere than infrared, thus the rim of the solar disk appears darker and redder than its center. Giving an example, Grilikhes [47] describes the radiance of the solar disk to decrease towards the edge by 50% in the wavelength range 450-500 nm, and by 30% in the wavelength range 700-1000 nm. This wavelength-specific description of the sun shape is not reported to have any significant influence on the performance of solar concentrators; the spectral brightness distribution induces errors which are small in comparison to optical distortions [42].
A.3.5 REFRACTIVE INDICES
Borosilicate crown glass (e.g. BK7) is an optical glass that has a relatively low refraction index, low ABBE number and can be produced in large quantities at moderate cost. BK7 is optically very homogeneous and offers transmission rates up to 95% over a bandwidth of 350 2700 .This is desirable for solar applications, since the solar spectrum covers approximately a range of 2508000 ,with 93% of the energy transmitted in the band covered by the borosilicate glass [43].
Polymethylmethacrylate (PMMA) is a low cost acrylic that almost reaches the transmittance of BK7 glass over the solar spectrum. Reflection at the surface and not absorption within the material, is the leading cause for transmission losses. Reflection losses account for less than 10% of transmission if the angle of incidence is kept below 55° 43, 44 .
The refractive index can be plotted as a function of the wavelength for the material. The Sellmeier formula is the common approach and industrial standard to make this kind of plot for glass [43].
1 ∑ (A.19)
Where the wavelength is in . Six constants are needed to calculate the Sellmeier formula for three combinations of refractive indices and wavelengths.
The electronic Schott glass catalog [45] contains data for various glasses.
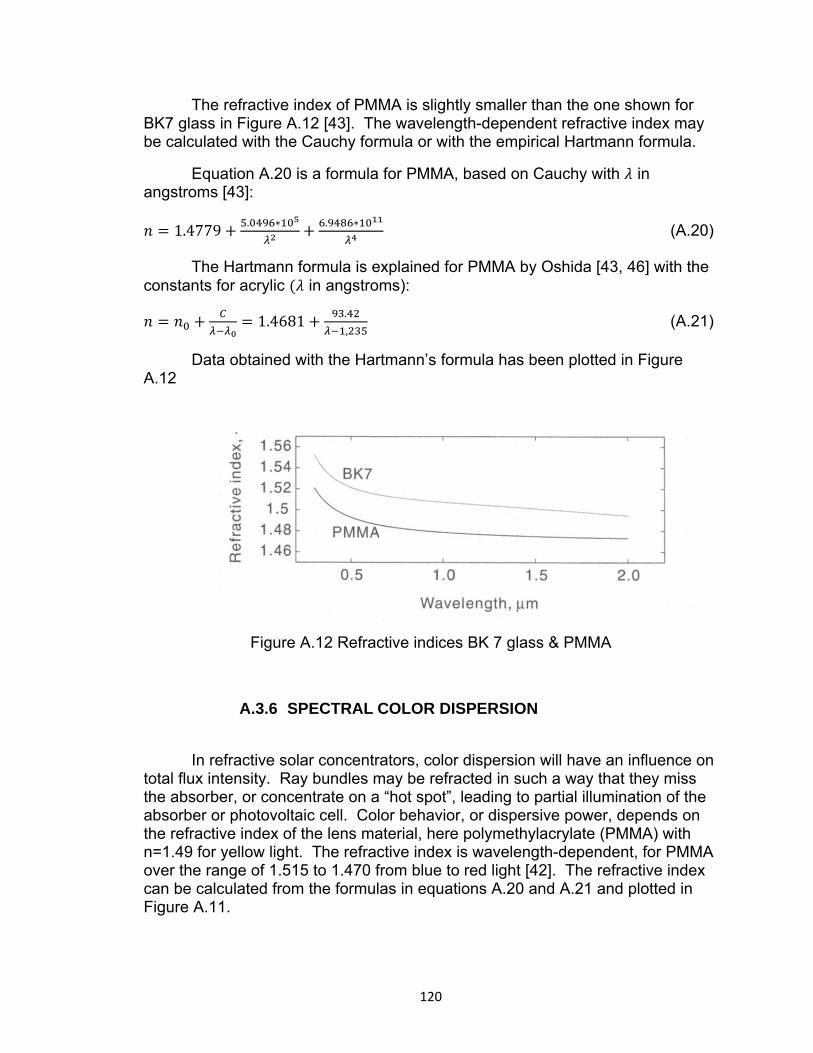
120
The refractive index of PMMA is slightly smaller than the one shown for BK7 glass in Figure A.12 [43]. The wavelength-dependent refractive index may be calculated with the Cauchy formula or with the empirical Hartmann formula.
Equation A.20 is a formula for PMMA, based on Cauchy with in angstroms [43]:
1.4779 . ∗ . ∗ (A.20)
The Hartmann formula is explained for PMMA by Oshida [43, 46] with the constants for acrylic in angstroms):
1.4681 .
, (A.21)
Data obtained with the Hartmann’s formula has been plotted in Figure A.12
Figure A.12 Refractive indices BK 7 glass & PMMA
A.3.6 SPECTRAL COLOR DISPERSION
In refractive solar concentrators, color dispersion will have an influence on total flux intensity. Ray bundles may be refracted in such a way that they miss the absorber, or concentrate on a “hot spot”, leading to partial illumination of the absorber or photovoltaic cell. Color behavior, or dispersive power, depends on the refractive index of the lens material, here polymethylacrylate (PMMA) with n=1.49 for yellow light. The refractive index is wavelength-dependent, for PMMA over the range of 1.515 to 1.470 from blue to red light [42]. The refractive index can be calculated from the formulas in equations A.20 and A.21 and plotted in Figure A.11.
121
The photon energy in radiation follows the relation [48]
., (A.22)
where is the velocity of light, the energy of one photon, 6.6260755 ∗ 10 is the Planck constant, is the frequency of a spectral component of the radiation, and is the wavelength. Therefore, the longest wavelength below which photons can contribute to the photovoltaic effect in a semiconductor material of band gap is
. (A.23)
Longer wavelengths are not absorbed as they do not carry enough energy to produce carriers in the semiconductor. Shorter wavelengths, or photons of higher kinetic energy than required to produce electron hole pairs in the semiconductor, will lose the excess kinetic energy as heat in the lattice. Thus the conversion efficiency of photons of wavelengths shorter than must be reduced by a factor ⁄ [42].
Color dispersion changes the resulting flux densities quite significantly, once the acceptance half-angle of the concentrator gets close to the radius of the solar disk [42].
A.3.7 SUMMARY OF FRESNEL LENS CONCENTRATORS FOR PHOTOVOLTAIC APPLICATIONS
The PMMA lens material, has insignificant temperature and humidity induced changes in its refractive index. Changes in the refractive index due to wavelengths of the solar spectrum are more relevant for practical lens design because dispersion occurs due to the color-dependent refraction [34].
Color aberration is not a major problem with a non-imaging 2D Fresnel concentrator. Lorenzo (1981) evaluated chromatic aberrations in solar energy systems using Fresnel lenses. He found that lenses with acceptance half angles
5° may lead to the refracted ray being spread wider than the width of the absorber. However rays missing the absorber are only a minor problem for photovoltaics. Incomplete illumination of the absorber due to shading rather than color induced inhomogeneous illumination, must be regarded as being of prime importance, since colors separated by refraction at the prisms are usually mixed at the absorber level, when the perpendicular incidence of the 2D lens is taken into account. [34]
The incomplete illumination of the absorber may call for the use of a secondary concentrator.
122
Solar cells have to be manufactured according to the flux they will receive under a concentrator. The ability of solar cells to convert concentrated sunlight is limited by their base series resistance, by the contact resistance between the grids and the semiconductor material, and by the emitter resistance caused by the spaces between the grid lines.
Two rules of thumb related to the performance of solar cells under concentrated radiation can be given as:
The product of concentration ratio and cell series resistance is a constant. Additionally, the resistance increases proportionally to cell width; therefore small concentrator cells are desirable.
Solar cells under concentration potentially see their efficiency increase by a factor ln [42].
A.4 CONCENTRATOR CELL EFFICIENCY
The conversion efficiency of a solar cell under nonconcentrated radiation
can be expressed as [42]
⁄ (A.24)
Where A is the area of the cell, is the short-circuit current of the cell. The fill factor describes the quality of the I-V characteristics of the solar cell. The more rectangular the curve for current and voltage appears, the higher , which is given by [42]
(2.25)
Where the subscript mpp corresponds to the maximum power point, or the point for which the area of the rectangle is a maximum. The fill factor describes the “squareness” of the graphs in Figure 2.13 [42].
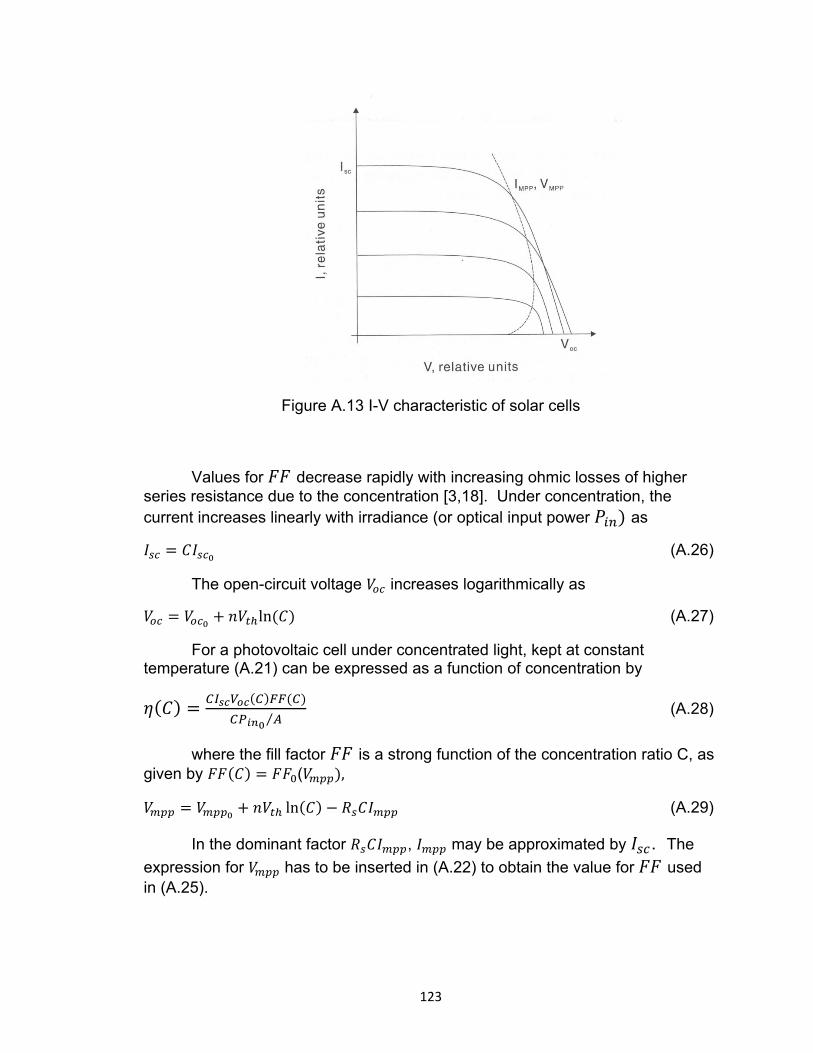
123
Figure A.13 I-V characteristic of solar cells
Values for decrease rapidly with increasing ohmic losses of higher series resistance due to the concentration [3,18]. Under concentration, the current increases linearly with irradiance (or optical input power as
(A.26)
The open-circuit voltage increases logarithmically as
ln (A.27)
For a photovoltaic cell under concentrated light, kept at constant temperature (A.21) can be expressed as a function of concentration by
⁄ (A.28)
where the fill factor is a strong function of the concentration ratio C, as given by ( ,
ln (A.29)
In the dominant factor , may be approximated by . The expression for has to be inserted in (A.22) to obtain the value for used in (A.25).
124
From equation (A.26), the efficiency of a solar cell under concentrated light has the potential to increase by a factor ln ; however concentration also produces effects that diminish this positive effect such as [42]:
Increasing : this resistance can be reduced by closer arrangement of the top contacts, but this results in blocking incoming radiation. Secondary concentrators can help with this, but optical losses as well as the added complexity increase.
Temperature dependency: The temperature limit for operation of high quality cells is in the region is 120° .
Distributed diode effects: under concentration these degrade the fill factor [49, 50]
Effects of inhomogeneous illumination, both in terms of flux and color.
A.5 GEOMETRICAL LOSSES
Losses due to optical design of the lens are evaluated with the help of ray tracing. Three types of losses can be evaluated by tracing rays through each prism of the lens i.e. tip losses, blocking losses and absorber misses [39].
A.6 MULTIJUNCTION DEVICES
Multijunction solar cells were first introduced by the Research Triangle Institute and by Varian Research Center in the late 1970s to mid 1980s when dual junction devices were formed from an AlGaAs junction stacked or grown on top of a GaAs junction and interconnected by a semiconductor tunnel junction. Later in the 1990s, changes in the top cell thickness led to record efficiencies for dual-junction and triple junction solar cells with GaInP and GaAs both grown on top of an active Ge Bottom cell substrate. It had long been realized that the high efficiency structure of multijunction solar cells makes them highly attractive for cost-effective terrestrial concentrator systems [58].
Solar cell efficiencies can be dramatically improved by dividing the broad solar spectrum up into smaller wavelength ranges, each of which can be converted more efficiently, through the use of multijunction cells. Multijunction CPV solar cells are only the third-generation photovoltaic technology cells that double or triple the efficiencies of the first and second generation PV cells and are able to overcome the Shockley-Queisser efficiency limit for single-junction cells that are now in production. The 3-junction GaInP/GaInAs/Ge concentrator solar cell technology is the first to reach over 40% efficiency and is now the baseline technology for 40% efficiency production CPV cells. However, the baseline 3-junction design is still far from the optimum combination of subcell bandgaps, and far from its efficiency potential [57].

125
Ideal efficiencies of over 59% are possible for 4 junction cells, and for 5-junction and 6-junction terrestrial concentrator cells, efficiencies over 60% are achievable [57]. The 5- and 6- junction cell designs partition the solar spectrum into narrower wavelength ranges than 3-junction cells, allowing all the subcells to be current matched to the low-current-producing GaInNAs subcell. Additionally, the finer division of the incident spectrum reduces thermalization losses from electron-hole pairs photo generated by photons with energy far above the bandgap energy, and the smaller current density in 5- and 6- junction cells lowers resistive I2R losses [56]. Figure A.14 charts efficiency histograms of the last five generations of Spectrolab’s terrestrial production terrestrial concentrator cells at 500 suns : C1MJ Cella-36.9% average production efficiency, C2MJ with 37.7%, C3MJ with 38.8%, C3MJ+ with 39.3%, and the newly introduced upright metamorphic C4MJ solar cell at 38.8%. The C4MJ is anticipated to reach 40% with continued refinement of production processes [57].
Figure A.14 Efficiency histograms of last 5 generations of terrestrial cells
Efficiency histograms of the last five generations of Spectrolab’s terrestrial concentrator cell products, from the C1MJ cell with 36.9% average production efficiency, C2MJ with 37.7 %, C3MJ with 38.8%, C3MJ+ with 39.3%, and production data for the upright metamorphic C4Mj . Average efficiency for the C4MJ is anticipated to reach 40%
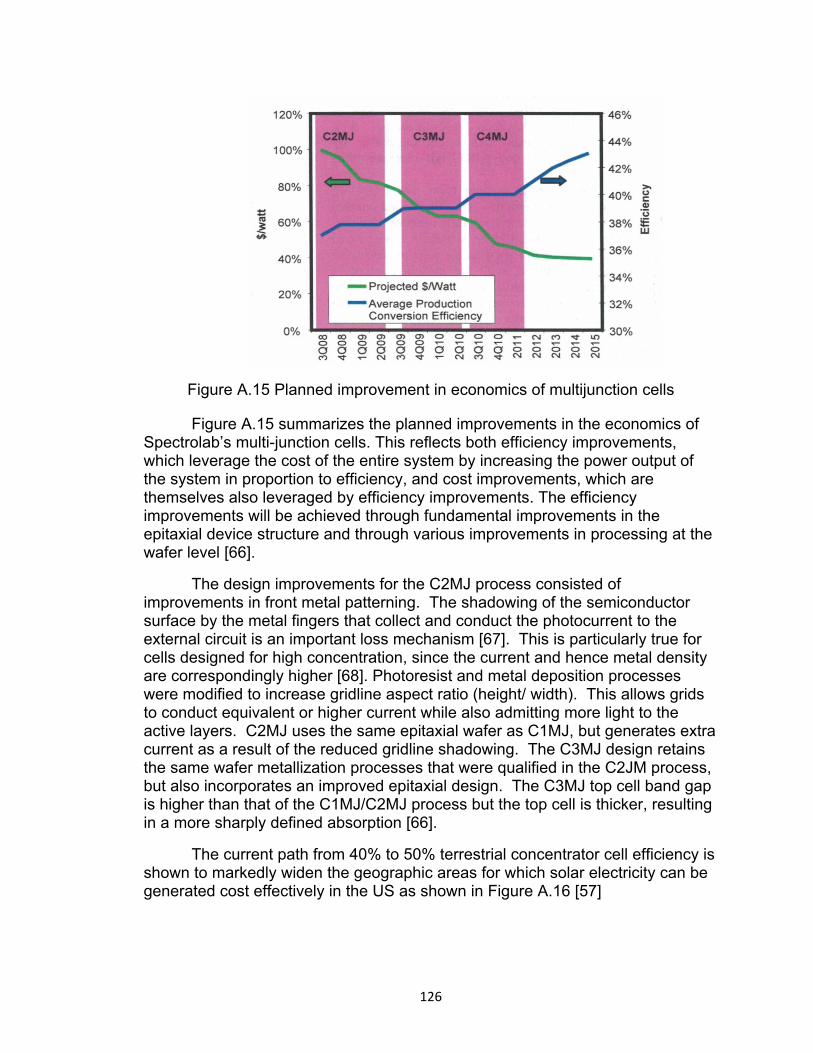
126
Figure A.15 Planned improvement in economics of multijunction cells
Figure A.15 summarizes the planned improvements in the economics of Spectrolab’s multi-junction cells. This reflects both efficiency improvements, which leverage the cost of the entire system by increasing the power output of the system in proportion to efficiency, and cost improvements, which are themselves also leveraged by efficiency improvements. The efficiency improvements will be achieved through fundamental improvements in the epitaxial device structure and through various improvements in processing at the wafer level [66].
The design improvements for the C2MJ process consisted of improvements in front metal patterning. The shadowing of the semiconductor surface by the metal fingers that collect and conduct the photocurrent to the external circuit is an important loss mechanism [67]. This is particularly true for cells designed for high concentration, since the current and hence metal density are correspondingly higher [68]. Photoresist and metal deposition processes were modified to increase gridline aspect ratio (height/ width). This allows grids to conduct equivalent or higher current while also admitting more light to the active layers. C2MJ uses the same epitaxial wafer as C1MJ, but generates extra current as a result of the reduced gridline shadowing. The C3MJ design retains the same wafer metallization processes that were qualified in the C2JM process, but also incorporates an improved epitaxial design. The C3MJ top cell band gap is higher than that of the C1MJ/C2MJ process but the top cell is thicker, resulting in a more sharply defined absorption [66].
The current path from 40% to 50% terrestrial concentrator cell efficiency is shown to markedly widen the geographic areas for which solar electricity can be generated cost effectively in the US as shown in Figure A.16 [57]
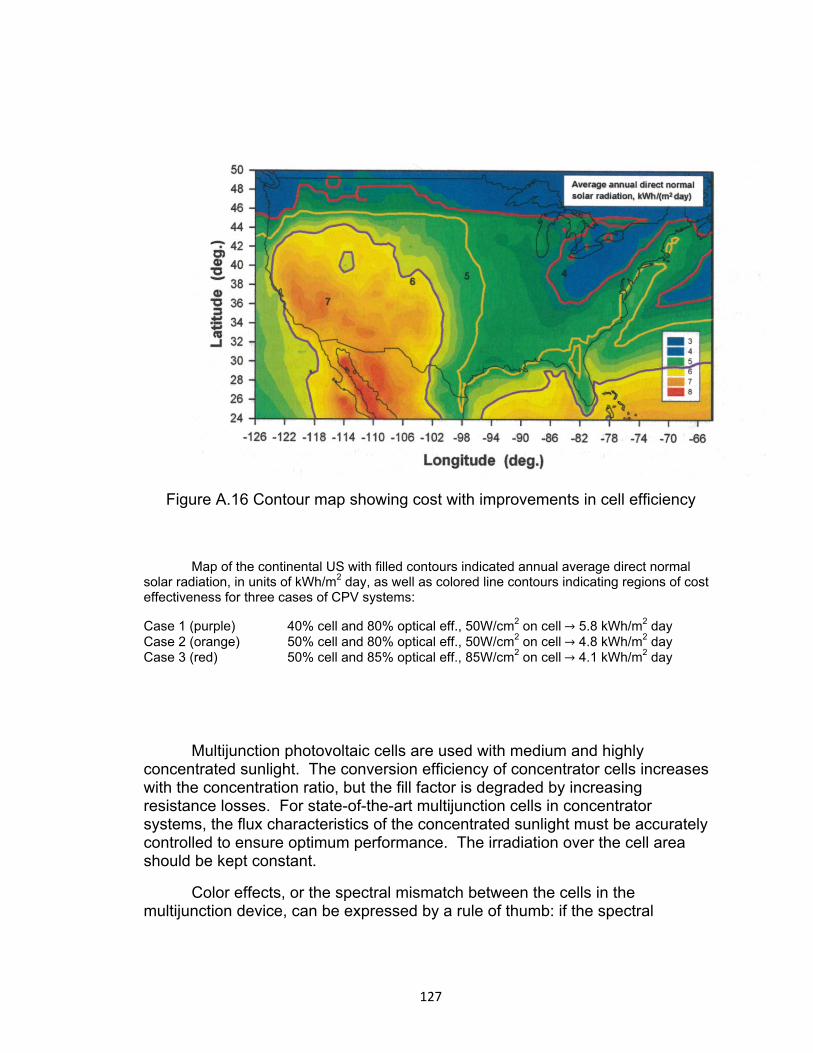
127
Figure A.16 Contour map showing cost with improvements in cell efficiency
Map of the continental US with filled contours indicated annual average direct normal solar radiation, in units of kWh/m2 day, as well as colored line contours indicating regions of cost effectiveness for three cases of CPV systems:
Case 1 (purple) 40% cell and 80% optical eff., 50W/cm2 on cell→ 5.8 kWh/m2 day Case 2 (orange) 50% cell and 80% optical eff., 50W/cm2 on cell→ 4.8 kWh/m2 day Case 3 (red) 50% cell and 85% optical eff., 85W/cm2 on cell→ 4.1 kWh/m2 day
Multijunction photovoltaic cells are used with medium and highly concentrated sunlight. The conversion efficiency of concentrator cells increases with the concentration ratio, but the fill factor is degraded by increasing resistance losses. For state-of-the-art multijunction cells in concentrator systems, the flux characteristics of the concentrated sunlight must be accurately controlled to ensure optimum performance. The irradiation over the cell area should be kept constant.
Color effects, or the spectral mismatch between the cells in the multijunction device, can be expressed by a rule of thumb: if the spectral

128
mismatch between cells in a multijunction device amounts to 20%, the total performance of the device is cut by 10% [42,50].
A.5.1 DEVICE ARCHITECTURES
Modern multijunction solar cells begin with taking a raw wafer and forming individual layers of crystalline semiconductor on the substrate. This process of crystal growth known as epitaxy employs a number of techniques. The oldest is liquid phase epitaxy (LPE); the current favored technique is organometallic vapor phase epitaxy (OMVPE). There are many variants of these techniques such as MBF,MOMBE, ALE,HVPE, etc.; however they all deliver atoms to the crystalline substrate [58].
In designing multijunction solar cells, two or more semiconducting layers are stacked as p-n junctions to collect light. A typical 3-junction solar cell structure comprised three n-p junctions made from GaInP, GaInAs and Ge stacked on top of each other-each layer with a bandgap energy higher than the layer below it and assembled with low resistive tunnel junctions [58].
Figure A.17 [66] illustrates the improvements to the fundamental epitaxial structures used in Spectolab’s multijunction devices. The production devices to date have been lattice-matched, with the indium content in the middle cell selected to match the lattice constant of the germanium substrate, and the compositional balance of the GaInP top cell similarly constrained. This still allows engineering of the top cell bandgap by means of controlled disordering of the (In, Ga) sublattice [69]. Lattice matched cells have the advantage of being a proven technology with the ability to grow structures of very high crystal quality [66].
While further evolution of the lattice-matched approach is possible, with promising candidate device architectures in 4, 5 and 6-junction configurations, Spectrolab has selected the metamorphic technology as the baseline approach to reach the 40% production efficiency goal. The metamorphic cell has a step-graded buffer layer between the bottom germanium cell and the middle cell to transition to a slightly larger lattice constant Ga(In)As middle cell, upon which is grown a lattice matched GaInP top cell; the middle and top cells more closely match the optimum bandgap combination for the solar spectrum, and higher efficiency cells in this configuration have been demonstrated [69, 70]. In the longer term, several promising research vectors exist for higher efficiency cells. These include inverted metamorphic [71], as well as upright metamorphic and lattice matched approaches [66].

129
Figure A.17 Epitaxial structure improvements
A.7 METAL SEMICONDUCTOR CONTACTS
To effectively draw the current from the device, the formation of a low resistive interface at the metal-semiconductor junction is necessary. For high current devices as in the case of concentrator cells, quasi-ohmic contacts are imperative for high performance device operation. This means that for a highly doped semiconductor, the Schottky depletion region becomes quite narrow and therefore, the width of the barrier becomes thin enough to allow electrons to be injected in the metal through thermionic-field emission. This process takes place by quantum mechanical tunneling [58].
The higher the doping concentration in the semiconductor, the narrower the barrier width and higher the probability of the electron tunneling through the barrier regardless of the barrier height. A low resistance “ohmic contact” is obtained from the Schottky interface with the semiconductor heavily doped because of the low junction resistance encountered by the electrons. It takes less energy to tunnel through the junction than to surmount the junction barrier. Current flows through the device with little parasitic voltage losses and obeys Ohm’s law where these losses scale with the amount of current flow; this is

130
because the current-voltage characteristic is linear. Ideally low work function and high dopant concentrations in an n-type semiconductor are desired for low resistance ohmic contacts. Preferably, the metal work function should be less than or equal to the work function of the semiconductor, however, such a contact is practically nonexistent. For p-type material, the metal work function should be equal or greater than that of the semiconductor to form a good ohmic contact. High doping in the semiconductor is also favorable to obtain good ohmic behavior. An issue is that there are not high enough work function metals that are suitable for making good contacts to a p-type semiconductor [58]
Table A.1 depicts the work functions, ∅ of common metal contacts and their measured Schottky barrier heights for some technologically important semiconductors [58, 59].
Table A.1 Work Function for metallic contacts
Work function of each metal is shown. (Values from ref 59 and from others as noted: a Ref 60, b Ref 61, c Ref 62, d Ref 63, e Ref 64, f Ref 65)
Surface states at the metal-semiconductor interfaces are predominant in all semiconductors due to the periodicity of the crystal lattice terminating at the surface with dangling bonds. Suffice it to say that the amount of surface states that are created become significantly high and their effects on the barrier height cannot be ignored. Typically dangling bonds deplete the surface charge of the semiconductor causing band bending even in the absence of a metal contact, which makes it cumbersome to form extremely low resistive ohmic contacts. Fermi level pinning occurs at these surface states within a narrow energy distribution in the band gap. In GaAs, for example, Fermi level pinning to surface

131
states fixes the barrier height between 0.7 to 0.9 eV below the conduction band at the interface regardless of the value of the metal work function. There are methods to lessen pinning at the surface, but typically entail elaborate and expensive cleanly recipes [58].
Low resistance contacts schemes include: using multilayer metals in metal stacking schemes, using heterojunction techniques, forming low band gap material, and using gold-germanium front contacts and Ti/Ni/Au back contacts.
Contact design depends on many factors such as contact metal, semiconductor material, dopant concentration, deposition technology, and contact fabrication process; all of which influence , the specific contact resistivity ( in Ω cm2), with values ranging from 10-3 to 10-7 Ω cm2. An example of the importance of for a 1 x 1 cm2 concentrator solar cell with 10 Ω operating at 50 W cm-2 of incident sunlight that is 35% efficient can boost the efficiency to 37% for 10 Ω [58].
A.8 PRINCIPLES OF OPERATION UNDER CONCENTRATED SUNLIGHT
One of the most important design goals of concentrator systems is to minimize electrical resistance where the electrical contacts on the cell carry off the current generated by the cell. In general, cell conversion efficiency will increase with concentration until series resistance begins to limit performance. In order to translate the high multijunction cell performance into low system-level energy costs, a convergence of multijunction cell and CPV system design must be obtained. Candidate CPV systems typically become more economically viable as the concentration design point is increased, to 300 suns and above [51, 52]
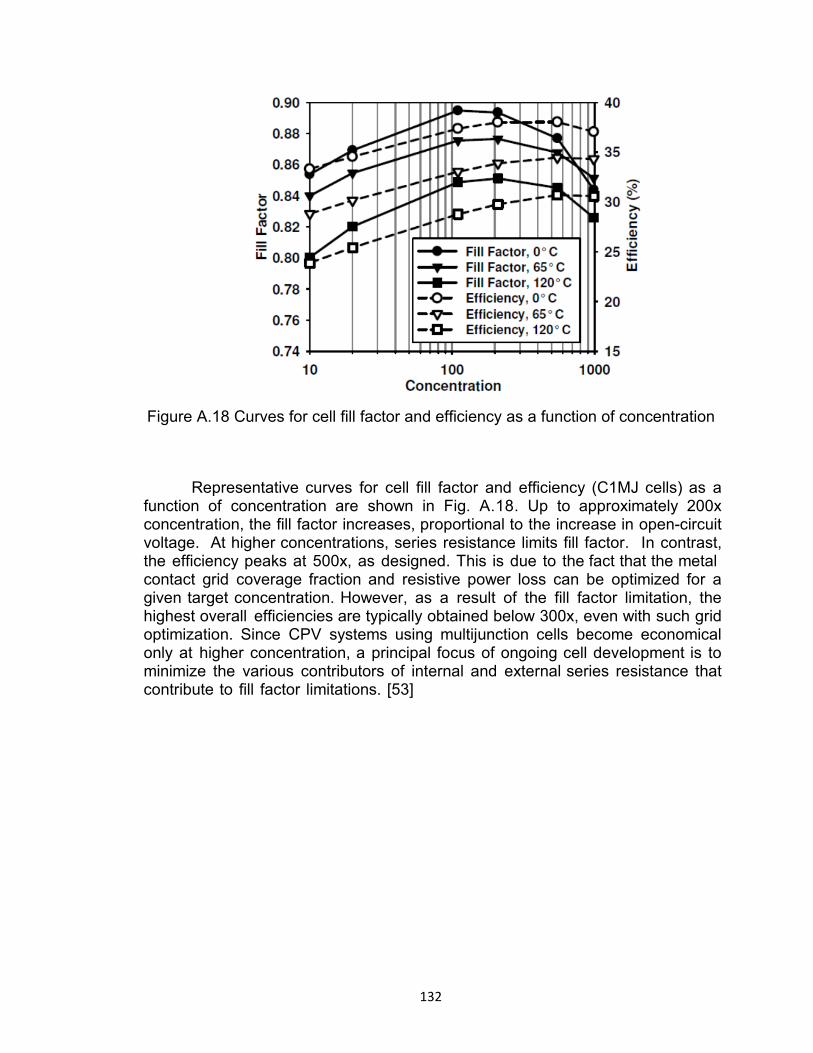
132
Figure A.18 Curves for cell fill factor and efficiency as a function of concentration
Representative curves for cell fill factor and efficiency (C1MJ cells) as a
function of concentration are shown in Fig. A.18. Up to approximately 200x concentration, the fill factor increases, proportional to the increase in open-circuit voltage. At higher concentrations, series resistance limits fill factor. In contrast, the efficiency peaks at 500x, as designed. This is due to the fact that the metal contact grid coverage fraction and resistive power loss can be optimized for a given target concentration. However, as a result of the fill factor limitation, the highest overall efficiencies are typically obtained below 300x, even with such grid optimization. Since CPV systems using multijunction cells become economical only at higher concentration, a principal focus of ongoing cell development is to minimize the various contributors of internal and external series resistance that contribute to fill factor limitations. [53]

133
Figure A.19 Maximum power efficiency vs. concentration
Plotting the maximum power efficiency as a function of temperature and
concentration is shown in Figure A.19. Figure A.20 plots open circuit voltage as a function of concentration and temperature.
Figure A.20 Open Circuit voltage vs. temperature and concentration

134
Figure A.21 Open circuit temperature coefficients vs. concentration
Figure A.21 allows for the extraction of the open circuit voltage temperature coefficients as various concentrations. The range of curves provides some prediction of cell performance above 1000x, where many future CPV systems are expected to operate [53].
Overall, the voltage temperature coefficients exhibit a decrease with concentration. This bodes well for future, high-concentration systems and implies a sub cell performance advantage with respect to silicon single-junction cells in these operating ranges [54] [55]. As an example, at 65°C and 250 x, a multijunction Voc temperature coefficient of 4.6 /°C implies a 1.5% decrease in voltage with respect to that at 25°C; for a crystalline silicon cell under similar conditions, a 1.7% decrease is expected [55]. Given the larger voltage of the multijunction, this differential will widen at higher concentrations.
A pattern using wide grid lines, known as fingers, in the contacting grid on top of the cell are ideal for low resistance, but they block too much light from reaching the cell because of their shadow. One solution to the problems of resistance and shadowing is prismatic covers. These special covers act like a prism and direct incoming light to parts of the cell's surface that are between the metal fingers of the electrical contacts.

135
The advantages of the nonimaging design are its reduced tracking requirements, and color mixing, but the price that is paid is incomplete illumination. A secondary concentrator may be called for in photovoltaic applications to alleviate “hot spots”.
The development of concentrators for PV systems incurs the following dilemma. The higher the geometrical concentration ratio of the concentrator, the smaller is the solar cell needed to generate a fixed amount of electricity, but the higher the system complexity, mainly in terms of the tracking accuracy and the related mechanics and controls.
A.9 NONIMAGING SECONDARY CONCENTRATORS FOR PHOTOVOLTAIC APPLICATIONS
The same principles of nonimaging optics used for the design of reflector shapes of the CPC family to attain maximum allowable geometric concentration for a given angular field of view can be used to design secondary elements (Rabl and Winston, 1976). Applications of two-stage designs lie in the higher-concentration small-angular regime where the geometry of a single stage CPC becomes impractical. The fundamental advantage is the same as in lower- concentration applications and may be expressed in complementary ways: either significant additional system concentration can be attained (i.e., a smaller lower cost absorber) or the angular tolerances and precision can be relaxed while maintaining the same level of concentration [72].
Two-stage nonimaging concentrators employing Fresnel lenses as the primaries and dielectric totally internally reflecting concentrators as the secondaries offer a means of achieving concentrations in the high concentration region (500-1000x), and in more moderate concentration regime (80-100x), it can provide the maximum possible acceptance angle (Ning et al. 1987a,b). In photovoltaic applications, these concentrators provide much larger acceptance angles than conventional lens-cell systems with the same geometrical concentrations. It has also been shown that a two-stage concentrator provides a more uniform and consistent flux distribution on the cell surface and, therefore, the cell’s electrical performance can be enhanced [72].
A potential utility scale CPV installation that provides a concentration of greater than 1000x uses a Fresnel lens as a primary coupled with a secondary optic is discussed in Chapters 2 and 4.
136
A.10 ENVIRONMENTAL TESTING AND RELIABILITY
The long term reliability field data of III-V multijunction cells in
terrestrial concentrator systems is unknown, but there is good reason to believe they will perform well. This is because their device relatives have performed superbly in space for over a decade.
Some design considerations to improve reliability are listed below:
Substrate assembly coefficient of thermal expansion matched to Ge Stress relief at interfaces Uniform and low thermal resistance to heat sink
Isolation of mechanical stresses (interconnection, secondary optics, etc.)
Moisture protection for cell and connections Reduction of polymers in optical path
The best test and the longest, is exposure to real operating conditions [58].
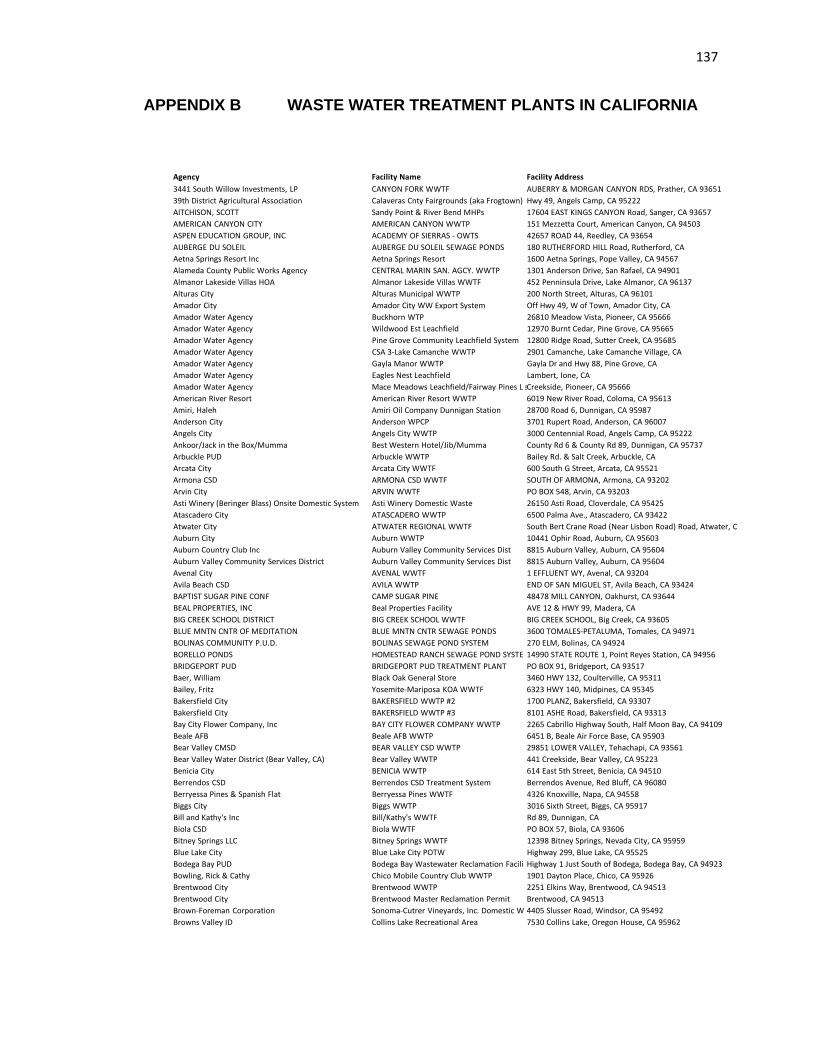
137
APPENDIX B WASTE WATER TREATMENT PLANTS IN CALIFORNIA
Agency Facility Name Facility Address
3441 South Willow Investments, LP CANYON FORK WWTF AUBERRY & MORGAN CANYON RDS, Prather, CA 93651
39th District Agricultural Association Calaveras Cnty Fairgrounds (aka Frogtown) Hwy 49, Angels Camp, CA 95222
AITCHISON, SCOTT Sandy Point & River Bend MHPs 17604 EAST KINGS CANYON Road, Sanger, CA 93657
AMERICAN CANYON CITY AMERICAN CANYON WWTP 151 Mezzetta Court, American Canyon, CA 94503
ASPEN EDUCATION GROUP, INC ACADEMY OF SIERRAS ‐ OWTS 42657 ROAD 44, Reedley, CA 93654
AUBERGE DU SOLEIL AUBERGE DU SOLEIL SEWAGE PONDS 180 RUTHERFORD HILL Road, Rutherford, CA
Aetna Springs Resort Inc Aetna Springs Resort 1600 Aetna Springs, Pope Valley, CA 94567
Alameda County Public Works Agency CENTRAL MARIN SAN. AGCY. WWTP 1301 Anderson Drive, San Rafael, CA 94901
Almanor Lakeside Villas HOA Almanor Lakeside Villas WWTF 452 Penninsula Drive, Lake Almanor, CA 96137
Alturas City Alturas Municipal WWTP 200 North Street, Alturas, CA 96101
Amador City Amador City WW Export System Off Hwy 49, W of Town, Amador City, CA
Amador Water Agency Buckhorn WTP 26810 Meadow Vista, Pioneer, CA 95666
Amador Water Agency Wildwood Est Leachfield 12970 Burnt Cedar, Pine Grove, CA 95665
Amador Water Agency Pine Grove Community Leachfield System 12800 Ridge Road, Sutter Creek, CA 95685
Amador Water Agency CSA 3‐Lake Camanche WWTP 2901 Camanche, Lake Camanche Village, CA
Amador Water Agency Gayla Manor WWTP Gayla Dr and Hwy 88, Pine Grove, CA
Amador Water Agency Eagles Nest Leachfield Lambert, Ione, CA
Amador Water Agency Mace Meadows Leachfield/Fairway Pines LeCreekside, Pioneer, CA 95666
American River Resort American River Resort WWTP 6019 New River Road, Coloma, CA 95613
Amiri, Haleh Amiri Oil Company Dunnigan Station 28700 Road 6, Dunnigan, CA 95987
Anderson City Anderson WPCP 3701 Rupert Road, Anderson, CA 96007
Angels City Angels City WWTP 3000 Centennial Road, Angels Camp, CA 95222
Ankoor/Jack in the Box/Mumma Best Western Hotel/Jib/Mumma County Rd 6 & County Rd 89, Dunnigan, CA 95737
Arbuckle PUD Arbuckle WWTP Bailey Rd. & Salt Creek, Arbuckle, CA
Arcata City Arcata City WWTF 600 South G Street, Arcata, CA 95521
Armona CSD ARMONA CSD WWTF SOUTH OF ARMONA, Armona, CA 93202
Arvin City ARVIN WWTF PO BOX 548, Arvin, CA 93203
Asti Winery (Beringer Blass) Onsite Domestic System Asti Winery Domestic Waste 26150 Asti Road, Cloverdale, CA 95425
Atascadero City ATASCADERO WWTP 6500 Palma Ave., Atascadero, CA 93422
Atwater City ATWATER REGIONAL WWTF South Bert Crane Road (Near Lisbon Road) Road, Atwater, C
Auburn City Auburn WWTP 10441 Ophir Road, Auburn, CA 95603
Auburn Country Club Inc Auburn Valley Community Services Dist 8815 Auburn Valley, Auburn, CA 95604
Auburn Valley Community Services District Auburn Valley Community Services Dist 8815 Auburn Valley, Auburn, CA 95604
Avenal City AVENAL WWTF 1 EFFLUENT WY, Avenal, CA 93204
Avila Beach CSD AVILA WWTP END OF SAN MIGUEL ST, Avila Beach, CA 93424
BAPTIST SUGAR PINE CONF CAMP SUGAR PINE 48478 MILL CANYON, Oakhurst, CA 93644
BEAL PROPERTIES, INC Beal Properties Facility AVE 12 & HWY 99, Madera, CA
BIG CREEK SCHOOL DISTRICT BIG CREEK SCHOOL WWTF BIG CREEK SCHOOL, Big Creek, CA 93605
BLUE MNTN CNTR OF MEDITATION BLUE MNTN CNTR SEWAGE PONDS 3600 TOMALES‐PETALUMA, Tomales, CA 94971
BOLINAS COMMUNITY P.U.D. BOLINAS SEWAGE POND SYSTEM 270 ELM, Bolinas, CA 94924
BORELLO PONDS HOMESTEAD RANCH SEWAGE POND SYSTE 14990 STATE ROUTE 1, Point Reyes Station, CA 94956
BRIDGEPORT PUD BRIDGEPORT PUD TREATMENT PLANT PO BOX 91, Bridgeport, CA 93517
Baer, William Black Oak General Store 3460 HWY 132, Coulterville, CA 95311
Bailey, Fritz Yosemite‐Mariposa KOA WWTF 6323 HWY 140, Midpines, CA 95345
Bakersfield City BAKERSFIELD WWTP #2 1700 PLANZ, Bakersfield, CA 93307
Bakersfield City BAKERSFIELD WWTP #3 8101 ASHE Road, Bakersfield, CA 93313
Bay City Flower Company, Inc BAY CITY FLOWER COMPANY WWTP 2265 Cabrillo Highway South, Half Moon Bay, CA 94109
Beale AFB Beale AFB WWTP 6451 B, Beale Air Force Base, CA 95903
Bear Valley CMSD BEAR VALLEY CSD WWTP 29851 LOWER VALLEY, Tehachapi, CA 93561
Bear Valley Water District (Bear Valley, CA) Bear Valley WWTP 441 Creekside, Bear Valley, CA 95223
Benicia City BENICIA WWTP 614 East 5th Street, Benicia, CA 94510
Berrendos CSD Berrendos CSD Treatment System Berrendos Avenue, Red Bluff, CA 96080
Berryessa Pines & Spanish Flat Berryessa Pines WWTF 4326 Knoxville, Napa, CA 94558
Biggs City Biggs WWTP 3016 Sixth Street, Biggs, CA 95917
Bill and Kathy's Inc Bill/Kathy's WWTF Rd 89, Dunnigan, CA
Biola CSD Biola WWTF PO BOX 57, Biola, CA 93606
Bitney Springs LLC Bitney Springs WWTF 12398 Bitney Springs, Nevada City, CA 95959
Blue Lake City Blue Lake City POTW Highway 299, Blue Lake, CA 95525
Bodega Bay PUD Bodega Bay Wastewater Reclamation Facili Highway 1 Just South of Bodega, Bodega Bay, CA 94923
Bowling, Rick & Cathy Chico Mobile Country Club WWTP 1901 Dayton Place, Chico, CA 95926
Brentwood City Brentwood WWTP 2251 Elkins Way, Brentwood, CA 94513
Brentwood City Brentwood Master Reclamation Permit Brentwood, CA 94513
Brown‐Foreman Corporation Sonoma‐Cutrer Vineyards, Inc. Domestic W 4405 Slusser Road, Windsor, CA 95492
Browns Valley ID Collins Lake Recreational Area 7530 Collins Lake, Oregon House, CA 95962
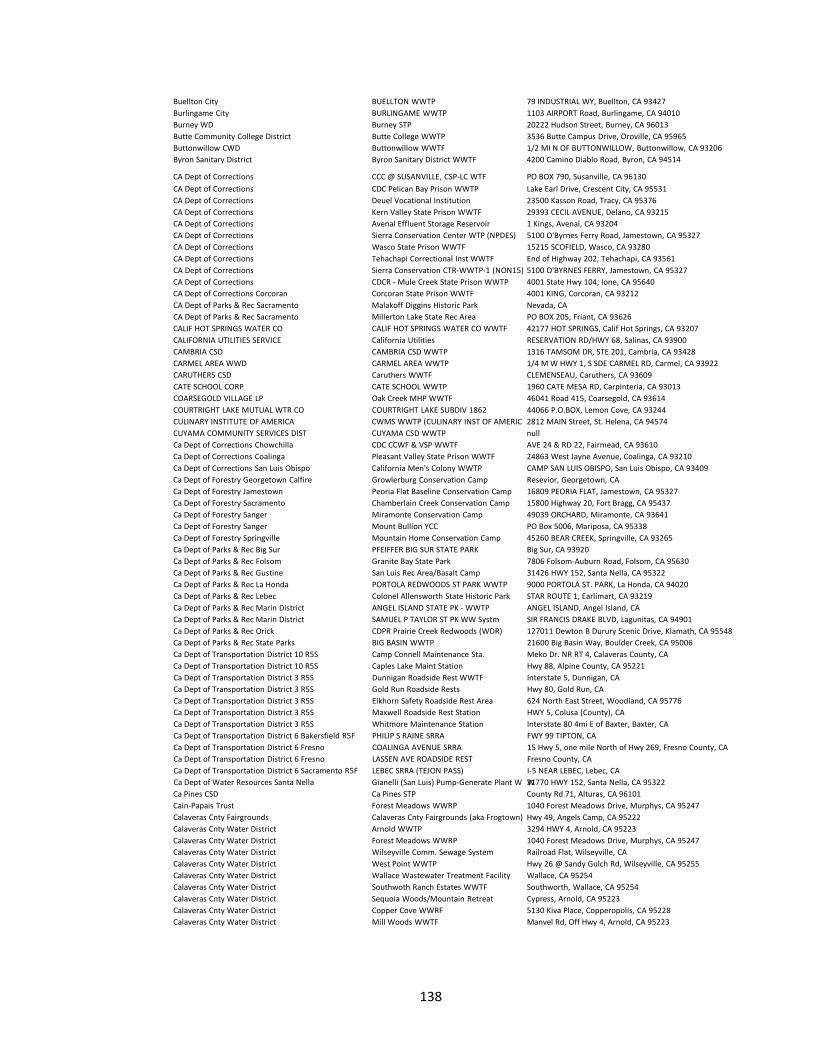
138
Buellton City BUELLTON WWTP 79 INDUSTRIAL WY, Buellton, CA 93427
Burlingame City BURLINGAME WWTP 1103 AIRPORT Road, Burlingame, CA 94010
Burney WD Burney STP 20222 Hudson Street, Burney, CA 96013
Butte Community College District Butte College WWTP 3536 Butte Campus Drive, Oroville, CA 95965
Buttonwillow CWD Buttonwillow WWTF 1/2 MI N OF BUTTONWILLOW, Buttonwillow, CA 93206
Byron Sanitary District Byron Sanitary District WWTF 4200 Camino Diablo Road, Byron, CA 94514
CA Dept of Corrections CCC @ SUSANVILLE, CSP‐LC WTF PO BOX 790, Susanville, CA 96130
CA Dept of Corrections CDC Pelican Bay Prison WWTP Lake Earl Drive, Crescent City, CA 95531
CA Dept of Corrections Deuel Vocational Institution 23500 Kasson Road, Tracy, CA 95376
CA Dept of Corrections Kern Valley State Prison WWTF 29393 CECIL AVENUE, Delano, CA 93215
CA Dept of Corrections Avenal Effluent Storage Reservoir 1 Kings, Avenal, CA 93204
CA Dept of Corrections Sierra Conservation Center WTP (NPDES) 5100 O'Byrnes Ferry Road, Jamestown, CA 95327
CA Dept of Corrections Wasco State Prison WWTF 15215 SCOFIELD, Wasco, CA 93280
CA Dept of Corrections Tehachapi Correctional Inst WWTF End of Highway 202, Tehachapi, CA 93561
CA Dept of Corrections Sierra Conservation CTR‐WWTP‐1 (NON15) 5100 O'BYRNES FERRY, Jamestown, CA 95327
CA Dept of Corrections CDCR ‐ Mule Creek State Prison WWTP 4001 State Hwy 104, Ione, CA 95640
CA Dept of Corrections Corcoran Corcoran State Prison WWTF 4001 KING, Corcoran, CA 93212
CA Dept of Parks & Rec Sacramento Malakoff Diggins Historic Park Nevada, CA
CA Dept of Parks & Rec Sacramento Millerton Lake State Rec Area PO BOX 205, Friant, CA 93626
CALIF HOT SPRINGS WATER CO CALIF HOT SPRINGS WATER CO WWTF 42177 HOT SPRINGS, Calif Hot Springs, CA 93207
CALIFORNIA UTILITIES SERVICE California Utilities RESERVATION RD/HWY 68, Salinas, CA 93900
CAMBRIA CSD CAMBRIA CSD WWTP 1316 TAMSOM DR, STE 201, Cambria, CA 93428
CARMEL AREA WWD CARMEL AREA WWTP 1/4 M W HWY 1, S SDE CARMEL RD, Carmel, CA 93922
CARUTHERS CSD Caruthers WWTF CLEMENSEAU, Caruthers, CA 93609
CATE SCHOOL CORP CATE SCHOOL WWTP 1960 CATE MESA RD, Carpinteria, CA 93013
COARSEGOLD VILLAGE LP Oak Creek MHP WWTF 46041 Road 415, Coarsegold, CA 93614
COURTRIGHT LAKE MUTUAL WTR CO COURTRIGHT LAKE SUBDIV 1862 44066 P.O.BOX, Lemon Cove, CA 93244
CULINARY INSTITUTE OF AMERICA CWMS WWTP (CULINARY INST OF AMERIC 2812 MAIN Street, St. Helena, CA 94574
CUYAMA COMMUNITY SERVICES DIST CUYAMA CSD WWTP null
Ca Dept of Corrections Chowchilla CDC CCWF & VSP WWTF AVE 24 & RD 22, Fairmead, CA 93610
Ca Dept of Corrections Coalinga Pleasant Valley State Prison WWTF 24863 West Jayne Avenue, Coalinga, CA 93210
Ca Dept of Corrections San Luis Obispo California Men's Colony WWTP CAMP SAN LUIS OBISPO, San Luis Obispo, CA 93409
Ca Dept of Forestry Georgetown Calfire Growlerburg Conservation Camp Resevior, Georgetown, CA
Ca Dept of Forestry Jamestown Peoria Flat Baseline Conservation Camp 16809 PEORIA FLAT, Jamestown, CA 95327
Ca Dept of Forestry Sacramento Chamberlain Creek Conservation Camp 15800 Highway 20, Fort Bragg, CA 95437
Ca Dept of Forestry Sanger Miramonte Conservation Camp 49039 ORCHARD, Miramonte, CA 93641
Ca Dept of Forestry Sanger Mount Bullion YCC PO Box 5006, Mariposa, CA 95338
Ca Dept of Forestry Springville Mountain Home Conservation Camp 45260 BEAR CREEK, Springville, CA 93265
Ca Dept of Parks & Rec Big Sur PFEIFFER BIG SUR STATE PARK Big Sur, CA 93920
Ca Dept of Parks & Rec Folsom Granite Bay State Park 7806 Folsom‐Auburn Road, Folsom, CA 95630
Ca Dept of Parks & Rec Gustine San Luis Rec Area/Basalt Camp 31426 HWY 152, Santa Nella, CA 95322
Ca Dept of Parks & Rec La Honda PORTOLA REDWOODS ST PARK WWTP 9000 PORTOLA ST. PARK, La Honda, CA 94020
Ca Dept of Parks & Rec Lebec Colonel Allensworth State Historic Park STAR ROUTE 1, Earlimart, CA 93219
Ca Dept of Parks & Rec Marin District ANGEL ISLAND STATE PK ‐ WWTP ANGEL ISLAND, Angel Island, CA
Ca Dept of Parks & Rec Marin District SAMUEL P TAYLOR ST PK WW Systm SIR FRANCIS DRAKE BLVD, Lagunitas, CA 94901
Ca Dept of Parks & Rec Orick CDPR Prairie Creek Redwoods (WDR) 127011 Dewton B Durury Scenic Drive, Klamath, CA 95548
Ca Dept of Parks & Rec State Parks BIG BASIN WWTP 21600 Big Basin Way, Boulder Creek, CA 95006
Ca Dept of Transportation District 10 R5S Camp Connell Maintenance Sta. Meko Dr. NR RT 4, Calaveras County, CA
Ca Dept of Transportation District 10 R5S Caples Lake Maint Station Hwy 88, Alpine County, CA 95221
Ca Dept of Transportation District 3 R5S Dunnigan Roadside Rest WWTF Interstate 5, Dunnigan, CA
Ca Dept of Transportation District 3 R5S Gold Run Roadside Rests Hwy 80, Gold Run, CA
Ca Dept of Transportation District 3 R5S Elkhorn Safety Roadside Rest Area 624 North East Street, Woodland, CA 95776
Ca Dept of Transportation District 3 R5S Maxwell Roadside Rest Station HWY 5, Colusa (County), CA
Ca Dept of Transportation District 3 R5S Whitmore Maintenance Station Interstate 80 4mi E of Baxter, Baxter, CA
Ca Dept of Transportation District 6 Bakersfield R5F PHILIP S RAINE SRRA FWY 99 TIPTON, CA
Ca Dept of Transportation District 6 Fresno COALINGA AVENUE SRRA 15 Hwy 5, one mile North of Hwy 269, Fresno County, CA
Ca Dept of Transportation District 6 Fresno LASSEN AVE ROADSIDE REST Fresno County, CA
Ca Dept of Transportation District 6 Sacramento R5F LEBEC SRRA (TEJON PASS) I‐5 NEAR LEBEC, Lebec, CA
Ca Dept of Water Resources Santa Nella Gianelli (San Luis) Pump‐Generate Plant W 3W1770 HWY 152, Santa Nella, CA 95322
Ca Pines CSD Ca Pines STP County Rd 71, Alturas, CA 96101
Cain‐Papais Trust Forest Meadows WWRP 1040 Forest Meadows Drive, Murphys, CA 95247
Calaveras Cnty Fairgrounds Calaveras Cnty Fairgrounds (aka Frogtown) Hwy 49, Angels Camp, CA 95222
Calaveras Cnty Water District Arnold WWTP 3294 HWY 4, Arnold, CA 95223
Calaveras Cnty Water District Forest Meadows WWRP 1040 Forest Meadows Drive, Murphys, CA 95247
Calaveras Cnty Water District Wilseyville Comm. Sewage System Railroad Flat, Wilseyville, CA
Calaveras Cnty Water District West Point WWTP Hwy 26 @ Sandy Gulch Rd, Wilseyville, CA 95255
Calaveras Cnty Water District Wallace Wastewater Treatment Facility Wallace, CA 95254
Calaveras Cnty Water District Southwoth Ranch Estates WWTF Southworth, Wallace, CA 95254
Calaveras Cnty Water District Sequoia Woods/Mountain Retreat Cypress, Arnold, CA 95223
Calaveras Cnty Water District Copper Cove WWRF 5130 Kiva Place, Copperopolis, CA 95228
Calaveras Cnty Water District Mill Woods WWTF Manvel Rd, Off Hwy 4, Arnold, CA 95223

139
Calaveras Cnty Water District La Contenta WWT & RF 1525 Campbell Court, Valley Springs, CA 95252
Calaveras Cnty Water District Indian Rock Vineyards WWTP Pennsylvania Gulch, Murphys, CA 95247
Calaveras Cnty Water District Forest Meadows WWT & RP 1040 Forest Meadows Drive, Murphys, CA 95247
Calaveras Cnty Water District Douglas Flat/Vallecito WWTP 1901 Holiday Mine Road off State Route 4, Douglas Flat, CA
Calaveras Cnty Water District Copper Cove WWRF 5130 Kiva Place, Copperopolis, CA 95228
Calaveras Cnty Water District Big Trees County Houses WWTP Hoopa, Camp Connell, CA 95223
Calaveras Timber Trails, Assoc Calaveras Timber Trails WWTF & Disposal F 1071 Avery Sheep Ranch, Avery, CA
Calaveras Unified SD Jenny Lind Elementary School Star Route 26, Rancho Calaveras, CA
Calaveras Unified SD Toyon Middle School San Andreas, CA 95249
California American Water Co Monterey INDIAN SPRINGS STP RIVER RD, Salinas, CA 93900
California American Water Co Monterey LAS PALMAS RANCH WWTP 21702 River Road, Salinas, CA 93901
California American Water Co Monterey OAK HILLS DEVELOPMENT WWTP Castroville, CA 95012
California National Guard CAMP ROBERTS STP US 101, CAMP ROBERTS EXIT, CA 93451
California State Parks Foundation MARCONI CONFERENCE CENTER WWTP HIGHWAY One, Marshall, CA 94940
Calistoga City Calistoga City Dunaweal WWTP 1185 Dunaweal Lane, Calistoga, CA 94515
Calpella CWD Calpella CWD WWTP 5681 North State Street, Calpella, CA 95418
Calvin Harwood Harwood Products Branscomb Mill 14210 Branscomb Road, Branscomb, CA 95417
Camp Sierra Association Camp Sierra, Big Creek 52000 Camp Sierra Road, Shaver Lake, CA 93664
Canada Woods Reclamation Facility CANADA WOODS RECLAMATION FACILITY ESTE MADERA/CANDA SEGUNDA, Carmel, CA 93923
Canyon Fork Properties CANYON FORK WWTF AUBERRY & MORGAN CANYON RDS, Prather, CA 93651
Carneros Partnership LLC CARNEROS INN WASTEWATER SYSTEM 4048 SONOMA HIGHWAY, Napa, CA 94558
Carpinteria SD CARPINTERIA SD WWTP 5351 Sixth Street, Carpinteria, CA 93013
Cascade Partners, LLC Cascade MHP WWTF 18330 Wards Ferry Road, Sonora, CA 95370
Castro Valley Sanitary District ORO LOMA/CASTRO VALLEY SD WPCP 2600 GRANT Avenue, San Lorenzo, CA 94580
Central Contra Costa Sanitary District CENTRAL CONTRA COSTA SD WWTP 5019 IMHOFF, Martinez, CA 94553
Central Marin Sanitation Agency CENTRAL MARIN SAN. AGCY. WWTP 1301 Anderson Drive, San Rafael, CA 94901
Ceres City Ceres WWTP 4200 Morgan, Ceres, CA 95307
Chateau St Jean Winery CHATEAU ST JEAN WINERY WW Ponds 8555 SONOMA Highway, Kenwood, CA 95452
Chawanakee Unified School District Minarets High School WWTP N of Madera Co Rd 200 & East of Outback Industrial Rd, Nort
Chester PUD Chester STP 881 First Avenue, Chester, CA 96020
Chico City Chico Water Pollution Control Plant 4827 Chico River Road, Chico, CA 95927
Children's Hospital Central California Children's Hospital WWTF 9300 Valley Children's Place, Madera, CA 93636
Chowchilla City Chowchilla WWTF AVE 24 1/2 & RD 16, Chowchilla, CA 93610
Christian Outreach Ministries Honey Rock STP ‐ Ponds 3945 Oro‐Bangor Highway, Oroville, CA 95966
Circle Oaks Cnty Water Dist Circle Oaks WWTF Napa (County), CA
Clearlake Oaks Cnty Water Dist Clearlake Oaks Co WTR Dis WWTP Lake County, CA
Cloverdale City Cloverdale City WWTP 700 Asti Road, Cloverdale, CA 95425
Clovis City Clovis WWTF 9700 EAST ASHLAN Avenue, Clovis, CA 93619
Coalinga City COALINGA WWTF South of Los Gatos Creek, 1000 feet East of Wartham Creek,
Coit Ginning Company Coit Ginning Company WWTF 2578 LYON, Mendota, CA 93640
Colfax City Colfax WWTP 23550 Grandview Avenue, Colfax, CA 95713
College of the Redwoods College of the Redwoods, POTW 7351 Tompkins Hill Road, Eureka, CA 95501
Colusa City Colusa WWTP 2820 Will S Green Road, Colusa, CA 95932
Colusa Cnty Migrant Housing Camp 401 Theater, Williams, CA
Consolidated Tribal Health Project, Inc. Consolidated Tribal Health Project, Inc. 6991 North State Street, Redwood Valley, CA 95470
Contra Costa County SD No 5 PORT COSTA WWTP CANYON LAKE DRIVE, Port Costa, CA 94569
Contra Costa County SD No 6 Contra Costa Co.SD#6 WWTP (Stonehurst) ALHAMBRA VALLEY ROAD, Martinez, CA 94533
Contra Costa Water Authority (a Partnership) Randall Bold WTP 3760 Neroly Road, Oakley, CA
Contra Costa Water District Randall Bold WTP 3760 Neroly Road, Oakley, CA
Cool Village Investments, LLC Cool Village WWTF Cool, CA
Corcoran City CORCORAN WWTF Pueblo Avenue and 5th Avenue, Corcoran, CA 93212
Cordell, Carlene dba C Arrow B Recreational Center Black Oak General Store 3460 HWY 132, Coulterville, CA 95311
Corning City Corning WWTP 25010 Gardiner Ferry Road, Corning, CA 96021
Covelo CSD Covelo POTW 76001 Commercial Street, Covelo, CA 95428
Cox, Randy and Diane Deer Creek RV Park 10679 Orange Belt Drive, Terra Bella, CA 93270
Crescent City Crescent City WWTP 210 Battery, Crescent City, CA 95531
Critchfield, OC and Harry Roll‐in MHP WWTF 22466 AIRPORT, Sonora, CA 95370
Crockett CSD PORT COSTA WWTP CANYON LAKE DRIVE, Port Costa, CA 94569
Cutler‐Orosi JT Powers WW Authority CUTLER‐OROSI WWTF 40401 RD 120, Cutler, CA 93615
Cypress Ridge Limited Partnership CYPRESS RIDGE SEWER FACILITY 950 CYPRESS RIDGE PKWY, Arroyo Grande, CA 93420
D‐Q University D‐Q University WWTF Davis, CA
DAVENPORT CO SD DAVENPORT WWTP NONE, Santa Cruz, CA 95017
DEER MEADOW LEACHFIELD SERVICE DEER MEADOW LEACHFIELD THREE RIVERS, Three Rivers, CA 93271
DELHI CWD DELHI WWTF CANAL DR & SOUTH AVE, Delhi, CA 95315
DISINGER, MARGARET LEMON COVE/SEQUOIA CAMPGROUND SIERRA DR (HWY 198), Lemon Cove, CA 93244
DNC Parks & Resorts at Tenya Inc Tenaya Lodge At Yosemite 1122 HWY 41, PO BOX 159, Fish Camp, CA 93623
DUBLIN SAN RAMON SERVICES DISTRICT (WWTP NPDE SDUBLIN SAN RAMON SD WWTP 7399 JOHNSON Drive, Pleasanton, CA 94588
DUBLIN SAN RAMON SERVICES DISTRICT (WWTP NPDE City of Livermore Water Reclamation Plant 101 West JACK LONDON Boulevard, Livermore, CA 94551
DUFFY'S MYRTLEDALE DUFFY'S MYRTLEDALE WW PONDS 3076 MYRTLEDALE, Calistoga, CA 94515
Danco Builders Willow Creek Apartments 51 Brannon Mountain Road, Willow Creek, CA 95573
Davis City Davis WWTP Davis, CA
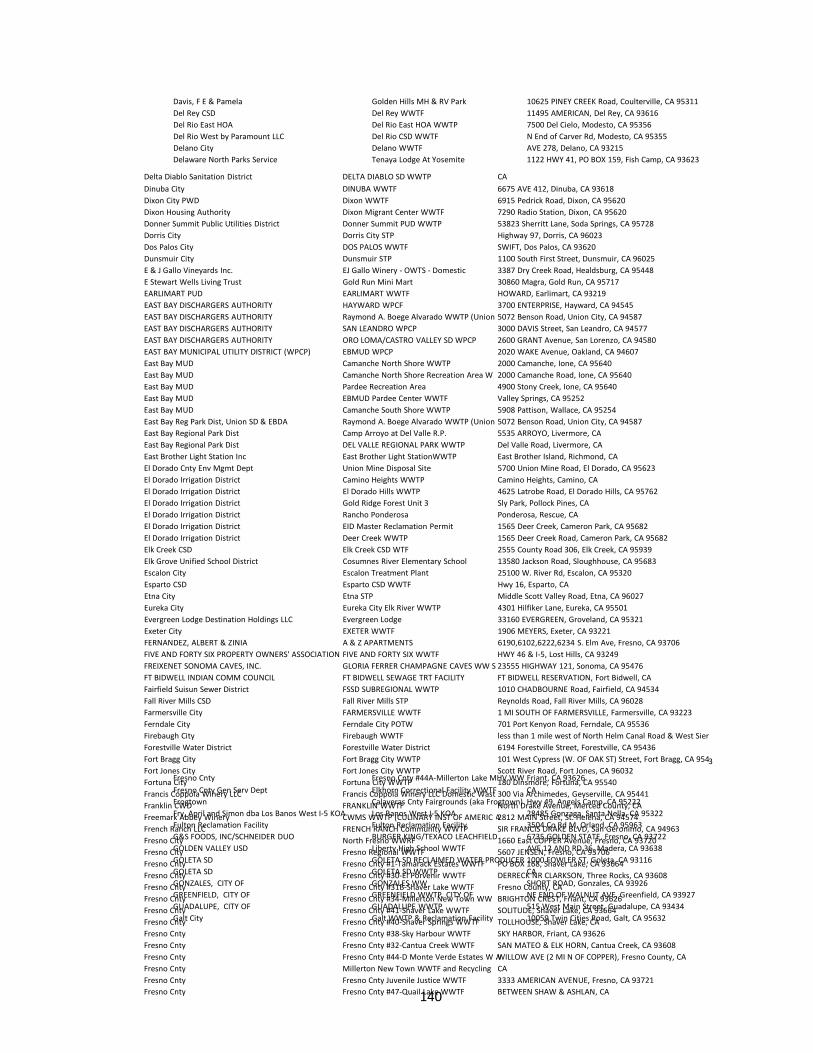
140
Delta Diablo Sanitation District DELTA DIABLO SD WWTP CA
Dinuba City DINUBA WWTF 6675 AVE 412, Dinuba, CA 93618
Dixon City PWD Dixon WWTF 6915 Pedrick Road, Dixon, CA 95620
Dixon Housing Authority Dixon Migrant Center WWTF 7290 Radio Station, Dixon, CA 95620
Donner Summit Public Utilities District Donner Summit PUD WWTP 53823 Sherritt Lane, Soda Springs, CA 95728
Dorris City Dorris City STP Highway 97, Dorris, CA 96023
Dos Palos City DOS PALOS WWTF SWIFT, Dos Palos, CA 93620
Dunsmuir City Dunsmuir STP 1100 South First Street, Dunsmuir, CA 96025
E & J Gallo Vineyards Inc. EJ Gallo Winery ‐ OWTS ‐ Domestic 3387 Dry Creek Road, Healdsburg, CA 95448
E Stewart Wells Living Trust Gold Run Mini Mart 30860 Magra, Gold Run, CA 95717
EARLIMART PUD EARLIMART WWTF HOWARD, Earlimart, CA 93219
EAST BAY DISCHARGERS AUTHORITY HAYWARD WPCF 3700 ENTERPRISE, Hayward, CA 94545
EAST BAY DISCHARGERS AUTHORITY Raymond A. Boege Alvarado WWTP (Union 5072 Benson Road, Union City, CA 94587
EAST BAY DISCHARGERS AUTHORITY SAN LEANDRO WPCP 3000 DAVIS Street, San Leandro, CA 94577
EAST BAY DISCHARGERS AUTHORITY ORO LOMA/CASTRO VALLEY SD WPCP 2600 GRANT Avenue, San Lorenzo, CA 94580
EAST BAY MUNICIPAL UTILITY DISTRICT (WPCP) EBMUD WPCP 2020 WAKE Avenue, Oakland, CA 94607
East Bay MUD Camanche North Shore WWTP 2000 Camanche, Ione, CA 95640
East Bay MUD Camanche North Shore Recreation Area W 2000 Camanche Road, Ione, CA 95640
East Bay MUD Pardee Recreation Area 4900 Stony Creek, Ione, CA 95640
East Bay MUD EBMUD Pardee Center WWTF Valley Springs, CA 95252
East Bay MUD Camanche South Shore WWTP 5908 Pattison, Wallace, CA 95254
East Bay Reg Park Dist, Union SD & EBDA Raymond A. Boege Alvarado WWTP (Union 5072 Benson Road, Union City, CA 94587
East Bay Regional Park Dist Camp Arroyo at Del Valle R.P. 5535 ARROYO, Livermore, CA
East Bay Regional Park Dist DEL VALLE REGIONAL PARK WWTP Del Valle Road, Livermore, CA
East Brother Light Station Inc East Brother Light StationWWTP East Brother Island, Richmond, CA
El Dorado Cnty Env Mgmt Dept Union Mine Disposal Site 5700 Union Mine Road, El Dorado, CA 95623
El Dorado Irrigation District Camino Heights WWTP Camino Heights, Camino, CA
El Dorado Irrigation District El Dorado Hills WWTP 4625 Latrobe Road, El Dorado Hills, CA 95762
El Dorado Irrigation District Gold Ridge Forest Unit 3 Sly Park, Pollock Pines, CA
El Dorado Irrigation District Rancho Ponderosa Ponderosa, Rescue, CA
El Dorado Irrigation District EID Master Reclamation Permit 1565 Deer Creek, Cameron Park, CA 95682
El Dorado Irrigation District Deer Creek WWTP 1565 Deer Creek Road, Cameron Park, CA 95682
Elk Creek CSD Elk Creek CSD WTF 2555 County Road 306, Elk Creek, CA 95939
Elk Grove Unified School District Cosumnes River Elementary School 13580 Jackson Road, Sloughhouse, CA 95683
Escalon City Escalon Treatment Plant 25100 W. River Rd, Escalon, CA 95320
Esparto CSD Esparto CSD WWTF Hwy 16, Esparto, CA
Etna City Etna STP Middle Scott Valley Road, Etna, CA 96027
Eureka City Eureka City Elk River WWTP 4301 Hilfiker Lane, Eureka, CA 95501
Evergreen Lodge Destination Holdings LLC Evergreen Lodge 33160 EVERGREEN, Groveland, CA 95321
Exeter City EXETER WWTF 1906 MEYERS, Exeter, CA 93221
FERNANDEZ, ALBERT & ZINIA A & Z APARTMENTS 6190,6102,6222,6234 S. Elm Ave, Fresno, CA 93706
FIVE AND FORTY SIX PROPERTY OWNERS' ASSOCIATION FIVE AND FORTY SIX WWTF HWY 46 & I‐5, Lost Hills, CA 93249
FREIXENET SONOMA CAVES, INC. GLORIA FERRER CHAMPAGNE CAVES WW S 23555 HIGHWAY 121, Sonoma, CA 95476
FT BIDWELL INDIAN COMM COUNCIL FT BIDWELL SEWAGE TRT FACILITY FT BIDWELL RESERVATION, Fort Bidwell, CA
Fairfield Suisun Sewer District FSSD SUBREGIONAL WWTP 1010 CHADBOURNE Road, Fairfield, CA 94534
Fall River Mills CSD Fall River Mills STP Reynolds Road, Fall River Mills, CA 96028
Farmersville City FARMERSVILLE WWTF 1 MI SOUTH OF FARMERSVILLE, Farmersville, CA 93223
Ferndale City Ferndale City POTW 701 Port Kenyon Road, Ferndale, CA 95536
Firebaugh City Firebaugh WWTF less than 1 mile west of North Helm Canal Road & West Sier
Forestville Water District Forestville Water District 6194 Forestville Street, Forestville, CA 95436
Fort Bragg City Fort Bragg City WWTP 101 West Cypress (W. OF OAK ST) Street, Fort Bragg, CA 954
Fort Jones City Fort Jones City WWTP Scott River Road, Fort Jones, CA 96032
Fortuna City Fortuna City WWTP 180 Dinsmore, Fortuna, CA 95540
Francis Coppola Winery LLC Francis Coppola Winery LLC Domestic Wast 300 Via Archimedes, Geyserville, CA 95441
Franklin CWD FRANKLIN WWTF North Drake Avenue, Merced County, CA
Freemark Abbey Winery CWMS WWTP (CULINARY INST OF AMERIC A2812 MAIN Street, St. Helena, CA 94574
French Ranch LLC FRENCH RANCH Community WWTP SIR FRANCIS DRAKE BLVD, San Geronimo, CA 94963
Fresno City North Fresno WWRF 1660 East COPPER Avenue, Fresno, CA 93720
Fresno City Fresno Regional WWTF 5607 JENSEN, Fresno, CA 93706
Fresno Cnty Fresno Cnty #1‐Tamarack Estates WWTF PO BOX 168, Shaver Lake, CA 93664
Fresno Cnty Fresno Cnty #30‐El Porvenir WWTF DERRECK NR CLARKSON, Three Rocks, CA 93608
Fresno Cnty Fresno Cnty #31B‐Shaver Lake WWTF Fresno County, CA
Fresno Cnty Fresno Cnty #34‐Millerton New Town WW BRIGHTON CREST, Friant, CA 93626
Fresno Cnty Fresno Cnty #41‐Shaver Lake WWTF SOLITUDE, Shaver Lake, CA 93664
Fresno Cnty Fresno Cnty #40‐Shaver Springs WWTF TOLLHOUSE, Shaver Lake, CA
Fresno Cnty Fresno Cnty #38‐Sky Harbour WWTF SKY HARBOR, Friant, CA 93626
Fresno Cnty Fresno Cnty #32‐Cantua Creek WWTF SAN MATEO & ELK HORN, Cantua Creek, CA 93608
Fresno Cnty Fresno Cnty #44‐D Monte Verde Estates WWWILLOW AVE (2 MI N OF COPPER), Fresno County, CA
Fresno Cnty Millerton New Town WWTF and Recycling CA
Fresno Cnty Fresno Cnty Juvenile Justice WWTF 3333 AMERICAN AVENUE, Fresno, CA 93721
Fresno Cnty Fresno Cnty #47‐Quail Lake WWTF BETWEEN SHAW & ASHLAN, CA
Davis, F E & Pamela Golden Hills MH & RV Park 10625 PINEY CREEK Road, Coulterville, CA 95311
Del Rey CSD Del Rey WWTF 11495 AMERICAN, Del Rey, CA 93616
Del Rio East HOA Del Rio East HOA WWTP 7500 Del Cielo, Modesto, CA 95356
Del Rio West by Paramount LLC Del Rio CSD WWTF N End of Carver Rd, Modesto, CA 95355
Delano City Delano WWTF AVE 278, Delano, CA 93215
Delaware North Parks Service Tenaya Lodge At Yosemite 1122 HWY 41, PO BOX 159, Fish Camp, CA 93623
3
Fresno Cnty Fresno Cnty #44A‐Millerton Lake MHV WW Friant, CA 93626
Fresno Cnty Gen Serv Dept Elkhorn Correctional Facility WWTF CA
Frogtown Calaveras Cnty Fairgrounds (aka Frogtown) Hwy 49, Angels Camp, CA 95222
Fry, April and Simon dba Los Banos West I‐5 KOA Los Banos West I‐5 KOA 28485 Gonzaga, Santa Nella, CA 95322
Fulton Reclamation Facility Fulton Reclamation Facility 3504 Co Rd M, Orland, CA 95963
G&S FOODS, INC/SCHNEIDER DUO BURGER KING/TEXACO LEACHFIELD 6735 GOLDEN STATE, Fresno, CA 93722
GOLDEN VALLEY USD Liberty High School WWTF AVE 12 AND RD 36, Madera, CA 93638
GOLETA SD GOLETA SD RECLAIMED WATER PRODUCER 1000 FOWLER ST, Goleta, CA 93116
GOLETA SD GOLETA SD WWTP CA
GONZALES, CITY OF GONZALES WW SHORT ROAD, Gonzales, CA 93926
GREENFIELD, CITY OF GREENFIELD WWTP, CITY OF NE END OF WALNUT AVE, Greenfield, CA 93927
GUADALUPE, CITY OF GUADALUPE WWTP 515 West Main Street, Guadalupe, CA 93434
Galt City Galt WWTP & Reclamation Facility 10059 Twin Cities Road, Galt, CA 95632

141
Garberville Sanitary District Garberville POTW Old Marshall Ranch, Garberville, CA 95542
Georgetown Divide PUD Auburn LK Onsite WW Disp 1.5 Miles E OF Cool, on Hwy 49, Cool, CA 95614
Gerber‐Las Flores CSD Gerber STP Levee Road, Gerber, CA 96035
Gilardis Resort PAPAS TAVERNA Wastewater Systm 5688 LAKEVILLE Road, Petaluma, CA 94954
Glenos, David & Maria Roll‐in MHP WWTF 22466 AIRPORT, Sonora, CA 95370
Gold Beach Park Gold Beach Park WTF 8201 Hwy 49, Box #5, El Dorado, CA 95623
Gold Mountain CSD Gold Mountain WWTF HWY A13, Blairsden, CA 96103
Golden Hills Sanitation Co, Inc Golden Hills WWTF Tehachapi, CA 93561
Golden Meadows CSD Golden Meadows STP (sand filter) 22572 Fisher Road, Red Bluff, CA 96080
Grass Valley City Grass Valley City WWTP 556 Freeman Lane, Grass Valley, CA 95945
Graton CSD SCWA Graton CSD Ross, Graton, CA 95444
Grayson CSD Grayson Comm Serv Dist WTF Grayson, CA
Greenstone Estates MHP Greenstone Estates MHP ‐ WWTF 4700 Old Frenchtown, Shingle Springs, CA 95682
Grenada Sanitary District Grenada Sanitary District STP Grenada‐Road A‐12, Grenada, CA 96038
Gridley City Gridley WWTF East Gridley Place, Gridley, CA 95948
Grizzly Lake Resort Imp Dist Crocker Mountain Estates STP Grizzly Road, Portola, CA 96122
Grizzly Lake Resort Imp Dist Delleker WWTP 73821 Industrial Way, Portola, CA 96122
Groveland CSD GROVELAND STP 18966 FERRETTI Road, Groveland, CA 95321
Gualala CSD Gualala WWTF 42455 State Highway 1, Gualala, CA 95445
Gustine City Gustine WWTF CARNATION, Gustine, CA 95322
HANNEGAN, JOE & HANNEGAN, BRAD Lakeside Trailer Park 29198 HWY 190, Porterville, CA 93257
HARRIS FARMS, INC Harris Farms Farm Labor Housing Facility ROUTE 1, BOX 420, Coalinga, CA 93210
HARRIS FARMS, INC DBA HARRIS RANCH I‐5 & Dorris Avenue Rest Stop WWTF ROUTE 1, BOX 777, Coalinga, CA 93210
HARTLAND CHRISTIAN ASSOCIATION Hartland Christian OWTS 57611 ESHOM VALLEY, Badger, CA 93603
HAYWARD CITY HAYWARD WPCF 3700 ENTERPRISE, Hayward, CA 94545
HCRID #1 Shelter Cove POTW 9126 Shelter Cove Dr, Shelter Cove, CA
HERITAGE RANCH CSD HERITAGE RANCH WWTP 4870 HERITAGE RD, Paso Robles, CA 93446
HILMAR CWD Hilmar CWD WWTF NR GRIFFITH & WILLIAMS, Hilmar, CA 95324
HOLCOMB, C.P. Yosemite Cattle Company 24025 State Highway 120, Groveland, CA 95321
HOVANNISIAN, JOHN North Fork Mill Housing Facility PO BOX 943, North Fork, CA 93643
HUDSON, EDGAR Kings Canyon MHP 35671 Kings Canyon Road, Dunlap, CA 93621
HUME LAKE CHRISTIAN CAMPS HUME LAKE WWTF 64144 HUME LAKE, Hume, CA 93628
Hageman Properties LLC Creekside RV Park 4949 Dennis McCarthy Drive, Bakersfield, CA 93307
Hamilton City CSD Hamilton City CSD WWTP Hamilton City, CA
Hanford City HANFORD WWTF 10555 HOUSTON, Hanford, CA 93230
Happy Camp Sanitation District Happy Camp WWTP Highway 96, Happy Camp, CA 96039
Harwood Products, Inc. Harwood Products Branscomb Mill 14210 Branscomb Road, Branscomb, CA 95417
Healdsburg City Healdsburg City WWTP Felta Road, Healdsburg, CA 95448
Herlong PUD Herlong Utilities Cooperative WW Reclama POLELINE RD, Herlong, CA
Hess Collection Winery HESS WINERY WW Pond System 4411 REDWOOD, Napa, CA 94558
Hidden Valley Lake CSD Hidden Valley Lake WRF 19400 Hartman Road, Middletown, CA 95461
Hoberg's Club Resort Hoberg?s Club Resort 15205 Hwy 175, Cobb, CA 95426
Hollister City HOLLISTER DOMESTIC WWTP N SIDE HWY 156, W SAN BENITO R, Hollister, CA 95023
Homestead Ranch LLC HOMESTEAD RANCH SEWAGE POND SYSTE 14990 STATE ROUTE 1, Point Reyes Station, CA 94956
Hopland Public Utility District Hopland Public Utilities District Highway 101, Hopland, CA 95449
Hughson City Hughson WWTF 6700 Leedom Road, Hughson, CA 95326
Huron City HURON WWTF CA
I‐5 PROPERTY SERVICE, INC I‐5 & Panoche Road WWTF HC‐1 BOX 1, Fresno County, CA
I‐5 PROPERTY SERVICES, INC I‐5 & Dorris Avenue WWTF I‐5 & DORRIS, Huron, CA
I‐5 UTILITY COMPANY, INC I‐5 & Highway 58 WWTF HWY 58 AT I‐5, Buttonwillow, CA 93206
INSTITUTE OF NOETIC SCIENCES Inst Noetic Science WW System 101 SAN ANTONIO ROAD, Petaluma, CA 94952
IVANHOE PUD IVANHOE WWTF PO BOX A, Ivanhoe, CA 93235
Indian Valley CSD Greenville WW Ponds Hot Springs Road, Greenville, CA 95947
Indian Valley CSD Taylorsville STP Taylorsville Road, Taylorsville, CA 95971
Ione City Ione City Secondary WWTP 1600 West Marlette Street, Ione, CA 95640
Ironhouse Sanitary District Ironhouse WWTF 450 Walnut Meadows Drive, Oakley, CA 94561
Isleton City Isleton WWTP 210 Jackson, Isleton, CA 95641
JHAJ, GURVINDER S. COMANCHE SHELL STATION ‐ OWTS Intersection of Comanche & Edison HWY, Bakersfield, CA 93
JUNEJA INTERNATIONAL LLC FIREBAUGH TRUCK & AUTO PLAZA I‐5 & NEES AVE, Merced County, CA
Jackson City Jackson City WWTP 39 North Highway 49‐88, Jackson, CA 95642
Jackson Valley Industries LLC Harwood Products Branscomb Mill 14210 Branscomb Road, Branscomb, CA 95417
Jamestown SD JAMESTOWN SANITARY DISTRICT WWTF CA
Joahannine Daist Communion Mountain of Attn Sanctuary 12040 North Seigler Springs Road, Middletown, CA 95461
Jordan Winery Jordan Vineyard and Winery (Domestic Wa 1474 Alexander Valley Road, Healdsburg, CA 95448
KELLEHER CORPORATION BRIX RESTAURANT WW PONDS 7331 ST. HELENA, Yountville, CA
Kelseyville Cnty Waterworks, District 3 Lake Cnty SD Kelseyville WWD No. 3 Kelsey 4395 Gaddy Lane, Kelseyville, CA 95451
Kendall‐Jackson Winery LTD Kendall‐Jackson Wine Center Domestic Wa 5007 Fulton Road, Santa Rosa, CA 95403
Kerman City KERMAN WWTF 15480 CHURCH, Kerman, CA 93630
Kern Cnty Eng & Surveying Services Dept Kern Cnty CSA 39‐Zone 2 ADJ HWY 178, Lake Isabella, CA 93240
Kern Cnty Housing Authority North Shafter Farm Labor Camp P O BOX 638 (CENTRAL VALLEY H, Shafter, CA 93263
Kern Cnty Waste Mgmt Dept Kern Cnty Buena Vista Aquatic Rec Area Kern County, CA
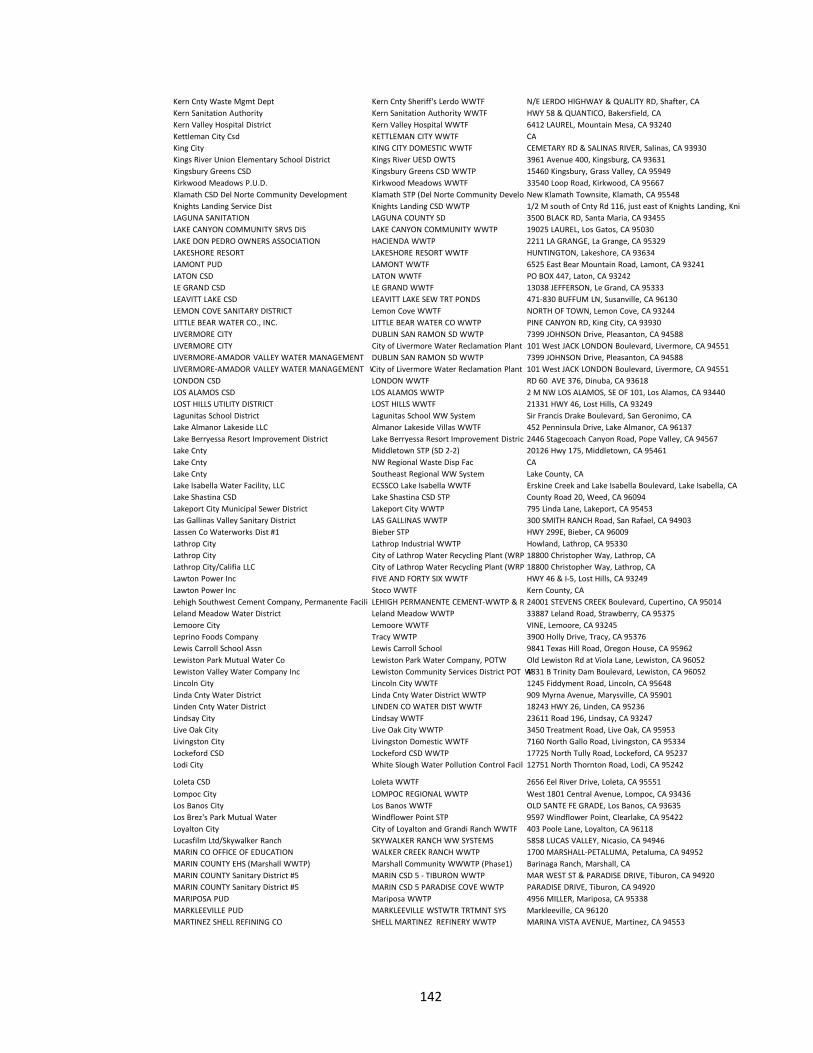
142
Kern Cnty Waste Mgmt Dept Kern Cnty Sheriff's Lerdo WWTF N/E LERDO HIGHWAY & QUALITY RD, Shafter, CA
Kern Sanitation Authority Kern Sanitation Authority WWTF HWY 58 & QUANTICO, Bakersfield, CA
Kern Valley Hospital District Kern Valley Hospital WWTF 6412 LAUREL, Mountain Mesa, CA 93240
Kettleman City Csd KETTLEMAN CITY WWTF CA
King City KING CITY DOMESTIC WWTF CEMETARY RD & SALINAS RIVER, Salinas, CA 93930
Kings River Union Elementary School District Kings River UESD OWTS 3961 Avenue 400, Kingsburg, CA 93631
Kingsbury Greens CSD Kingsbury Greens CSD WWTP 15460 Kingsbury, Grass Valley, CA 95949
Kirkwood Meadows P.U.D. Kirkwood Meadows WWTF 33540 Loop Road, Kirkwood, CA 95667
Klamath CSD Del Norte Community Development Klamath STP (Del Norte Community Develo New Klamath Townsite, Klamath, CA 95548
Knights Landing Service Dist Knights Landing CSD WWTP 1/2 M south of Cnty Rd 116, just east of Knights Landing, Kni
LAGUNA SANITATION LAGUNA COUNTY SD 3500 BLACK RD, Santa Maria, CA 93455
LAKE CANYON COMMUNITY SRVS DIS LAKE CANYON COMMUNITY WWTP 19025 LAUREL, Los Gatos, CA 95030
LAKE DON PEDRO OWNERS ASSOCIATION HACIENDA WWTP 2211 LA GRANGE, La Grange, CA 95329
LAKESHORE RESORT LAKESHORE RESORT WWTF HUNTINGTON, Lakeshore, CA 93634
LAMONT PUD LAMONT WWTF 6525 East Bear Mountain Road, Lamont, CA 93241
LATON CSD LATON WWTF PO BOX 447, Laton, CA 93242
LE GRAND CSD LE GRAND WWTF 13038 JEFFERSON, Le Grand, CA 95333
LEAVITT LAKE CSD LEAVITT LAKE SEW TRT PONDS 471‐830 BUFFUM LN, Susanville, CA 96130
LEMON COVE SANITARY DISTRICT Lemon Cove WWTF NORTH OF TOWN, Lemon Cove, CA 93244
LITTLE BEAR WATER CO., INC. LITTLE BEAR WATER CO WWTP PINE CANYON RD, King City, CA 93930
LIVERMORE CITY DUBLIN SAN RAMON SD WWTP 7399 JOHNSON Drive, Pleasanton, CA 94588
LIVERMORE CITY City of Livermore Water Reclamation Plant 101 West JACK LONDON Boulevard, Livermore, CA 94551
LIVERMORE‐AMADOR VALLEY WATER MANAGEMENT DUBLIN SAN RAMON SD WWTP 7399 JOHNSON Drive, Pleasanton, CA 94588
LIVERMORE‐AMADOR VALLEY WATER MANAGEMENT ACity of Livermore Water Reclamation Plant 101 West JACK LONDON Boulevard, Livermore, CA 94551
LONDON CSD LONDON WWTF RD 60 AVE 376, Dinuba, CA 93618
LOS ALAMOS CSD LOS ALAMOS WWTP 2 M NW LOS ALAMOS, SE OF 101, Los Alamos, CA 93440
LOST HILLS UTILITY DISTRICT LOST HILLS WWTF 21331 HWY 46, Lost Hills, CA 93249
Lagunitas School District Lagunitas School WW System Sir Francis Drake Boulevard, San Geronimo, CA
Lake Almanor Lakeside LLC Almanor Lakeside Villas WWTF 452 Penninsula Drive, Lake Almanor, CA 96137
Lake Berryessa Resort Improvement District Lake Berryessa Resort Improvement Distric 2446 Stagecoach Canyon Road, Pope Valley, CA 94567
Lake Cnty Middletown STP (SD 2‐2) 20126 Hwy 175, Middletown, CA 95461
Lake Cnty NW Regional Waste Disp Fac CA
Lake Cnty Southeast Regional WW System Lake County, CA
Lake Isabella Water Facility, LLC ECSSCO Lake Isabella WWTF Erskine Creek and Lake Isabella Boulevard, Lake Isabella, CA
Lake Shastina CSD Lake Shastina CSD STP County Road 20, Weed, CA 96094
Lakeport City Municipal Sewer District Lakeport City WWTP 795 Linda Lane, Lakeport, CA 95453
Las Gallinas Valley Sanitary District LAS GALLINAS WWTP 300 SMITH RANCH Road, San Rafael, CA 94903
Lassen Co Waterworks Dist #1 Bieber STP HWY 299E, Bieber, CA 96009
Lathrop City Lathrop Industrial WWTP Howland, Lathrop, CA 95330
Lathrop City City of Lathrop Water Recycling Plant (WRP 18800 Christopher Way, Lathrop, CA
Lathrop City/Califia LLC City of Lathrop Water Recycling Plant (WRP 18800 Christopher Way, Lathrop, CA
Lawton Power Inc FIVE AND FORTY SIX WWTF HWY 46 & I‐5, Lost Hills, CA 93249
Lawton Power Inc Stoco WWTF Kern County, CA
Lehigh Southwest Cement Company, Permanente Facili LEHIGH PERMANENTE CEMENT‐WWTP & R 24001 STEVENS CREEK Boulevard, Cupertino, CA 95014
Leland Meadow Water District Leland Meadow WWTP 33887 Leland Road, Strawberry, CA 95375
Lemoore City Lemoore WWTF VINE, Lemoore, CA 93245
Leprino Foods Company Tracy WWTP 3900 Holly Drive, Tracy, CA 95376
Lewis Carroll School Assn Lewis Carroll School 9841 Texas Hill Road, Oregon House, CA 95962
Lewiston Park Mutual Water Co Lewiston Park Water Company, POTW Old Lewiston Rd at Viola Lane, Lewiston, CA 96052
Lewiston Valley Water Company Inc Lewiston Community Services District POT W4831 B Trinity Dam Boulevard, Lewiston, CA 96052
Lincoln City Lincoln City WWTF 1245 Fiddyment Road, Lincoln, CA 95648
Linda Cnty Water District Linda Cnty Water District WWTP 909 Myrna Avenue, Marysville, CA 95901
Linden Cnty Water District LINDEN CO WATER DIST WWTF 18243 HWY 26, Linden, CA 95236
Lindsay City Lindsay WWTF 23611 Road 196, Lindsay, CA 93247
Live Oak City Live Oak City WWTP 3450 Treatment Road, Live Oak, CA 95953
Livingston City Livingston Domestic WWTF 7160 North Gallo Road, Livingston, CA 95334
Lockeford CSD Lockeford CSD WWTP 17725 North Tully Road, Lockeford, CA 95237
Lodi City White Slough Water Pollution Control Facil 12751 North Thornton Road, Lodi, CA 95242
Loleta CSD Loleta WWTF 2656 Eel River Drive, Loleta, CA 95551
Lompoc City LOMPOC REGIONAL WWTP West 1801 Central Avenue, Lompoc, CA 93436
Los Banos City Los Banos WWTF OLD SANTE FE GRADE, Los Banos, CA 93635
Los Brez's Park Mutual Water Windflower Point STP 9597 Windflower Point, Clearlake, CA 95422
Loyalton City City of Loyalton and Grandi Ranch WWTF 403 Poole Lane, Loyalton, CA 96118
Lucasfilm Ltd/Skywalker Ranch SKYWALKER RANCH WW SYSTEMS 5858 LUCAS VALLEY, Nicasio, CA 94946
MARIN CO OFFICE OF EDUCATION WALKER CREEK RANCH WWTP 1700 MARSHALL‐PETALUMA, Petaluma, CA 94952
MARIN COUNTY EHS (Marshall WWTP) Marshall Community WWWTP (Phase1) Barinaga Ranch, Marshall, CA
MARIN COUNTY Sanitary District #5 MARIN CSD 5 ‐ TIBURON WWTP MAR WEST ST & PARADISE DRIVE, Tiburon, CA 94920
MARIN COUNTY Sanitary District #5 MARIN CSD 5 PARADISE COVE WWTP PARADISE DRIVE, Tiburon, CA 94920
MARIPOSA PUD Mariposa WWTP 4956 MILLER, Mariposa, CA 95338
MARKLEEVILLE PUD MARKLEEVILLE WSTWTR TRTMNT SYS Markleeville, CA 96120
MARTINEZ SHELL REFINING CO SHELL MARTINEZ REFINERY WWTP MARINA VISTA AVENUE, Martinez, CA 94553
143
MATA AMRITANANDAMAYI CENTER MATA AMRITANANDAMAYI WW System 10200 CROW CANYON, Castro Valley, CA 94552
MELLENIUM PACIFIC ASSET Hi‐Ho Lodge & MHP 11901 Sierra, Kernville, CA 93238
MERCED CO CORR FACILITY Sandy Mush WWTF SANDY MUSH, Merced County, CA
MERCED ID BARRET COVE 9014 VILLAGE, Snelling, CA 95369
MERCED ID McSwain Rec Area WWTF 9014 VILLAGE, Snelling, CA 95369
MERCED ID McClure Pt Rec Area 9014 VILLAGE, Snelling, CA 95369
MERCED ID HORSESHOE BEND REC AREA 9014 VILLAGE, Snelling, CA 95369
MERCED ID New Don Pedro WW Facilities Moccasin Point, Jamestown, CA 95327
MHC NAC Inc Naco West Waste Disposal 41776 Yuba Gap, Emigrant Gap, CA 95715
MHC NAC Inc Yosemite Lakes Campground 31191 HARDIN FLAT Road, Groveland, CA 95321
MICHAEL HAMILTON RIVERSIDE RV RIVERSIDE R.V. PARK WWTP 576 MONTEREY, San Jose, CA 95038
MINTER FIELD AIRPORT DISTRICT Shafter Airport WWTF 201 Aviation Street, Shafter, CA 93263
MISSION HILLS CSD MISSION HILLS LA PURISIMA WWTP 1500 East Burton Mesa Boulevard, Lompoc, CA 93436
MONTEREY CSA ‐ CHUALAR MONTEREY CSA ‐ CHUALAR WWTP CHUALAR RIVER ROAD, (2 MI W), Chualar, CA 93925
MONTEREY REGIONAL WPCA MRWPCA REG TRTMT & OUTFALL SYS PO BOX 1790, Marina, CA 93933
MONTEREY REGIONAL WPCA Monterey Regional Reclamation (Producer) CA
MOORES RESORT MOORES RESORT WASTEWATER PONDS 6 CUTTINGS WHARF, Napa, CA 94558
MORRO BAY SD MORRO BAY/CAYUCOS WWTP 160 ATASCADERO RD, Morro Bay, CA 93442
MT. VIEW SANITARY DISTRICT MT. VIEW SANITARY DISTRICT WWTP END OF ARTHUR ROAD, Martinez, CA 94553
MYERS, DON SHADY LAKES MHP 5665 South CHESTNUT Avenue, Fresno, CA 93725
Madera City Madera WWTF AVE 13 & RD 21 1/2, Madera, CA 93637
Madera Cnty Eng & Gen Services Madera Cnty #19‐Parkwood WWTF RD 27 & AVE 12, Madera, CA 93637
Madera Cnty Eng & Gen Services Madera Cnty #37‐La Vina WWTF AVE 9, Madera, CA 93637
Madera Cnty Eng & Gen Services Madera Cnty #2‐Bass Lake WWTF Bass Lake, CA 93604
Madera Cnty Eng & Gen Services Madera Cnty #7‐Marina View Heights WW CO RD 274, Bass Lake, CA 93604
Madera Cnty Eng & Gen Services Madera Cnty #8A‐North Fork WWTF North Fork, CA 93643
Madera Cnty Eng & Gen Services Madera Cnty #14‐Chukchanse WWTF AVE 19 1/2 at RD 28 1/2 NE, Madera, CA 93637
Madera Cnty Eng & Gen Services Madera Cnty #6‐Lake Shore Park WWTF CO RD 274, Bass Lake, CA 93604
Madera Cnty Eng & Gen Services Madera Cnty #22A‐Oakhurst WWTF HWY 41 / OAKHURST, Oakhurst, CA 93644
Madera Cnty Eng & Gen Services Madera Cnty #24 Teaford Meadow Lakes WBass Lake, CA 93604
Madera Cnty Eng & Gen Services Madera Cnty #27‐Goldside Estates WWTF BEECHWOOD, Madera County, CA
Madera Cnty Eng & Gen Services Madera Cnty #28 Ripperdan WWTF NR RIPPERDAN ON MADERA, Ripperdan, CA
Madison Service District Madison WWTF 9 Hwy 16 & Co Rd 89, Madison, CA 95653
Maharishi Global Admin Law Hoberg?s Club Resort 15205 Hwy 175, Cobb, CA 95426
Majistee Corporation Yosemite Pine RV Park 20450 OLD HWY 120, Groveland, CA 95321
Malaga CWD Malaga CWD WWTF 3749 MAPLE, Fresno, CA 93725
Manila CSD Manila CSD WWTP Foot of Lupin Street, Manila, CA 95521
Manteca City Manteca WW Quality Control Facility 2450 West Yosemite Avenue, Manteca, CA 95337
Maricopa City Maricopa Wastewater Disposal Facility SECT 7,T11N,R23W,SBM, Maricopa, CA
Mariposa Cnty DPW COULTERVILLE WWTF 10113 Old Highway 49, Coulterville, CA 95338
Mariposa Cnty DPW DON PEDRO SEWER ZONE 1 RANCHITO, Mariposa County, CA
Mariposa Cnty DPW Yosemite West MD WWTF INDIAN CREEK, Wawona, CA 95389
Mariposa Cnty DPW Mariposa Pines WWTF Mariposa, CA 95338
Markham Vineyards CWMS WWTP (CULINARY INST OF AMERIC 2812 MAIN Street, St. Helena, CA 94574
Marysville City Marysville WWTP Marysville, CA
Maxwell PUD Maxwell PUD WWTF Intersection of East Ave and South Ave, Maxwell, CA 95955
Maxwell PUD Maxwell PUD 3755 Hwy 99, Maxwell, CA 95955
Mayacama Golf Club LLC Mayacama Golf Club LLC 525 Mayacama Club Drive, Santa Rosa, CA 95403
McClory Properties EL DORADO MHP WWTF 9630 HWY 41, Lemoore, CA 93245
McCloud Community Services District McCloud WWTF Squaw Valley Road, Mccloud, CA 96057
McClure Boat Club, Inc MCCLURE LAKE BOAT CLUB TRAILER PARK 9885 BOAT CLUB, Snelling, CA 95369
McFarland City McFarland WWTF MELCHER & ELMO, Mcfarland, CA 93250
McKinleyville CSD McKinleyville WWTP 675 Hiller Road, Mckinleyville, CA 95521
Mendocino City CSD Mendocino City CSD 10500 KELLY, Mendocino, CA 95460
Mendocino Cnty WWD #2 Anchor Bay Mendocino Cnty WWD#2‐Anchor Bay 35501 Highway 1 UNIT #4, Gualala, CA 95445
Mendota City Mendota WWTF BASS, Mendota, CA 93640
Merced City Merced WWTF 10260 GOVE Road, Merced, CA 95340
Merced Cnty Housing Authority Merced & Los Banos Family Centers MERCED & LOS BANOS, Merced County, CA
Millbrae City MILLBRAE WWTP 400 East Millbrae Avenue, Millbrae, CA 94030
Miranda CSD Miranda POTW Avenue of the Giants, Miranda, CA 95553
Modesto City Modesto Water Quality Control Facility (pri 1221 Sutter Avenue, Modesto, CA 95351
Mokelumne Hill SD Mokelumne Hill WWTF 8970 Old Toll Road, Mokelumne Hill, CA 95245
Monarch Grove Reclamation H2O MONARCH GROVE RECLAMATION 1945 Solano Street, Los Osos, CA 93402
Montague City Montague STP 1030 13th Street, Montague, CA 96064
Montair Subdivision Homeowners Assoc. Montair Subdivision, STP Montague Road, Montague, CA 96064
Montecito Sanitary District Montecito SD WWTP 1042 Monte Cristo Lane, Santa Barbara, CA 93108
Monterey Cnty Parks Dept NORTHSHORE PLEYTO WWTP 2610 SAN ANTONIO, Bradley, CA 93426
Monterey Dunes Colony MONTEREY DUNES COLONY WWTP 195 MONTEREY DUNES WY, Castroville, CA 95012
Morris J. Harwood Harwood Products Branscomb Mill 14210 Branscomb Road, Branscomb, CA 95417
Morro Bay City MORRO BAY TEMP EMERGENCY DESAL 176 ATASCADERO RD, Morro Bay, CA 93442
Mountain House CSD Mountain House WWTP 17103 West Bethany Road, Mountain House, CA 95391
144
Mt Shasta City Mount Shasta WWTP 2500 Grant Road, Mount Shasta, CA 96067
Murphys SD Murphys WWTF 735 Six Mile Road, Murphys, CA 95247
Mustards Grill Mustards Grill Wastewater System 7399 St Helena Highway, Yountville, CA 94558
NACO WEST/SNOWFLOWER, INC. Naco West Waste Disposal 41776 Yuba Gap, Emigrant Gap, CA 95715
NAPA SANITATION DISTRICT NAPA SD WWTP (Soscol Water Recycling F 1515 Soscol Ferry Road Road, Napa, CA 94558
NAPA VALLEY COUNTRY CLUB NAPA VALLEY CNTRY CLB WW PONDS 3385 HAGEN, Napa, CA 94558
NEW AUBERRY WATER ASSOCIATION New Auberry WWTF 44657 WILSON, Auberry, CA 93602
NIPOMO CSD NIPOMO CSD BLACK LAKE ‐ RECLAIMED WA1526 WILLOW, Nipomo, CA 93444
NIPOMO CSD Nipomo CSD Southland Treatment Facility 509 Southland Street, Nipomo, CA 93444
NOVATO DAYS INN (NOVATO MOTEL) NOVATO DAYS INN (NOVATO MOTEL) ‐ WA 8141 REDWOOD Boulevard, Novato, CA 94947
Napa Valley Marina NAPA VALLEY MARINA SEWAGE PONDS 1200 MILTON, Napa, CA 94559
Nevada CSD No 1 Cascade Shores WWTP 14326 Gas Canyon Road, Nevada City, CA 95959
Nevada CSD No 1 Higgins Village WWTF 10019 Combie Road, Auburn, CA 95602
Nevada CSD No 1 Lake of the Pines WWTP 10903 Riata Way, Auburn, CA 95602
Nevada CSD No 1 Lake Wildwood WWTP 12622 Pleasant Valley Road, Penn Valley, CA 95946
Nevada CSD No 1 Penn Valley WWTP 12382 Spenceville, Penn Valley, CA 95946
Nevada CSD No 1 North San Juan WW Facility End of Rush St, North San Juan, CA
Nevada City Nevada City WWTP 650 Jordan, Nevada City, CA 95959
Nevada ID Rollins Reservoir Rec Areas Nevada (County), CA 95713
Nevada ID Scotts Flat Reservoir Rec Area 23333 Scotts Flat, Nevada City, CA 95959
New Age Church of Being Globe Hotel 101 Lincoln, Sierraville, CA 96126
New Don Pedro Recreation Agency New Don Pedro WW Facilities Moccasin Point, Jamestown, CA 95327
Newell CWD Newell CWD STP 405 Fifth Avenue, Tulelake, CA 96134
Newman City Newman City WWTF and Reclamation 2600 Hill Ferry Road, Newman, CA 95360
Nick's Cove and Cottages Nick's Cove & Cottages Highway 1, Tomales Bay, CA
North San Mateo County Sanitation District NORTH SAN MATEO COUNTY SANITATION 153 Lake Merced Boulevard, Daly City, CA 94015
North of River SD #1 North of River WWTF 28970 7th Standard Road, Shafter, CA 93264
Northern California Conference of Seven Day Adventist Leoni Meadows Retreat 6100 Leoni Road, Grizzley Flats, CA 95636
Novato Sanitary District NOVATO AND IGNACIO WWTP 500 Davidson Street, Novato, CA 94945
OCAT, INC TACO BELL ‐ GOLDEN STATE BLVD 6735 GOLDEN STATE, Fresno, CA 93722
OLEMA R.V. RESORT OLEMA RV RESORT‐WASTEWATER SYSTEM 10155 HIGHWAY 1, Olema, CA 94950
Oakdale City Oakdale WWTF 9700 Liberini, Oakdale, CA 95361
Oakwood Lake Water District Oakwood Lake WWTP 874 East Woodward Avenue, Manteca, CA 95337
Oakwood Lake Water District/Beck Properties Inc Oakwood Lake WWTP 874 East Woodward Avenue, Manteca, CA 95337
Occidental CSD Occidental CSD 14445 Occidental Road, Occidental, CA 95465
Olivehurst PUD Olivehurst WWTP 3908 Mary Avenue, Olivehurst, CA 95961
On The T Capital, LLC/Paradise With Purpose Mayacamas Ranch 3975 Mountain Home Ranch Road, Calistoga, CA 94515
Orange Cove City ORANGE COVE WWTF PARLIER & MONSON, Orange Cove, CA 93646
Organizations Under Region 2 Watershed Permit Region 2 Watershed Hg and PCB PermitteesCA
Orland City Orland WWTP First Street, Orland, CA
Oro Loma Sanitary District ORO LOMA/CASTRO VALLEY SD WPCP 2600 GRANT Avenue, San Lorenzo, CA 94580
PENINSULA PACKAGING RUSH CREEK OWTS 1030 North ANDERSON Road, Exeter, CA 93221
PEREIRA, PETE DON PEDRO HOUSEBOATS/MINI MART 5021 LA GRANGE, La Grange, CA 95329
PETALUMA CITY PETALUMA ELLIS CREEK WATER RECYCLING 3890 Cypress Drive Street, Petaluma, CA 94954
PLANADA CSD Planada WWTF 8597 West TOEWS, Planada, CA 95365
PLOW AND TILL FARMING D WWTF 24941 LASSEN, Five Points, CA 93624
POPLAR CSD Poplar WWTF PO BOX 3849, Poplar, CA 93257
PORT SONOMA MARINA PORT SONOMA MARINA SEWAGE SYSTEM 270 SEARS POINT RD., Petaluma, CA 94952
Pacific Gas & Electric Company Auberry HELMS HOUSING & SUPPORT FACILITY 33755 OLD MILL, Auberry, CA 93602
Pacific Gas & Electric Company Shaver Lake HELMS HOUSING & SUPPORT FACILITY 33755 OLD MILL, Auberry, CA 93602
Pacific Gas & Electric Company Shaver Lake PG&E HELMS PLANT 67250 HELMS CIRCLE, Shaver Lake, CA 93664
Pacifica City CALERA CREEK WATER RECYCLING PLANT Pacifica, CA
Pacificus Real Estate Group Silvertip Resort WWTF HWY 41, Fish Camp, CA
Pajaro Valley Water Management Agency Pajaro Valley WMA and City of Watsonville 401 Panabaker Lane, Watsonville, CA 95077
Palo Alto City PALO ALTO REGIONAL WQCP 2501 EMBARCADERO Way, Palo Alto, CA 94303
Parlier City Parlier WWTF BETHEL, Parlier, CA 93646
Paso Robles City PASO ROBLES WWTP 3400 SULPHUR SPRINGS RD, Paso Robles, CA 93446
Patterson City Patterson WWTF 14901 Poplar Avenue, Patterson, CA 95363
Peppermint Creek MHP Peppermint Creek MHP WWTF 10155 PEPPERMINT, Jamestown, CA 95327
Pete Pereira Co., LLC DON PEDRO HOUSEBOATS/MINI MART 5021 LA GRANGE, La Grange, CA 95329
Pilot Corporation Pilot Travel Center 168 WWTF 30035 County Rd 8, Dunnigan, CA 95937
Pilot Travel Centers LLC FLYING J TRAVEL PLAZA‐KERN 17047 ZACHARY, Bakersfield, CA 93308
Pinecrest Permit Assoc & US Forest Service Pinecrest WWTP FOREST SERVICE RD 4N11, Pinecrest, CA 95364
Pinole City City of PINOLE WWTP FOOT OF TENNENT AVENUE, Pinole, CA 94564
Pismo Beach City PISMO BEACH WWTP 550 FRADY LN, Pismo Beach, CA 93449
Pixley PUD Pixley WWTF ADJ TO HARMON FIELD, Pixley, CA 93256
Pla‐Vada Community Association Pla‐Vada Community Assoc STP Sewer Plant Rd at Conifer, Soda Springs, CA 95728
Placer Cnty Dept of Facility Services Placer Cnty SMD No 1 WWTP 11755 Joeger Road, Auburn, CA 95602
Placer Cnty Dept of Facility Services Placer Cnty SMD No 3 4928 Auburn Folsom Road, Loomis, CA 95650
Placer Cnty Dept of Facility Services Placer Cnty SA No 28, ZONE No.6, Sheridan E Street, Sheridan, CA 95486
Placer Union High School District Foresthill High School Auburn, CA

145
Placerville City Hangtown Creek WRF 2300 Coolwater Creek Road, Placerville, CA 95667
Pleasant Rdg. Union Scho. Dist. Pleasant Ridge Elementary School 22580 Kingston Rd, Grass Valley, CA 95949
Plumas Eureka CSD Plumas Eureka Estates WWTF 200 Lundy Lane, Blairsden, CA 96103
Plymouth City Plymouth WWTP 7784&7151 Old Sacramento Road, Plymouth, CA 95669
Point Arena City Point Arena Wastewater Treatment Plant Iverson Road Plant, Point Arena, CA 95468
Porterville City Porterville WWTF 555 PROSPECT, Porterville, CA 93257
Portola City Portola WWTP 120 Main Street, Portola, CA 96122
Princeton Water Works Dist Princeton WWTP Spencer, Princeton, CA
Protestant Episcopal Bishop of San Joaquin DIOCESE OF SAN JOAQUIN, ECCO 43803 STATE HWY 41, Oakhurst, CA 93644
Quincy Community Services District Leonhardt Ranch Reclamation Ganser Airport Road, Quincy, CA 95971
Quincy Community Services District Quincy WWTP & Collection System 900 Spanish Creek Road, Quincy, CA 95971
R‐Ranch at the Lake R‐Ranch Campground WWTF 3 Mi NW Hwy 128 & Hwy 121, Napa County, CA
RANCHO COLINA MH ESTATES STP RANCHO COLINA MH ESTATES STP 1045 ATASCADERO RD, Morro Bay, CA 93442
REGULAR BAPTIST CAMP INC REGULAR BAPTIST CAMP QUINCY‐LAPORTE RD, La Porte, CA
REYNOLDS RESORTS‐YOSEMITE SOUTH, LLC Yosemite South Coarsegold Ranch 34094 Highway 41, Coarsegold, CA 93613
RHODIA INC. Rhodia Martinez Facility 100 MOCOCO, Martinez, CA 94553
RHODIA, INC Rhodia Martinez Facility 100 MOCOCO, Martinez, CA 94553
RICHGROVE CSD Richgrove WWTF ALONG SOUTHERN PACIFIC RR, Richgrove, CA 93261
RIVER ISLAND EAST HOA River Island East WWTF 31989 RIVER ISLAND, Porterville, CA 93257
RIVERBEND MHP LLC Sandy Point & River Bend MHPs 17604 EAST KINGS CANYON Road, Sanger, CA 93657
RODEO SANITARY DISTRICT RODEO Sanitary District WWTP 800 SAN PABLO Avenue, Rodeo, CA 94572
RUSH CREEK MEADOW & DOUGLAS FAMILY TRUST RUSH CREEK OWTS 1030 North ANDERSON Road, Exeter, CA 93221
Ralph Houannisian Sequoia Dawn Farm Labor Center 35800 HWY 190, Springville, CA 93265
Rancho Cielo Youth Campus Rancho Cielo Youth Campus 710 Old Stage Road, Salinas, CA 93912
Rancho Murieta CSD Rancho Murieta CSD WWT & Rec 15160 Jackson, Rancho Murieta, CA 95683
Rawhide Investment Co Inc Rawhide Mobile Home Park WWTF 8400 OLD MELONES, Jamestown, CA 95327
Red Bluff City Red Bluff WW Reclamation Plant 700 Messer Drive, Red Bluff, CA 96080
Redding City Clear Creek WWTP 2220 Metz Road, Anderson, CA 96007
Redding City Stillwater WWTP Reclamation 6475 AIRPORT RD, Anderson, CA 96007
Redding City Stillwater WWTF 6475 Airport Road, Anderson, CA 96007
Redway CSD Redway POTW 153 Empire, Redway, CA 95568
Redwood Park CSD Redwood Park STP Redwood Park, CA 95548
Reedley City Reedley WWTF 1701 West Huntsman, Reedley, CA 93654
Regents of the University of California ‐ UC Davis UC Davis, Bodega Marine Lab (WDR) Westshore Road, Bodega Bay, CA 94923
Richardson Springs CSD Richardson Springs CSD 15850 Richardson Springs Road, Richardson Springs, CA 959
Richmond City RICHMOND WPCP 601 CANAL, Richmond, CA 94804
Richvale SD Richvale STP Eucalyptus Road, Richvale, CA 95974
Rio Alto WD Lake California WWTP 22099 River View Drive, Cottonwood, CA 96022
Rio Dell City Rio Dell City WWTF 475 Hilltop, Rio Dell, CA 95562
Rio Vista City Rio Vista Beach WWTF 1000 Beach, Rio Vista, CA 94571
Rio Vista City Northwest WWTF 3000 Airport Road, Rio Vista, CA 94571
Ripon City Ripon Industrial & Domestic TP 1220 Vera, Ripon, CA 95366
Rite of Passage Sierra Ridge WWTP Fricot City Rd, Off Hwy 49, San Andreas, CA 95249
River City Recovery Center Inc River City WWTF 12490 Alta Mesa, Galt, CA 95632
River Highlands CSD Hammonton Gold Village WWTP 8204 Platinum Circle, Smartsville, CA 95977
River Pines PUD River Pines WWTP CA
Riverdale PUD Riverdale WWTF PO BOX 248, Riverdale, CA 93656
Riviera West Mutual Water Company Riviera West WTP 8560 Soda Bay Road, Kelseyville, CA 95451
Roseville City Dry Creek WWTP 1800 Booth Road, Roseville, CA 95747
Roseville City Pleasant Grove WWTP 5051 Phillips Road, Roseville, CA 95747
SAN ARDO WATER DISTRICT SAN ARDO STP CATTLEMEN RD, San Ardo, CA 93450
SAN FRANCISCO AIRPORT COMMISSION SF Arprt Mel Leong TP‐Industrl 676 McDonnell Road, San Francisco, CA 94128
SAN FRANCISCO AIRPORT COMMISSION SF ARPRT MEL LEONG TP‐SANITARY WASTE 676 McDonnell Road, San Francisco, CA 94128
SAN FRANCISCO, CITY & CO, PUBLIC UTILITIES COMMIS SF ‐ OCEANSIDE WPCP 3500 Great Highway, San Francisco, CA 94132
SAN FRANCISCO, CITY & CO, PUBLIC UTILITIES COMMIS SSF‐SE WPCP, N‐Point & Bayside 750 PHELPS, San Francisco, CA 94124
SAN LEANDRO CITY SAN LEANDRO WPCP 3000 DAVIS Street, San Leandro, CA 94577
SAN LORENZO VALLEY USD SAN LORENZO VALLEY HS 7015 HWY 9, Felton, CA 95018
SAN LORENZO VALLEY WD Bear Creek Estates WWF BEAR CREEK RD, Boulder Creek, CA 95006
SAN LUIS OBISPO CSA #07 OAK SHORES LAKE NACIMIENTO SOUTH END OF RIDGE RD, Paso Robles, CA 93446
SAN LUIS RV RESORT Los Banos West I‐5 KOA 28485 Gonzaga, Santa Nella, CA 95322
SAN MIGUEL CSD SAN MIGUEL SD WWTP NORTH EXTENSION OF N ST, San Miguel, CA 93451
SAN MIGUELITO MUTUAL WATER CO San Miguelito Wild Cherry Canyon WILD CHERRY CANYON, Avila Beach, CA 93424
SAN SIMEON CSD SAN SIMEON WWTP 9245 BALBOA, San Simeon, CA 93452
SANTA BARBARA CITY PWD EL ESTERO RECLAMATION FACILITY 402 EAST MASON ST, Santa Barbara, CA 93101
SANTA BARBARA CITY PWD EL ESTERO WWTP NPDES 520 East Yanonali Street, Santa Barbara, CA 93103
SANTA CLARA, County of MARIPOSA LODGE‐Wastewtr System 9500 MALECH, San Jose, CA
SEENO DUCK CLUB SEENO DUCK CLUB Wastewatr Pond JACKSNIPE RD., Suisun Marsh, CA
SELMA‐KINGSBURG‐FOWLER CSD SKF CSD WWTF 11301 CONEJO, Kingsburg, CA 93631
SEQ LAKE CONF OF YMCA/VIS YMCA YMCA CAMP TULEQUOIA Miramonte, CA 93641
SEWER AUTHORITY MID‐COASTSIDE SAM WWTP (Sewer Authority Mid‐Coastsi d1000 North Cabrillo Highway, Half Moon Bay, CA 94019
SEWERAGE AGENCY OF SOUTHERN MARIN SASM WWTP 450 Sycamore Avenue, Mill Valley, CA
146
SHERWOOD MHP Sherwood MHP WWTF 339 FRANKWOOD, Sanger, CA 93657
SIERRA JOINT UNION HIGH SC Sierra High School WWTF 33326 LODGE, Tollhouse, CA 93677
SIERRA SHADOWS MHP Sierra Shadows WWTF 1269 LINDMORE, Lindsay, CA 93247
SIERRA SUMMIT, INC Sierra Summit Ski Area WWTF HWY 168, Huntington Lake, CA 93629
SIERRA UNIFIED SCHOOL DISTRICT Foothill Middle School WWTF AUBERRY, Prather, CA
SINOR, WILLIAM & WENDY Yosemite South Coarsegold Ranch 34094 Highway 41, Coarsegold, CA 93613
SMITH, MYRON QUAIL VALLEY REC PARK PO BOX 33, Calif Hot Springs, CA 93207
SNELLING CSD Snelling WWTF Merced County, CA
SOUTH BAYSIDE SYSTEM AUTHORITY SBSA WWTP 1400 Radio Road, Redwood City, CA 94065
SOUTH COUNTY REG WW AUTHORITY SCRWA RECLAIMING WW FACILITY LUCHESSA AVE, Gilroy, CA 95020
SOUTH COUNTY REG WW AUTHORITY SCRWA WWTP 900 SOUTHSIDE DR, Gilroy, CA 95020
SOUTH SAN LUIS OBISPO CO SD South San Luis Obispo SD WWTP 1600 Aloha Place, Oceano, CA 93445
SPEEDWAY SONOMA LLC SPEEDWAY SONOMA Sewage Ponds HIGHWAYS 37 & 121, Sonoma, CA 95476
SPIRIT ROCK MEDITATION CENTER SPIRIT ROCK Mdtn Cntr WW Systm 5000 SIR FRANCIS DRAKE Boulevard, Woodacre, CA 94973
ST FRANCIS YACHT CLUB Tinsley Island WWTF San Joaquin County, CA
ST. HELENA CITY ST. HELENA CITY WWTP 1 THOMANN Lane, St. Helena, CA 94574
ST. HELENA HOSP & HEALTH CTR ST HELENA HOSPITAL WWTP 650 SANITARIUM, Deer Park, CA 94576
STINEHART, RICHARD WILDWOOD MHP 8701 HWY 41, #70, Fresno, CA 93720
STONYBROOK CORPORATION Stonybrook WWTF Keene, CA 93531
STRASBAUGH INC Strasbaugh Recycled Wastewater Waiver 825 Buckley Road, San Luis Obispo, CA 93401
STRATHMORE PUD Strathmore WWTF CR HWY 65 & AVE 196, Strathmore, CA 93267
SUMMERLAND SD SUMMERLAND WWTP 2435 Wallace Avenue, Summerland, CA 93067
SUNNYVALE CITY SUNNYVALE WPCP 1444 BORREGAS Avenue, Sunnyvale, CA 94088
SUNOL VALLEY GOLF & RECREA CO SUNOL VALLEY GOLF COURSE WWTP ANDRADE RD & I 680, Sunol, CA 94586
SYSCO Food Services of Sacramento SYSCO Food Services of Sacramento 7062 Pacific Avenue, Pleasant Grove, CA 95688
Sacramento City Sac City Combined WW Collection/TRT Sys 1395 35th Avenue, Sacramento, CA 95822
Sacramento City EA Fairbairn WTP 7501 College Town Drive, Sacramento, CA 95826
Sacramento City Sacramento River WTP 1 Water Street, Sacramento, CA 95814
Sacramento Cnty Airport System Sacramento INTL Airport WWTP 6900 Airport Boulevard, Sacramento, CA 95837
Sacramento Cnty DPW‐Elk Grove Boys Ranch WWTF Scott, Sloughhouse, CA 95683
Sacramento MUD Rancho Seco Nuclear Generating Station W 14440 Twin Cities Road, Herald, CA 95638
Sacramento MUD Rancho Seco Recreational Area WWTF 14440 Twin Cities Road, Herald, CA 95638
Sacramento Regional CSD Sacramento Regional WWTP 8521 Laguna Station Road, Elk Grove, CA 95758
Saddle Creek Golf Course LP Copper Cove WWRF 5130 Kiva Place, Copperopolis, CA 95228
Salida Sanitary District Salida WWTP Salida, CA
Salinas City SALINAS INDUSTRIAL WWTP DAVIS RD AT RIVER CROSSING, Salinas, CA 93901
Samoa Pacific LLC Samoa Town Site 3 North Bay View Road, Samoa, CA 95564
San Andreas SD San Andreas WWTP 675 Gold Oak Road, San Andreas, CA 95249
San Francisco City LOG CABIN RANCH Wastwtr System 500 Log Cabin Ranch Road, La Honda, CA 94020
San Francisco City & County New Don Pedro WW Facilities Moccasin Point, Jamestown, CA 95327
San Francisco City & County O'Shaughnessy WWTP Moccasin, CA 95347
San Francisco International Airport SF Arprt Mel Leong TP‐Industrl 676 McDonnell Road, San Francisco, CA 94128
San Francisco International Airport SF ARPRT MEL LEONG TP‐SANITARY WASTE 676 McDonnell Road, San Francisco, CA 94128
San Jerardo Inc. SAN JERARDO WWTP 1401 OLD STAGE RD, Salinas, CA 93908
San Joaquin City San Joaquin WWTF PO BOX 758, San Joaquin, CA 93660
San Joaquin Cnty CSA 15 ‐ STP Waterloo & Hwy 99, Stockton, CA
San Joaquin Cnty Linne Estates WWTF 7701 Bates, San Joaquin, CA
San Joaquin Cnty Apricot Acres WWTF, CSA 44, Zone E San Joaquin County, CA
San Joaquin Cnty Housing Authority Migrant Housing, Harney Ln 14320 Harney Lane, Lodi, CA 95240
San Joaquin Cnty Housing Authority Thornton Farm Labor Camp 26188 Manor, Thornton, CA 95686
San Jose City San Jose City Family Camp HWY 120, Groveland, CA 95321
San Jose City SAN JOSE/SANTA CLARA WPCP 700 LOS ESTEROS Road, San Jose, CA 95134
San Lucas County Water District SAN LUCAS WWTF HIGHWAY 198 & FREEMAN FLAT RD., San Lucas, CA 93954
San Luis Obispo City SAN LUIS OBISPO WWTP 35 Prado Road, San Luis Obispo, CA 93401
San Luis Obispo City SAN LUIS OBISPO WATER RECLAMATION F 35 PRADO, San Luis Obispo, CA 94524
San Luis Water District FOX HILLS WWTF SEC 36, T10S, R9E, MDB&M, Los Banos, CA
San Luis Water District San Luis Hills WWTF GONZANGA RD & SAN LUIS DR, Santa Nella, CA
San Mateo City SAN MATEO WWTP 2050 DETROIT Drive, San Mateo, CA 94404
San Mateo County GLENWOOD BOYS RANCH WW System 400 Log Cabin Ranch Road, La Honda, CA 94020
San Mateo County SAN MATEO CO HONOR CAMP WWTP La Honda, CA 94020
San Mateo County Department of Parks SAN MATEO MEMORIAL PARK WWTP 9500 PESCADERO ROAD, Loma Mar, CA 94021
Sanger City Sanger WWTF 333 NORTH, Sanger, CA 93657
Santa Barbara Cnty Parks Dept JALAMA BEACH COUNTY PARK WWTP STAR RTE, Lompoc, CA 93436
Santa Cruz City SANTA CRUZ WWTP null
Santa Maria City SANTA MARIA WWTP 2065 East Main Street, Santa Maria, CA 93454
Santa Nella CWD Santa Nella WWTF Merced County, CA
Santa Rosa City Dept of Public Works Santa Rosa Subregional Water Reclamation 4300 Llano Road, Santa Rosa, CA 95407
Sausalito‐Marin City San Dist SAUSALITO MARIN CITY STP 1 Fort Baker, Sausalito, CA 94965
Scotts Valley City Scotts Valley WWTP 700 Lundy Lane, Scotts Valley, CA 95066
Scotts Valley City SCOTTS VALLEY WWTF PRODUCER 700 LUNDY LN, Scotts Valley, CA 95066
Sewerage Commission Oroville Region Oroville WWTP 2880 South 5th Avenue, Oroville, CA 95965

147
Shasta CSA #17 Cottonwood WWTP 3425 Live Oak, Cottonwood, CA 96022
Shasta CSA 8 Palo Cedro WWTF Charolais Way, Palo Cedro, CA 96073
Shasta Lake City Shasta Lake WWTF 3700 Tibbits Road, Shasta Lake, CA 96019
Sierra Cnty Service Area 5 Zone 5A 980 West Sierra Brooks Sierra Valley, Sierra County, CA
Sierra Health Foundation Grizzly Creek Ranch WWTF Grizzly RD & HWY 70, Portola, CA 96122
Sierra Moon HOA Sierra Moon HA WWTF Chico, CA
Sierra Moon LLC Sierra Moon HA WWTF Chico, CA
Singh, Lexander Lebec Holiday Inn Express Wainright Court, Lebec, CA 93243
Smith, Andy Golden Hills MH & RV Park 10625 PINEY CREEK Road, Coulterville, CA 95311
Solano & Colusa Counties C.Y.A Fouts Springs Youth Facility Fouts Springs, Stonyford, CA 95979
Soledad City Soledad Sewage Treatment Plant 248 MAIN, Soledad, CA 93960
Solvang City Solvang WWTP WEST OF ALISAL RD, Solvang, CA 93463
Sommerville I‐5 Partnership I‐5 & Jayne Avenue Facility I‐5 & JAYNE AVE, Fresno County, CA
Sonoma Cnty Water Agency (SCWA) R1 SCWA Airport WRF (Airport‐Larkfield‐Wikiu Skylane Boulevard, Santa Rosa, CA 95403
Sonoma Cnty Water Agency (SCWA) R1 Occidental CSD 14445 Occidental Road, Occidental, CA 95465
Sonoma Cnty Water Agency (SCWA) R1 SCWA Oceanic Properties Sea Ranch Centra Highway 1 at Whitesurf Rd, The Sea Ranch, CA 95445
Sonoma Cnty Water Agency (SCWA) R1 SCWA Graton CSD Ross, Graton, CA 95444
Sonoma Cnty Water Agency (SCWA) R1 SCWA Geyserville CSD Geyserville, Geyserville, CA 95441
Sonoma Cnty Water Agency (SCWA) R1 SCWA Russian River CSD 18400 Neely Road, Guerneville, CA 95446
Sonoma Cnty Water Agency (SCWA) R1 SONOMA VALLEY COUNTY SD WWTP 22675 8 th Street, Sonoma, CA 95476
Sonoma Valley County Sanitation District SONOMA VALLEY COUNTY SD WWTP 22675 8 th Street, Sonoma, CA 95476
Sonora Cascade Properties I, LP Cascade MHP WWTF 18330 Wards Ferry Road, Sonora, CA 95370
South San Francisco City South San Francisco‐San Bruno WQCP 195 BELLE AIR Road, South San Francisco, CA 94080
South Sutter Water District Camp Far West Res South Side 9300 McCourtney, Lincoln, CA 95692
South Tahoe PUD STPUD WASTEWATER TRTMENT PLANT 1275 MEADOW CREST DR, South Lake Tahoe, CA 96150
Southern California Edison‐ Rosemead BIG CREEK POWERHOUSE NO 1 WWTF Big Creek, CA 93605
Southern Estates LLC Sandy Point & River Bend MHPs 17604 EAST KINGS CANYON Road, Sanger, CA 93657
Spanish Flat Water District Spanish Flat WWT & Disposal Facility 4340 Spanish Flat Loop Road, Napa, CA 94558
Spanish Flat Water District/Monticello Public Cemetery Spanish Flat WWT & Disposal Facility 4340 Spanish Flat Loop Road, Napa, CA 94558
Springville PUD Springville WWTF 3514 TULE RIVER, Springville, CA 93265
Stallion Springs CMSD Stallion Springs WWTF 28500 Stallion Springs, Tehachapi, CA 93561
Stanislaus Cnty Dept of Parks & Rec Modesto Reservoir WWTP 18143 Reservoir, Waterford, CA
Stanislaus Cnty Dept of Parks & Rec Woodward Reserior Reg Park 14528 26 Mile, Oakdale, CA
Stanislaus Cnty Office of Education Foothill Horizons School 21925 LYONS BALD MOUNTAIN Road, Sonora, CA 95370
Stephen J Schuster Pheasant Landing III HA WWTP Garner Road, Chico, CA 95973
Stephen J Schuster Sierra Moon HA WWTF Chico, CA
Stockton City Silver Lake Family Camp Hwy 88, Amador County, CA
Stockton City Stockton Regional WW Control Facility 2500 Navy Drive, Stockton, CA 95206
Stoco Mutual Water and Sewer Company Stoco WWTF Kern County, CA
Stratford PUD Stratford WWTF P.O. BOX 85, Stratford, CA 93266
Sugar Pine HOA Sugar Pine OWTS 47557 ROAD 630, Oakhurst, CA 93644
Super Store Industries Super Store Industries Stockton Stockton, CA
Susanville Consol SD SUSANVILLE CSD Susanville, CA
Sutter Cnty DPW Rio Ramaza WW Disposal Ponds Sutter County, CA
Sutter Cnty DPW Robbins WWTF Riggins, Robbins, CA
Sutter Creek City Sutter Creek WWTP 18 Main, Sutter Creek, CA 95685
TEJON GRAPEVINE TEJON HEADQUARTERS WWTF R‐5, 33 S OF BAKERSFIELD, Kern County, CA
TEJON RANCH COMPANY Tejon Ranch ‐ Grapevine GRAPEVINE INTERCHANGE ON I‐5, Kern County, CA
TEMPLETON CSD MEADOWBROOK WWF P.O. BOX 780, Templeton, CA 93465
TERRA BELLA SEWER MD Terra Bella WWTF Terra Bella, CA 93270
TIMELESS INVESTMENT DBA E‐Z TRIP E‐Z GOLDEN STATE TRUCK STOP 6725 GOLDEN STATE, Fresno, CA 93711
TIPTON CSD Tipton WWTF 1 M N OF POPLAR AV, W OF HY 99, Tipton, CA 93272
TRANQUILITY PUD Tranquility WWTF Fresno County, CA
TULARE CO BLD SERV & PRKS DEPT Sequoia Field WWTF 36000 RD 112, Visalia, CA 93291
TWIN CREEKS HOMEOWNERS ASSOCIATION SOLANO TWIN CREEKS WW SYSTEM 39 TWIN CREEKS Drive, Suisun City, CA 94585
Taft City Taft WWTF AIRPORT, Taft, CA 93268
Taft City Taft Federal Prison WWTF 1510 CADET, Taft, CA 93268
Tahoe Truckee Sanitation Agency TAHOE TRUCKEE SANITATION AGEN 13720 JOERGER DR, Truckee, CA 96161
Tehachapi City Tehachapi WWTF 750 ENTERPRISE WAY, Tehachapi, CA 93561
Tehama Co SD #1 Mineral WWTP 37735 Hwy 36E, Mineral, CA 96063
Tejon Castac Water District Tejon Industrial Complex West WWTF I‐5 AT WHEELER RIDGE, Lebec, CA 93243
Tejon Castac Water District Tejon Industrial Complex East WWTF Near Wheeler Ridge road and 1st Street, Lebec, CA 93243
Tejon Ranchcorp Tejon Industrial Complex West WWTF I‐5 AT WHEELER RIDGE, Lebec, CA 93243
Tejon Ranchcorp Tejon Industrial Complex East WWTF Near Wheeler Ridge road and 1st Street, Lebec, CA 93243
Tennant CSD Tennant CSD ST/LF 13515 Tennant, Macdoel, CA 96058
The City of San Juan Bautista SAN JUAN BAUTISTA WWTP NORTH END OF THIRD ST, San Juan Bautista, CA 95054
The Ranch Sewer Maint Dist Clay Station 1200 Res Dev Clay Station Rd, East of Tavernor, Sacramento, CA
The Villas At Butte Creek HA The Villas at Butte Creek WWTP 549 Mission Santa Fe Circle, Chico, CA 95926
Thousand Trails, Inc Naco West Yosemite Lakes Campground 31191 HARDIN FLAT Road, Groveland, CA 95321
Tomales Village CSD TOMALES VILLAGE WWTP IRVIN ROAD, Tomales, CA 94948
Tower Park Marina & Village Tower Park Marina/Village WWTF 14900 Hwy 12, Lodi, CA 95242

148
Town of Discovery Bay CSD Discovery Bay WWTP Ship Channel Rd, North of Highway 4 and West of Old River,
Tracy City Tracy WWTP 3900 Holly Drive, Tracy, CA 95376
Travel Centers of America Truckstops Corp of America 5800 WHEELER RIDGE, Arvin, CA 93203
Tres Pinos WD TRES PINOS WWTP 8511 SOUTHSIDE RD, Tres Pinos, CA 95075
Trinity Cnty Waterworks District Trinity Cnty Waterworks District #1 Hayfork T31N, R11W, MDB&M, Hayfork, CA 96041
Tulare City Tulare WWTF 1875 South West Street, Tulare, CA 93274
Tulare Cnty Office of Education SCICON WWTF 39250 Bear Creek Road, Springville, CA 93265
Tulare Cnty Resource Mgmt Agency DELFT COLONY WWTF S26 T165 R23E, MDB&M, Delft Colony, CA
Tulare Cnty Resource Mgmt Agency Tooleville WWTF Tooleville, CA
Tulare Cnty Resource Mgmt Agency Traver WWTF S15T17SR32E, MDB&M, Traver, CA
Tulelake City Tulelake City WWTP Tulelake, CA 96134
Tuolumne City SD Tuolumne STP 18050 BOX FACTORY, Tuolumne, CA 95379
Tuolumne Utilities District MI‐WUK VILLAGE WW SYSTEM 2 Green, Sonora, CA 95370
Tuolumne Utilities District Sonora Regional WWTP 1400 South Gate Drive, Sonora, CA 95379
Tuolumne Utilities District TWAIN HARTE WWTP Twain Harte, CA
Tuolumne Utilities District Sonora Regional WWTF 1400 SOUTHGATE, Sonora, CA 95370
Turlock City Turlock WWTP 901 South Walnut Road, Turlock, CA 95380
Turlock ID New Don Pedro WW Facilities Moccasin Point, Jamestown, CA 95327
U.A. Local 38 Trust Fund Konocti 8727 Soda Bay, Kelseyville, CA 95451
UC Davis UC Davis Main WWTP 1140 Old Davis Road Avenue, Davis, CA 95616
UC Half Moon Bay ELKUS YOUTH RANCH WW System 1500 PURISIMA CREEK, Half Moon Bay, CA 94019
UNION SANITARY DISTRICT Raymond A. Boege Alvarado WWTP (Union 5072 Benson Road, Union City, CA 94587
US Air Force Mather AFB Domestic WWTF (SAC CO SD 1) 10503 Armstrong, Mather, CA 95655
US Army Corps of Engineers Lake Kaweah LAKE KAWEAH/TERMINUS DAM 34443 Sierra, Lemon Cove, CA 93244
US Army Corps of Engineers Porterville Success Reservoir Campground Success Lake, Porterville, CA 93258
US Army Corps of Engineers Raymond HENSLEY LAKE 25207 RD 407/PO BOX 85, Raymond, CA 93653
US Army Corps of Engineers Sacramento EASTMAN LAKE ADMIN AREA 32175 Road 29, Raymond, CA 93653
US Army Corps of Engineers Sacramento EASTMAN LAKE CHOWCHILLA REC 32175 ROAD 29, Raymond, CA 93653
US Army Corps of Engineers Sacramento EASTMAN LAKE CORDONIZ REC 32175 ROAD 29, Raymond, CA 93653
US Army Corps of Engineers Smartville Englebright Lake WWTF 12896 Englebright Dam, Smartville, CA 95977
US Army Corps of Engineers Valley Springs New Hogan Lake WWTP 2713 Hogan Dam, Valley Springs, CA 95252
US Army Garrison Fort Hunter Liggett FT. HUNTER LIGGETT WWTP JOLON ROAD, King City, CA 93930
US Army Sierra Army Depot SIERRA ARMY DEPOT SEW TRT PLN SIERRA ARMY DEPOT, Herlong, CA
US Coast Guard TRACEN USDOT Coast Guard TRACEN ‐ Tomales 599 Tomales Road, Petaluma, CA 94952
US DEPT OF VETERANS AFFAIRS (PAHCS) V.A. MED CENTER, LIVERMORE‐WWTP 4951 ARROYO, Livermore, CA 94550
US Department of Interior Glory Hole Recreation Area Whittle Rd & Hwy 49, Angels Camp, CA 95222
US Dept of Defense, Defense Logistics Agency DDJC, Sharpe ‐ WWTP, Stormwater Roth, Lathrop, CA
US Dept of Defense, Defense Logistics Agency DDJC, Tracy ‐ WWTP, Stormwater 25600 Chrisman, Tracy, CA 95296
US Marine Corps Coleville USMC‐MWTC WWTC PO BOX 5001, Bridgeport, CA 93517
US Navy Naval Air Station Lemoore LEMOORE NAS WWTF HWY 198, Lemoore, CA 93246
US Navy Naval Air Station Lemoore Naval Radio Transmitting Fac 7200 Radio Station, Dixon, CA 95620
US Navy Treasure Island TREASURE ISLAND WWTP/DOD 1220 Avenue M, San Francisco, CA 94130
USA PETROLEUM CORP Station #3088, Dunnigan 29770 County Rd #8, Dunnigan, CA 95937
USDA Forest Service Six Rivers National Forest Eureka USFS Orleans Ranger Station STP Highway 96, Orleans, CA 95556
USDI Bureau of Land Management Bakersfield Maricopa Wastewater Disposal Facility SECT 7,T11N,R23W,SBM, Maricopa, CA
USDI Bureau of Reclamation Napa Admin Center & Oak Shores Area CA
USDI Bureau of Reclamation Sacramento Gianelli (San Luis) Pump‐Generate Plant W 31770 HWY 152, Santa Nella, CA 95322
USDI Bureau of Reclamation Sacramento Tuttletown Recreation Area 6850 Studhorse Flat, Sonora, CA 95370
USDI National Park Service Devils Postpile USDI NPD Devils Postpile Facilities 351 Pacu Lane, Bishop, CA 93514
USDI National Park Service Sequoia & Kings Canyon Ash Mountain WWTF ASH MOUNTAIN, Tulare (County), CA
USDI National Park Service Sequoia & Kings Canyon Upper Sherman Tree OWTS CA
USDI National Park Service Sequoia & Kings Canyon Grant Grove WWTF Three Rivers, CA 93271
USDI National Park Service Sequoia & Kings Canyon Clover Creek WWTF LODGEPOLE AREA, Tulare (County), CA
USDI National Park Service Sequoia & Kings Canyon Cedar Grove WWTF Three Rivers, CA 93271
USDI National Park Service Sequoia & Kings Canyon Buckeye WWTF BUCKEYE RESIDENTIAL AREA, Tulare (County), CA
USDI National Park Service Yosemite BADGER PASS WWTF BADGER, Yosemite Natl Park, CA 95389
USDI National Park Service Yosemite WAWONA WWTF PO BOX 2025, WAWONA STATION, Yosemite Natl Park, CA 9
USDI National Park Service Yosemite YOSEMITE INSTITUTE CRANE FLAT HWY 120 E OF CRANE FLAT, Yosemite Natl Park, CA 95389
USDI National Park Service Yosemite Glacier Point WWTF Glacier Point, Yosemite National Park, CA 95389
USDI National Park Service Yosemite El Portal WWTF 5083 FORESTA Road BLDG 750, El Portal, CA 95318
Ukiah City Ukiah City WWTP 300 Treatment Plant Road, Ukiah, CA 95482
United Auburn Indian Community Thunder Valley Casino WWTP 1200 Athens Avenue, Lincoln, CA 95648
VALLEJO SAN AND FLOOD CONT DIS VALLEJO SFCD WWTP 450 RYDER STREET, Vallejo, CA 94590
Vacaville City Easterly WWTP 6040 Vaca Station Road, Elmira, CA 95625
Vacaville City Gibson Canyon Creek WWTP 7050 Leasure Town Road, Vacaville, CA 95688
Valley Springs SD Valley Springs SD WWTF Hwy 12, E OF JNCT W/Hwy 26, Valley Springs, CA 95252
Vintners Inn Vintners Inn 4350 Barnes Road, Santa Rosa, CA 95403
Visalia City VISALIA WWTF 7579 AVE 288, Visalia, CA 93277
WEST COUNTY WASTEWATER DISTRICT WEST COUNTY WW DISTRICT WPCP 2377 GARDEN TRACT, Richmond, CA 94806
WINE COUNTRY INN CWMS WWTP (CULINARY INST OF AMERIC A2812 MAIN Street, St. Helena, CA 94574
WISH I AH CARE CENTER WISH I AH CARE CENTER WWTF 35680 WISH I AH, Auberry, CA 93602

149
WOODVILLE PUD Woodville WWTF 12 MI WEST OF PORTERVILLE, Woodville, CA 93257
WOODWARD BLUFFS, LLC Woodward Bluffs MHP WWTF 9360 BLACKSTONE, Fresno, CA 93720
Walker Ranch CSD Bailey Creek WWTF Walker Road, Lake Almanor, CA 96137
Wallace Community Service Dist Wallace Wastewater Treatment Facility Wallace, CA 95254
Wasco City Wasco WWTF 746 8th Street, Wasco, CA 93280
Water Dynamics Sequoia Dawn Farm Labor Center 35800 HWY 190, Springville, CA 93265
Waterford City Waterford WWTP 335 South Western Avenue, Waterford, CA
Watsonville City WATSONVILLE WWTP 401 Panabaker Lane, Watsonville, CA 95077
Weaverville Sanitary District Weaverville SD WWTP 630 Mountain View Street, Weaverville, CA 96093
Weed Dept of Public Works Weed Shastina WWTP Highway 97, Weed, CA 96094
Weed Dept of Public Works Weed WWTP Highway 97, Weed, CA 96094
Weimar Institute Weimar Institute WWTP 20601 Paoli, Weimar, CA 95736
Weott CSD Weott WWTP School Rd and Newton Rd, Weott, CA 95571
West County Agency RICHMOND WPCP 601 CANAL, Richmond, CA 94804
West County Agency WEST COUNTY WW DISTRICT WPCP 2377 GARDEN TRACT, Richmond, CA 94806
Westley Community Serv. Dist. Westley Comm Sewage Trt Fac Westley, CA
Westport CWD Westport CWD Westport, Westport, CA 95488
Westwood CSD Westwood STP First & Fir Street, Westwood, CA 96137
Wheatland City City of Wheatland WWTP Malone, Wheatland, CA 95692
Whitehawk Ranch Mutual Water Company Whitehawk Ranch WWTP 100 Miners Passage, Clio, CA 96106
Wild Wings Co Service Area Wild Wings Water Recycling Facility State Hwy 16 & County Rd 94B, Woodland, CA 95695
Williams City Williams WWTP 700 B Street, Williams, CA 95987
Willits City Willits City WWTP 300 North Lenore Street, Willits, CA 95490
Willows City Willows Wastewater Treatment Plant 1600 South Tehama, Willows, CA 95988
Windsor Water District Windsor Town WWTP 8400 Windsor Road, Windsor, CA 95492
Winters City Winters WWTF 501 County Rd 32A, Winters, CA
Woodbridge Sanitary District Woodbridge SD‐Sewage Treatment 19720 Benedict, Woodbridge, CA 95258
Woodlake City WOODLAKE WWTF 811 South Valencia Boulevard, Woodlake, CA 93286
Woodland City Woodland Water Pollution Control Facility 42929 County Road 24, Woodland, CA 95776
YOSEMITE LAKES PARK, INC Yosemite Lakes Clubhouse Facility 30250 YOSEMITE SPRINGS, Coarsegold, CA 93614
YOSEMITE MOTELS GP CEDAR LODGE WWTF 9966 HWY 140, El Portal, CA
YOSEMITE/MARIPOSA KOA Yosemite‐Mariposa KOA WWTF 6323 HWY 140, Midpines, CA 95345
YOUNG LIFE CAMPAIGN Woodleaf Camp STP 11359 La Porte, Challenge, CA 95925
Yolo Cnty Housing Authority Davis Migrant Center WWTF Rd 36 & Rd 105, Davis, CA 95616
Yolo Cnty Housing Authority Dixon Migrant Center WWTF 7290 Radio Station, Dixon, CA 95620
Yosemite Vista Estates Yosemite Vista Estates 22625 FERRETTI, Groveland, CA 95321
Yountville, Town of YOUNTVILLE / CA VETS HOME WWTP 7501 SOLANO Avenue, Yountville, CA 94599
Yreka City Yreka City WWTP 856 North Main Street, Yreka, CA 96897
Yuba City Yuba City WTP 701 Northgate, Yuba City, CA 95991
Yuba City Yuba City WWTF 302 Burns Drive, Yuba City, CA 95991
Yuba Cnty Hammonton Gold Village WWTP 8204 Platinum Circle, Smartsville, CA 95977
Yuba Cnty Motorplex LLC Yuba Cnty Motorplex WWTF 2793 Forty Mile, Marysville, CA 95901
150
APPENDIX C GRID SYNCHRONIZATION, PI CONTROL AND THE DQ TRANSFORMATION
The utilization of inverters for the interconnection of distributed generation
to the grid requires application of controls systems capable of regulating the active and reactive output currents, ensuring high power quality levels and achieving relative immunity to grid perturbations. Power converters are being increasingly utilized in distributed generation applications for the interconnection to the grid be it a PV array or other primary energy source. These converters are typically one or three phase voltage source inverters, depending on the size of the source, and connected to the grid via a filter which in principle acts as a low-pass impedance attenuating the high frequency switching harmonics of the inverter [141].
Proper integration of medium or large PV systems in the grid may require
additional functionality from the inverter, such as reactive power control. Furthermore, the increase of average PV system size may lead to new strategies like eliminating the DC-DC converter that is usually placed between the PV array and the inverter, and moving the MPPT to the inverter, resulting in increased simplicity, overall efficiency and cost reduction. Reference [142] discusses fuzzy MPPT control of an inverter, eliminating the need for the DC-DC converter.
Current control is an important issue in power electronic circuits,
particularly in dc to ac inverters where the objective is to produce a sinusoidal ac output whose magnitude and frequency can both be controlled. This Appendix discusses how the current control of three-phase pulse width modulated voltage source inverter (PWM-VSI) has been implemented in the rotating d,q reference frame.
Three major classes of regulators have been developed over the last few
decades: hysteresis regulators, linear PI regulators and predictive dead-beat regulators [115]. Although high performance control strategies have been proposed, they still exhibit coupling problems (not allowing the independent control of the active and reactive power). The synchronous frame controller (dq reference frame) used in ac machines has also become the standard solution for current control of PWM rectifiers. Current control of PWM-VSI has been implemented in the rotating d,q reference frame because the synchronous frame controller can eliminate steady state error and has fast transient response by decoupling control. The synchronous frame controller requires transforming the measured stationary frame ac current to rotating frame dc components, and transforming the result of control back to the stationary frame for implementation [115].
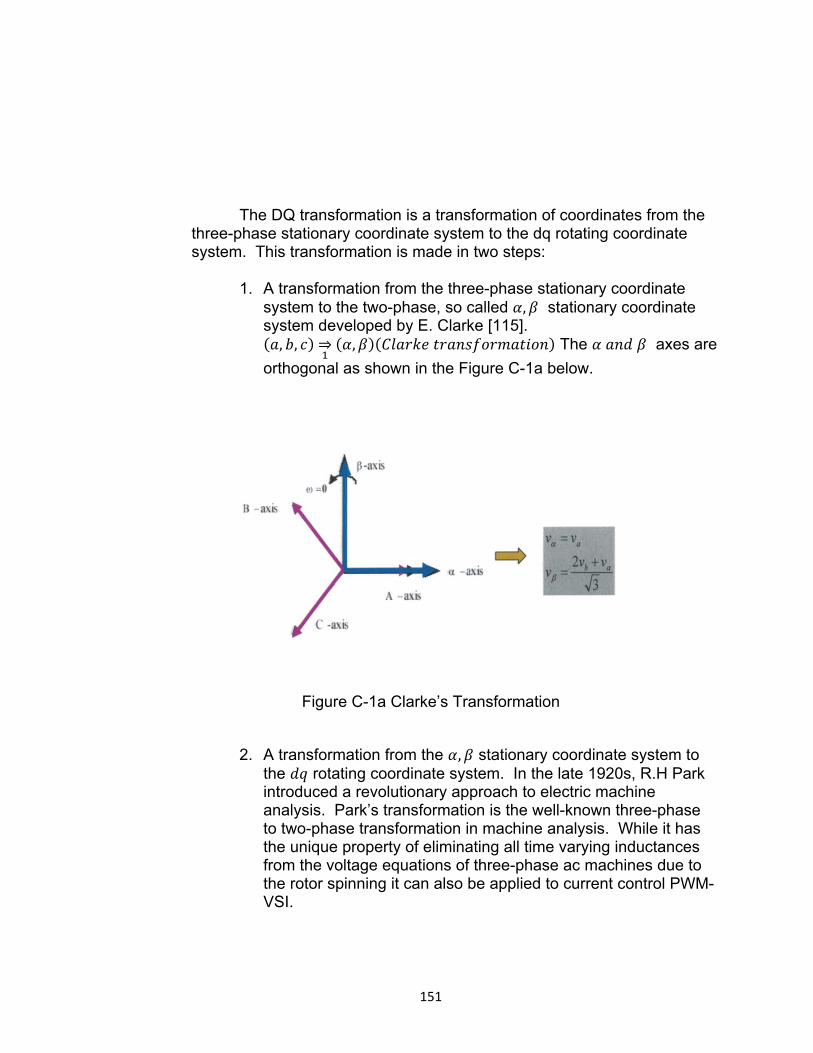
151
The DQ transformation is a transformation of coordinates from the
three-phase stationary coordinate system to the dq rotating coordinate system. This transformation is made in two steps:
1. A transformation from the three-phase stationary coordinate
system to the two-phase, so called , stationary coordinate system developed by E. Clarke [115]. , , ⇒ , The axes are
orthogonal as shown in the Figure C-1a below.
Figure C-1a Clarke’s Transformation
2. A transformation from the , stationary coordinate system to
the rotating coordinate system. In the late 1920s, R.H Park introduced a revolutionary approach to electric machine analysis. Park’s transformation is the well-known three-phase to two-phase transformation in machine analysis. While it has the unique property of eliminating all time varying inductances from the voltage equations of three-phase ac machines due to the rotor spinning it can also be applied to current control PWM-VSI.
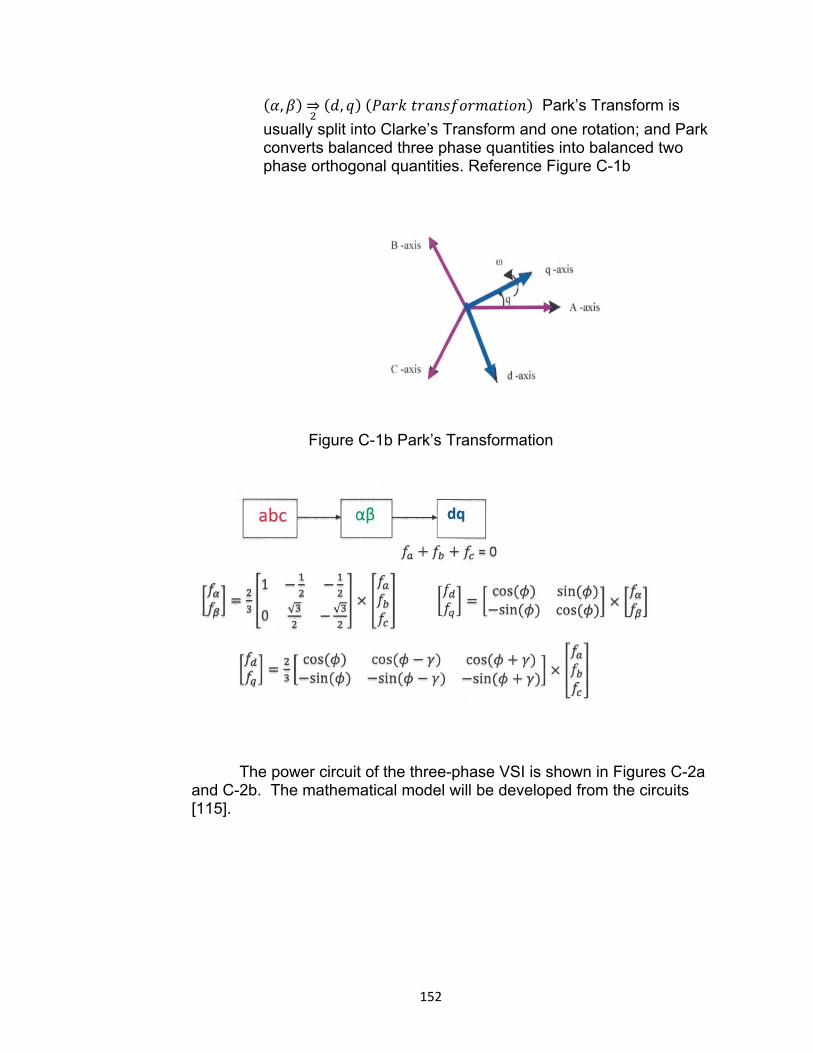
152
, ⇒ , Park’s Transform is
usually split into Clarke’s Transform and one rotation; and Park converts balanced three phase quantities into balanced two phase orthogonal quantities. Reference Figure C-1b
Figure C-1b Park’s Transformation
The power circuit of the three-phase VSI is shown in Figures C-2a and C-2b. The mathematical model will be developed from the circuits [115].
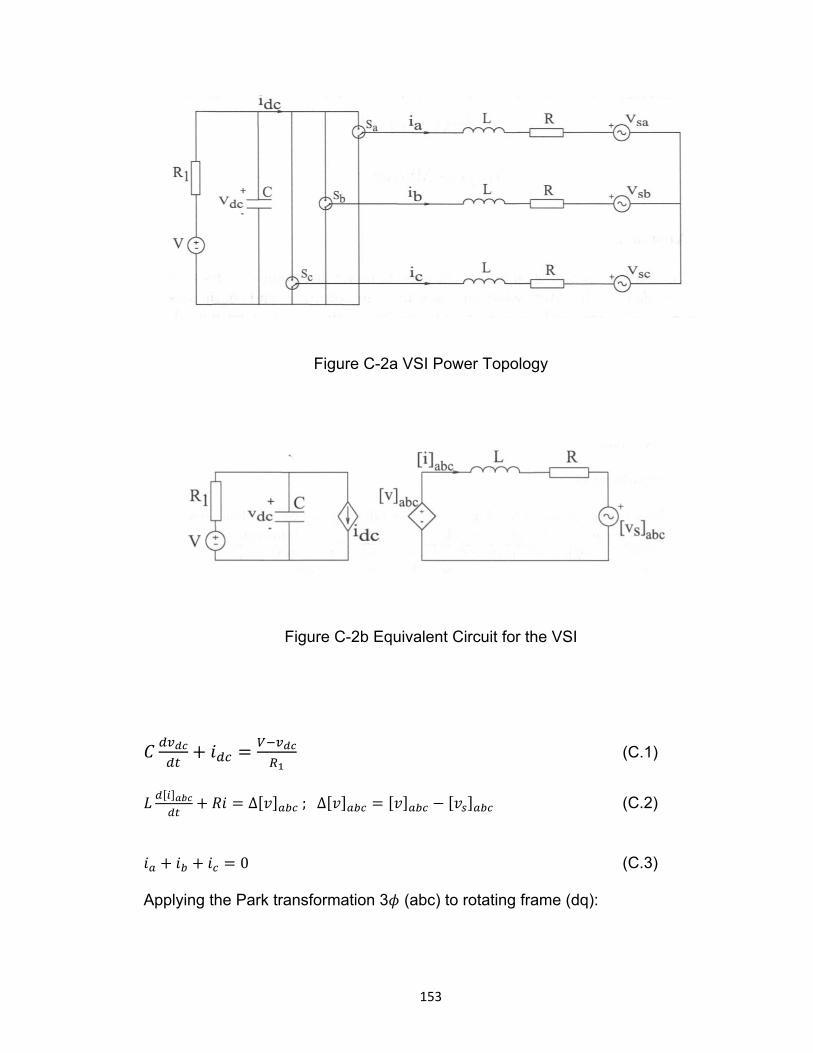
153
Figure C-2a VSI Power Topology
Figure C-2b Equivalent Circuit for the VSI
(C.1)
∆ ;∆ (C.2)
0 (C.3) Applying the Park transformation 3 (abc) to rotating frame (dq):

154
120° 120°120° 120° (C.4)
to the current yields:
120° 120° (C.5)
120° 120° (C.6)
And similarly to the voltage ∆
∆ ∆ ∆ 120° ∆ 120° (C.7)
∆ ∆ ∆ 120° ∆ 120° (C.8)
Differentiating equation (C.5) yields:
23
120° 120°
120° 120° (C.9)
From equation (C.2)
1∆
∆ (C.10)
1∆
Using equations (C.5), (C.6), (C.7) and (C.10); equation (C.9) can be rewritten as:
∆ (C.11) Similarly, if we apply the derivative to equation (C.6)
∆ (C.12)
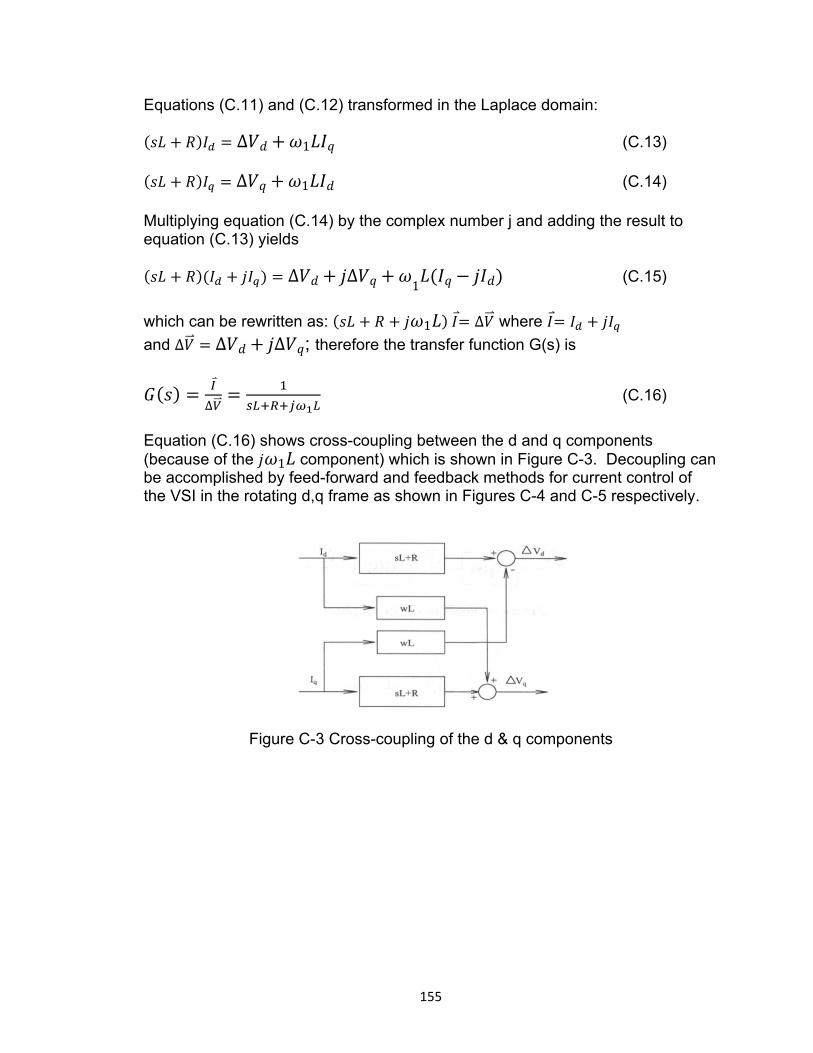
155
Equations (C.11) and (C.12) transformed in the Laplace domain:
∆ 1 (C.13)
∆ 1 (C.14) Multiplying equation (C.14) by the complex number j and adding the result to equation (C.13) yields
∆ ∆1
(C.15)
which can be rewritten as: 1 ∆ where
and ∆ ∆ ∆ ; therefore the transfer function G(s) is
∆ (C.16)
Equation (C.16) shows cross-coupling between the d and q components (because of the 1 component) which is shown in Figure C-3. Decoupling can be accomplished by feed-forward and feedback methods for current control of the VSI in the rotating d,q frame as shown in Figures C-4 and C-5 respectively.
Figure C-3 Cross-coupling of the d & q components

156
Figure C-4a Current control of VSI feed-forward decoupling method
Figure C-4b Feed-forward decoupling block
Figure C-5a Current Control of VSI Feedback decoupling method
Figure C-5b Feedback decoupling block

157
APPENDIX D PWM TECHNIQUES
Multilevel voltage-fed inverters (MLI) with space vector pulse width
modulation (SVM) have established their importance in high power high performance industrial drive applications [137,138].There are basically three PWM schemes for controlling multilevel inverters: 1- carrier based sinusoidal PWM (SPWM) 2- space vector PWM (SVM) and 3- selective harmonics elimination PWM (SHE-PWM) [132]. The two most popular control strategies for multilevel inverter topologies are Carrier and Space Vector modulation [138]. In SPWM, a sinusoidal reference voltage waveform is compared with a triangular carrier waveform to generate gate
signals for the switches of the inverter. The SVM strategy has been used in three-level inverters. The SVM and SHE-PWM methods are fundamental frequency switching methods and perform one or two commutations of the power semiconductors during one cycle of the output voltages to generate a staircase waveform [136].
The most common MLI topologies can be classified into three
types: 1- diode clamped 2- flying capacitor and 3- cascade H bridge. The recent applications of these devices include: motor drives, active rectifiers, filters, interface to renewable energy sources, flexible AC transmission systems (FACTS) and static compensators. Among the three types of multilevel inverters, the cascade inverter has the least components for a given number of levels [136].
Carrier based modulation techniques control each phase leg of the
inverter separately and allow the line to line voltage to be developed implicitly. In contrast SVM identifies each switching state of an inverter as a point in complex , space (Clarke) as discussed in Appendix C. The reference phasor rotating in the , plane at the fundamental frequency is sampled within each switching period, and the nearest three inverter switched states are selected with duty cycles calculated to achieve the same voltage second average as the sampled reference phasor. The roots of vectorial representation of three-phase systems are presented in the research contributions of Park [134]. Park’s Transform is usually split into Clarke’s transform plus one rotation as discussed in Appendix C.
To help better understand space vector modulation consider the
three-leg voltage source inverter (VSI) shown in Figure D-1 [133].
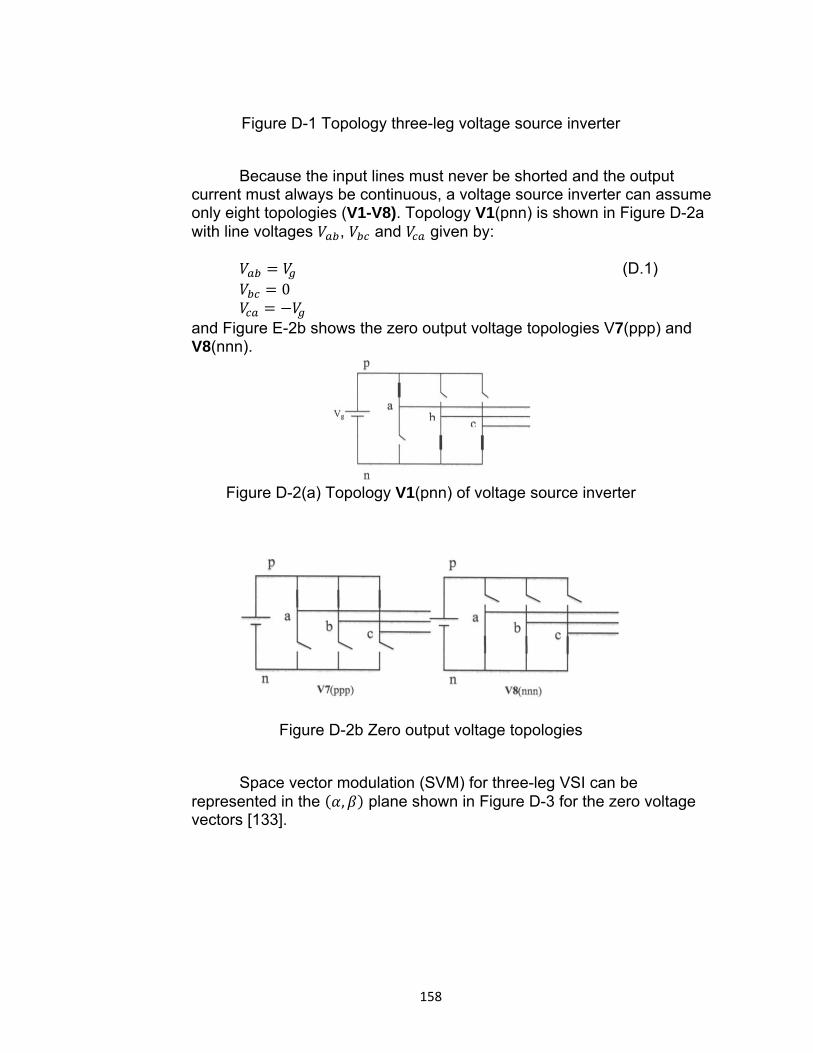
158
Figure D-1 Topology three-leg voltage source inverter
Because the input lines must never be shorted and the output
current must always be continuous, a voltage source inverter can assume only eight topologies (V1-V8). Topology V1(pnn) is shown in Figure D-2a with line voltages , and given by:
(D.1)
0
and Figure E-2b shows the zero output voltage topologies V7(ppp) and V8(nnn).
Figure D-2(a) Topology V1(pnn) of voltage source inverter
Figure D-2b Zero output voltage topologies
Space vector modulation (SVM) for three-leg VSI can be
represented in the , plane shown in Figure D-3 for the zero voltage vectors [133].

159
Figure D-3 zero voltage vectors in the , plane
The desired three phase voltages at the output of the inverter could be represented by an equivalent vector V rotating in the counter clock wise direction as shown in Figure D-4a. The magnitude of the vector is related to the magnitude of the output voltage shown in Figure D-4b and the time this vector takes to complete one revolution is the same as the fundamental time period of the output voltage.
Figure D-4a Output voltage vector in the , plane

160
Figure D-4b Output line voltages in the time domain
The line-line output voltage vector V shown in E-4b and in
expanded view in Figure D-5 can be synthesized by the pulse-width-modulation (PWM) of the two adjacent switching state vectors (SSV) V1(pnn) and V2(ppn), the duty cycle of each d1 and d2 respectively, and the zero vector (V7(nnn)/V8(ppp)) of duty cycle d0 [133]:
(D.2)
1 (D.3)
Where, 0 0.866, is the modulation index. This would correspond to
a maximum line-to-line voltage of 1.0
Figure D-5 Synthesis of required output voltage in sector 1
All SVM schemes and most of the other PWM algorithms use (2.2) and (2.4) for the output voltage synthesis. The modulation algorithms that use non-adjacent SSV’s have been shown to produce higher THD and/or switching losses and are not analyzed here, although some of them can be very simple to implement and can provide faster transient response. The duty cycles , , and are uniquely determined from Figure D-5 and (2.2) and (2.3). The only difference between PWM schemes that use adjacent
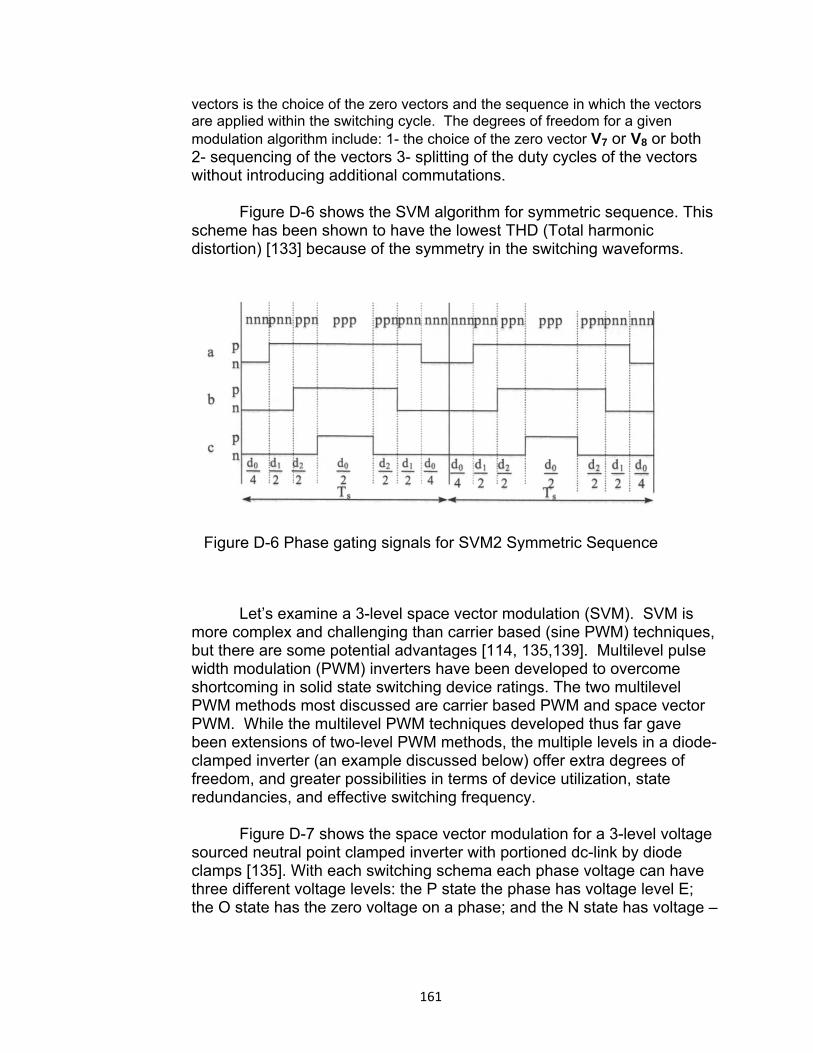
161
vectors is the choice of the zero vectors and the sequence in which the vectors are applied within the switching cycle. The degrees of freedom for a given modulation algorithm include: 1- the choice of the zero vector V7 or V8 or both 2- sequencing of the vectors 3- splitting of the duty cycles of the vectors without introducing additional commutations.
Figure D-6 shows the SVM algorithm for symmetric sequence. This
scheme has been shown to have the lowest THD (Total harmonic distortion) [133] because of the symmetry in the switching waveforms.
Figure D-6 Phase gating signals for SVM2 Symmetric Sequence
Let’s examine a 3-level space vector modulation (SVM). SVM is more complex and challenging than carrier based (sine PWM) techniques, but there are some potential advantages [114, 135,139]. Multilevel pulse width modulation (PWM) inverters have been developed to overcome shortcoming in solid state switching device ratings. The two multilevel PWM methods most discussed are carrier based PWM and space vector PWM. While the multilevel PWM techniques developed thus far gave been extensions of two-level PWM methods, the multiple levels in a diode-clamped inverter (an example discussed below) offer extra degrees of freedom, and greater possibilities in terms of device utilization, state redundancies, and effective switching frequency.
Figure D-7 shows the space vector modulation for a 3-level voltage
sourced neutral point clamped inverter with portioned dc-link by diode clamps [135]. With each switching schema each phase voltage can have three different voltage levels: the P state the phase has voltage level E; the O state has the zero voltage on a phase; and the N state has voltage –

162
E on a phase. Since each phase voltage has three levels, the line-to-line voltages has 5 different voltage levels, namely +2E, +E, 0, -E, -2E. The whole space is divided into 6 sections similar to that shown in Figure D-4a above, but each sector is divided into 4 regions for 3-level operation. Note that each position in the d,q space is represented by a voltage state for phases a, b, and c. For example Sector 1, Region II is enclosed with three space vectors 100(V1), 210(V7), and 221(V2) meaning ONN, PON and PPO. By applying (D.2) where the duty cycle is the defined time interval Ta ,Tb ,Tc, a reference space vector using the three vectors can be obtained.
, (D.4)
where is the switching period. Using the fixed space vectors and reference vector can be formed
at any instant, thus for every period the direct and quadrature components of the reference vector can be calculated as well as which sector and region the reference vector lies. As can be seen in the figure, there are 27 different switching states for the inverter.
Figure D-7 Space Vector Modulation Divisions and Positions
Equation (D.5) shows the calculations used for the dwell times of
Regions 1-4) for the three phase NPC circuit shown in Figure D-8 [135].

163
REGION I
2 sin (D.5)
1 2 sin3
sin
REGION II 1 2 sin
2 sin 1
1 2 sin3
REGION III
2 2 sin3
2 sin
2 sin3
1
REGION IV
2 sin 1
2 sin3
2 2 sin3
Where , the modulation index 0 1 used for creating
the reference with different magnitudes is given by: √3 ⁄ ; [135] (E.6)

164
Figure D-8 3 phase NPC Circuit
165
APPENDIX E SOLAR STORMS AND EFFECT ON THE GRID
Mankind is still learning about the nature of energy generation in the sun.
It is generally accepted that a hydrogen-to helium thermonuclear reaction is the source of the sun’s energy, yet it is unclear precisely what role the turbulent flows in the sun play, and how solar prominences and sunspots are created [3]. It is interesting that the same radiation that is converted to electricity and connected to electrical transmission and distribution systems can also destroy these grid system components and cause power outages due to severe solar storms [4][5].
The photos below in Figure 1.1 show permanent damage to the Salem New Jersey Nuclear Plant Generation Step Up Transformer caused by the 1989 solar geomagnetic storm (GMD).
According to scientists, solar coronal holes and coronal mass injections (CME) are the two categories of solar activity that drive solar disturbances on earth. Geomagnetic induced currents (GICs) that interact with the power system appear to be produced when large CME occur and are directed at earth perturbing the earth’s geomagnetic field, inducing voltage potential at the earth’s surface. Current is induced on transmission lines through voltage induction on the loop formed by grounded transmission lines and earth. On average, there are 200 days during the 11-year solar cycle with strong to severe geomagnetic storms and approximately four days of extreme conditions [159].
The two main risks resulting from the introduction of GICs to the bulk power system are damage typically associated with transformers and loss of reactive power support, which could lead to voltage instability and power system collapse [6].
This is an interesting solar energy topic that is receiving increasing attention by the U.S. Congress, Federal Energy Regulatory Commission (FERC) and the National Electrical Regulatory Corporation (NERC). On May 16, 2013 in Docket RM12-22, FERC issued Order No. 779. The EOP-010-1 (Geomagnetic Disturbance Operations) initial draft standard is in development to meet the directives of the FERC Order No. 779 [23].
The photos below in Figure E.1 show permanent damage to the Salem New Jersey Nuclear Plant Generation Step Up Transformer caused by the 1989 solar geomagnetic storm (GMD).
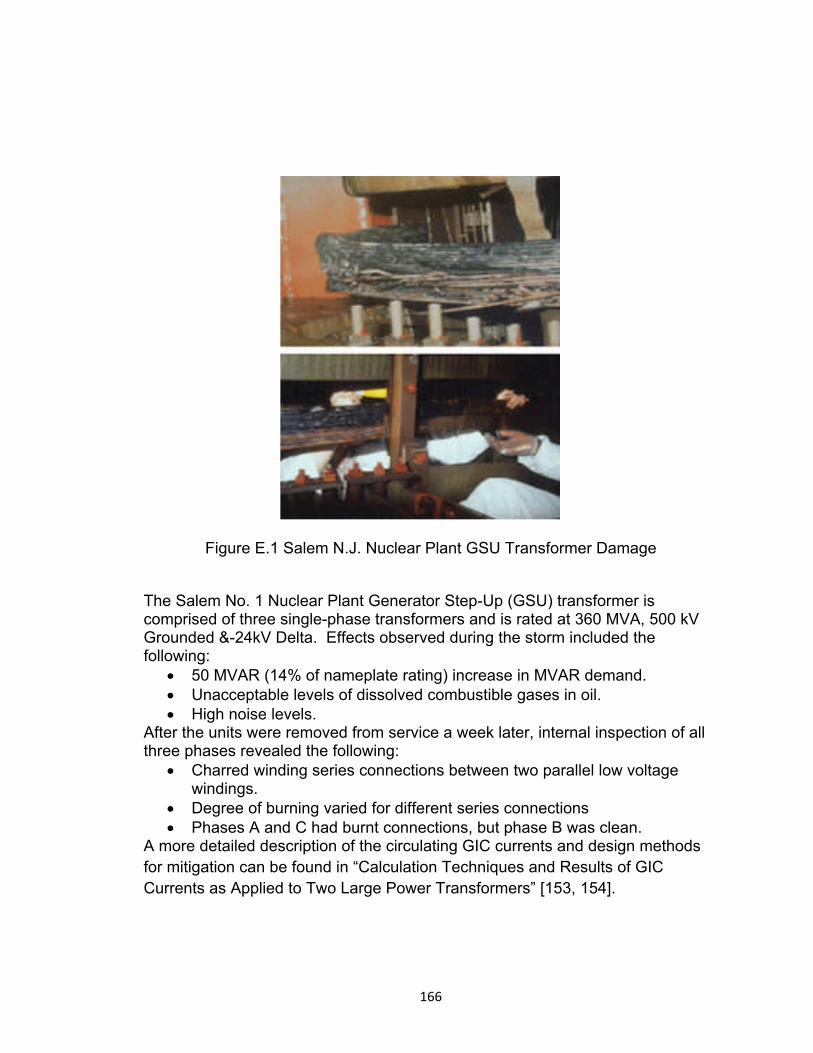
166
Figure E.1 Salem N.J. Nuclear Plant GSU Transformer Damage
The Salem No. 1 Nuclear Plant Generator Step-Up (GSU) transformer is comprised of three single-phase transformers and is rated at 360 MVA, 500 kV Grounded &-24kV Delta. Effects observed during the storm included the following:
50 MVAR (14% of nameplate rating) increase in MVAR demand. Unacceptable levels of dissolved combustible gases in oil. High noise levels.
After the units were removed from service a week later, internal inspection of all three phases revealed the following:
Charred winding series connections between two parallel low voltage windings.
Degree of burning varied for different series connections Phases A and C had burnt connections, but phase B was clean.
A more detailed description of the circulating GIC currents and design methods for mitigation can be found in “Calculation Techniques and Results of GIC Currents as Applied to Two Large Power Transformers” [153, 154].

167