Disruptive technologies, sustainable results H2 and full ...
25
H2 and full-year 2020 interim results presentation Preben Liltved, CEO Kristoffer Lundeland, CFO 18 February 2021 Disruptive technologies, sustainable results
Transcript of Disruptive technologies, sustainable results H2 and full ...
H2 and full-year 2020 interim results presentation
Preben Liltved, CEO Kristoffer Lundeland, CFO
18 February 2021
Disruptive technologies, sustainable results
By reading this company presentation (the “Presentation”), or attending any meeting or oral presentation held in relation thereto, you (the “Recipient”) agree to be bound by the following terms, conditions and limitations.
The Presentation has been produced by Nekkar ASA (the “Company”) for information purposes only and does not in itself constitute, and should not be construed as, an offer to sell or a solicitation of an offer to buy any securities of the Company in any jurisdiction. The distribution of this Presentation may be restricted by law in certain jurisdictions, and the Recipient should inform itself about, and observe, any such restriction. Any failure to comply with such restrictions may constitute a violation of the laws of any such jurisdiction.
The Recipient acknowledge that it will be solely responsible for its own assessment of the Company, the market and the market position of the Company and that it will conduct its own analysis and be solely responsible for forming its own view of the potential future performance of the Company’s business. The Company shall not have any liability whatsoever (in negligence or otherwise) arising directly or indirectly from the use of this Presentation or its contents, including but not limited to any liability for errors, inaccuracies, omissions or misleading statements in this Presentation, or violation of distribution restrictions.
An investment in the Company involves significant risk, and several factors could adversely affect the business, legal or financial position of the Company or the value of its securities. For a description of relevant risk factors we refer to the Company’s annual report for 2019, available on the Company’s website www.nekkar.com. Should one or more of these or other risks and uncertainties materialize, actual results may vary significantly from those described in this Presentation. An investment in the Company is suitable only for investors who understand the risk factors associated with this type of investment and who can afford a loss of all or part of their investment.
This Presentation contains certain forward-looking statements relating to inter alia the business, financial performance and results of the Company and the industry in which it operates. Any forward-looking statements contained in this Presentation, including assumptions, opinions and views of the Company or cited from third party sources, are solely opinions and forecasts and are subject to risks, uncertainties and other factors that may cause actual results and events to be materially different from those expected or implied by the forward-looking statements. The Company cannot provide any assurance that the assumptions underlying such forward-looking statements are free from errors nor do any of them accept any responsibility for the future accuracy of opinions expressed in this Presentation or the actual occurrence of forecasted developments.
This Presentation speaks as at the date set out on herein. Neither the delivery of this Presentation nor any further discussions of the Company shall, under any circumstances, create any implication that there has been no change in the affairs of the Company since such date. The Company does not assume any obligation to update or revise the Presentation or disclose any changes or revisions to the information contained in the Presentation (including in relation to forward-looking statements).
This Presentation is subject to Norwegian law, and any dispute arising in respect of this Presentation is subject to the exclusive jurisdiction of Norwegian courts.
Disclaimer

Nekkar ASA
H2 2020 highlights
Highlights H2 2020
• NOK 94 million settlement in the Cargotec / MacGregor arbitration. The settlement amount is included in loss from discontinued business of NOK 104 million in the statement of profit and loss
• Ocean testing started for “Starfish” closed fish cage
Events subsequent to year-end
• NOK 230 million in revenues, up 41% vs H2 2019
• Operational EBITDA*-result of NOK 52 million (= EBITDA-margin of 22.6%)
• Record high order backlog of NOK 1,167 million at year-end
• Secured USD 30 million contract for shipyard solutions
• Solid financial position
• Started preparations for ocean testing of “Starfish” closed fish cage at Hidra outside Flekkefjord, Norway
• Completed pre-study of wind installation technology
• Signed lease agreement for new office and workshop for Syncrolift at Vestby, Norway
*Excluding losses/gain on FX contracts not qualifying for hedge accounting

• NOK 360 million revenue company (2020)
• Strong financial performance: 19.9% EBITDA-margin in 2020
• Strong operational cash flow, no interest-bearing debt
• 63 employees
• Listed on Oslo Stock Exchange (NKR)
• Headquartered in Kristiansand, Norway
Leverage unique and recognised “drilling bay” heritage and execution ability in Kristiansand, within:
• Engineering
• Electrification
• Automation
• Digitalisation
To develop disruptive technologies that can make high-growth industry sectors even more sustainable
Nekkar ASA
Disruptive technologies, sustainable results
Nekkar in brief New strategic direction
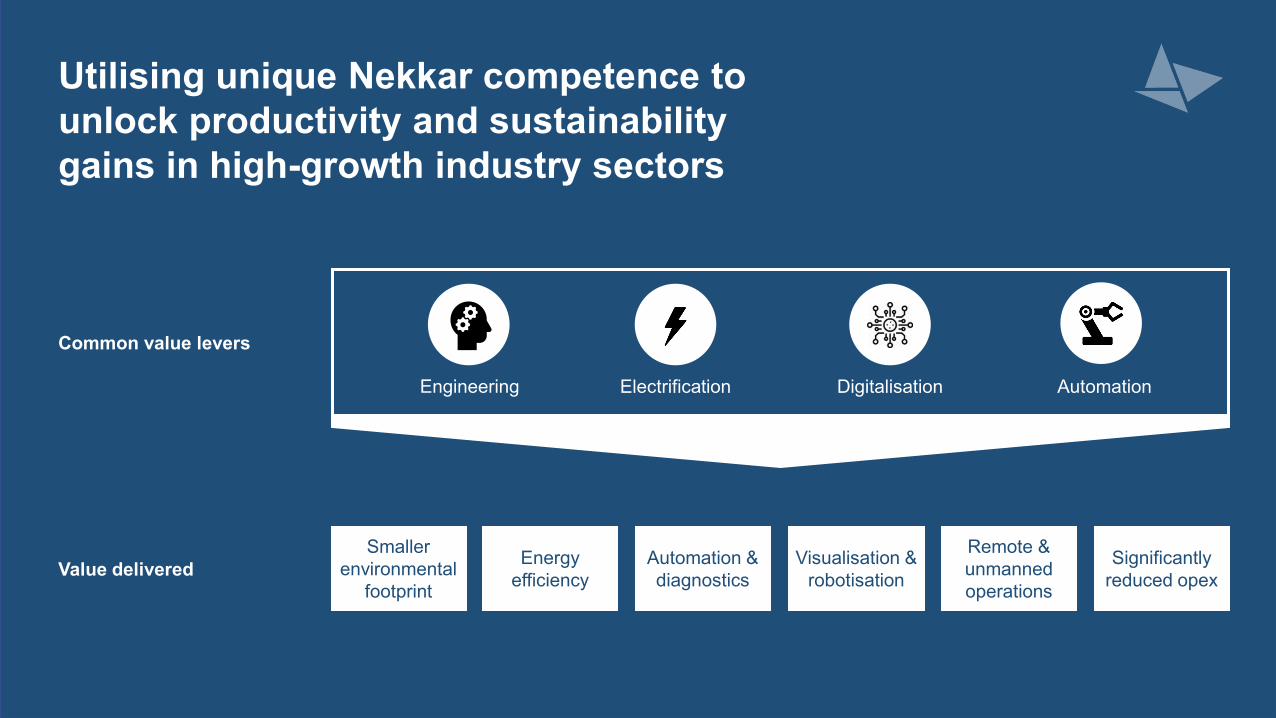
Utilising unique Nekkar competence to unlock productivity and sustainability gains in high-growth industry sectors
Common value levers
Electrification AutomationDigitalisation
Value delivered Energy efficiency
Automation & diagnostics
Visualisation & robotisation
Remote & unmanned operations
Smaller environmental
footprint
Significantly reduced opex
Engineering
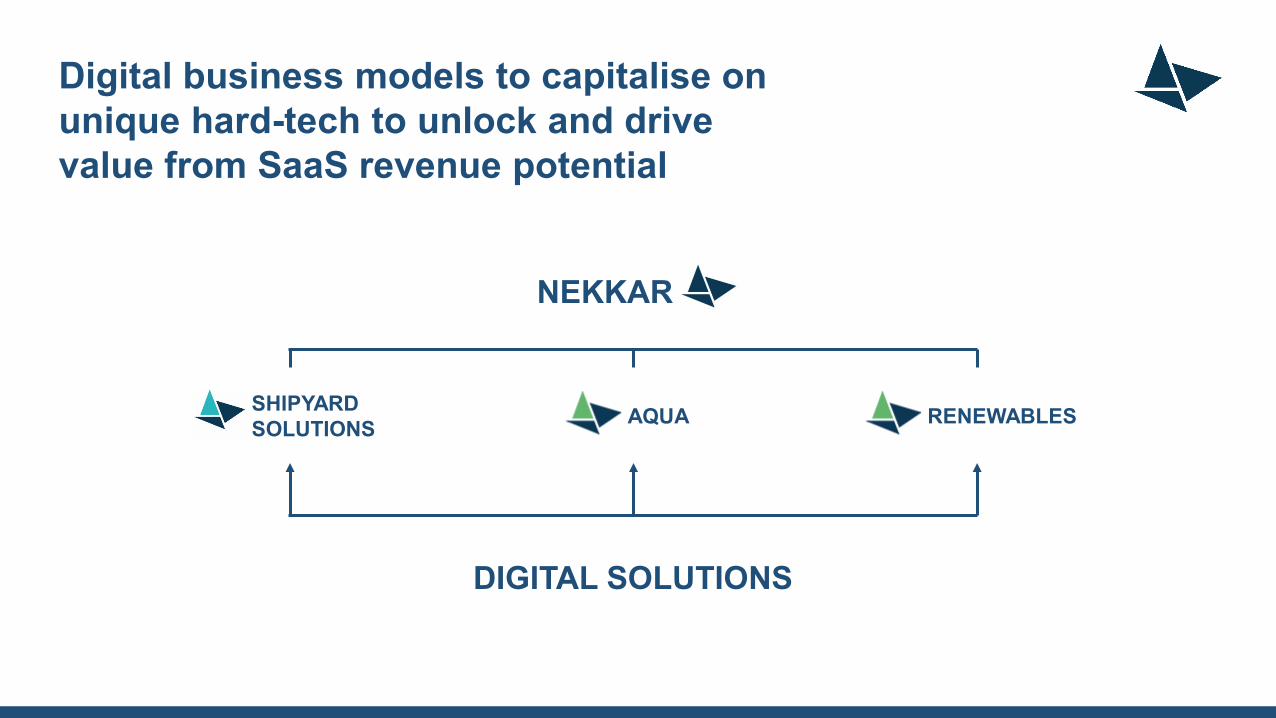
Digital business models to capitalise on unique hard-tech to unlock and drive value from SaaS revenue potential
NEKKAR
DIGITAL SOLUTIONS
SHIPYARD SOLUTIONS AQUA RENEWABLES
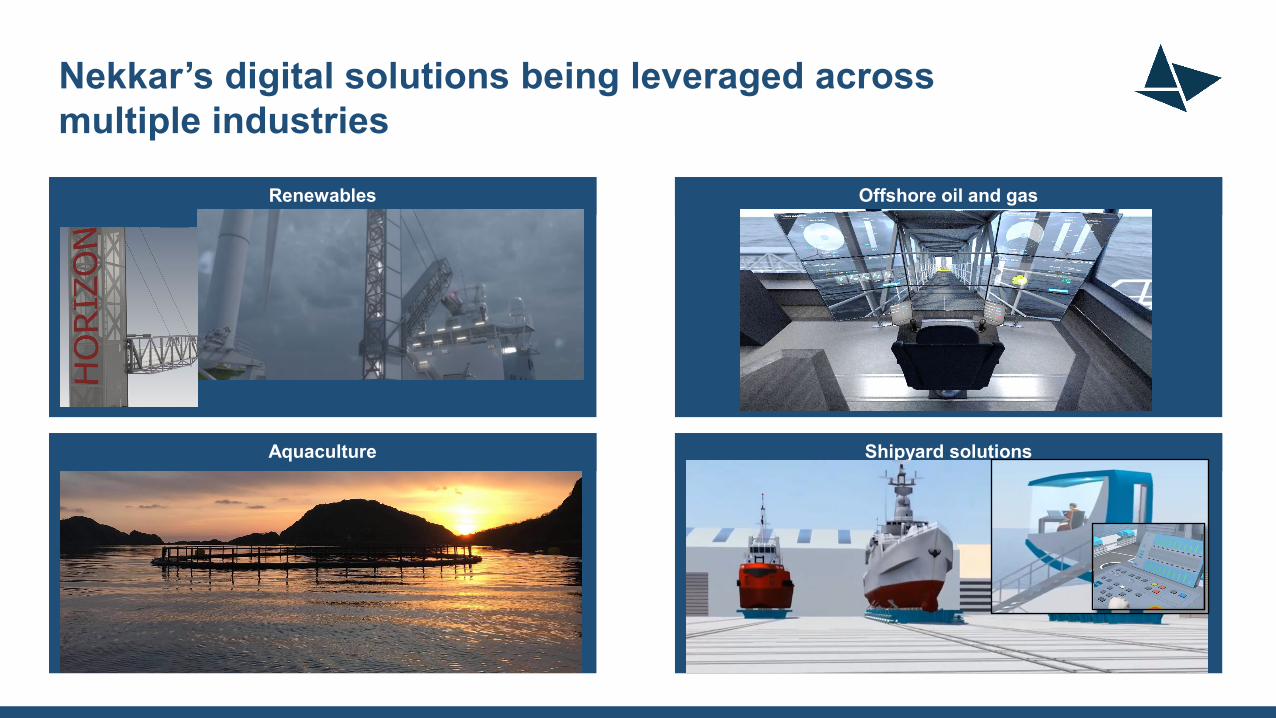
Nekkar’s digital solutions being leveraged across multiple industries
Renewables Offshore oil and gas
Aquaculture Shipyard solutions
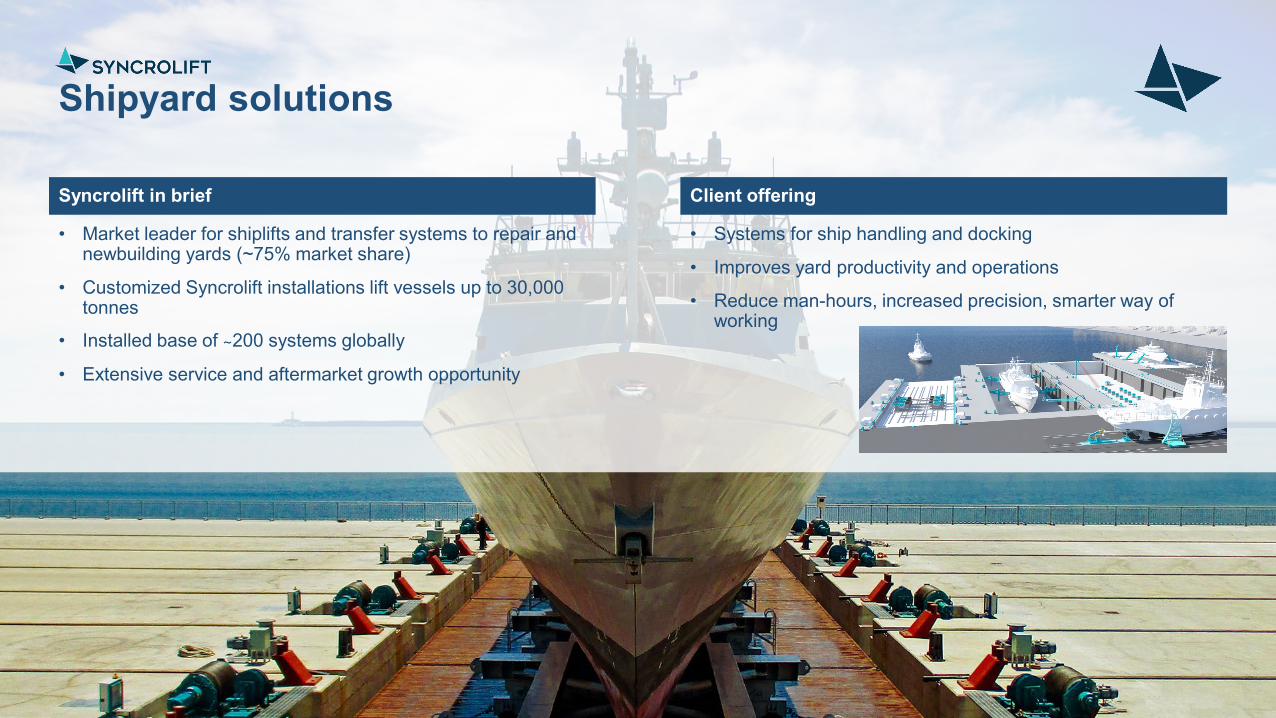
Shipyard solutions
• Market leader for shiplifts and transfer systems to repair and newbuilding yards (~75% market share)
• Customized Syncrolift installations lift vessels up to 30,000 tonnes
• Installed base of ~200 systems globally
• Extensive service and aftermarket growth opportunity
• Systems for ship handling and docking
• Improves yard productivity and operations
• Reduce man-hours, increased precision, smarter way of working
Syncrolift in brief Client offering
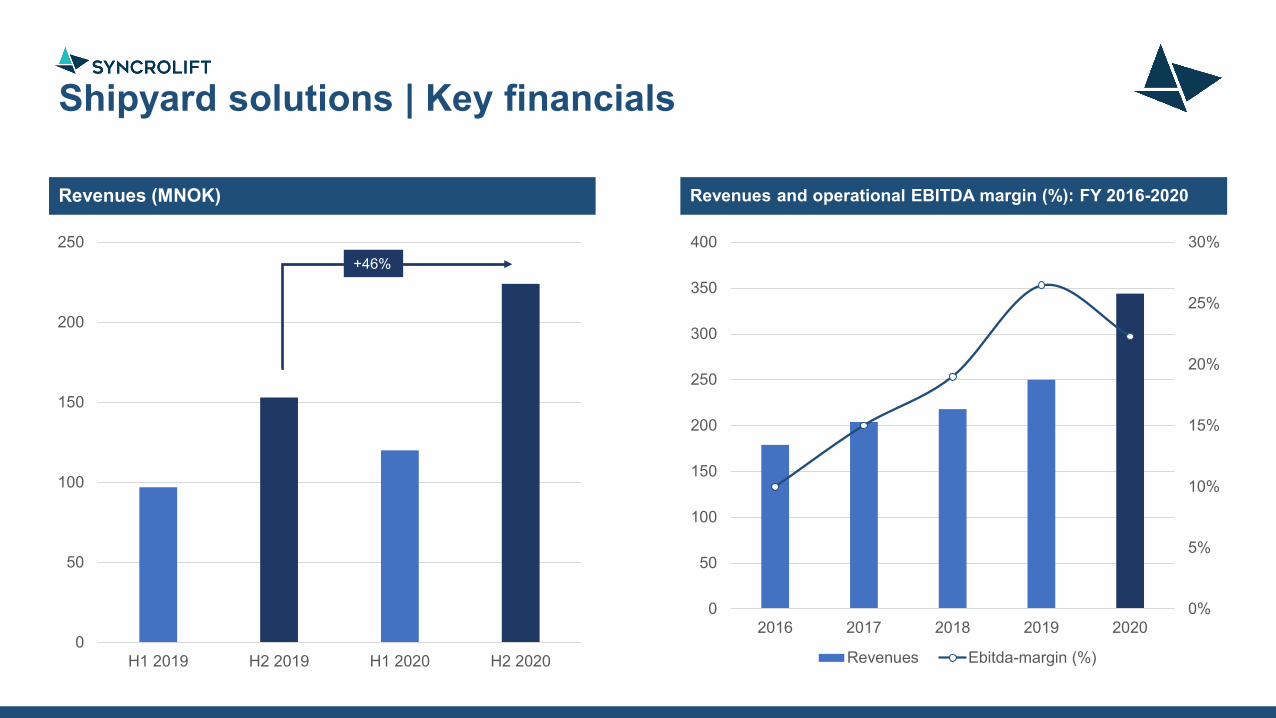
Shipyard solutions | Key financials
Revenues (MNOK) Revenues and operational EBITDA margin (%): FY 2016-2020
0%
5%
10%
15%
20%
25%
30%
0
50
100
150
200
250
300
350
400
2016 2017 2018 2019 2020
Revenues Ebitda-margin (%)0
50
100
150
200
250
H1 2019 H2 2019 H1 2020 H2 2020
+46%

Shipyard solutions | Order intake and backlog
Order intake per half-year period Order backlog* development: FY 2016-2020
0
50
100
150
200
250
300
350
400
450
500
H1 2019 H2 2019 H1 2020 H2 20200
200
400
600
800
1000
1200
2016 2017 2018 2019 2020
*Figures do not include short term service backlog

Aqua
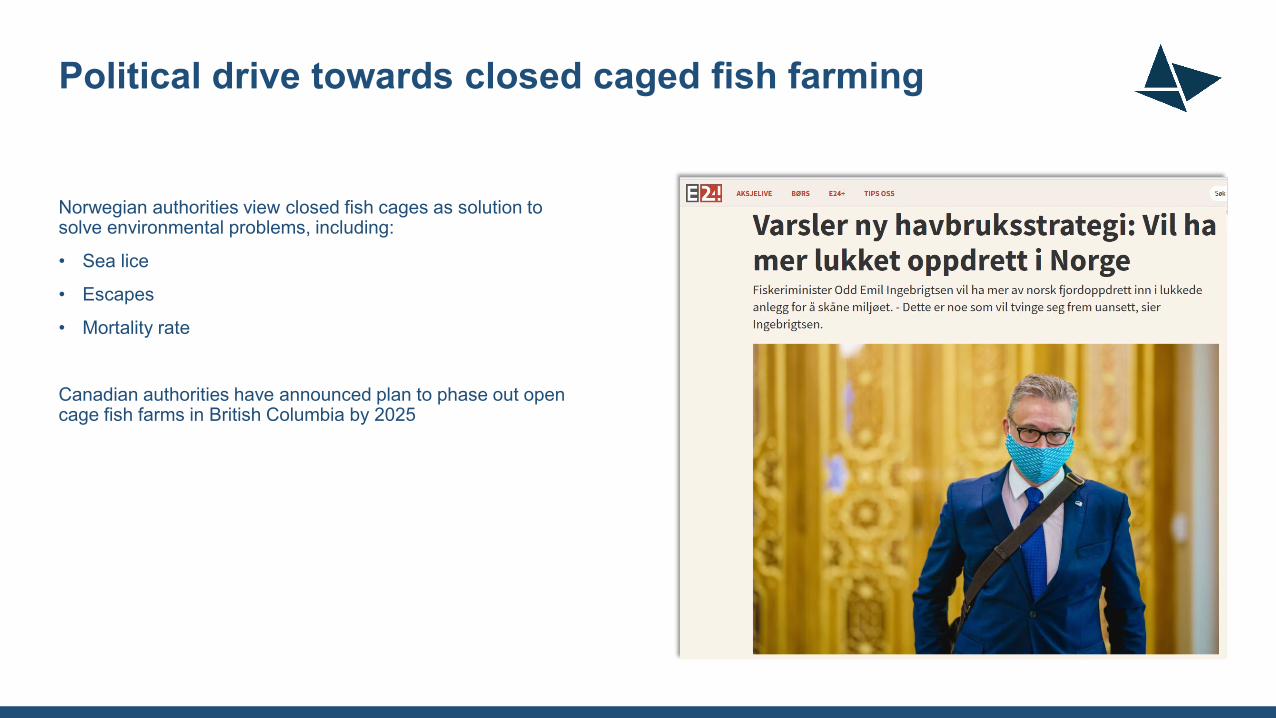
Norwegian authorities view closed fish cages as solution to solve environmental problems, including:
• Sea lice
• Escapes
• Mortality rate
Canadian authorities have announced plan to phase out open cage fish farms in British Columbia by 2025
Political drive towards closed caged fish farming
Client offering
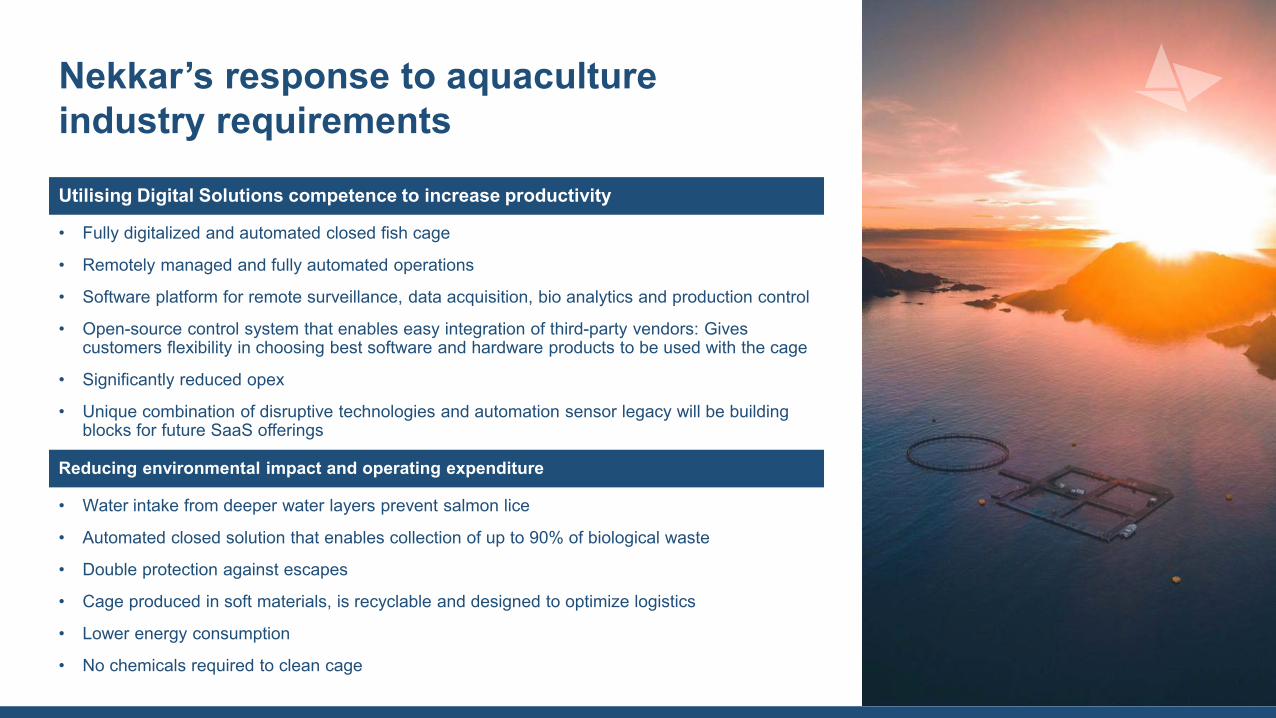
Nekkar’s response to aquaculture industry requirements
• Fully digitalized and automated closed fish cage
• Remotely managed and fully automated operations
• Software platform for remote surveillance, data acquisition, bio analytics and production control
• Open-source control system that enables easy integration of third-party vendors: Gives customers flexibility in choosing best software and hardware products to be used with the cage
• Significantly reduced opex
• Unique combination of disruptive technologies and automation sensor legacy will be building blocks for future SaaS offerings
Utilising Digital Solutions competence to increase productivity
• Water intake from deeper water layers prevent salmon lice
• Automated closed solution that enables collection of up to 90% of biological waste
• Double protection against escapes
• Cage produced in soft materials, is recyclable and designed to optimize logistics
• Lower energy consumption
• No chemicals required to clean cage
Reducing environmental impact and operating expenditure

“Starfish” – a closed technology improving fish welfare, production economics and environmental impact
• Innovation agreement with Lerøy
• Partly funded by Innovation Norway
• Tank testing successfully completed at SINTEF in 2020
• Ocean testing of Starfish pilot to start at Hidra, South Norway, March 2021

Renewables: Nekkar’s next target industry
• Developing a highly disruptive installation technology
• Nekkar’s Digital Solutions competence within electrification, automation and digitalisation
• Developing fully automated and remote-controlled installation technology
• Offshore engineering competence
Targeting wind power Basis for market entry
• Reduced CO2 emissions
• Reduced footprint in nature (forest areas etc)
• Increased installation productivity
• Lower costs
• Remove height limitation for turbine installation
• Pre-study completed together with reputable, international industry partners
• Technology undergoing patent approval
Objectives Status

Nekkar ASA
Financial highlights
106 104
163
130
230
-
50
100
150
200
250
H2 2018 H1 2019 H2 2019 H1 2020 H2 2020
Revenues
203
88
308
437
265
- 50
100 150 200 250 300 350 400 450 500
H2 2018 H1 2019 H2 2019 H1 2020 H2 2020
Order intake
629 620
778
1 110 1 167
-
200
400
600
800
1 000
1 200
1 400
H2 2018 H1 2019 H2 2019 H1 2020 H2 2020
Order backlog
10
1
50
19
52
0
10
20
30
40
50
60
H2 2018 H1 2019 H2 2019 H1 2020 H2 2020
Operational EBITDA
*Order intake and order backlog do not include short term service sales

Nekkar ASA
Financial highlights
Nekkar ASA 2H Full-Year
MNOK 2020 2019 2020 2019
Revenue 230 163 359 267
Reported EBITDA 75 35 77 36
Operational EBITDA* 52 50 71 51
EBIT 74 33 75 33
EBITDA % 32,7 % 21,4 % 21,5 % 13,4 %
Operational EBITDA %* 22,6 % 30,7 % 19,9 % 19,1 %
Order intake 265 308 701 396
Order backlog 1 167 778 1 167 778
EPS (NOK) 0,65 0,49 0,67 0,46
*Excl. losses/gain on FX contracts not qualifying for hedge accounting
Second half revenue of MNOK 230, representing an increase of 41% year-on-year Full-year revenue increased by ~35% compared to 2019
Second half operational EBITDA of MNOK 52 compared to MNOK 50 in 2019 Full-year operational EBITDA of MNOK 71 versus MNOK 51 in
2019. Operational EBITDA margin of ~20%
Gains on FX hedging contracts amounted to MNOK 23 in second half and the full-year 2020 effect was MNOK 6
Earnings per share for 2020, continued operations, of NOK 0.67 compared to NOK 0.46 in 2019. Result from discontinued operations of MNOK -104 in 2020 which
includes a settlement agreement of MNOK 94. Earnings per share incl. discontinued operations of NOK -0.33.
Nekkar ASA
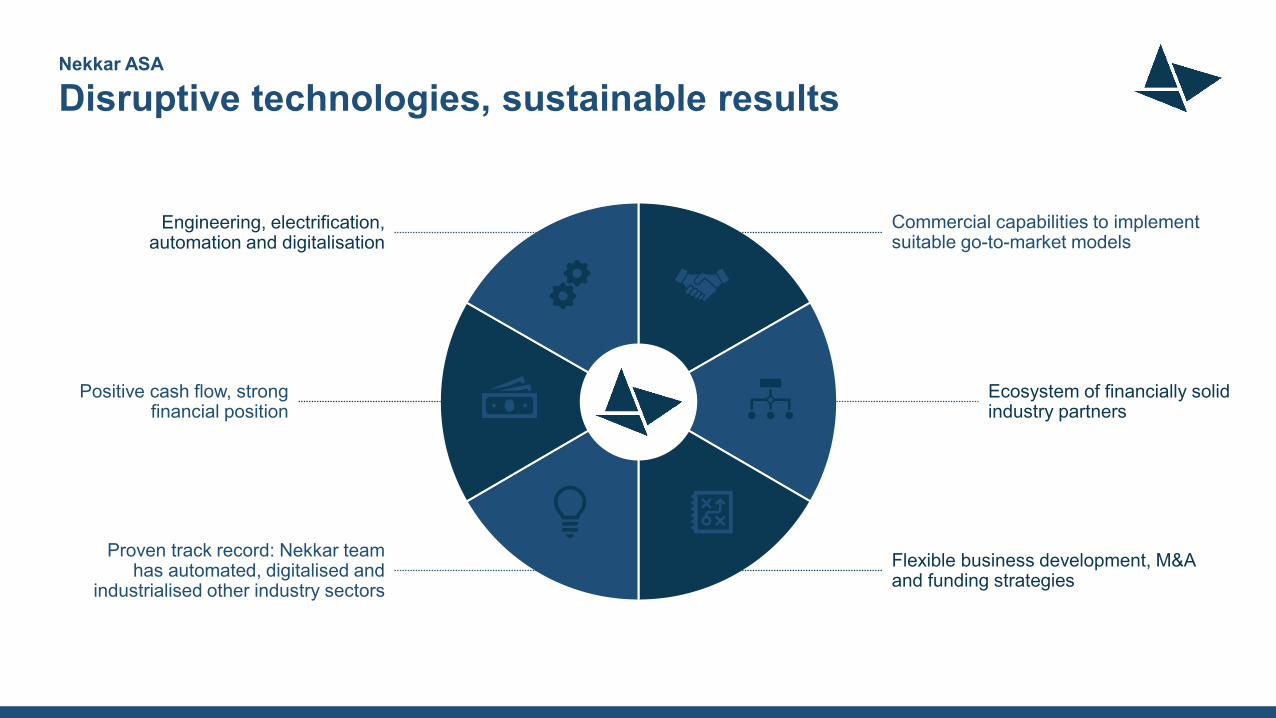
Disruptive technologies, sustainable results
Commercial capabilities to implement suitable go-to-market models
Engineering, electrification, automation and digitalisation
Flexible business development, M&A and funding strategies
Ecosystem of financially solid industry partners
Proven track record: Nekkar team has automated, digitalised and
industrialised other industry sectors
Positive cash flow, strong financial position
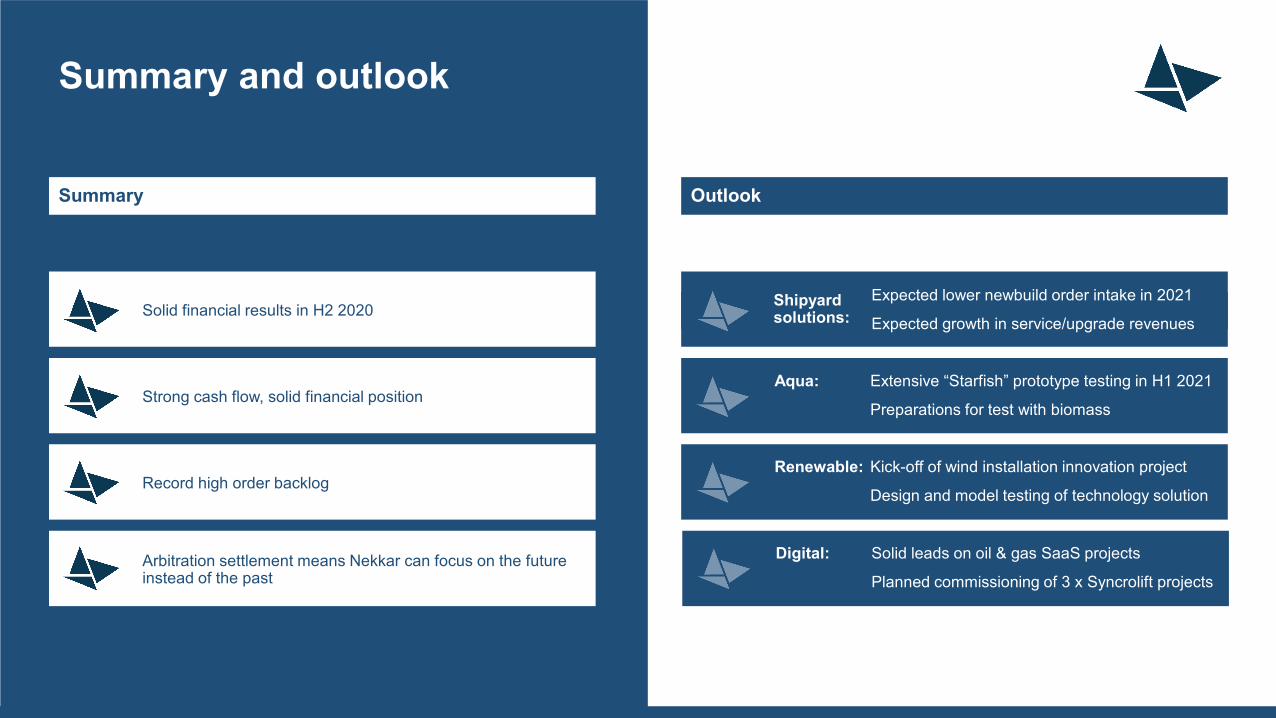
Summary and outlook
Summary Outlook
Solid financial results in H2 2020Expected lower newbuild order intake in 2021
Expected growth in service/upgrade revenues
Arbitration settlement means Nekkar can focus on the future instead of the past xx
Record high order backlogRenewable: Kick-off of wind installation innovation project
Design and model testing of technology solution
Strong cash flow, solid financial positionAqua: Extensive “Starfish” prototype testing in H1 2021
Preparations for test with biomass
Shipyard solutions:
Digital: Solid leads on oil & gas SaaS projects
Planned commissioning of 3 x Syncrolift projects
Appendix

Nekkar ASA
Statement of profit and lossCondensed consolidated statement of comprehensive income
(NOK 1 000) Unaudited Audited Unaudited Unaudited
CONTINUED BUSINESS 2020 2019 2H 2020 2H 2019Revenue from projects 359 467 266 614 229 567 162 988 Total operating revenue 359 467 266 614 229 567 162 988 Cost of goods sold 198 224 144 952 127 668 76 451 Other operating costs 89 860 70 379 49 897 36 552 Other losses / (gains) -5 990 15 182 -23 095 15 182 EBITDA 77 372 36 100 75 097 34 803 Depreciation 2 746 3 026 1 521 1 662 Operating profit (EBIT) 74 626 33 074 73 576 33 141 Net finance -2 909 27 -4 101 3 613 Profit/loss before tax 71 717 33 102 69 475 36 755 Tax 896 -15 874 454 -15 891 Profit/loss from continued business 70 821 48 976 69 021 52 646
DISCONTINUED BUSINESSProfit/loss from discontinued business -103 718 148 116 -103 718 113 415
Profit/loss for the period -32 897 197 091 -34 697 166 061 Attributable to equity holders of the company -36 238 195 833 -37 301 169 660 Attributable to non-controlling interests 1 829 1 259 1 091 -3 599
COMPREHENSIVE INCOMENet result for the period -32 897 197 091 -34 697 166 061 Currency effects - - - -Total comprehensive income -32 897 197 091 -34 697 166 061
Attributable to equity holders of the company -34 726 195 833 -35 788 169 660 Attributable to non-controlling interests 1 829 1 259 1 091 -3 599
Earnings per share (NOK) -0,33 2,07 -0,34 1,63 Diluted earnings per share (NOK) -0,33 1,91 -0,34 1,55
Earnings per share - Continued Business (NOK) 0,67 0,52 0,65 0,56 Diluted earnings per share - Continued Business (NOK) 0,67 0,46 0,65 0,50
Second half revenue of MNOK 230, representing an increase of 41% year-on-year Full-year revenue of MNOK 359 representing an increase
of ~35% compared to 2019
Second half EBITDA of MNOK 75 is impacted by gains on FX hedging contacts which is presented as other losses/(gains) Operational EBITDA of MNOK 52 in the second half and
full-year of MNOK 71 in 2020 versus MNOK 51 in the previous year
Operational EBITDA margin of ~23% in the second half and ~20% in full-year 2020
A bad debt provision of MNOK 13, related to accounts receivables, is included in other operating costs in 2020.
Loss from discontinued business of MNOK 104 in the second half. This includes the global settlement of MNOK 94 in the Cargotec / MacGregor arbitration, in addition to transaction related external and internal costs.
Earnings per share for 2020, continued operations, of NOK 0.67 compared to NOK 0.46 in 2019. Earnings per share including loss from discontinued
operations of NOK -0.33.
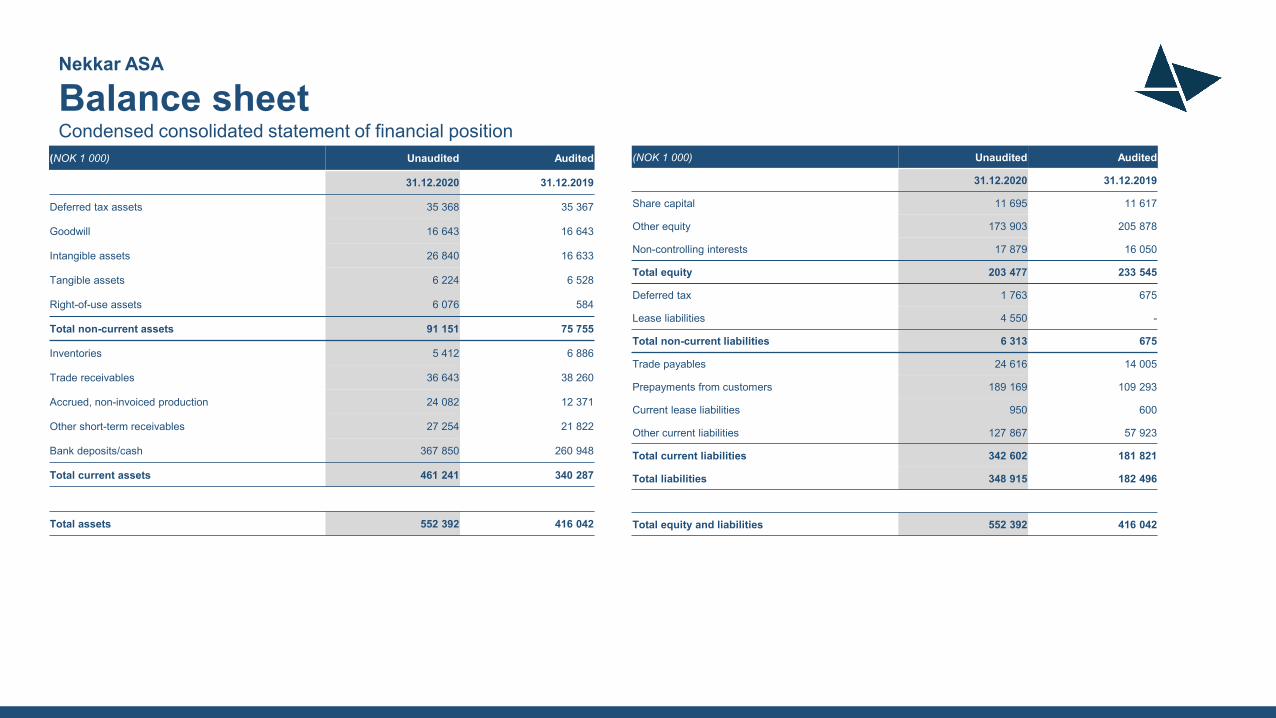
Nekkar ASA
Balance sheetCondensed consolidated statement of financial position
(NOK 1 000) Unaudited Audited
31.12.2020 31.12.2019
Deferred tax assets 35 368 35 367
Goodwill 16 643 16 643
Intangible assets 26 840 16 633
Tangible assets 6 224 6 528
Right-of-use assets 6 076 584
Total non-current assets 91 151 75 755
Inventories 5 412 6 886
Trade receivables 36 643 38 260
Accrued, non-invoiced production 24 082 12 371
Other short-term receivables 27 254 21 822
Bank deposits/cash 367 850 260 948
Total current assets 461 241 340 287
Total assets 552 392 416 042
(NOK 1 000) Unaudited Audited
31.12.2020 31.12.2019
Share capital 11 695 11 617
Other equity 173 903 205 878
Non-controlling interests 17 879 16 050
Total equity 203 477 233 545
Deferred tax 1 763 675
Lease liabilities 4 550 -
Total non-current liabilities 6 313 675
Trade payables 24 616 14 005
Prepayments from customers 189 169 109 293
Current lease liabilities 950 600
Other current liabilities 127 867 57 923
Total current liabilities 342 602 181 821
Total liabilities 348 915 182 496
Total equity and liabilities 552 392 416 042

Nekkar ASA
Cash flow statementCondensed consolidated statement of cash flow
(NOK 1 000) Unaudited Audited
2020 2019Cash flow from operating activitiesProfit (loss) before tax 71 717 33 102
Adjustments for:Depreciation / impairment 2 746 3 026 Interest expense 78 3 457 Interest income -1 509 -7 259 Other Financial Items 4 341 3 775 Income tax paid -245 -189
Change in net current assets 56 738 22 574 Net cash flow from operating activities 133 866 58 250
Cash flow from investment activitiesAcquisition of Subsidiary - net of Cash acquired - -8 354 Acquisition and expenditures of fixed/intangible assets -12 083 -13 311 Cash distribution from divested companies - -59 346 Disposal of discontinued operation -13 965 -Proceeds from sale of investments - 553 562 Net cash flow from investment activities -26 046 472 551
Cash flow from financing activitiesProceeds from issuance of share capital 2 829 2 092 Dividends paid - -422 450 Disbursement on short-term/ long-term debt - -198 375 Payment of lease liabilities -837 -592 Interest received 1 509 7 259 Interest paid -78 -3 457 Other Financial items -4 341 -3 775 Net cash flow from financing activities -918 -619 298
Net change in cash and cash equivalents 106 902 -88 498 Cash and cash equivalents at the start of the period 260 948 349 445 Cash and cash equivalents at the end of the period 367 849 260 948
Operating cash flow of MNOK 134 representing a significant increase from the previous year
Cash flow from investments of MNOK 26 includes net capitalized expensed of MNOK 11 related to ongoing R&D investments
Cash flow from financing of MNOK 0.9 includes issuance of share capital in relation to employee share program
Credit facilities as per 31 December 2020 were in total MNOK 350, which includes a guarantee- and derivatives facility with Nordea At the end of the second half 2020, Nekkar had drawn
MNOK 184 of the guarantee facility
Net cash position of MNOK 368, of which MNOK 10 is held as a deposit for FX-derivative exposures in DnB

INTRODUCTION TO ALTERNATIVE PERFORMANCE MEASURES (APMs)
Nekkar Group (Nekkar) discloses alternative performance measures in addition to those normally required by IFRS. Nekkar is of the opinion that APMs are providing enhanced insight into the operations and prospects of the company. APMs are used as an integral part of the management and board of directors’ key performance measure reporting and controls. Furthermore, securities analysts, investors and other interested parties frequently use such performance measures.
BASIS FOR PREPARATION
This presentation provides financial highlights for the second half of 2020 for Nekkar ASA. The financial information is not reported according to the requirements in IAS 34 (Interim Financial Reporting) and the figures are not audited.
PROFIT MEASURES
EBITDA is short for “earnings before interest, taxes, depreciation and amortisation” in the consolidated income statement.
Nekkar defines “Operational EBITDA” as EBITDA excluding losses/gain on FX contracts not qualifying for hedge accounting.
EBIT is short for “earnings before interest and taxes”. EBIT corresponds to “operating profit/loss” in the consolidated income statement.
Margins such as EBITDA and EBIT are used to compare relative profit between periods. The margins are calculated as EBITDA or EBIT divided by revenue.
ORDER INTAKE MEASURES
Order intake and order backlog are presented as APMs as they are indicators of the company’s revenue generation and operations in the future.
Order intake includes new signed contracts in the period, in addition to expansion of existing contracts and any cancellations of contracts. For newbuild contracts, the order intake is based on the signed contract value excluding potential options and change orders.
Order backlog represents the estimated value of remaining work for signed newbuild contracts and does not include the value of service orders.
Alternative performance measures

nekkar.com