
Disruption of the clock components CLOCK and BMAL1 leads to hypoinsulinaemia and diabetes
5
LETTERS Disruption of the clock components CLOCK and BMAL1 leads to hypoinsulinaemia and diabetes Biliana Marcheva 1,2 , Kathryn Moynihan Ramsey 1,2 , Ethan D. Buhr 2 , Yumiko Kobayashi 1,2 , Hong Su 3 , Caroline H. Ko 2 , Ganka Ivanova 1,2 , Chiaki Omura 1,2 , Shelley Mo 4 , Martha H. Vitaterna 5 , James P. Lopez 6 , Louis H. Philipson 6 , Christopher A. Bradfield 7 , Seth D. Crosby 8 , Lellean JeBailey 9 , Xiaozhong Wang 3 , Joseph S. Takahashi 10,11 & Joseph Bass 1,2,5 The molecular clock maintains energy constancy by producing circadian oscillations of rate-limiting enzymes involved in tissue metabolism across the day and night 1–3 . During periods of feeding, pancreatic islets secrete insulin to maintain glucose homeostasis, and although rhythmic control of insulin release is recognized to be dysregulated in humans with diabetes 4 , it is not known how the circadian clock may affect this process. Here we show that pancreatic islets possess self-sustained circadian gene and protein oscillations of the transcription factors CLOCK and BMAL1. The phase of oscil- lation of islet genes involved in growth, glucose metabolism and insulin signalling is delayed in circadian mutant mice, and both Clock 5,6 and Bmal1 7 (also called Arntl) mutants show impaired glu- cose tolerance, reduced insulin secretion and defects in size and proliferation of pancreatic islets that worsen with age. Clock disrup- tion leads to transcriptome-wide alterations in the expression of islet genes involved in growth, survival and synaptic vesicle assembly. Notably, conditional ablation of the pancreatic clock causes diabetes mellitus due to defective b-cell function at the very latest stage of stimulus–secretion coupling. These results demonstrate a role for the b-cell clock in coordinating insulin secretion with the sleep– wake cycle, and reveal that ablation of the pancreatic clock can trigger the onset of diabetes mellitus. The circadian clock drives cycles of energy storage and utilization in plants, flies and mammals in anticipation of changes in the external environment imposed by the rising and setting of the Sun 1 . In mammals, the transcription factors CLOCK and BMAL1 drive the central oscillator within the hypothalamus and even in peripheral tissues, yet a major question remains regarding the link between cellular rhythms and organismal homeostasis, including the constancy of energy and fuel utilization cycles 8,9 . In humans, one of the most pronounced rhythmic aspects of physiology involves the daily variation of glucose tolerance and insulin sensitivity across the 24-h day, and importantly, disruption of circadian oscillation of glucose metabolism is a hallmark of type 2 diabetes 4 . Moreover, there is growing evidence that metabolic and circadian systems are inter- connected at the transcriptional level, as genomic analyses have revealed that both neural and peripheral clocks regulate the 24-h periodicity of RNAs that mediate rate-limiting steps in glycolysis, fatty acid oxidation and oxidative phosphorylation, indicating that these processes are primed to occur at the optimal time during glu- cose and fatty acid utilization cycles 2,10–13 . Prompted by the hypothesis that the circadian clock exerts effects on metabolism through cellular actions, we sought to dissect the impact of clock function within the pancreatic islet, a principal regulator of glucose homeostasis. We used real-time bioluminescence imaging in isolated pancreatic islets from Per2 Luc knock-in mice (mice expressing a period2–luciferase fusion protein) to determine whether the clock is expressed autonomously within pancreas 14 . Continuous monitoring of light emission from individual islets revealed a self-sustained high- amplitude rhythm of PER2–LUC expression with a period length of 23.58 6 0.3 h (Fig. 1a, b and Supplementary Movies 1 and 2), which closely matched that of other peripheral tissues and the suprachias- matic nucleus (Fig. 1b) 14,15 . The oscillation gradually dampened after 3days, similar to pituitary and liver (Fig. 1b), and addition of 10 mM forskolin to islets led to immediate re-initiation of robust rhythms (Fig. 1c). Bioluminescence from individual islets from Clock D19/D19 mutant mice lacked a circadian rhythm, even after forskolin stimu- lation (Fig. 1c). Quantitative real-time polymerase chain reaction (PCR) showed that Per2 RNA expression was reduced and rhythmicity abolished in islets from Clock D19/D19 mutant mice (Fig. 1d). Together, the PER2 protein and mRNA oscillation in wild-type islets, as well as the loss of rhythmicity of Per2 in Clock D19/D19 islets, provide evidence for a self-sustained clock in endocrine pancreas. Because a major mechanism of circadian regulation involves the cycling of genes involved in cell metabolism and proliferation, we examined 24-h RNA rhythms of essential transcripts involved in insulin secretion and b-cell growth in isolated islets (Supplemen- tary Fig. 1). Clock D19/D19 mutant islets showed decreased expression levels of genes downstream of CLOCK and BMAL1 that comprise the core circadian loop, as well as the D-box and ROR feedback loops (Fig. 1d). Clock D19/D19 mutant mice also showed decreased levels of expression and/or phase shifts of RNA oscillation of genes involved in insulin signalling (Insr, Irs2, PI3K (also called Pik3r1), Akt2), glucose sensing (Glut2 (Slc2a2), Gck), and islet growth and development (Ccnd1, Gsk3b, Hnf4a, Hnf1a, Pdx1, Neurod1) (Supplementary Fig. 1). The alterations in temporal patterns of gene expression in Clock D19/D19 mutant islets were distinct from those in Clock D19/D19 mutant liver, reflecting partitioning of metabolic functions within these two tissues at different times of day (Supplementary Figs 1 and 2 and Sup- plementary Description 1). To determine whether molecular disruption of the clock in pancreas corresponds with abnormalities in the temporal control of glucose 1 Department of Medicine, Northwestern University Feinberg School of Medicine, Chicago, Illinois 60611, USA. 2 Department of Neurobiology and Physiology, Northwestern University, Evanston, Illinois 60208, USA. 3 Department of Biochemistry, Molecular Biology and Cell Biology, Northwestern University, Evanston, Illinois 60208, USA. 4 Weinberg College of Arts and Sciences, Northwestern University, Evanston, Illinois 60208, USA. 5 Center for Sleep and Circadian Biology, Northwestern University, Evanston, Illinois 60208, USA. 6 Department of Medicine, University of Chicago, Chicago, Illinois 60637, USA. 7 McArdle Laboratory for Cancer Research, University of Wisconsin School of Medicine and Public Health, Madison, Wisconsin 53706, USA. 8 Department of Genetics, Washington University School of Medicine, St Louis, Missouri 63108, USA. 9 GeneGo Inc. St Joseph, Michigan 49085, USA. 10 Department of Neuroscience, University of Texas Southwestern Medical Center, Dallas, Texas 75390-9111, USA. 11 Howard Hughes Medical Institute, University of Texas Southwestern Medical Center, Dallas, Texas 75390-9111, USA. Vol 466 | 29 July 2010 | doi:10.1038/nature09253 627 Macmillan Publishers Limited. All rights reserved ©2010
Transcript of Disruption of the clock components CLOCK and BMAL1 leads to hypoinsulinaemia and diabetes

LETTERS
Disruption of the clock components CLOCK andBMAL1 leads to hypoinsulinaemia and diabetesBiliana Marcheva1,2, Kathryn Moynihan Ramsey1,2, Ethan D. Buhr2, Yumiko Kobayashi1,2, Hong Su3, Caroline H. Ko2,Ganka Ivanova1,2, Chiaki Omura1,2, Shelley Mo4, Martha H. Vitaterna5, James P. Lopez6, Louis H. Philipson6,Christopher A. Bradfield7, Seth D. Crosby8, Lellean JeBailey9, Xiaozhong Wang3, Joseph S. Takahashi10,11
& Joseph Bass1,2,5
The molecular clock maintains energy constancy by producingcircadian oscillations of rate-limiting enzymes involved in tissuemetabolism across the day and night1–3. During periods of feeding,pancreatic islets secrete insulin to maintain glucose homeostasis,and although rhythmic control of insulin release is recognized tobe dysregulated in humans with diabetes4, it is not known how thecircadian clock may affect this process. Here we show that pancreaticislets possess self-sustained circadian gene and protein oscillationsof the transcription factors CLOCK and BMAL1. The phase of oscil-lation of islet genes involved in growth, glucose metabolism andinsulin signalling is delayed in circadian mutant mice, and bothClock5,6 and Bmal17 (also called Arntl) mutants show impaired glu-cose tolerance, reduced insulin secretion and defects in size andproliferation of pancreatic islets that worsen with age. Clock disrup-tion leads to transcriptome-wide alterations in the expression of isletgenes involved in growth, survival and synaptic vesicle assembly.Notably, conditional ablation of the pancreatic clock causes diabetesmellitus due to defective b-cell function at the very latest stage ofstimulus–secretion coupling. These results demonstrate a role forthe b-cell clock in coordinating insulin secretion with the sleep–wake cycle, and reveal that ablation of the pancreatic clock cantrigger the onset of diabetes mellitus.
The circadian clock drives cycles of energy storage and utilizationin plants, flies and mammals in anticipation of changes in theexternal environment imposed by the rising and setting of theSun1. In mammals, the transcription factors CLOCK and BMAL1drive the central oscillator within the hypothalamus and even inperipheral tissues, yet a major question remains regarding the linkbetween cellular rhythms and organismal homeostasis, including theconstancy of energy and fuel utilization cycles8,9. In humans, one ofthe most pronounced rhythmic aspects of physiology involves thedaily variation of glucose tolerance and insulin sensitivity across the24-h day, and importantly, disruption of circadian oscillation ofglucose metabolism is a hallmark of type 2 diabetes4. Moreover, thereis growing evidence that metabolic and circadian systems are inter-connected at the transcriptional level, as genomic analyses haverevealed that both neural and peripheral clocks regulate the 24-hperiodicity of RNAs that mediate rate-limiting steps in glycolysis,fatty acid oxidation and oxidative phosphorylation, indicating thatthese processes are primed to occur at the optimal time during glu-cose and fatty acid utilization cycles2,10–13.
Prompted by the hypothesis that the circadian clock exerts effects onmetabolism through cellular actions, we sought to dissect the impact ofclock function within the pancreatic islet, a principal regulator ofglucose homeostasis. We used real-time bioluminescence imaging inisolated pancreatic islets from Per2Luc knock-in mice (mice expressinga period2–luciferase fusion protein) to determine whether the clock isexpressed autonomously within pancreas14. Continuous monitoringof light emission from individual islets revealed a self-sustained high-amplitude rhythm of PER2–LUC expression with a period length of23.58 6 0.3 h (Fig. 1a, b and Supplementary Movies 1 and 2), whichclosely matched that of other peripheral tissues and the suprachias-matic nucleus (Fig. 1b)14,15. The oscillation gradually dampened after3 days, similar to pituitary and liver (Fig. 1b), and addition of 10mMforskolin to islets led to immediate re-initiation of robust rhythms(Fig. 1c). Bioluminescence from individual islets from ClockD19/D19
mutant mice lacked a circadian rhythm, even after forskolin stimu-lation (Fig. 1c). Quantitative real-time polymerase chain reaction(PCR) showed that Per2 RNA expression was reduced and rhythmicityabolished in islets from ClockD19/D19 mutant mice (Fig. 1d). Together,the PER2 protein and mRNA oscillation in wild-type islets, as well asthe loss of rhythmicity of Per2 in ClockD19/D19 islets, provide evidencefor a self-sustained clock in endocrine pancreas.
Because a major mechanism of circadian regulation involves thecycling of genes involved in cell metabolism and proliferation, weexamined 24-h RNA rhythms of essential transcripts involved ininsulin secretion and b-cell growth in isolated islets (Supplemen-tary Fig. 1). ClockD19/D19 mutant islets showed decreased expressionlevels of genes downstream of CLOCK and BMAL1 that comprise thecore circadian loop, as well as the D-box and ROR feedback loops(Fig. 1d). ClockD19/D19 mutant mice also showed decreased levels ofexpression and/or phase shifts of RNA oscillation of genes involved ininsulin signalling (Insr, Irs2, PI3K (also called Pik3r1), Akt2), glucosesensing (Glut2 (Slc2a2), Gck), and islet growth and development(Ccnd1, Gsk3b, Hnf4a, Hnf1a, Pdx1, Neurod1) (Supplementary Fig. 1).The alterations in temporal patterns of gene expression in ClockD19/D19
mutant islets were distinct from those in ClockD19/D19 mutant liver,reflecting partitioning of metabolic functions within these two tissuesat different times of day (Supplementary Figs 1 and 2 and Sup-plementary Description 1).
To determine whether molecular disruption of the clock in pancreascorresponds with abnormalities in the temporal control of glucose
1Department of Medicine, Northwestern University Feinberg School of Medicine, Chicago, Illinois 60611, USA. 2Department of Neurobiology and Physiology, Northwestern University,Evanston, Illinois 60208, USA. 3Department of Biochemistry, Molecular Biology and Cell Biology, Northwestern University, Evanston, Illinois 60208, USA. 4Weinberg College of Artsand Sciences, Northwestern University, Evanston, Illinois 60208, USA. 5Center for Sleep and Circadian Biology, Northwestern University, Evanston, Illinois 60208, USA. 6Departmentof Medicine, University of Chicago, Chicago, Illinois 60637, USA. 7McArdle Laboratory for Cancer Research, University of Wisconsin School of Medicine and Public Health, Madison,Wisconsin 53706, USA. 8Department of Genetics, Washington University School of Medicine, St Louis, Missouri 63108, USA. 9GeneGo Inc. St Joseph, Michigan 49085, USA.10Department of Neuroscience, University of Texas Southwestern Medical Center, Dallas, Texas 75390-9111, USA. 11Howard Hughes Medical Institute, University of TexasSouthwestern Medical Center, Dallas, Texas 75390-9111, USA.
Vol 466 | 29 July 2010 | doi:10.1038/nature09253
627Macmillan Publishers Limited. All rights reserved©2010

metabolism, we analysed 24-h glucose and insulin profiles in 8-month-old ClockD19/D19 mutant mice and their wild-type littermates during adlibitum feeding. In ClockD19/D19 mutant mice, glucose levels were ele-vated across the entire light/dark cycle without a rise in insulin levels,whereas insulin rises in wild-type mice during the beginning of thefeeding period (Fig. 2a, b). ClockD19/D19 mutant mice also displayedsignificantly elevated fasting glucose levels at both ZT2 and ZT14(Zeitgeber time) (Supplementary Fig. 3e, f). Glucose tolerance testsfurther revealed a 50% reduction in insulin release, corresponding withelevated glucose levels in ClockD19/D19 mutant mice, particularly atthe beginning of the dark period (Fig. 2c, d and SupplementaryDescription 2). The likelihood that impaired glucose tolerance inClockD19/D19 mutant mice involves a primary defect in pancreatic func-tion was further supported by the finding that these animals havenormal insulin tolerance (Supplementary Fig. 3c, d).
For a better understanding of the impact of the circadian genemutation on pancreatic function, we examined glucose-stimulated
insulin secretion (GSIS) in isolated size-matched pancreatic isletsfrom 8-month-old mice. Islets from ClockD19/D19 mice displayed a,50% reduction in GSIS (Fig. 3a) and failed to respond to KCl(Fig. 3b), indicating a defect in insulin exocytosis. Consistent witha predominant defect in insulin release rather than glucose meta-bolism, we observed normal calcium flux in response to 12 mMglucose in ClockD19/D19 mutant compared to wild-type islets (Sup-plementary Fig. 5d, e). Also consistent with defects in exocytosis,islets from ClockD19/D19 mutant mice displayed diminished insulinsecretory responses to the cyclase activators forskolin and exendin 4,as well as to 8-bromoadenosine 39,59-cyclic monophosphate (8-bromo-cAMP), localizing the impaired function of ClockD19/D19 mutant islets toa late stage in stimulus–secretion coupling16 (Fig. 3b). Finally, in agree-ment with an exocytic defect as the cause of decreased insulin release incircadian mutant mice, we did not observe a significant difference ineither absolute insulin mRNA levels (Supplementary Fig. 1b) or in isletinsulin content (wild type, 38.2 ng insulin per islet; ClockD19/D19, 32.9 nginsulin per islet, P 5 0.08).
0 1 2 3 4 50
5
10
15
20
25
0
100
0
40
0
40
0
400
100
0
40
0 1 2 3 4 50
20
0 1 2 3 4 50
12
0
100
0 1 2 3 4 50
20
0
100
0 1 2 3 4 50
20
0 2 4 6 8 100
20406080
0 1 2 3 4 50
2
4
6
0 1 2 3 4 50
2
4
6Whole field Individual islets
pre-forskolin Individual isletspost-forskolin
0 1 2 30
1
2
0 1 2 3 4 50
1
2
0 1 2 3 4 5 6 7 8 901234
Per
2Luc
Per
2Luc
Clo
ck19
/19
Clock 19/ 19
a
b
c
d
0 2 4 6 822 23 24 25
0
4Per2
0 12 24Rel
ativ
e m
RN
Aab
und
ance
Time of mRNA isolation (ZT)
0
4Bmal1
500 µm
0 12 240
18Rev-erb
0
9Dbp
* * * *0 12 24 0 12 24
* *
Bio
lum
ines
cenc
e10
7 p
ixel
inte
nsity
/72
min
Bio
lum
ines
cenc
e10
7 p
ixel
inte
nsity
/72
min
Time (days) Time (days) Time (days)
Period (h) Damping rate(no. days for 1/e decay)
Time (days) Time (days) Time (days) Time (days)
Bio
lum
ines
cenc
e10
7 p
ixel
inte
nsity
/72
min
Time (days)
Period Damping rate
WT
SCNPituitary
LiverIslets
Figure 1 | Cell autonomous oscillator in pancreas. a, Islets from Per2Luc
mice were imaged, and the orange trace at the right represents thebioluminescence rhythm collected from the islet in the orange square (left).Traces from other islets are shown below. See also Supplementary Movies 1and 2. b, Periods of luminescence and damping rate in multiple tissues(mean 6 s.e.m., n 5 6 mice per genotype). SCN, suprachiasmatic nucleus.c, Whole-field and individual traces from wild-type and ClockD19/D19 islets.The red arrow indicates exposure to 10 mM forskolin for 1 h. d, Oscillation ofclock genes in wild-type (WT) and ClockD19/D19 mutant islets across 24 h(mean 6 s.e.m., n 5 4 mice per genotype per time point, two-way ANOVA,*P , 0.05).
0.5
1.0
1.5
2.0
Insu
lin (n
g m
l–1)
150
175
200
Glu
cose
(mg
dl–1
)
Light
a
Ad libitum insulin
**
Dark
*
b
*
d
Ad libitum glucose
0
100
200
300
400
0 30 60 90 120
c
Glu
cose
(mg
dl–1
)
Time (min)
Glucose tolerance test: glucose levels(ZT14)
500
**
*
0
0.2
0.4
0.6
0.8
1.0
0 5 10 15 20 25 30
* ****In
sulin
(ng
ml–1
)
Time (min)
Glucose tolerance test: insulin levels(ZT14)
WTClock 19/ 19Δ Δ
WTClock 19/ 19Δ Δ
WTClock 19/ 19Δ
WTClock 19/ 19Δ Δ
Δ
P=0.09
P=0.06
P=0.18
P=0.06P=0.47
0–12ZT
12–24
Light Dark0–12 12–24
Light Dark0–12 12–24
Light Dark0–12 12–24
ZT
ZT ZT
Figure 2 | Diabetic phenotypes in 8-month-old circadian mutant mice.a, b, Ad libitum fed glucose (a) and insulin (b) in ClockD19/D19 mice, shown asthe average for time points during the light and dark periods (n 5 17).c, d, Glucose tolerance (c) (n 5 15–18) and insulin secretion (d) (n 5 8–10) inClockD19/D19 mice at ZT14 following intraperitoneal glucose administration of2 or 3 g kg21 body weight, respectively (n 5 15–18). Data were analysed byStudent’s t-test (a, b) and one-way ANOVA (c, d). *P , 0.05; **P , 0.01;***P , 0.001. All values represent mean 6 s.e.m.
LETTERS NATURE | Vol 466 | 29 July 2010
628Macmillan Publishers Limited. All rights reserved©2010

In contrast to 8-month-old ClockD19/D19 mutant mice, we foundthat fasting and fed glucose levels in 3-month-old ClockD19/D19
mutants were normal and that they had enhanced insulin sensitivity,possibly due to clock disruption at the level of either liver, skeletalmuscle or adipose tissue (Supplementary Fig. 4a–f). Nonetheless, iso-lated islets even from young ClockD19/D19 mutant mice displayedimpaired GSIS (Supplementary Fig. 4g). These observations are con-sistent with early onset of a primary islet cell defect that only manifestsas overt diabetes in .8-month-old ClockD19/D19 mutants, probablydue to the gradual onset of insulin resistance during ageing (compareSupplementary Fig. 3c, d and Supplementary Fig. 4e, f), unmaskingthe b-cell defect and thereby resulting in age-associated hyperglycae-mia and hypoinsulinaemia.
Functional defects in insulin secretion have previously been shownto arise because of impairment of genetic pathways that alter isletproliferation and survival17–21. In this regard, although indirectimmunofluorescence revealed normal overall architecture of isletsof ClockD19/D19 mice (Fig. 3c), light microscopy of isolated isletsrevealed that ClockD19/D19 mutant islets were smaller than those ofwild type (Fig. 3d). Total islet area was also reduced by ,20% inClockD19/D19 mice based on morphometric analysis of intact pan-creata, corresponding with a trend towards decreased total pancreaticinsulin content (Supplementary Fig. 5a, b). To determine whetherthe observed decrease in islet size corresponded with decreased isletproliferation, we stained pancreatic sections with the proliferationmarker Ki67. Surprisingly, we found a 23% decrease in proliferationin islets from ClockD19/D19 mutant animals (Fig. 3e), together with atrend towards increased islet apoptosis (Supplementary Fig. 5c).Microarray analysis revealed decreased levels of genes encoding com-ponents of E-box, D-box and ROR transcription modules (Per1,Per3, Rev-erba (also called Nr1d1), Tef, Dbp) (SupplementaryDescription 3, Supplementary Fig. 6b and Supplementary Tables 1and 2). Gene Ontogeny enrichment revealed significant alterations invesicular docking and trafficking factors (including Vamp3 and Stx6)and increases in the cell death factor S100a6 (Supplementary Fig. 7and Supplementary Description 4), consistent with reduced functionand size of islets from ClockD19/D19 mutant mice.
To determine whether the defects of islet function and size areunique to ClockD19/D19 mice, or instead reflect a generalized role forthe core circadian network in islet function, we analysed both GSIS and
islet size in Bmal12/2 mutant mice7. Bmal12/2 islets exhibited up to a60% reduction in insulin secretion compared with littermate controlsin response to glucose, KCl, exendin 4, forskolin and 8-bromo-cAMP(Fig. 3f, g). Furthermore, there was a twofold reduction in the percent-age of large islets in Bmal12/2 mice compared with wild-type litter-mates (Fig. 3d). The similarity of defects in islets from ClockD19/D19
mutant mice and Bmal12/2 mice suggests that multiple core circadiangenes have an impact on b-cell function and development.
To evaluate further the contribution of the pancreatic clock to bothwhole-body glucose metabolism and to islet function, we generatedpancreas-specific Bmal1 mutant mice using the promoter of thehomeodomain transcription factor PDX1 to drive expression of Crerecombinase22,23 (Fig. 4). We performed immunofluorescent stainingto confirm loss of BMAL1 expression specifically within pancreaticislets (Fig. 4a) and not within brain regions such as the suprachiasmaticnucleus, arcuate nucleus, dorsomedial hypothalamus and paraventri-cular nucleus (Fig. 4b and Supplementary Fig. 8). Quantitative real-time PCR analysis of key circadian genes in islet and liver fromPdxCre Bmal1flx/flx (where coding exon 4 of Bmal1 is flanked by loxPsites) and control mice revealed islet-specific alterations in geneexpression profiles (Fig. 4c and Supplementary Description 5), furtherconfirming the specificity of the Bmal1 mutation to the islet. Notably,the pancreas-specific Bmal1 knockout mice showed normal circadianactivity, feeding rhythms and body weight and composition (Sup-plementary Fig. 8b–h). Remarkably, however, we found that 2–4-month-old PdxCre Bmal1flx/flx mice displayed significantly elevatedad libitum glucose levels throughout the day (Fig. 4d), as well asmarkedly impaired glucose tolerance and decreased insulin secretion(Fig. 4e, f, Supplementary Fig. 9c, d and Supplementary Table 3). It isimportant to note that these phenotypes develop in PdxCre Bmal1flx/flx
mice at a young age (2–4 months) compared to the global ClockD19/D19
mutant mice. Furthermore, the impaired glucose tolerance in thepancreas-specific Bmal1 mutant mice was much more pronouncedthan in either the global ClockD19/D19 or Bmal1 nullizygous mice, con-sistent with compensation occurring in the global mutant mice andemphasizing the primary role of the islet clock in maintaining eugly-caemia. Finally, because the pancreas-specific Bmal1 mutant mice havenormal activity and feeding rhythms, as well as normal body weight(Supplementary Fig. 8), the metabolic phenotypes that develop mustbe due to disruption of the clock network within the islet, rather than to
a
d
0
10
20
30
40
50
<5 5–10 10–20 >20
Islet size
0
0.2
0.4
0.6
0.8
1.0
*
Pro
lifer
atio
n (%
isle
t ce
lls)
Islet glucose-stimulated insulin release
Glucose (mM)
0
0.5
1.0
1.5
2.0
2.5
2 5 8 12 20
**
*
e Islet proliferation
**
Islet size (103 μm2)
Islet glucose-stimulated insulin release
0
1
2
3
2 5 8 12 20
*
Glucose (mM)
Insu
lin r
elea
se (%
con
tent
)
f
Ki6
7 st
aini
ng
**
**
Insu
lin r
elea
se (%
con
tent
)
Isle
t si
ze d
istr
ibut
ion
(%)
g Islet insulin release
b Islet insulin release
* **
150
100
50
0
Insu
lin r
elea
se(%
WT
cont
rol)
c Islet histology
WTWT
Insulin DAPI Glucagon
20 μm 20 μm
100 μm100 μm
Exendin 4 Forskolin
20 mM glucose
KCl
2 mM
8-bromo-cAMP
* * *
150
100
50
0Exendin 4 Forskolin
20 mM glucose
KCl
2 mM
8-bromo-cAMP
*
*WT
WT WT
WTBmal1–/–
Bmal1–/–
Insu
lin r
elea
se(%
WT
cont
rol)Clock 19/ 19ΔΔ
Clock 19/ 19ΔΔ
Clock 19/ 19ΔΔ
Clock 19/ 19ΔΔ
Clock 19/ 19ΔΔ
20 μm
20 μm
WTBmal1–/–WT
Clock 19/ 19ΔΔ
Figure 3 | Reduced islet size, proliferation and insulin release in 8–10-month-old circadian mutant mice. a, Glucose-stimulated insulin release inisolated ClockD19/D19 islets compared to similar-sized wild-type islets(n 5 9–10 mice per genotype), normalized to per cent insulin content.b, Insulin secretion from ClockD19/D19 islets in response to secretagogues(n 5 6–14). Insulin release was calculated as in a, and ClockD19/D19 values areexpressed as a percentage of wild type. c, Representative islet morphology inClockD19/D19 and wild-type pancreata (body weight and pancreata weight
were not different). d, Size of islets isolated from ClockD19/D19 and Bmal12/2
mice compared to wild type (n 5 6–9). e, Ki67 staining of islet proliferation(ClockD19/D19 and wild type, n 5 5–6). f, Glucose-stimulated insulinsecretion in Bmal12/2 islets compared to wild type (n 5 5). g, Insulinsecretion from Bmal12/2 islets in response to secretagogues (n 5 6–10). Fiveislets per mouse were analysed in triplicate for each test condition; data wereanalysed by Student’s t-test. *P , 0.05; **P , 0.01; all values representmean 6 s.e.m.
NATURE | Vol 466 | 29 July 2010 LETTERS
629Macmillan Publishers Limited. All rights reserved©2010
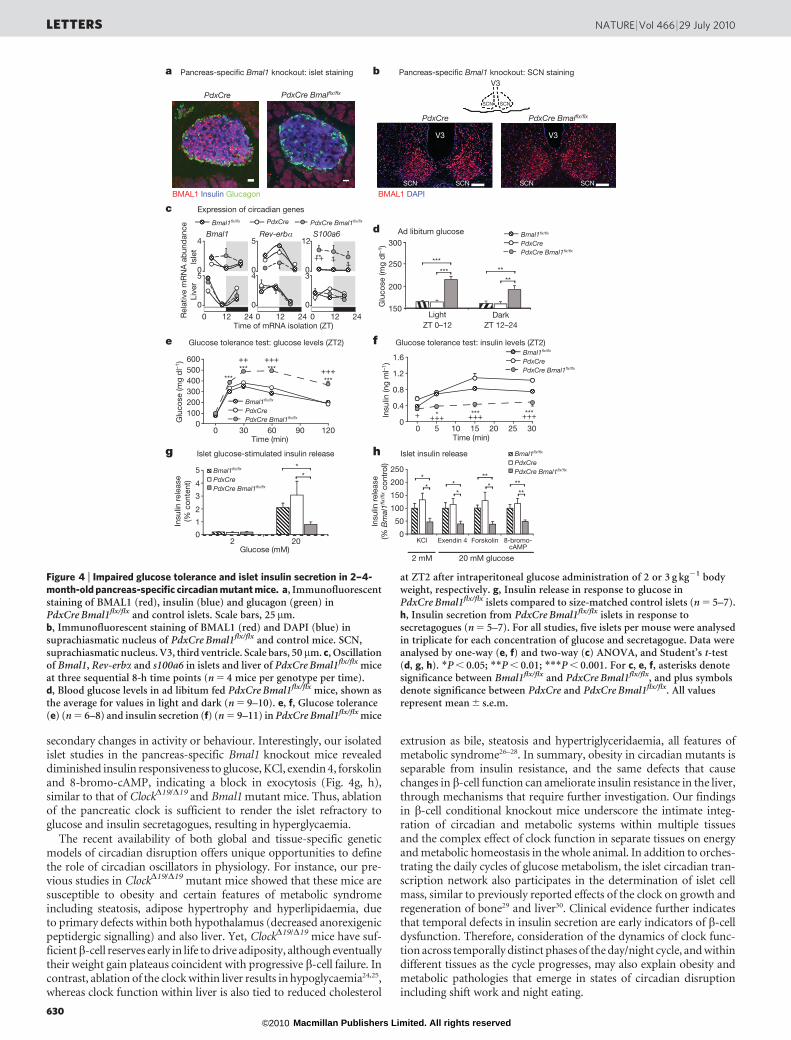
secondary changes in activity or behaviour. Interestingly, our isolatedislet studies in the pancreas-specific Bmal1 knockout mice revealeddiminished insulin responsiveness to glucose, KCl, exendin 4, forskolinand 8-bromo-cAMP, indicating a block in exocytosis (Fig. 4g, h),similar to that of ClockD19/D19 and Bmal1 mutant mice. Thus, ablationof the pancreatic clock is sufficient to render the islet refractory toglucose and insulin secretagogues, resulting in hyperglycaemia.
The recent availability of both global and tissue-specific geneticmodels of circadian disruption offers unique opportunities to definethe role of circadian oscillators in physiology. For instance, our pre-vious studies in ClockD19/D19 mutant mice showed that these mice aresusceptible to obesity and certain features of metabolic syndromeincluding steatosis, adipose hypertrophy and hyperlipidaemia, dueto primary defects within both hypothalamus (decreased anorexigenicpeptidergic signalling) and also liver. Yet, ClockD19/D19 mice have suf-ficientb-cell reserves early in life to drive adiposity, although eventuallytheir weight gain plateaus coincident with progressive b-cell failure. Incontrast, ablation of the clock within liver results in hypoglycaemia24,25,whereas clock function within liver is also tied to reduced cholesterol
extrusion as bile, steatosis and hypertriglyceridaemia, all features ofmetabolic syndrome26–28. In summary, obesity in circadian mutants isseparable from insulin resistance, and the same defects that causechanges inb-cell function can ameliorate insulin resistance in the liver,through mechanisms that require further investigation. Our findingsin b-cell conditional knockout mice underscore the intimate integ-ration of circadian and metabolic systems within multiple tissuesand the complex effect of clock function in separate tissues on energyand metabolic homeostasis in the whole animal. In addition to orches-trating the daily cycles of glucose metabolism, the islet circadian tran-scription network also participates in the determination of islet cellmass, similar to previously reported effects of the clock on growth andregeneration of bone29 and liver30. Clinical evidence further indicatesthat temporal defects in insulin secretion are early indicators of b-celldysfunction. Therefore, consideration of the dynamics of clock func-tion across temporally distinct phases of the day/night cycle, and withindifferent tissues as the cycle progresses, may also explain obesity andmetabolic pathologies that emerge in states of circadian disruptionincluding shift work and night eating.
Pancreas-specific Bmal1 knockout: islet staining b
d
Glu
cose
(mg
dl–1
)
150
250
300
200
Light Dark
Ad libitum glucose
ZT 0–12 ZT 12–24
c
PdxCre Bmal1flx/flx
Bmal1flx/flx
PdxCre
e fGlucose tolerance test: glucose levels (ZT2)
0100200
400500
0 30 60 90
Glu
cose
(mg
dl–1
)
Time (min)
600
120
300
0
0.4
0.8
1.6
0 5 10 15 20 25 30
***Insu
lin (n
g m
l–1)
Time (min)
Glucose tolerance test: insulin levels (ZT2)
1.2
+++PdxCre Bmal1flx/flx
Bmal1flx/flx
PdxCre
PdxCre Bmal1flx/flxBmal1flx/flx PdxCre
PdxCre Bmal1flx/flx
Bmal1flx/flx
PdxCre
g Islet glucose-stimulated insulin release
Glucose (mM)
0
1
2
3
4
5
Insu
lin r
elea
se(%
con
tent
) PdxCreBmal1flx/flx
PdxCre Bmal1flx/flx
h Islet insulin release
Expression of circadian genes
Insu
lin r
elea
se(%
Bm
al1flx
/flx
cont
rol) PdxCre
Bmal1flx/flx
PdxCre Bmal1flx/flx250
200
150
100
50
0Exendin 4 Forskolin
20 mM glucose
KCl
2 mM
8-bromo-cAMP
PdxCre Bmalflx/flxPdxCre
PdxCre Bmalflx/flxPdxCre
a
BMAL1 Insulin Glucagon BMAL1 DAPI
0
4
0
5
Bmal1
0
5
0
4
Rev-erbα
0 12 24 0 12 24 0 12 24Rel
ativ
e m
RN
A a
bun
dan
ce
Time of mRNA isolation (ZT)
0
12
0
3
S100a6
Live
rIs
let
SCN SCN SCN SCN
V3 V3
Pancreas-specific Bmal1 knockout: SCN staining
SCN SCN
V3
*+*+**++
***+++*++++
****** **
**
******
****
*
**
***+++***
+++***++
***
2 20
Figure 4 | Impaired glucose tolerance and islet insulin secretion in 2–4-month-old pancreas-specific circadian mutant mice. a, Immunofluorescentstaining of BMAL1 (red), insulin (blue) and glucagon (green) inPdxCre Bmal1flx/flx and control islets. Scale bars, 25 mm.b, Immunofluorescent staining of BMAL1 (red) and DAPI (blue) insuprachiasmatic nucleus of PdxCre Bmal1flx/flx and control mice. SCN,suprachiasmatic nucleus. V3, third ventricle. Scale bars, 50mm. c, Oscillationof Bmal1, Rev-erba and s100a6 in islets and liver of PdxCre Bmal1flx/flx miceat three sequential 8-h time points (n 5 4 mice per genotype per time).d, Blood glucose levels in ad libitum fed PdxCre Bmal1flx/flx mice, shown asthe average for values in light and dark (n 5 9–10). e, f, Glucose tolerance(e) (n 5 6–8) and insulin secretion (f) (n 5 9–11) in PdxCre Bmal1flx/flx mice
at ZT2 after intraperitoneal glucose administration of 2 or 3 g kg21 bodyweight, respectively. g, Insulin release in response to glucose inPdxCre Bmal1flx/flx islets compared to size-matched control islets (n 5 5–7).h, Insulin secretion from PdxCre Bmal1flx/flx islets in response tosecretagogues (n 5 5–7). For all studies, five islets per mouse were analysedin triplicate for each concentration of glucose and secretagogue. Data wereanalysed by one-way (e, f) and two-way (c) ANOVA, and Student’s t-test(d, g, h). *P , 0.05; **P , 0.01; ***P , 0.001. For c, e, f, asterisks denotesignificance between Bmal1flx/flx and PdxCre Bmal1flx/flx, and plus symbolsdenote significance between PdxCre and PdxCre Bmal1flx/flx. All valuesrepresent mean 6 s.e.m.
LETTERS NATURE | Vol 466 | 29 July 2010
630Macmillan Publishers Limited. All rights reserved©2010
METHODS SUMMARYIslet isolation and in vitro insulin secretion analysis. Pancreatic islets were
isolated and secretion assays performed as described in Supplementary
Information. Briefly, for insulin release, five islets were statically incubated in
Krebs-Ringer buffer and stimulated for 1 h at 37 uC with various glucose con-
centrations, 30 mM KCl, 100 nM exendin 4, 2.5mM forskolin, or 1 mM
8-bromo-cAMP.
Circadian expression of PER2–LUC. Bioluminescence from Per2Luc and
Per2Luc ClockD19/D19 islets was continuously imaged using an XR/MEGA-10Z
cooled CCD camera, as islets were cultured at 37 uC in a Lucite environmentally
controlled chamber (full details in Supplementary Information). Period anddamping rate were calculated using Lumicycle Analysis software (Actimetrics).
Received 13 October 2009; accepted 10 June 2010.Published online 18 June 2010.
1. Green, C. B., Takahashi, J. S. & Bass, J. The meter of metabolism. Cell 134,728–742 (2008).
2. Panda, S. et al. Coordinated transcription of key pathways in the mouse by thecircadian clock. Cell 109, 307–320 (2002).
3. Rutter, J., Reick, M. & McKnight, S. L. Metabolism and the control of circadianrhythms. Annu. Rev. Biochem. 71, 307–331 (2002).
4. Polonsky, K. S. et al. Abnormal patterns of insulin secretion in non-insulin-dependent diabetes mellitus. N. Engl. J. Med. 318, 1231–1239 (1988).
5. King, D. P. et al. Positional cloning of the mouse circadian clock gene. Cell 89,641–653 (1997).
6. Turek, F. W. et al. Obesity and metabolic syndrome in circadian Clock mutantmice. Science 308, 1043–1045 (2005).
7. Bunger, M. K. et al. Mop3 is an essential component of the master circadianpacemaker in mammals. Cell 103, 1009–1017 (2000).
8. Lowrey, P. L. & Takahashi, J. S. Mammalian circadian biology: elucidating genome-wide levels of temporal organization. Annu. Rev. Genomics Hum. Genet. 5, 407–441(2004).
9. Kornmann, B. et al. System-driven and oscillator-dependent circadian transcriptionin mice with a conditionally active liver clock. PLoS Biol. 5, e34 (2007).
10. McCarthy, J. J. et al. Identification of the circadian transcriptome in adult mouseskeletal muscle. Physiol. Genomics 31, 86–95 (2007).
11. Storch, K. F. et al. Extensive and divergent circadian gene expression in liver andheart. Nature 417, 78–83 (2002).
12. Yang, X. et al. Nuclear receptor expression links the circadian clock tometabolism. Cell 126, 801–810 (2006).
13. Balsalobre, A., Damiola, F. & Schibler, U. A serum shock induces circadian geneexpression in mammalian tissue culture cells. Cell 93, 929–937 (1998).
14. Yoo, S. H. et al. PERIOD2::LUCIFERASE real-time reporting of circadian dynamicsreveals persistent circadian oscillations in mouse peripheral tissues. Proc. NatlAcad. Sci. USA 101, 5339–5346 (2004).
15. Yamazaki, S. et al. Resetting central and peripheral circadian oscillators intransgenic rats. Science 288, 682–685 (2000).
16. Drucker, D. J. The biology of incretin hormones. Cell Metab. 3, 153–165 (2006).17. Gao, N. et al. Foxa2 controls vesicle docking and insulin secretion in mature b cells.
Cell Metab. 6, 267–279 (2007).18. Rulifson, I. C. et al. Wnt signaling regulates pancreatic b cell proliferation. Proc.
Natl Acad. Sci. USA 104, 6247–6252 (2007).19. Shih, D. Q. et al. Loss of HNF-1a function in mice leads to abnormal expression of
genes involved in pancreatic islet development and metabolism. Diabetes 50,2472–2480 (2001).
20. Stoffers, D. A. et al. Insulinotropic glucagon-like peptide 1 agonists stimulateexpression of homeodomain protein IDX-1 and increase islet size in mousepancreas. Diabetes 49, 741–748 (2000).
21. Withers, D. J. et al. Disruption of IRS-2 causes type 2 diabetes in mice. Nature 391,900–904 (1998).
22. Gu, G., Dubauskaite, J. & Melton, D. A. Direct evidence for the pancreatic lineage:NGN31 cells are islet progenitors and are distinct from duct progenitors.Development 129, 2447–2457 (2002).
23. Westgate, E. J. et al. Genetic components of the circadian clock regulatethrombogenesis in vivo. Circulation 117, 2087–2095 (2008).
24. Lamia, K. A., Storch, K. F. & Weitz, C. J. Physiological significance of a peripheraltissue circadian clock. Proc. Natl Acad. Sci. USA 105, 15172–15177 (2008).
25. Rudic, R. D. et al. BMAL1 and CLOCK, two essential components of the circadianclock, are involved in glucose homeostasis. PLoS Biol. 2, e377 (2004).
26. Duez, H. et al. Regulation of bile acid synthesis by the nuclear receptor Rev-erba.Gastroenterology 135, 689–698 (2008).
27. Noshiro, M. et al. Multiple mechanisms regulate circadian expression of the genefor cholesterol 7a-hydroxylase (Cyp7a), a key enzyme in hepatic bile acidbiosynthesis. J. Biol. Rhythms 22, 299–311 (2007).
28. Kudo, T., Kawashima, M., Tamagawa, T. & Shibata, S. Clock mutation facilitatesaccumulation of cholesterol in the liver of mice fed a cholesterol and/or cholicacid diet. Am. J. Physiol. Endocrinol. Metab. 294, E120–E130 (2008).
29. Fu, L. et al. The molecular clock mediates leptin-regulated bone formation. Cell122, 803–815 (2005).
30. Matsuo, T. et al. Control mechanism of the circadian clock for timing of celldivision in vivo. Science 302, 255–259 (2003).
Supplementary Information is linked to the online version of the paper atwww.nature.com/nature.
Acknowledgements We thank F. Turek, R. Allada and G. Bell for discussions andcomments on the manuscript. We thank A. Kohsaka, E. Chen, J. Doering andC. Radosevich for their technical support, as well as the Biological Imaging Facilityat Northwestern University and the Islet Biology Core of the University of ChicagoDRTC. We thank D. Melton for the PdxCre mice. Work was supported by grantsfrom the National Institute of Diabetes and Digestive and Kidney Diseases toK.M.R. and L.H.P.; the National Institutes of Health, Chicago BiomedicalConsortium Searle Funds, and Juvenile Diabetes Research Foundation to J.B.; grantR37-ES-005703 from the National Institutes of Health to C.A.B.; and the NationalInstitute of Mental Health to J.S.T.
Author Contributions B.M. performed and analysed most of the experiments inthis study, with technical assistance from Y.K., G.I., S.M. and C.O. E.D.B. and C.H.K.conducted and analysed real-time bioluminescence imaging experiments inisolated pancreatic islets. H.S. conducted immunostaining experiments. M.H.V.performed statistical analysis. J.P.L. conducted and analysed Ca21 influxexperiments. S.D.C. and L.J. performed statistical and gene ontogeny analysis ofmicroarray data. C.A.B. provided Bmal1flx/flx mice. J.S.T., L.H.P., X.W., K.M.R., B.M.and J.B. provided critical intellectual input in the preparation of the manuscript.K.M.R., B.M., J.S.T. and J.B. wrote the paper.
Author Information Reprints and permissions information is available atwww.nature.com/reprints. The authors declare competing financial interests:details accompany the full-text HTML version of the paper at www.nature.com/nature. Readers are welcome to comment on the online version of this article atwww.nature.com/nature. Correspondence and requests for materials should beaddressed to J.B. ([email protected]).
NATURE | Vol 466 | 29 July 2010 LETTERS
631Macmillan Publishers Limited. All rights reserved©2010


![Research Paper The Circadian Clock Gene Bmal1 Controls ... · embryonic factor) and DBP (D-site binding protein) as well as E4BP4 (E4 promoter-binding protein 4)] ... influencing](https://static.fdocuments.us/doc/165x107/604a8989f9ae380cc8298336/research-paper-the-circadian-clock-gene-bmal1-controls-embryonic-factor-and.jpg)

![BMAL1 dependent regulation of the mTOR signaling pathway ... · premature aging phenotype [13], are the most striking example of this. The circadian clock controls glucose and lipid](https://static.fdocuments.us/doc/165x107/5e1bcdd291254169812809d2/bmal1-dependent-regulation-of-the-mtor-signaling-pathway-premature-aging-phenotype.jpg)


