Disruption and Resilience: How Organisations coped with ... · Disruption and Resilience: How...
45
ECONOMICS of RESILIENT INFRASTRUCTURE e Economics of Resilient Infrastructure programme is a collaborative New Zealand Government funded research programme between the following people and organisations: Simon Worthington Tony Fenwick Disruption and Resilience: How Organisations coped with the Canterbury Earthquakes E. Seville S. Giovinazzi J. Stevenson J. Vargo C. Brown ERI Research Report 2014/002 December 2014
Transcript of Disruption and Resilience: How Organisations coped with ... · Disruption and Resilience: How...

ECONOMICS of RESILIENT INFRASTRUCTURE
The Economics of Resilient Infrastructure programme is a collaborative New Zealand Government funded research programme between the following people and organisations:
Simon Worthington
Tony Fenwick
Disruption and Resilience: How Organisationscoped with the Canterbury Earthquakes
E. SevilleS. Giovinazzi
J. StevensonJ. Vargo
C. Brown
ERI Research Report 2014/002December 2014
FOREWORD
Building resilience into economic systems is critical to the stability and prosperity of modern nations. This report is part of a programme of research initiated to improve the resilience of New Zealand’s economy.
Many regions in New Zealand have economic models suitable for forecasting economic development under ‘business-as-usual’ conditions. None, however, have the capability to model the impact of transformational ‘shocks’ to the economy caused by major events and infrastructure failures. The Economics of Resilient Infrastructure (ERI) project is developing a new suite of tools called MERIT that will provide a better understanding of the economic implications of infrastructure failure. MERIT will enable users to assess the nature and scale of infrastructure failure impacts on an economy. It will enable decision makers to explore beyond the initial response to an event and consider the often neglected dynamics of resilient recovery.
It is natural when modelling an economy to think at an aggregated level, and yet when an economy has experienced a significant ‘shock’, the movement, investment, and innovation that shape recovery processes emerge at an organisational level. Businesses, governments and community service providers are the actors-on-the-ground that experience the impacts of infrastructure failures and other physical disruptions. It is their responses, decisions, and adaptive behaviours that collectively shape the path of economic recovery and patterns of future growth or decline.
The research presented here examines how organisations mitigated, responded, and ultimately recovered from the disruptions caused by the Canterbury earthquakes. This study contributes to our understanding of how business behaviours shape economic trends post-disaster. It provides the first steps in identifying the ways in which we need to adapt our economic models to better reflect the realities of an economy recovering from disruption.
Organisations that are resilient are better able to cope with disruptions and can thrive through times of adversity. Resilient organisations are critical building blocks in economic resilience. Earlier research conducted by Resilient Organisations identified the key attributes that enable an organisation’s resilience including its’ organisational culture and leadership, the networks it can draw on for support, and an attitude and strategic positioning that is change-ready. Collecting data from 541 organisations in the Greater Christchurch area, this research has found evidence that organisations with these resilience attributes were better prepared, could function for longer with disrupted services, and were more likely to be able to meet customer demand a year after the 22nd February, 2011 Christchurch earthquake.
The business behaviours component of the MERIT model demonstrates that resilient organisations are necessary for the economic stability and prosperity of New Zealand’s regions. However, organisations have a range of capacities to deal with disruptions. This research also demonstrates the importance of resilient infrastructure in decreasing the disruptions that organisations do face. Organisations experiencing infrastructure disruptions following the Canterbury earthquakes suffered reduced productivity and tended to close for longer. Through this Economics of Resilient Infrastructure research programme it is hoped that the MERIT tool, will substantially improve our analysis capability for evaluating and making the case for investing in greater infrastructure resilience. Malcolm Alexander Chief Executive Local Government New Zealand
CONTENTS
INTRODUCTION ...................................................................................................................... 4
1.1 PROJECT BACKGROUND ...................................................................................... 4
1.2 THE CANTERBURY EARTHQUAKES: EVENT OVERVIEW ........................................... 5
2.0 SURVEY OVERVIEW ................................................................................................... 7
3.0 PATHWAYS TO DISRUPTION .................................................................................... 9
3.1 CAUSES OF DISRUPTION ...................................................................................... 9
3.2 EFFECTS OF DISRUPTION .................................................................................. 12
4.0 PATHWAYS TO RESILIENCE ................................................................................... 15
4.1 REDUCING IMPACTS .......................................................................................... 16
4.2 RECAPTURING PRODUCTIVITY ............................................................................ 18
4.3 ADAPTING TO NEW ENVIRONMENTS .................................................................... 19
4.4 RELATIVE RESILIENCE ....................................................................................... 20
5.0 CONCLUSIONS ......................................................................................................... 24
6.0 WHERE TO FROM HERE? INTEGRATING BUSINESS BEHAVIOUR INTO THE MERIT MODEL .................................................................................................. 26
7.0 REFERENCES ........................................................................................................... 28
8.0 ABOUT THE TEAM .................................................................................................... 29
8.1 ECONOMICS OF RESILIENT INFRASTRUCTURE (ERI) PROJECT ............................ 29
8.2 RESILIENT ORGANISATIONS (RESORGS) ............................................................ 29
APPENDIX 1: SECTORAL REPRESENTATION .................................................................. 30
APPENDIX 2: BUSINESS BEHAVIOURS SURVEY ............................................................. 31
KEYWORDS: Christchurch earthquakes; infrastructure failure; business disruption; organisations; businesses; resilience; economic recovery.
DISCLAIMER
This report has been prepared by the Economics of Resilient Infrastructure (ERI) Research Programme as part of a collaborative research programme funded by the New Zealand
Government.
Unless otherwise agreed in writing by ERI, the ERI collaborators accept no responsibility
for any use of, or reliance on any contents of this Report by any person or organisation and shall not be liable to any person or organisation, on any ground, for any loss, damage or expense arising from such use or reliance.
Contact organisation for inquiries and correspondence is GNS Science Ltd, 1 Fairway Drive, Avalon, PO Box 30368, Lower Hutt 5040.
4
INTRODUCTION
Within an economy, businesses, governments and community service providers are the actors-on-the-ground that experience the direct and indirect impacts of infrastructure failures. They are the actors whose responses, decisions, and adaptive behaviours collectively shape the path of economic recovery and patterns of growth and decline. Examining the responses of public and private organisations to major disruptions provides important insights into how local and regional economies fare in the aftermath of these events.
This report presents key findings from a study conducted by Resilient Organisations as part of the Economics of Resilient Infrastructure (ERI) project. The research presented here examines how organisations in Canterbury, New Zealand were impacted by a complex series of earthquakes; how they mitigated those disruptions and recovered their productive capacity; and the ways in which they adapted to facilitate continued and, in some cases, improved functioning.
1.1 PROJECT BACKGROUND
The Economics of Resilient Infrastructure (ERI) research project is funded by the New Zealand government to develop a new spatial decision support system for New Zealand. The system, referred to as ‘Measuring the Economics of Resilient Infrastructure Tool’ (MERIT), will be used to support government and infrastructure provider decision-making by enhancing their understanding of the societal value of resilience improvements.
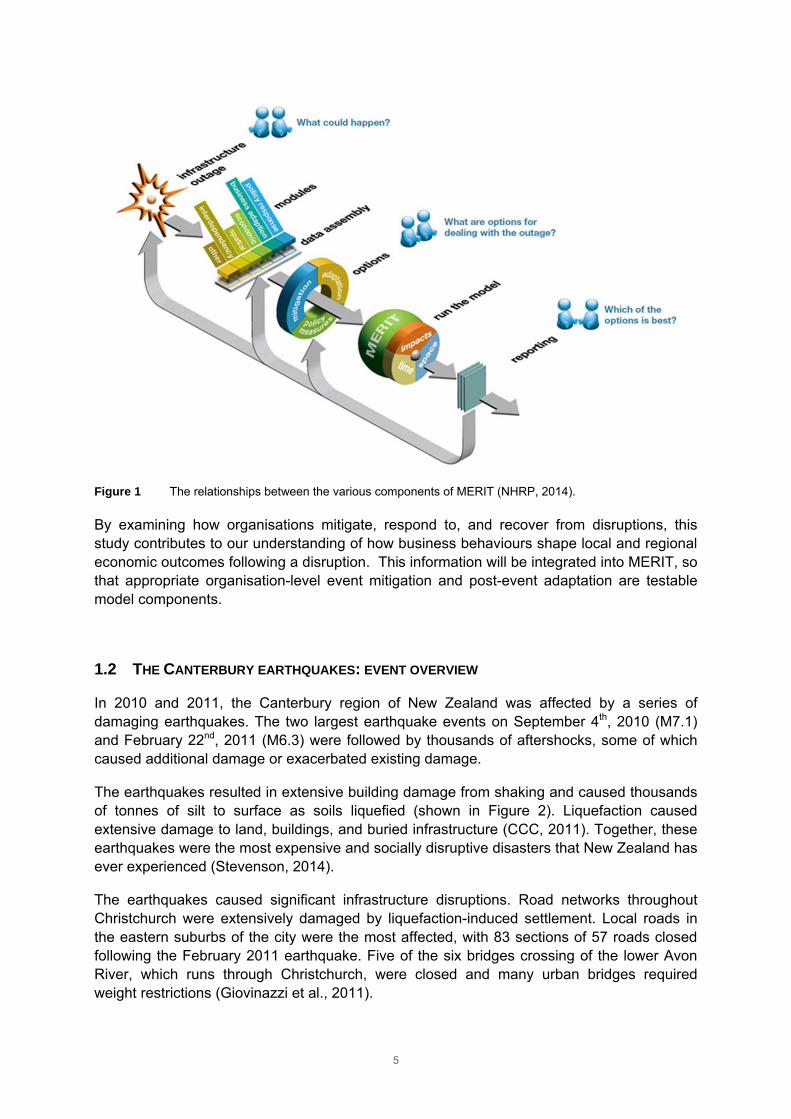
MERIT consists of a suite of interlinked modules incorporating spatial features of a region and its infrastructure networks, economic activity, business behaviours, interdependencies, and policy options (Figure 1). These modules can be shocked using scenarios (e.g. volcanic eruption, significant single infrastructure outage) to understand the impacts of such disruptions.
This report summarises a study of organisations affected by the 2010/2011 Canterbury earthquakes used to inform the business behaviours module. The study examined pre- and post-event behaviours that contributed to the recovery of organisations that were affected by a significant shock.
5
Figure 1 The relationships between the various components of MERIT (NHRP, 2014).
By examining how organisations mitigate, respond to, and recover from disruptions, this study contributes to our understanding of how business behaviours shape local and regional economic outcomes following a disruption. This information will be integrated into MERIT, so that appropriate organisation-level event mitigation and post-event adaptation are testable model components.
1.2 THE CANTERBURY EARTHQUAKES: EVENT OVERVIEW
In 2010 and 2011, the Canterbury region of New Zealand was affected by a series of damaging earthquakes. The two largest earthquake events on September 4th, 2010 (M7.1) and February 22nd, 2011 (M6.3) were followed by thousands of aftershocks, some of which caused additional damage or exacerbated existing damage.
The earthquakes resulted in extensive building damage from shaking and caused thousands of tonnes of silt to surface as soils liquefied (shown in Figure 2). Liquefaction caused extensive damage to land, buildings, and buried infrastructure (CCC, 2011). Together, these earthquakes were the most expensive and socially disruptive disasters that New Zealand has ever experienced (Stevenson, 2014).
The earthquakes caused significant infrastructure disruptions. Road networks throughout Christchurch were extensively damaged by liquefaction-induced settlement. Local roads in the eastern suburbs of the city were the most affected, with 83 sections of 57 roads closed following the February 2011 earthquake. Five of the six bridges crossing of the lower Avon River, which runs through Christchurch, were closed and many urban bridges required weight restrictions (Giovinazzi et al., 2011).

6
The power, water, and wastewater distribution networks were also badly affected. Substantial ground deformation induced by the earthquakes caused multiple faults in the underground electricity distribution networks, leading to major power outages. About 30% of water and wastewater pipes suffered extensive damage, inducing severe and prolonged disruption to these services (Giovinazzi et al., 2011).
Figure 2 (Left) Liquefaction silt and sands emerge from around a light pole in Christchurch; (Right) Damage to unreinforced masonry facade of commercial building – a common sight in the Christchurch CBD after the earthquakes (Photo Credit: Matthew Hughes).
The February 22nd, 2011 earthquake left approximately 50% of the city without water. The service was re-established to over 95% of occupied units within a month; however, a boil order remained in-place for most of the city for over six weeks, because of the risk of contamination. The city also issued water conservation orders due to the damage to key water reservoirs and the loss of many groundwater pumping wells.
Wastewater services were also heavily impacted; 60% of occupied units had services restored one month after the earthquake. Due to severe damage at the main wastewater treatment plant for Christchurch, raw sewage was disposed in rivers and estuaries for months following the earthquakes (Eidinger, Tang, & Rourke, 2010).

7
2.0 SURVEY OVERVIEW
Between July and December 2013 ERI researchers sampled approximately 2,170 organisations across Greater Christchurch – which includes the Christchurch City, Waimakariri District, and Selwyn District Council areas (see Figure 3). In total, 541 organisations responded to the survey (a response rate of about 25%). A copy of the survey is included in Appendix 2.
Figure 3 The district council areas within Canterbury most affected by the 2010/2011 earthquakes.
Organisations included in our sample, belonged to at least one of 17 industry sectors. These sectors represent the vast majority of industries operating in Canterbury, although not all sectors are proportionally represented in the sample. (For a list of the sectors and comparisons of the response rates for each sector and the proportion of the sector in the Canterbury economy see Appendix 1.)
Organisations included in our sample had an average of 83 full-time equivalent employees with a median of eight. This indicates our sample may represent slightly larger organisations, than the New Zealand or Canterbury business populations overall.
Approximately 1% of the survey respondents indicated that their organisation had ceased to exist at the time of the survey. Business death rates since the earthquakes do not differ significantly from pre-earthquake rates, as shown in Table 1. The average annual business death rates in Canterbury since the earthquakes have been just under 10% (Statistics New Zealand, 2014). Nearly 9% of survey respondents reported that their organisation was either

8
not trading or still in survival mode following the earthquakes (Figure 4b). This proportion is in line with typical death-rates for organisations (Table 1).
Table 1 Business death rates in Canterbury over the last 5 years.
Year
Total number business
‘geographic units’ in
Canterbury*
Total number of business
‘geographic unit’ deaths
in Canterbury*
Percentage of business
‘geographic unit’ deaths.
2009 65,598 6,498 9.9%
2010 65,024 6,750 10.4%
2011 64,529 6,243 9.7%
2012 64,091 6,468 10.1%
2013 64,849 5,877 9.1%
Average 64,818 6,367 9.8%
* Data from Statistics New Zealand. A ‘geographic unit’ is a separate operating unit engaged in New Zealand in one, or predominantly one, kind of economic activity from a single physical location or base(Statistics New Zealand, 2014).
Overall, we found that organisations were recovering well from the Canterbury earthquakes at the time of the survey (2013), and many have experienced improved performance in the aftermath of the disaster.
About 40% of organisations reported that they were better off following the earthquakes (Figure 4a), and 27% reported that the earthquakes had been positive for their organisation (Figure 4b). About 25% of organisations said they were doing about the same as they were before the earthquakes.
Figure 4(a) Organisations’ self-assessed situation at the time of surveying compared to before the earthquakes (b): Organisations’ state of recovery at the time of surveying.
Additionally, about 89% of organisations reported that their cashflow was excellent, good, or satisfactory, and 94% were breaking-even or better in terms of their profitability.

9
3.0 PATHWAYS TO DISRUPTION
We asked organisations about the degree to which they had been disrupted by different factors. These factors fall into four categories: 1) physical impacts to the organisations’ stock or assets; 2) disruption to the organisations’ external neighbourhood or environment; 3) staff, market, and supply chain disruptions; and 4) lifeline utility supply disruptions.
Their responses are shown in Table 2 and Figure 6, plotted on a scale from 0 to 1, with 0 being “not disruptive” and 1 being “very disruptive”.1 We also asked organisations’ how long they experienced disruption from each infrastructure type, reporting whether outages (or service reductions) lasted for hours, days, weeks, or months.2
3.1 CAUSES OF DISRUPTION
Interestingly, even given the extensive levels of physical damage and disruption that organisations experienced, it was staff and market-based issues that organisations found to be most disruptive (Table 2).
The single most disruptive factor for organisations was “customer issues.” The survey allowed organisations to define customer issues for themselves, but it could include anything from delayed payments to customers relocating due to residential damage.
Issues regarding staff wellbeing were also especially disruptive for organisations. Common staff or human resourcing issues after the earthquake included: (1) difficulties finding qualified or suitable staff; (2) the additional burden of managing and supporting staff; and (3) reduced productivity due to staff being stressed, emotionally drained, and burnt out.
Organisations were also seriously disrupted as a result of damage to their buildings, the buildings in their neighbourhood, as well as people’s perceptions that their buildings were unsafe.
1 Organisations reported the degree to which each factor disrupted their ability to operate on a four-point scale
from very disruptive to not disruptive. The responses are scored evenly along a normal scale (0-1) and averaged. 2 Response options were “N/A”, “Hours”, “Days”, “Weeks”, and “Months”. Responses were coded in the
following way: hours (0.01), days (0.03), weeks (0.23), and months (1).
The most disruptive factor for organisations following the
earthquakes was customer-related issues.
Difficulties managing staff wellbeing were also especially disruptive for
organisations.
Organisations experiencing infrastructure disruptions suffered reduced productivity and tended to
close for longer. .

10
Table 2 Disruption factors and mean degrees of disruption (normalised from 0–1).
Disruption
Category Mean degrees of disruption
Physical
damage
Average disruption for physical damage 0.34
External
environment
disruptions
Average disruption for external environment 0.36
Staff and
market
disruptions
Average disruption for staff and market 0.40
0.42
0.35
0.35
0.35
0.29
0.25
0 0.2 0.4 0.6
Structural damage to buildings
Non‐structural damage to buildings
Damage to inventory or stock
Difficulty accessing IT data
Office equipment loss or damage
Machinery loss or damage
0.44
0.38
0.33
0.3
0 0.2 0.4 0.6
Damage to local neighbourhood
Difficulty accessing premises/ site
Damage to ground surface
Damage to or closure of adjacentorganisations or buildings
0.53
0.5
0.4
0.34
0.34
0.31
0 0.1 0.2 0.3 0.4 0.5 0.6
Customer issues
Changes in staff emotional wellbeing
Perceptions of building safety
Health and safety issues for employees
Supplier issues
Availability of staff
11
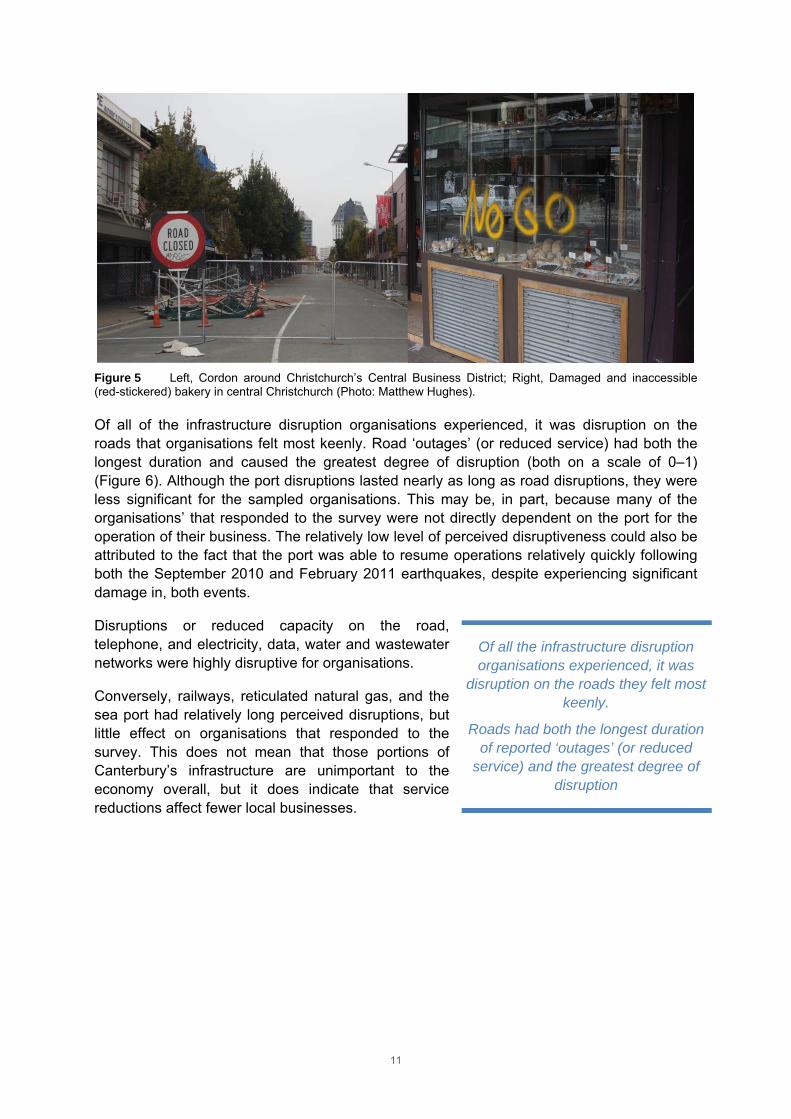
Figure 5 Left, Cordon around Christchurch’s Central Business District; Right, Damaged and inaccessible (red-stickered) bakery in central Christchurch (Photo: Matthew Hughes).
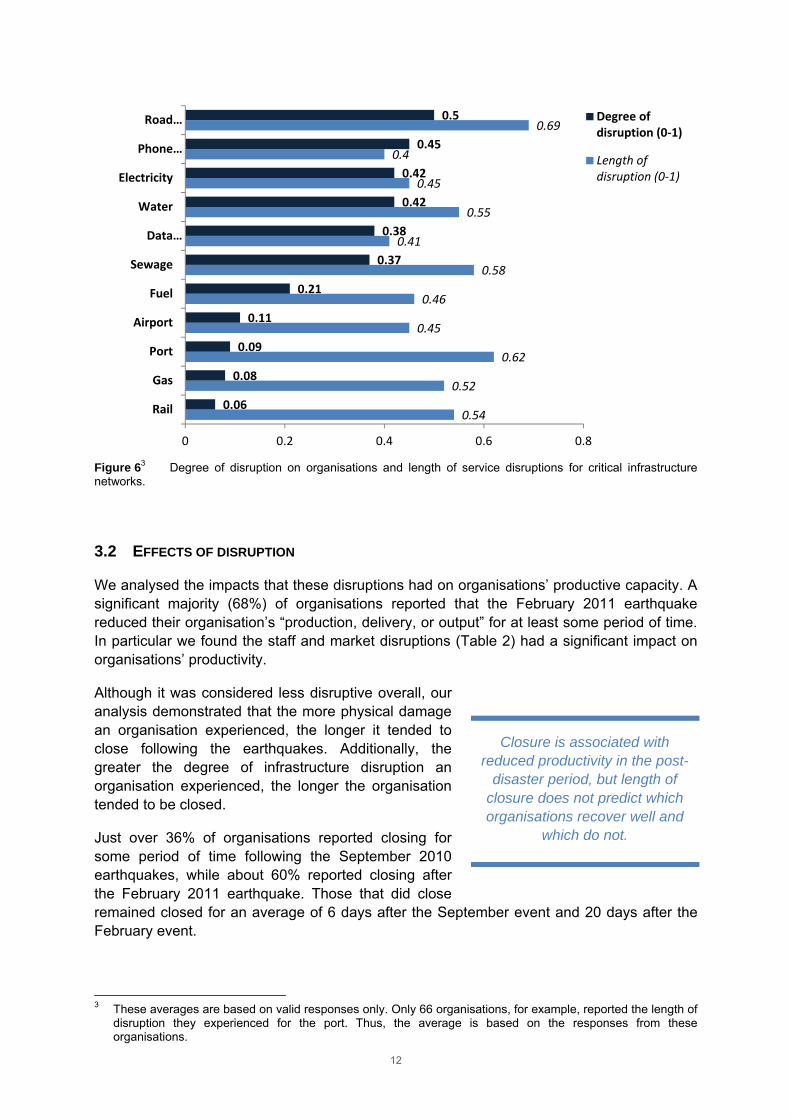
Of all of the infrastructure disruption organisations experienced, it was disruption on the roads that organisations felt most keenly. Road ‘outages’ (or reduced service) had both the longest duration and caused the greatest degree of disruption (both on a scale of 0–1) (Figure 6). Although the port disruptions lasted nearly as long as road disruptions, they were less significant for the sampled organisations. This may be, in part, because many of the organisations’ that responded to the survey were not directly dependent on the port for the operation of their business. The relatively low level of perceived disruptiveness could also be attributed to the fact that the port was able to resume operations relatively quickly following both the September 2010 and February 2011 earthquakes, despite experiencing significant damage in, both events.
Disruptions or reduced capacity on the road, telephone, and electricity, data, water and wastewater networks were highly disruptive for organisations.
Conversely, railways, reticulated natural gas, and the sea port had relatively long perceived disruptions, but little effect on organisations that responded to the survey. This does not mean that those portions of Canterbury’s infrastructure are unimportant to the economy overall, but it does indicate that service reductions affect fewer local businesses.
Of all the infrastructure disruption organisations experienced, it was
disruption on the roads they felt most keenly.
Roads had both the longest duration of reported ‘outages’ (or reduced
service) and the greatest degree of disruption
12
Figure 63 Degree of disruption on organisations and length of service disruptions for critical infrastructure networks.
3.2 EFFECTS OF DISRUPTION
We analysed the impacts that these disruptions had on organisations’ productive capacity. A significant majority (68%) of organisations reported that the February 2011 earthquake reduced their organisation’s “production, delivery, or output” for at least some period of time. In particular we found the staff and market disruptions (Table 2) had a significant impact on organisations’ productivity.
Although it was considered less disruptive overall, our analysis demonstrated that the more physical damage an organisation experienced, the longer it tended to close following the earthquakes. Additionally, the greater the degree of infrastructure disruption an organisation experienced, the longer the organisation tended to be closed.
Just over 36% of organisations reported closing for some period of time following the September 2010 earthquakes, while about 60% reported closing after the February 2011 earthquake. Those that did close remained closed for an average of 6 days after the September event and 20 days after the February event.
3 These averages are based on valid responses only. Only 66 organisations, for example, reported the length of
disruption they experienced for the port. Thus, the average is based on the responses from these organisations.
0.54
0.52
0.62
0.45
0.46
0.58
0.41
0.55
0.45
0.4
0.69
0.06
0.08
0.09
0.11
0.21
0.37
0.38
0.42
0.42
0.45
0.5
0 0.2 0.4 0.6 0.8
Rail
Gas
Port
Airport
Fuel
Sewage
Data…
Water
Electricity
Phone…
Road… Degree ofdisruption (0‐1)
Length ofdisruption (0‐1)
Closure is associated with reduced productivity in the post-
disaster period, but length of closure does not predict which organisations recover well and
which do not.

13
Closure is associated with reduced productivity in the post-disaster period. Organisations that closed temporarily (after the February 2011 earthquake) were significantly more likely to experience reduced productivity. Those that remained open immediately after the earthquake, and those that operated longer hours, were significantly more likely to not experience productivity reductions. However, our analysis revealed that length of closure does not predict which organisations recover well and which do not.
Loss of infrastructure services had a noticeable impact on productivity, regardless of length of closure. This was especially true for organisations that experienced water, sewage, electricity, phone, data, and road disruptions. These organisations were significantly more likely to experience reduced productivity compared to organisations that did not experience those disruptions. The greater the degree of infrastructure disruption the longer organisations were closed.
In addition to affecting their productive capacity, the earthquakes also caused shifts in demand for organisations’ products and services (Figure 7).
Figure 7 Post-earthquake demand changes over time
Immediately after the earthquakes, 42% of organisations in our sample experienced reduced demand for their products or services, while 20 and 35% experienced no change and increased demand respectively. This pattern changed significantly when looking at customer demand two years after the February 2011 earthquake. Two years on, 20% of organisations in our sample had decreased demand, while 33 and 44% saw no change and increased demand respectively.
0%
5%
10%
15%
20%
25%
30%
35%
40%
45%
50%
Organ
isations in sam
ple
Amount of time after the September 2010 earthquake
Decreaseddemand
About the samedemand
Increaseddemand

14
Supply chain resilience matters. Organisations whose suppliers were
disrupted were significantly more likely to experience reduced productivity than
organisations that did not face supplier issues.
Disruptions flowed through organisations’ supply chains. Although about 93% of organisations had suppliers that were somewhat or completely capable of meeting the organisations’ needs (Figure 7), it is clear from our analysis that supply chain resilience matters. Organisations whose suppliers were disrupted were significantly more likely to experience decreased productivity than organisations that did not face supplier issues.
Figure 8 Organisations’ evaluations of their suppliers’ capabilities following the earthquakes

15
4.0 PATHWAYS TO RESILIENCE
In this study we also examined the effect of organisational resilience on post-earthquake outcomes. Resilience describes an organisation’s ability to survive a crisis, and thrive in times of change and uncertainty (Resilient Organisations, 2014).
Resilience can be enacted in three phases. First, the organisation is able to reduce the impact of a disruptive event through planning or mitigation. Second, after a disruption a resilient organisation is able to recapture a desired level of productivity relatively quickly. Third, a resilient organisation is able to adapt to operate successfully in a disrupted or changing environment.
The Resilient Organisations research programme has identified 13 leading indicators of an organisation’s resilience, and developed assessment tools for evaluating how an organisation performs against each indicator. These indicators are grouped into three overarching attributes – an organisation’s leadership and culture, the networks it can draw on, and its change readiness (Figure 8).4
Figure 9 Leading indicators of organisational resilience (Resilient Organisations, 2014).
4 For a definition of each of these indicators see: http://www.resorgs.org.nz/Content/what‐is organisational‐
resilience.html
Organisations that scored highest against the Resilient Organisations 13
resilience indicators were better prepared, could function for longer with disrupted services and were more likely to be able to meet customer demand a
year after the earthquakes.
16
Within this survey, organisations were assessed against the 13 resilience indicators using the Resilience Thumbprint question-set (http://www.resorgs.org.nz/Resources/resilience-thumbprint-tool.html). A Resilience Index score was then calculated for each organisation.
The results of the survey show that resilience is important. Organisations that scored highest against the 13 resilience indicators were better prepared, could function for longer with disrupted services, were more likely to be able to meet customer demand a year after the earthquakes, and had better cashflow and profitability.
4.1 REDUCING IMPACTS
Organisations can increase their ability to survive and thrive in a crisis by mitigating potentially negative impacts through planning and by developing processes that enhance responsiveness and flexibility. Mitigation includes measures to reduce risks, such as building strengthening, having backup arrangements for times when critical infrastructure services are disrupted, or taking out insurance.
The survey asked organisations to rate the extent to which a number of factors helped mitigate the impact of the February 2011 earthquakes on their organisation. These factors can be separated into four categories: relationships, physical structures and resources, financial status, and planning and preparedness.
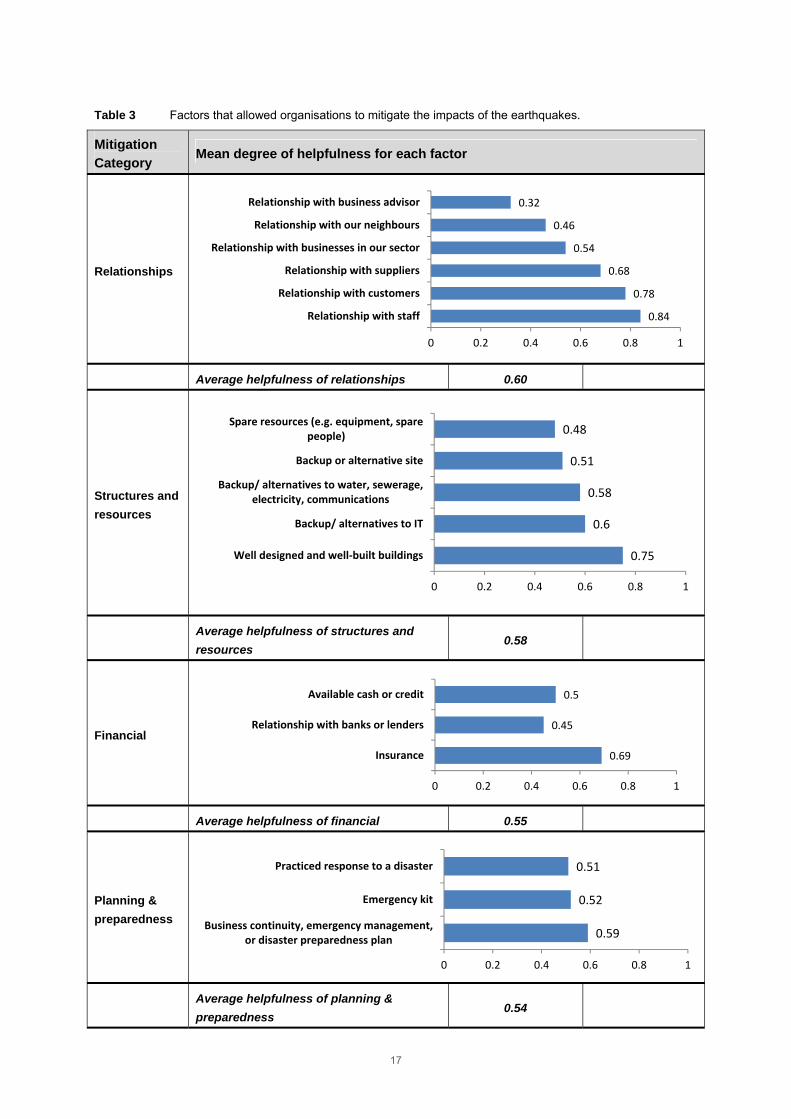
Relationships (with staff, customers and suppliers) were seen as the most important mitigation measures, along with well-designed and well-built buildings and having insurance (see Table 3).
Although it did not rate as highly as other factors, there is evidence that some specific types of planning and preparedness allowed organisations to respond more effectively following the earthquakes. For example, organisations that had engaged in some kind of relocation planning were more likely to move. Similarly, organisations that had systems in place to ease flexible working arrangements were more likely to relocate.
Organisations that had insurance were largely satisfied with their insurance experiences post-earthquake. 80% of respondents found their relationship with their insurer to be positive or neutral.
About 66% of surveyed organisations had made an insurance claim and 68% of claims had been almost or fully (80–100%) paid out at the time of the survey, approximately three years after the first earthquake.
About 78% of surveyed organisations found their insurance adequate. Property insurance covered an average of 80% of property loss; contents insurance covered an average of 78%. Business interruption insurance was less effective, covering an average of 58% of business losses.
Organisations that had engaged in some kind of
relocation planning were more likely to move after the
earthquakes.
17
Table 3 Factors that allowed organisations to mitigate the impacts of the earthquakes.
Mitigation
Category Mean degree of helpfulness for each factor
Relationships
Average helpfulness of relationships 0.60
Structures and
resources
Average helpfulness of structures and
resources 0.58
Financial
Average helpfulness of financial 0.55
Planning &
preparedness
Average helpfulness of planning &
preparedness 0.54
0.84
0.78
0.68
0.54
0.46
0.32
0 0.2 0.4 0.6 0.8 1
Relationship with staff
Relationship with customers
Relationship with suppliers
Relationship with businesses in our sector
Relationship with our neighbours
Relationship with business advisor
0.75
0.6
0.58
0.51
0.48
0 0.2 0.4 0.6 0.8 1
Well designed and well‐built buildings
Backup/ alternatives to IT
Backup/ alternatives to water, sewerage,electricity, communications
Backup or alternative site
Spare resources (e.g. equipment, sparepeople)
0.69
0.45
0.5
0 0.2 0.4 0.6 0.8 1
Insurance
Relationship with banks or lenders
Available cash or credit
0.59
0.52
0.51
0 0.2 0.4 0.6 0.8 1
Business continuity, emergency management,or disaster preparedness plan
Emergency kit
Practiced response to a disaster
18
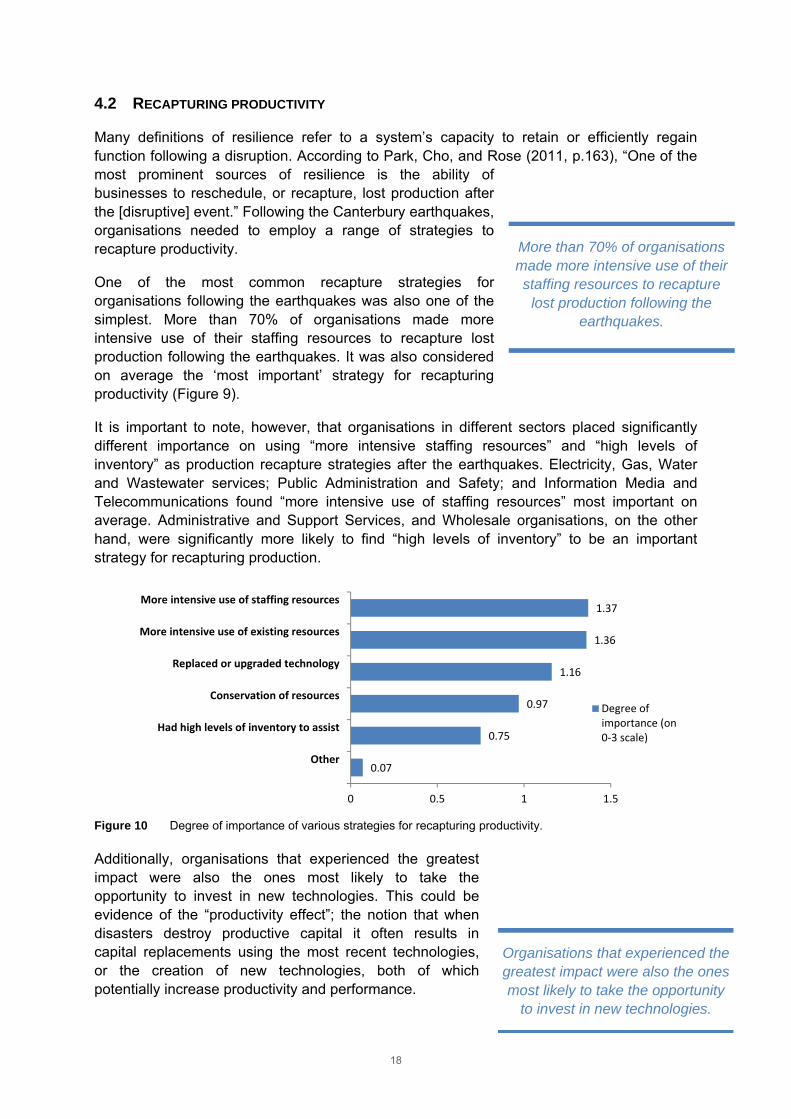
4.2 RECAPTURING PRODUCTIVITY
Many definitions of resilience refer to a system’s capacity to retain or efficiently regain function following a disruption. According to Park, Cho, and Rose (2011, p.163), “One of the most prominent sources of resilience is the ability of businesses to reschedule, or recapture, lost production after the [disruptive] event.” Following the Canterbury earthquakes, organisations needed to employ a range of strategies to recapture productivity.
One of the most common recapture strategies for organisations following the earthquakes was also one of the simplest. More than 70% of organisations made more intensive use of their staffing resources to recapture lost production following the earthquakes. It was also considered on average the ‘most important’ strategy for recapturing productivity (Figure 9).
It is important to note, however, that organisations in different sectors placed significantly different importance on using “more intensive staffing resources” and “high levels of inventory” as production recapture strategies after the earthquakes. Electricity, Gas, Water and Wastewater services; Public Administration and Safety; and Information Media and Telecommunications found “more intensive use of staffing resources” most important on average. Administrative and Support Services, and Wholesale organisations, on the other hand, were significantly more likely to find “high levels of inventory” to be an important strategy for recapturing production.
Figure 10 Degree of importance of various strategies for recapturing productivity.
Additionally, organisations that experienced the greatest impact were also the ones most likely to take the opportunity to invest in new technologies. This could be evidence of the “productivity effect”; the notion that when disasters destroy productive capital it often results in capital replacements using the most recent technologies, or the creation of new technologies, both of which potentially increase productivity and performance.
0.07
0.75
0.97
1.16
1.36
1.37
0 0.5 1 1.5
Other
Had high levels of inventory to assist
Conservation of resources
Replaced or upgraded technology
More intensive use of existing resources
More intensive use of staffing resources
Degree ofimportance (on0‐3 scale)
More than 70% of organisations made more intensive use of their staffing resources to recapture
lost production following the earthquakes.
Organisations that experienced the greatest impact were also the ones most likely to take the opportunity
to invest in new technologies.

19
4.3 ADAPTING TO NEW ENVIRONMENTS
Out of necessity, organisations across the region adapted significantly in order to reopen and recapture lost productivity. In some cases organisations, altered their strategies and processes a number of times throughout the continuous and compounding disruptions.
Adaptation refers to both pro-active and reactive changes an organisation might make in response to environmental forces or demands. An organisation is prompted to adapt when it detects the need to deal with a novel situation or stressor, when existing routines stop working to the benefit of the organisation, or when it becomes apparent that other modes or locations for operating offer greater advantages.
Our survey asked what adaptive responses organisation’s had implemented to aid their recovery. We found that nearly 30% of organisations entered new markets or served a new or expanded set of customers (Figure 10). Other relatively common adaptive strategies included restructuring (23%), adopting new technologies (22%), and making significant changes to operational processes (20%) such as maintenance activities. Some organisations also opted to close unprofitable lines (11.7%), add new lines of products or services (10.7%), and provide new delivery channels for products and services (8.3%).
For example, some organisations had to go through new retail intermediaries to get their products to market. Organisations that were no longer able to deliver goods or services to their customers onsite as a result of building damage, tended to compensate for this change with an increase in offsite or online sales.
Figure 11 Percent of organisations that implemented change following the earthquakes.
More than 20% of organisations entered new collaborations after the earthquakes. Collaborations refer to any arrangement between two or more organisations to achieve shared goals or enhance mutual benefit. Following the earthquakes, collaborative agreements were frequently used to facilitate resource and space sharing.
8.3%
9.6%
10.7%
11.7%
20.0%
22.4%
23.4%
29.0%
0% 5% 10% 15% 20% 25% 30% 35%
New delivery channels
Other
New production service lines
Unprofitable lines closed
Operational processes significantly changed
New technologies
Restructuring
New market sector (change in customers)
Out of necessity, organisations adapted significantly. Nearly 30%
entered new market sectors.

20
We also found that once an organisation started adapting it tended to keep adapting. In instances where organisations relocated for example, the new location became a catalyst for further organisational change. Organisations that relocated after the earthquakes were more likely than those that did not relocate to use new suppliers, initiate new collaborations, utilise new market sectors, and use new delivery channels for their service.
This is something we call adaptive snowballing. There could be a number of reasons for this. For example, one change might necessitate subsequent adaptations. If an organisation relocates it may then need to adapt its delivery channels or close unprofitable lines to work optimally in its new environment.
Adaptive snowballing could also indicate a more general organisational posture of change readiness; organisations with a demonstrated ability to recognise the need for change and can successfully implement change as necessary.
Organisations that adapted their processes or structures were not necessarily better or worse off than those that did not. However, if organisations were heavily impacted by the earthquakes (e.g., lost premises or major market segments) then certain adaptations were necessary to reopen and continue operating in an altered environment.
4.4 RELATIVE RESILIENCE
There are very different levels of resilience across different sectors of our economy. The sectors with the most resilient organisations include: Public Administration and Safety, Electricity, Gas, Water and Wastewater services, Education and Training, and the Information Media and Telecommunications sectors. Sectors with the lowest resilience include: Arts and recreation services, Agriculture, Forestry and Fishing, and the Retail Trade sectors (Figure 11).
Once an organisation started adapting, it tended to keep adapting – like an adaptive
snowball.

21
Figure 12 Industry sectors’ average resilience scores.
Resilient Organisations researchers have been monitoring the resilience of organisations in the Canterbury region since the September 4th, 2010 earthquake. The following spider diagram (Figure 12) shows results from our first two surveys. We found levels of resilience to be reasonably high for most sectors following the September 2010 earthquake, however that resilience dramatically declined following the February 2011 earthquake.
Note that there is not a direct alignment between the sectors in the spider diagram and ANZIC sectors used in other analyses of this data. For example a building supplies organisation may identify itself as operating within the retail sector, the construction sector, wholesale trade, or manufacturing, depending on how it sees its main activities. We used the general sector categories shown in Figures 12 and 13 to facilitate comparisons between the surveys.
63%
67%
68%
70%
70%
71%
73%
75%
76%
77%
77%
79%
83%
85%
85%
93%
0% 20% 40% 60% 80% 100%
Arts and Recreation Services
Agriculture, Forestry and Fishing
Retail trade
Wholesale Trade
Construction
Manufacturing
Professional, Scientific and…
Accommodation and Food Services
Rental, Hiring and Real Estate…
Financial and Insurance Services
Health Care and Social Assistance
Transport, Postal and Warehousing
Information Media and…
Electricity, Gas, Water and Waste…
Education and Training
Public Administration and Safety
Mean resiliencescore fororganisations insector
The earthquakes caused a dramatic, yet temporary, reduction in resilience for many organisations
in Greater Christchurch.

22
Figure 13 Resilience index scores captured following the September 2010 and February 2011 earthquakes.
The results of the third survey, almost a year after the February 2011 earthquake (Figure 13), show levels of resilience starting to rebuild. In our most recent data capture, almost two and a half years after the February 2011 earthquake, resilience for many sectors is now at or above levels seen soon after the first earthquake (Figure 13).
Some organisations, particularly in the critical infrastructure sector, have managed to learn and grow their resilience throughout the recovery process, and their level of resilience at the end of 2013, was higher than before the February 2011 earthquake.
An interesting discovery from our analysis is that organisations that consider themselves to be ‘Māori focused’ were more resilient and have recovered better, relative to their level of impact, compared with organisations that did not identify themselves as ‘Maori focused’, The reasons for this are unclear, but we will certainly be investigating this further.
0%
20%
40%
60%
80%
100%
BuildingSuppliers
Fast movingconsumergoods
ICT
Criticalinfrastructure
Trucking
Hospitality
Post 4 Sept '10
Post 22 Feb '11
Maori-focused organisations were more resilient and tended
to recover better relative to their level of impact.
23
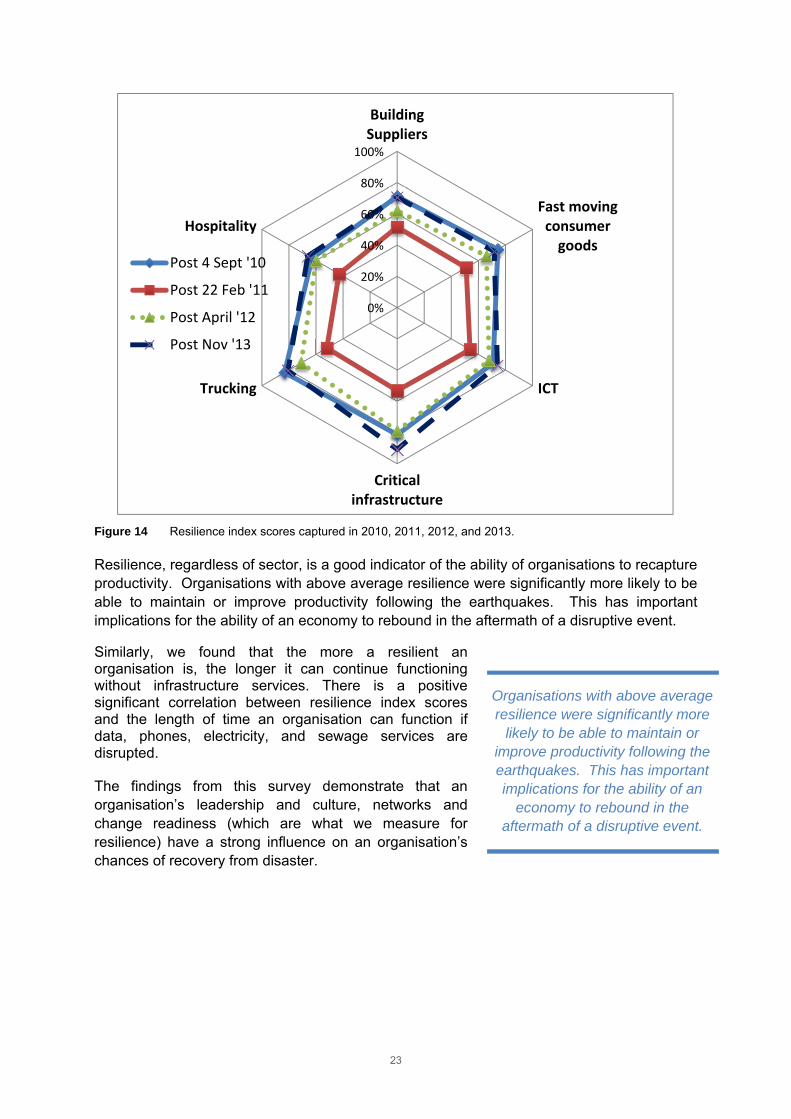
Figure 14 Resilience index scores captured in 2010, 2011, 2012, and 2013.
Resilience, regardless of sector, is a good indicator of the ability of organisations to recapture productivity. Organisations with above average resilience were significantly more likely to be able to maintain or improve productivity following the earthquakes. This has important implications for the ability of an economy to rebound in the aftermath of a disruptive event.
Similarly, we found that the more a resilient an organisation is, the longer it can continue functioning without infrastructure services. There is a positive significant correlation between resilience index scores and the length of time an organisation can function if data, phones, electricity, and sewage services are disrupted.
The findings from this survey demonstrate that an organisation’s leadership and culture, networks and change readiness (which are what we measure for resilience) have a strong influence on an organisation’s chances of recovery from disaster.
0%
20%
40%
60%
80%
100%
BuildingSuppliers
Fast movingconsumergoods
ICT
Criticalinfrastructure
Trucking
Hospitality
Post 4 Sept '10
Post 22 Feb '11
Post April '12
Post Nov '13
Organisations with above average resilience were significantly more
likely to be able to maintain or improve productivity following the earthquakes. This has important implications for the ability of an
economy to rebound in the aftermath of a disruptive event.

24
5.0 CONCLUSIONS
It is natural when modelling the economy to think at an aggregated level, and yet much of the richness of the recovery process emerges at an organisational level. When trying to model how economies respond to disruptions it is important to understand how different economic actors’ behaviours will modify the outcomes. Disasters inevitably create winners and losers, and this pattern evolves as recovery progresses.
Our research has found that overall organisations are recovering well from the Canterbury earthquakes. However, organisations have different capacities to respond and adapt to the challenges they face. Our challenge as part of the ERI project is to tease out the factors that support or inhibit different organisations to deal effectively with disruption, so that these factors can be incorporated into the MERIT suite of tools.
This report paints a high-level overview of some of the key findings from our preliminary analysis of the survey data. These findings include:
Despite all of the physical damage, it was human / organisational issues, that were most disruptive for organisations. Organisations were particularly disrupted by customer-related issues, and faced challenges managing staff wellbeing.
Of all the infrastructure disruption organisations experienced, it was disruption on the roads they felt most keenly. Roads had both the longest duration of reported ‘outages’ (or reduced service) and the greatest degree of disruption. Organisations experiencing infrastructure disruptions suffered reduced productivity and tended to close for longer.
While we found that closure is associated with reduced productivity in the post-disaster period, interestingly, length of closure does not predict which organisations recover well and which do not.
Supply chain resilience matters. Organisations whose suppliers were disrupted were significantly more likely to experience reduced productivity than organisations that did not face supplier issues.
Organisations with a more resilient leadership and culture, that have strong networks, and that are change ready (as measured by the Resilient Organisations 13 resilience indicators) were better prepared, could function for longer with disrupted services and were more likely to be able to meet customer demand a year after the earthquakes. Organisations with above average resilience were significantly more likely to be able to maintain or improve productivity following the earthquakes.
The earthquakes caused a dramatic reduction in resilience for many organisations in Greater Christchurch, but this reduction was temporary. Interestingly, Maori-focused organisations were more resilient and tended to recover better relative to their level of impact.
Out of necessity, organisations adapted significantly; and once an organisation started adapting, it tended to keep adapting – like an adaptive snowball. Of the adaptation strategies used to recover, more than 70% of organisations made more intensive use of their staffing resources to recapture lost production following the

25
earthquakes. Nearly 30% entered new market sectors. Organisations that had engaged in some kind of relocation planning were more likely to move after the earthquakes. Organisations that experienced the greatest impact were also the ones most likely to take the opportunity to invest in new technologies.
This dataset, capturing the experiences of 541 organisations affected by the Canterbury earthquake sequence, is quite unique in the world of disaster research. Further in-depth analysis of this data will produce many more insights into how infrastructure outages affect organisations and what enables some organisations to recover effectively. From here, our team of ERI researchers will be delving deeper into the dataset, using techniques such as Structural Equation Modelling, to assess the most significant predictors of organisational recovery.
Our on-going analyses will advance the development of MERIT in two ways. First, the results will be used to develop causal networks demonstrating the relationships between organisational attributes, post-earthquake adaptive behaviours and recovery outcomes. These causal networks will be integrated into a larger systemic model of how a regional economy recovers from disruption. Second, the data will be examined at an aggregate level to explore interactions between different industry sectors and to help identify key leverage points to support economic recovery.

26
6.0 WHERE TO FROM HERE? INTEGRATING BUSINESS BEHAVIOUR INTO THE MERIT MODEL
The Canterbury earthquake data gives us a rich data set with which to understand business impacts and responses to infrastructure disruption events. This report shows some of the interesting, baseline relationships within the data, highlighting key variables that affect business recovery. The challenge going forward is to determine how all these variables interact and which variables are the drivers for business recovery following infrastructure disruption.
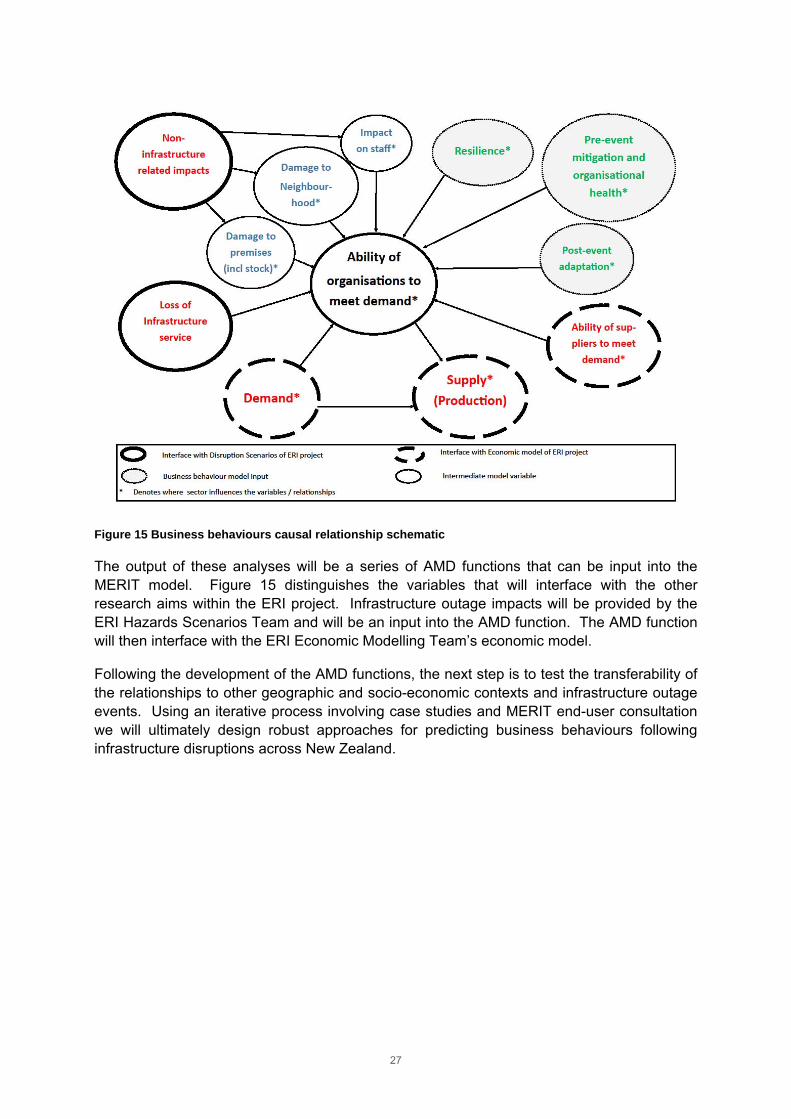
ERI researchers have developed a conceptual causal framework to describe the relationships between all variables that affect organisational functioning. A simplified schematic of the framework is shown in Figure 15. The framework is based on the economic principles of supply and demand: organisations supply products to meet consumer demands. Following an infrastructure disruption, this supply-demand relationship is disrupted when organisations are unable to meet their customer demands. For example, if there is an electricity network failure many manufacturers will be unable to operate machinery and therefore temporarily unable to supply their customers.
The supply-demand relationship is central to all productive economic activities, and influenced by a complex web of interactions. Therefore, at the centre of the causal framework is a variable called ‘Ability of organisations to Meet Demand’ (AMD). This variable describes the degree to which organisations are able to meet demand for their products or services. The variable is influenced by a number of factors. Factors such as loss of infrastructure services, physical disruptions, and neighbourhood and staff impacts will decrease an organisations’ ability to meet demand, while practices such as organisational resilience, pre-event mitigation strategies, and post-event adaptation will enable organisations to meet demand. Additionally, we consider the influence of the organisations’ suppliers’ ability to meet demands and fluctuations in the demand itself, both of which may be influenced by hazards and other disruptions. All these influencing factors are mapped in Figure 15.
Using this framework as a conceptual guide, we will use structural equation modelling and other complementary statistical methods to assess the data from the Canterbury earthquakes. These approaches will allow us to determine the relevance and strength of variable relationships within the framework. The analyses will also examine how the strength of the relationships and business behaviours within the causal framework vary by industry sector. We know, for example, sectors that are heavily location dependent (such as hospitality businesses) respond very differently to built-environment disruptions than those that can easily relocate or make alternative working arrangements for their staff (such as professional services).
27
Figure 15 Business behaviours causal relationship schematic
The output of these analyses will be a series of AMD functions that can be input into the MERIT model. Figure 15 distinguishes the variables that will interface with the other research aims within the ERI project. Infrastructure outage impacts will be provided by the ERI Hazards Scenarios Team and will be an input into the AMD function. The AMD function will then interface with the ERI Economic Modelling Team’s economic model.
Following the development of the AMD functions, the next step is to test the transferability of the relationships to other geographic and socio-economic contexts and infrastructure outage events. Using an iterative process involving case studies and MERIT end-user consultation we will ultimately design robust approaches for predicting business behaviours following infrastructure disruptions across New Zealand.

28
7.0 REFERENCES
CCC. (2011). Christchurch Earthquake Response: Liquefaction. Frequently Asked Questions. Christchurch, NZ. Retrieved from http://canterburyearthquake.files.wordpress.com/2011/03/liquefaction-factsheet-20110316.pdf
Eidinger, B. J., Tang, A., & Rourke, T. O. (2010). Technical Council on Lifeline Earthquake Engineering (TCLEE) Report of the 4 September 2010 Mw 7.1 Canterbury (Darfield), New Zealand Earthquake, 1–49. Retrieved from http://www.asce.org/uploadedFiles/Technical_Groups_and_Institutes/TCLEE/TCLEE%20Preliminary%202010%20NZ%20EQ%20Report.pdf
Giovinazzi, S., Wilson, T., Davis, C., Bristow, D., Gallagher, M., Schofield, A.,…& Tang, A. (2011). Lifelines Performance and Management Following the 22 February 2011 Christchurch Earthquake, New Zealand: Highlights of Resilience. Bulletin of the New Zealand Society for Earthquake Engineering, 44(4), 402–417.
NHRP. (2014). Economics of Resilient Infrastructure: Developing New Zealand’s understanding of the economic impacts of infrastructure outages. Natural Hazards Research Platform. Retrieved from http://www.naturalhazards.org.nz/NHRP/Hazard-themes/Societal-Resilience/Economics-of-Resilient-Infrastructure
Park, J. Y., Cho, J., & Rose, A. (2010). Modeling a major source of economic resilience to disasters: recapturing lost production. Natural Hazards, 58(1), 63–182.
Stevenson, J. R. (2014). Organisational Resilience after the Canterbury Earthquakes: A Contextual Approach. Ph.D. Thesis. University of Canterbury, Christchurch, NZ.

29
8.0 ABOUT THE TEAM
8.1 ECONOMICS OF RESILIENT INFRASTRUCTURE (ERI) PROJECT
The Economics of Resilient Infrastructure (ERI) is a four year research project (2012-2016) funded by the New Zealand government.
The project aims to develop a new model (known as MERIT) which will:
quantify the economic implications of vulnerabilities to infrastructure failure from both natural hazards and infrastructure-only events, and
explore alternative infrastructure-related mitigation, adaptation and recovery strategies.
enable a high resolution assessment across space and through time of the economic consequences of infrastructure failure, business response and recovery options.
The project team includes researchers from GNS Science, Market Economics Ltd, Resilient Organisations, Research Institute for Knowledge Systems (RIKS). Auckland Council, Tony Fenwick (Wellington) and Simon Worthington (Christchurch) are also involved.
For more information on the ERI project see our website:
http://www.naturalhazards.org.nz/NHRP/Hazard-themes/Societal-Resilience/Economics-of-Resilient-Infrastructure
8.2 RESILIENT ORGANISATIONS (RESORGS)
The Business Behaviours strand of research within the ERI project is being undertaken by Resilient Organisations.
Resilient Organisations is a public good research programme based in New Zealand. We have been researching what makes organisations resilient to crises since 2004. Resilient Organisations is a collaboration between top New Zealand research universities, particularly the University of Canterbury and University of Auckland. We are funded by the Natural Hazards Platform and supported by a diverse group of industry partners and advisors. We are a multi-disciplinary team of over 35 researchers, representing a synthesis of engineering, science and business leadership aimed at transforming organisations into those that both survive major events and thrive in the aftermath.
In an increasingly volatile and uncertain world, one of the greatest assets an organisation can have is the agility to survive unexpected crisis, to find opportunity, and thrive in the face of potentially terminal events. This resilience is typified by world class organisational culture and leadership, strong and diverse networks that can be drawn on for support when needed, and an attitude and strategic positioning that is change-ready. More resilient organisations lead to more resilient communities and provide the honed human capital to address some of our most intractable societal challenges.
See www.resorgs.org.nz for further information.

30
APPENDIX 1: SECTORAL REPRESENTATION
Table 4 below shows the industry sectors represented by organisations responding to the survey. Two sectors were significantly under represented based on the proportion of businesses in Canterbury: rental, hiring and real estate services; and agriculture, forestry and fishing. This difference was fairly evenly spread between other sectors, except for manufacturing which represented 8.7% more of the sample than would be representative of industry in Canterbury.
Table 4 Industry representation in Canterbury and survey sample.
Sector
Percent of total number of
geographic business units
in Canterbury*
Total number
of responses
Percent of total
survey
responses
Difference
Agriculture, forestry and
fishing 17% 21 3.9% -13.1%
Mining 0% 0 0% -
Manufacturing 5% 74 13.7% 8.7%
Electricity, gas, water and
waste services 0% 18 3.3% 3.3%
Construction 11% 44 8.1% -2.9%
Wholesale trade 4% 33 6.1% 2.1%
Retail trade 6% 43 8% 2%
Accommodation and food
services 4% 45 8.3% 4.3%
Transport, postal and
warehousing 3% 28 5.2% 3.2%
Information, media and
telecommunications 1% 8 1.5% 0.5%
Financial and insurance
services 6% 22 4.1% -1.9%
Rental, hiring and real
estate services 19% 32 5.9% -13.1%
Professional, scientific and
technical services 8% 59 10.9% 2.9%
Administrative and support
services 3% 2 0.4% -2.6%
Public administration and
safety 1% 5 0.9% -0.1%
Education and training 2% 35 6.5% 4.5%
Health care and social
assistance 4% 48 8.9% 4.9%
Arts and recreation
services 2% 20 3.7% 1.7%
Other services 4% 3 0.6% -3.4%
* Data from Statistics New Zealand. A ‘geographic unit’ is a separate operating unit engaged in New Zealand in one, or predominantly one, kind of economic activity from a single physical location or base(Statistics New Zealand, 2014).

31
APPENDIX 2: BUSINESS BEHAVIOURS SURVEY

Page 1
2013 Organisational Resilience and Recovery Survey2013 Organisational Resilience and Recovery Survey2013 Organisational Resilience and Recovery Survey2013 Organisational Resilience and Recovery Survey
Page 2
2013 Organisational Resilience and Recovery Survey2013 Organisational Resilience and Recovery Survey2013 Organisational Resilience and Recovery Survey2013 Organisational Resilience and Recovery Survey
This study is only made possible through your participation so we would like first of all to thank you very much for your time. We are looking to catalogue the effects of the Canterbury earthquakes on your organisation – if any – and what measures you may have taken in the aftermath. We would also like to know if your organisation experienced any service interruptions with water, electricity or other utilities, how these interruptions affected your ability to operate and what factors helped you minimise the earthquake’s impact on your organisation. The information gathered from this survey will help us understand what organisations have gone through and what strategies can support organisation recovery following a disaster. The survey takes 20 - 30 minutes to complete. Your participation is voluntary. The questionnaire is confidential; results from individuals/organisations will never be disclosed to third parties. You may withdraw your participation at any time, including any information you have provided after you have completed the questionnaire. By completing the following survey your organisation is consenting to your involvement in this study.
Page 3
2013 Organisational Resilience and Recovery Survey2013 Organisational Resilience and Recovery Survey2013 Organisational Resilience and Recovery Survey2013 Organisational Resilience and Recovery Survey
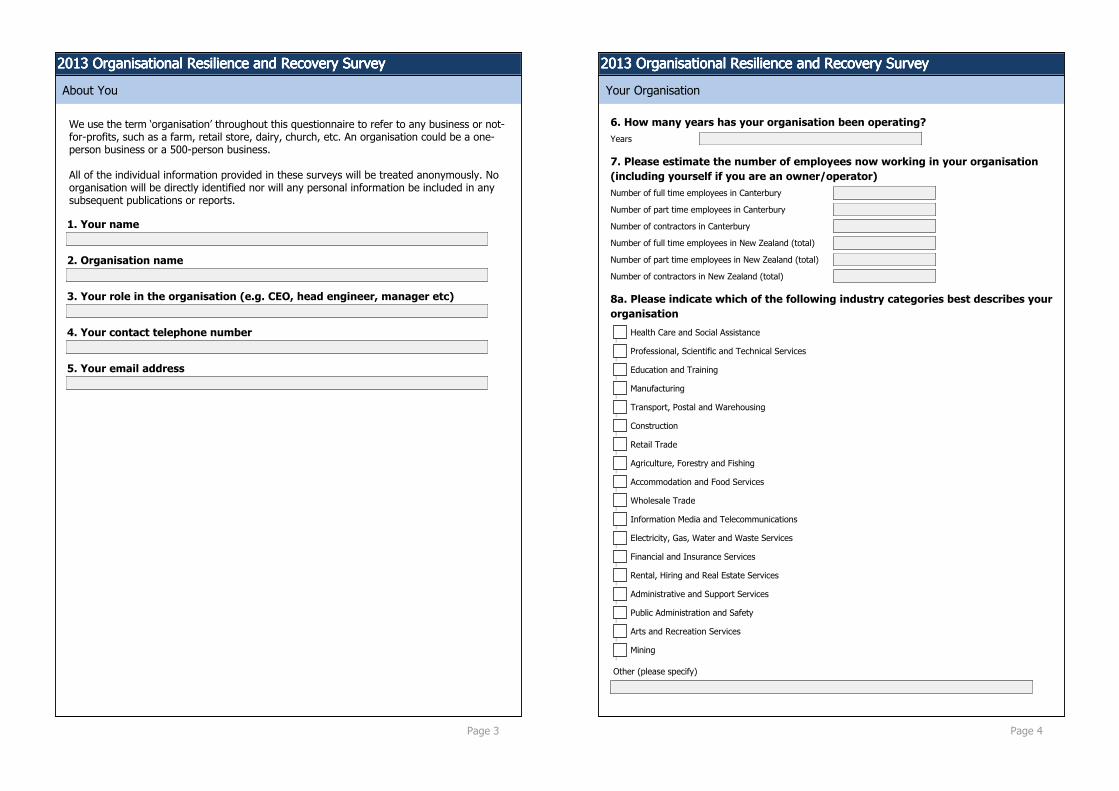
We use the term ‘organisation’ throughout this questionnaire to refer to any business or not-for-profits, such as a farm, retail store, dairy, church, etc. An organisation could be a one-person business or a 500-person business. All of the individual information provided in these surveys will be treated anonymously. No organisation will be directly identified nor will any personal information be included in any subsequent publications or reports.
1. Your name
2. Organisation name
3. Your role in the organisation (e.g. CEO, head engineer, manager etc)
4. Your contact telephone number
5. Your email address
About You
Page 4
2013 Organisational Resilience and Recovery Survey2013 Organisational Resilience and Recovery Survey2013 Organisational Resilience and Recovery Survey2013 Organisational Resilience and Recovery Survey
6. How many years has your organisation been operating?
7. Please estimate the number of employees now working in your organisation (including yourself if you are an owner/operator)
8a. Please indicate which of the following industry categories best describes your organisation
Your Organisation
Years
Number of full time employees in Canterbury
Number of part time employees in Canterbury
Number of contractors in Canterbury
Number of full time employees in New Zealand (total)
Number of part time employees in New Zealand (total)
Number of contractors in New Zealand (total)
Health Care and Social Assistance �����
Professional, Scientific and Technical Services �����
Education and Training �����
Manufacturing �����
Transport, Postal and Warehousing �����
Construction �����
Retail Trade �����
Agriculture, Forestry and Fishing �����
Accommodation and Food Services �����
Wholesale Trade �����
Information Media and Telecommunications �����
Electricity, Gas, Water and Waste Services �����
Financial and Insurance Services �����
Rental, Hiring and Real Estate Services �����
Administrative and Support Services �����
Public Administration and Safety �����
Arts and Recreation Services �����
Mining �����
Other (please specify)

Page 5
2013 Organisational Resilience and Recovery Survey2013 Organisational Resilience and Recovery Survey2013 Organisational Resilience and Recovery Survey2013 Organisational Resilience and Recovery Survey8b. Is your organisation Maori-focussed?
9. What does your organisation do? (e.g. IT consulting, roading contractor, clothes retailer etc)
10. How would you describe your organisation’s ownership structure? (please tick all that apply)
No ���
Yes, please describe
���
Community Trusts �����
Individual Proprietorship/Self-Employed �����
Partnership �����
Privately Held Limited Liability Company (Non Co-op) �����
Publically Listed Limited Liability Company (Non Co-op) �����
Co-operative Company �����
Joint Venture and Consortium �����
Branch of Company Incorporated Overseas �����
Government Owned Trading Entity �����
Central Government �����
Local Authority Trading Enterprise (LATE) �����
Local Government �����
Incorporated and Unincorporated Society and Association �����
Charitable Trusts �����
Trust/Estate �����
Consulate and Foreign Embassy �����
Other (please specify)
Page 6
2013 Organisational Resilience and Recovery Survey2013 Organisational Resilience and Recovery Survey2013 Organisational Resilience and Recovery Survey2013 Organisational Resilience and Recovery Survey
The following section aims to collect information on how your organisation was impacted by the Canterbury earthquake sequence 2010-2011
11. In the first three months following the 22 February 2011 earthquake, please indicate how disruptive the following factors were
Earthquake Impacts
N/ANot
disruptiveSlightly
disruptiveModerately disruptive
Very disruptive
Difficulty accessing IT data ��� ��� ��� ��� ���
Structural damage to building(s) (integrity of building compromised)
��� ��� ��� ��� ���
Non-structural damage (fittings damaged e.g. windows or light fixtures)
��� ��� ��� ��� ���
Machinery loss or damage ��� ��� ��� ��� ���
Office equipment loss or damage ��� ��� ��� ��� ���
Damage to inventory or stock ��� ��� ��� ��� ���
Damage to ground surface ��� ��� ��� ��� ���
Damage to or closure of adjacent (next door) organisations or buildings
��� ��� ��� ��� ���
Damage to local neighbourhood (e.g. other buildings in area, damage to pavements, etc)
��� ��� ��� ��� ���
Difficulty accessing premises/site ��� ��� ��� ��� ���
Health and safety issues for employees ��� ��� ��� ��� ���
Supplier issues ��� ��� ��� ��� ���
Customer issues ��� ��� ��� ��� ���
Availability of staff ��� ��� ��� ��� ���
Perceptions of building safety ��� ��� ��� ��� ���
Changes in staff emotional wellbeing ��� ��� ��� ��� ���
Other ��� ��� ��� ��� ���
Other (please specify)

Page 7
2013 Organisational Resilience and Recovery Survey2013 Organisational Resilience and Recovery Survey2013 Organisational Resilience and Recovery Survey2013 Organisational Resilience and Recovery Survey12a. With reference to the 22 February earthquake, to what extent have the following factors helped mitigate the impact of the earthquakes on your organisation?
12b. Did the 22nd February earthquake reduce your organisationʼs production/delivery/output?
N/ANot
importantSlightly
importantModerately important
Very important
Backup/alternatives to water, sewerage, electricity, communications
��� ��� ��� ��� ���
Backup/alternatives to IT ��� ��� ��� ��� ���
Relationship with customers ��� ��� ��� ��� ���
Relationship with suppliers ��� ��� ��� ��� ���
Relationship with businesses in our sector ��� ��� ��� ��� ���
Relationship with business advisor/mentor ��� ��� ��� ��� ���
Relationship with staff ��� ��� ��� ��� ���
Relationship with banks or lenders ��� ��� ��� ��� ���
Relationship with our neighbours ��� ��� ��� ��� ���
Available cash or credit ��� ��� ��� ��� ���
Spare resources (e.g. equipment or extra people) ��� ��� ��� ��� ���
Insurance ��� ��� ��� ��� ���
Business continuity, emergency management or disaster preparedness plan
��� ��� ��� ��� ���
Backup or alternative site ��� ��� ��� ��� ���
Practiced response to a disaster ��� ��� ��� ��� ���
Emergency kit ��� ��� ��� ��� ���
Well designed and well built buildings ��� ��� ��� ��� ���
Other ��� ��� ��� ��� ���
Other (please specify)
No, please skip to Question 12d ���
Yes ���
Page 8
2013 Organisational Resilience and Recovery Survey2013 Organisational Resilience and Recovery Survey2013 Organisational Resilience and Recovery Survey2013 Organisational Resilience and Recovery Survey12c. With reference to the 22 February earthquake, to what extent have the following factors helped recapture lost production/delivery/output?
12d. With reference to the 22 February 2011 earthquake, how was your organisation disrupted by the loss of the following infrastructure services?
Not importantSlightly
importantModerately important
Very important
More intensive use of staffing resources ��� ��� ��� ���
Had high levels of inventory to assist ��� ��� ��� ���
Conservation of resources ��� ��� ��� ���
More intensive use of existing resources ��� ��� ��� ���
Replaced or upgraded technology ��� ��� ��� ���
Not disrupted Slightly disrupted Moderately disrupted Very disrupted
Water supply ��� ��� ��� ���
Sewage ��� ��� ��� ���
Electricity ��� ��� ��� ���
Gas ��� ��� ��� ���
Phone networks (cell and landline)
��� ��� ��� ���
Data networks ��� ��� ��� ���
Road network ��� ��� ��� ���
Rail ��� ��� ��� ���
Airport ��� ��� ��� ���
Port ��� ��� ��� ���
Fuel ��� ��� ��� ���
Other (please specify)

Page 9
2013 Organisational Resilience and Recovery Survey2013 Organisational Resilience and Recovery Survey2013 Organisational Resilience and Recovery Survey2013 Organisational Resilience and Recovery Survey12e. With reference to the 22 February 2011 earthquake, for how long did your organisation experience disruptions to the following infrastructure services?
13a. Did your organisation close at all as result of the earthquakes?
13b. If your organisation closed temporarily, for how long did you close? (please indicate number of days for each earthquake)
N/A Hours Days Weeks Months
Water supply ��� ��� ��� ��� ���
Sewage ��� ��� ��� ��� ���
Electricity ��� ��� ��� ��� ���
Gas ��� ��� ��� ��� ���
Phone networks (cell and landline) ��� ��� ��� ��� ���
Data networks ��� ��� ��� ��� ���
Road network ��� ��� ��� ��� ���
Rail ��� ��� ��� ��� ���
Airport ��� ��� ��� ��� ���
Port ��� ��� ��� ��� ���
Fuel ��� ��� ��� ��� ���
Closed temporarily
Closed permanently
Remained open asusual
Remained open but operated longer hours
Remained open but operated fewer hours
4 September 2010 ����� ����� ����� ����� �����
26 December 2010 ����� ����� ����� ����� �����
22 February 2011 ����� ����� ����� ����� �����
13 June 2011 ����� ����� ����� ����� �����
23 December 2011 ����� ����� ����� ����� �����
4 September 2010
26 December 2010
22 February 2011
13 June 2011
23 December 2011
Page 10
2013 Organisational Resilience and Recovery Survey2013 Organisational Resilience and Recovery Survey2013 Organisational Resilience and Recovery Survey2013 Organisational Resilience and Recovery Survey
14. How many sites or locations does your organisation currently operate from? (please answer in numbers, e.g. 3)
15. Does your organisation own or rent the properties from which it is operated? (please tick all that apply)
16. What was your organisation’s physical address prior to the 4 September 2010 earthquake? (If your organisation has multiple sites, please provide your main address in Canterbury)
17. How long had your organisation been operating from this location prior to the 4 September 2010 earthquake? (in years)
18a. Did your organisation relocate your main sites due to the earthquakes?
18b. When and where did you relocate your main sites? (please provide date and address for each time that you have moved)
Your Location
Within Canterbury?
Elsewhere within New Zealand?
Outside New Zealand?
Street Number and Name
City/Town
Post Code
Number of years
Move 1 - Date
Move 1 - Address
Move 2 - Date
Move 2 - Address
Others - Dates
Others - Addresses
Own �����
Rent/Lease �����
No, please skip to Question 19a ���
Yes ���

Page 11
2013 Organisational Resilience and Recovery Survey2013 Organisational Resilience and Recovery Survey2013 Organisational Resilience and Recovery Survey2013 Organisational Resilience and Recovery Survey19a. Before the earthquakes, had you thought about options for relocating your organisation in a crisis? (tick all that apply)
19b. How feasible is it to relocate parts or all of your organisationʼs operations? (tick all that apply)
We hadn’t made any prior plans for relocating �����
Our organisation leases or owns another site which we knew we could relocate to �����
We had planned for our staff to work from home and had practiced those plans �����
We had planned for our staff to work from home although we had not practiced this �����
We had an arrangement with another organisation to share or use a site owned by them �����
Other �����
Other (please specify)
The majority of my staff can work from home �����
It is relatively easy for us to set up in a new location �����
We have multiple sites we can operate from �����
There are significant health/safety and regulation constraints affecting the locations we can operate from �����
Our equipment is difficult to source, relocate and replace �����
Our business is quite location-specific, moving is not an option �����
We could potentially site-share with another organisation �����
Page 12
2013 Organisational Resilience and Recovery Survey2013 Organisational Resilience and Recovery Survey2013 Organisational Resilience and Recovery Survey2013 Organisational Resilience and Recovery Survey
20. How well were your regular suppliers able to meet your organisation’s needs after the earthquakes?
21. Did your organisation need to use new suppliers as a result of the earthquake?
22. What were the main supplier issues that you faced?
23a. Where were your organisation’s key suppliers located prior to 4 September 2010? (please estimate percentage)
23b. Where are your organisation’s key suppliers located now? (please estimate percentage)
Your Suppliers
��
Local suppliers (within Canterbury) (%)
Suppliers from elsewhere in New Zealand (outside of Canterbury) (%)
Suppliers from elsewhere outside New Zealand (%)
Don’t know (%)
Local suppliers (within Canterbury) (%)
Suppliers from elsewhere in New Zealand (outside of Canterbury) (%)
Suppliers from elsewhere outside New Zealand (%)
Don’t know (%)
Incapable ���
Somewhat capable ���
Completely capable ���
Donʼt know ���
Yes ���
No ���
Don't know ���

Page 13
2013 Organisational Resilience and Recovery Survey2013 Organisational Resilience and Recovery Survey2013 Organisational Resilience and Recovery Survey2013 Organisational Resilience and Recovery Survey
24a. How did your organisation supply goods and/or services to customers prior to the 4 September 2010 earthquake? (please estimate percentage)
24b. How about now?
25a. Compared to before the September 2010 earthquake, how is the demand for your products or services?
25b. If demand has increased or decreased, please state the reason(s) for this
26a. To what extent was your organisation able to meet the demand for your products or services?
Your Customers
At our physical premises (%)
Offsite (%)
Online (%)
Other (%)
At our physical premises (%)
Offsite (%)
Online (%)
Other (%)
Increased demandAbout the same
demandDecreased demand
Immediately after the earthquakes ��� ��� ���
Several months after the earthquakes ��� ��� ���
A year on from the earthquakes ��� ��� ���
Two years on from the earthquakes ��� ��� ���
��
Unable ( 0–
20%)
Limited (20–40%)
Partially (40-
60%)
Mostly (60–80%)
Completely(80–
100%)
Immediately after the earthquakes ��� ��� ��� ��� ���
Several months after the earthquakes ��� ��� ��� ��� ���
A year on from the earthquakes ��� ��� ��� ��� ���
Two years on from the earthquakes ��� ��� ��� ��� ���
Page 14
2013 Organisational Resilience and Recovery Survey2013 Organisational Resilience and Recovery Survey2013 Organisational Resilience and Recovery Survey2013 Organisational Resilience and Recovery Survey
26b. What were the key factors in your ability/inability to meet demand for your products or services?
27a. Prior to 4 September 2010, how much of your revenue was generated from customers originating from the following areas: (please estimate percentage)
27b. How about now?
��
Local customers (within Canterbury) (%)
Customers from elsewhere in New Zealand (outside of Canterbury) (%)
Customers from elsewhere outside New Zealand (%)
Don’t know (%)
Local customers (within Canterbury) (%)
Customers from elsewhere in New Zealand (outside of Canterbury) (%)
Customers from elsewhere outside New Zealand (%)
Don’t know (%)

Page 15
2013 Organisational Resilience and Recovery Survey2013 Organisational Resilience and Recovery Survey2013 Organisational Resilience and Recovery Survey2013 Organisational Resilience and Recovery Survey
28. How have your staffing numbers changed since the earthquakes?
29. What have been the biggest staffing challenges for your organisation following the earthquakes?
Your Staff
��
Grown significantly (greater than 20%) ���
Grown (between +5% and +20%) ���
Stayed about the same (between -5% and +5%) ���
Reduced (between -20% and -5%) ���
Reduced significantly (greater than -20%) ���
Page 16
2013 Organisational Resilience and Recovery Survey2013 Organisational Resilience and Recovery Survey2013 Organisational Resilience and Recovery Survey2013 Organisational Resilience and Recovery Survey
30. How has/is your organisation financing its recovery from the earthquakes? (tick all that apply)
31. What type of insurance did your organisation have at the time of the earthquakes? (tick all that apply)
32. Did your organisation lodge an insurance claim for any of the earthquakes?
Insurance
N/A our organisation was not financially affected by the earthquakes �����
Organisation cash flow �����
Savings �����
Money borrowed from family or friends �����
Bank loan �����
Credit cards �����
Insurance claim �����
Self-insurance programme �����
Earthquake wage subsidy �����
Grants �����
Other �����
Please explain further any of the above if necessary
Property and buildings �����
Organisation content, equipment, assets �����
Motor vehicles �����
Business interruption, cashflow, income protection insurance �����
Public liability �����
Professional indemnity �����
Other (please specify)
Yes ���
Self-insurance ���
No, please skip to Question 37 ���
Page 17
2013 Organisational Resilience and Recovery Survey2013 Organisational Resilience and Recovery Survey2013 Organisational Resilience and Recovery Survey2013 Organisational Resilience and Recovery Survey
33. Do you believe your insurance cover/policy was adequate?
34. What proportion of your insurance claim(s) has been paid out?
35. What proportion of your losses do you expect will be covered by your insurance settlement? (please estimate percentage)
36. How would you rate your relationship with your insurer?
Property and buildings (%)
Organisation assets and equipment (%)
Motor vehicles (%)
Business interruption, cashflow, income protection insurance (%)
Public liability (%)
Professional indemnity (%)
Other (%)
Yes ���
No ���
Don't know ���
If not, please explain
��
Less than 20% ���
Between 20% and 39% ���
Between 40% and 59% ���
Between 60% and 79% ���
Between 80% and 100% ���
Don't know ���
Very dissatisfied ���
Dissatisfied ���
Neutral ���
Satisfied ���
Very satisfied ���
If dissatisfied or very dissatisfied, please clarify why
��
Page 18
2013 Organisational Resilience and Recovery Survey2013 Organisational Resilience and Recovery Survey2013 Organisational Resilience and Recovery Survey2013 Organisational Resilience and Recovery Survey
37. Has your organisation initiated any new collaborations with other organisations or changed pre-existing collaborations since 4 September 2010?
38. How has your business changed since the earthquakes? (tick all that apply)
39a. How have the costs of operating your business changed since the earthquakes?
39b. What parts of your business have seen the biggest increase in cost? (e.g. wages, raw materials, cost of premises, etc)
Organisational Changes
��
Yes ���
No ���
If yes, please describe
��
New production service lines �����
New market sector (change in customers) �����
New delivery channels �����
New technologies �����
Operational processes significantly changed �����
Restructuring �����
Unprofitable lines closed �����
Other (please specify)
��
Grown significantly (by more than 20%) ���
Grown (between +5% and +20%) ���
Stayed about the same (between -5% and +5%) ���
Reduced (between -20% and -5%) ���
Reduced significantly (by more than -20%) ���
Page 19
2013 Organisational Resilience and Recovery Survey2013 Organisational Resilience and Recovery Survey2013 Organisational Resilience and Recovery Survey2013 Organisational Resilience and Recovery Survey39c. What parts of your business have seen the biggest decrease in cost? (e.g. wages, raw materials, cost of premises, etc)
40. To what extent has your organisation been able to increase prices in line with costs?
��
Incapable ���
Somewhat capable ���
Completely capable ���
N/A ���
Page 20
2013 Organisational Resilience and Recovery Survey2013 Organisational Resilience and Recovery Survey2013 Organisational Resilience and Recovery Survey2013 Organisational Resilience and Recovery Survey
41a. With the earthquakes in mind, is your organisation (please tick one)
41b. With the earthquakes in mind, how would you describe your organisation’s current productivity? (please tick one)
42. Which of these statements best describes your organisation at the present time?
43a. What were the biggest challenges to running your organisation immediately following the earthquakes?
Recovery
��
Significantly better off ���
Slightly better off ���
The same ���
Slightly worse off ���
Significantly worse off ���
Greatly increased ���
Slightly increased ���
The same ���
Slightly decreased ���
Greatly decreased ���
The earthquakes were positive for our organisation ���
The earthquakes never impacted our organisation ���
We are no longer trading ���
We are still in survival mode following the earthquakes ���
We are still recovering from the earthquakes ���
We have fully recovered from the earthquakes ���

Page 21
2013 Organisational Resilience and Recovery Survey2013 Organisational Resilience and Recovery Survey2013 Organisational Resilience and Recovery Survey2013 Organisational Resilience and Recovery Survey43b. What are they now?
��
Page 22
2013 Organisational Resilience and Recovery Survey2013 Organisational Resilience and Recovery Survey2013 Organisational Resilience and Recovery Survey2013 Organisational Resilience and Recovery Survey
44. To what extent do you agree or disagree with the following statements for your organisation?
Resilience
StronglyAgree
<-- -- --| |-- -- -->Strongly Disagree
Given how others depend on us, the way we plan for the unexpected is appropriate
��� ��� ��� ��� ��� ��� ��� ���
Our organisation is committed to practicing and testing its emergency plans to ensure they are effective
��� ��� ��� ��� ��� ��� ��� ���
We have a focus on being able to respond to the unexpected
��� ��� ��� ��� ��� ��� ��� ���
We build relationships with others we might have to work with in a crisis
��� ��� ��� ��� ��� ��� ��� ���
We have clearly defined priorities for what is important during and after a crisis
��� ��� ��� ��� ��� ��� ��� ���
There are few barriers stopping us from working well with other organisations
��� ��� ��� ��� ��� ��� ��� ���
Our organisation maintains sufficient resources to absorb some unexpected change
��� ��� ��� ��� ��� ��� ��� ���
People in our organisation are committed to working on a problem until it is resolved
��� ��� ��� ��� ��� ��� ��� ���
If key people were unavailable, there are always others who could fill their role
��� ��� ��� ��� ��� ��� ��� ���
There would be good leadership from within our organisation if we were struck by a crisis
��� ��� ��� ��� ��� ��� ��� ���
We are known for our ability to use knowledge in novel ways
��� ��� ��� ��� ��� ��� ��� ���
We can make tough decisions quickly ��� ��� ��� ��� ��� ��� ��� ���
We proactively monitor our industry to have an early warning of emerging issues
��� ��� ��� ��� ��� ��� ��� ���

Page 23
2013 Organisational Resilience and Recovery Survey2013 Organisational Resilience and Recovery Survey2013 Organisational Resilience and Recovery Survey2013 Organisational Resilience and Recovery Survey45. How long could your organisation continue functioning if normal supply to the following infrastructure services were disrupted?
46a. Does your organisation have well developed:
46b. If applicable, are the above plan(s) of a sufficient standard to be useful in an emergency?
47. How would you rate your organisation’s current cashflow?
Could not function
Hours Days Weeks Months
Water supply ��� ��� ��� ��� ���
Sewage ��� ��� ��� ��� ���
Electricity ��� ��� ��� ��� ���
Gas ��� ��� ��� ��� ���
Phone networks (cell and landline) ��� ��� ��� ��� ���
Data networks ��� ��� ��� ��� ���
Road network ��� ��� ��� ��� ���
Rail ��� ��� ��� ��� ���
Airport ��� ��� ��� ��� ���
Port ��� ��� ��� ��� ���
Fuel ��� ��� ��� ��� ���
Yes No Don’t know
Crisis/emergency plans (over and above your fire evacuation plan) ��� ��� ���
Business continuity plans ��� ��� ���
Yes ���
No ���
Don’t know ���
If not please explain
��
Excellent ���
Good ���
Satisfactory ���
Poor ���
Very poor ���
Don’t know ���
Page 24
2013 Organisational Resilience and Recovery Survey2013 Organisational Resilience and Recovery Survey2013 Organisational Resilience and Recovery Survey2013 Organisational Resilience and Recovery Survey48. How would you describe your organisation’s current level of debt?
49a. Is your organisation
49b. How would you describe your organisation's current profitability?
49c. How would you describe your organisation's current financial surplus or deficit?
Very high debt ���
High debt ���
Moderate debt ���
Minimal/No debt ���
Don't know ���
For-profit, please go to Question 49b ���
Not-for-profit, please go to Question 49c ���
Highly profitable ���
Moderately profitable ���
Breaking even ���
Unprofitable ���
Don't know ���
High surplus ���
Low surplus ���
No surplus ���
Low deficit ���
High deficit ���
Don't know ���

Page 25
2013 Organisational Resilience and Recovery Survey2013 Organisational Resilience and Recovery Survey2013 Organisational Resilience and Recovery Survey2013 Organisational Resilience and Recovery Survey
This study is only made possible through your participation so at this time we would like to thank you very much for your time; your responses on this questionnaire are greatly valued and appreciated. As a reminder, you may withdraw your participation, including the withdrawal of any information you have provided, for two weeks from the time you completed this questionnaire. If you have any questions about the research or the questionnaire, please contact: The Research Team John Vargo - [email protected] Erica Seville – [email protected] Sonia Giovinazzi – [email protected] If you would like any information regarding organisational resilience, please visit: www.resorgs.org.nz
Thank you

Contact details:
GNS Science1 Fairway Drive, AvalonLower Hutt 5010PO Box 30 368Lower Hutt 5040New ZealandT +64-4-570 1444F +64-4-570 4600