DISPOSAL BASED AUDITS OF THE C&I AND C&D WASTE …€¦ · waste is consolidated prior to transport...
32
DISPOSAL BASED AUDITS OF THE C&I AND C&D WASTE STREAMS FOR THE DEPARTMENT OF ENVIRONMENT AND CONSERVATION March 2007 Waste Audit and Consultancy Services (Aust) Pty Ltd Level 1, 24 Thomson St South Melbourne VIC 3205 Australia Tel (03) 9645 0166 Fax (03) 9645 0199 [email protected] PO Box 1667 Rozelle NSW 2039 Australia Tel (02) 9818 8267 Fax (02) 9818 8271 [email protected]
Transcript of DISPOSAL BASED AUDITS OF THE C&I AND C&D WASTE …€¦ · waste is consolidated prior to transport...

DISPOSAL BASED AUDITS OF THE C&I AND C&D WASTE STREAMS FOR THE DEPARTMENT OF ENVIRONMENT AND CONSERVATION March 2007
Waste Audit and Consultancy
Services (Aust) Pty Ltd
Level 1, 24 Thomson St South Melbourne VIC 3205 Australia Tel (03) 9645 0166 Fax (03) 9645 0199 [email protected] PO Box 1667 Rozelle NSW 2039 Australia Tel (02) 9818 8267 Fax (02) 9818 8271 [email protected]

Disposal Based Audits of the C&I and C&D Waste Streams Department of Environment and Conservation
Commercial in Confidence
The following report is based on information provided by staff of the
landfill/transfer station site operators, together with the audit team’s observations. To that extent this report relies on the accuracy of the information provided to the
audit team.
Accordingly, Waste Audit and Consultancy Services (Aust) Pty Ltd and Golder Associates Pty Ltd will not be liable for any loss or damage that may arise out of
this report, other than the loss or damage caused as a direct result of any negligence on the part of Waste Audit and Consultancy Services (Aust) Pty Ltd.
This report contains confidential information on the business operations of various waste management facilities and waste contractors in Western Australia. It has
been compiled by Waste Audit and Consultancy Services (Aust) Pty Ltd and Golder Associates Pty Ltd as part of the Department of Environment and
Conservation Disposal Based Audits.
It is recommended that this report should be treated at all times as confidential, unless permission for the release of specific data is received from the Department
of Environment and Conservation.
Waste Audit and Consultancy Services (Aust) Pty Ltd will be referred to as “WACS” within this report and Golder Associates Pty Ltd referred to as “Golder”. The
Department of Environment and Conservation will be referred to as DEC.
Waste Audit and Consultancy Services (Aust) Pty Ltd

Disposal Based Audits of the C&I and C&D Waste Streams Department of Environment and Conservation
Commercial in Confidence 3
Table of Contents 1 Executive Summary........................................................................................................... 4 2 Glossary ............................................................................................................................ 6 3 Project Objectives.............................................................................................................. 8 4 Project Methodology.......................................................................................................... 9
4.1 Overview................................................................................................................... 9 4.2 Landfill/Transfer Station Audit Sites.......................................................................... 9 4.3 Audit Methodology ...................................................................................................10
4.3.1 Pre-Audit .............................................................................................................10 4.3.2 Data Collection ....................................................................................................10 4.3.3 Waste Classification ............................................................................................11 4.3.4 Data Processing ..................................................................................................12
4.4 Absolute and Calculated Tonnage...........................................................................12 4.5 Limitations of Data ...................................................................................................12 4.6 Occupational Health and Safety Program................................................................13
5 Results .............................................................................................................................15 5.1 Overall Results ........................................................................................................15 5.2 Disposal Points ........................................................................................................17 5.3 C&I and C&D Waste for all Sites by Waste Category ..............................................17 5.4 Commercial and Industrial Waste Stream................................................................18 5.5 Construction and Demolition Waste Stream ............................................................21 5.6 Industry Sectors – Commercial and Industrial Waste Stream..................................23 5.7 Industry Sectors - Construction and Demolition Waste Stream ...............................28
6 Discussion ........................................................................................................................30 6.1 Commercial and Industrial Stream...........................................................................30 6.2 Waste Materials .......................................................................................................30 6.3 Construction and Demolition Waste Stream ............................................................31 6.4 Waste Materials .......................................................................................................31
7 Concluding Remarks ........................................................................................................32
Disposal Based Audits of the C&I and C&D Waste Streams Department of Environment and Conservation
Commercial in Confidence
4
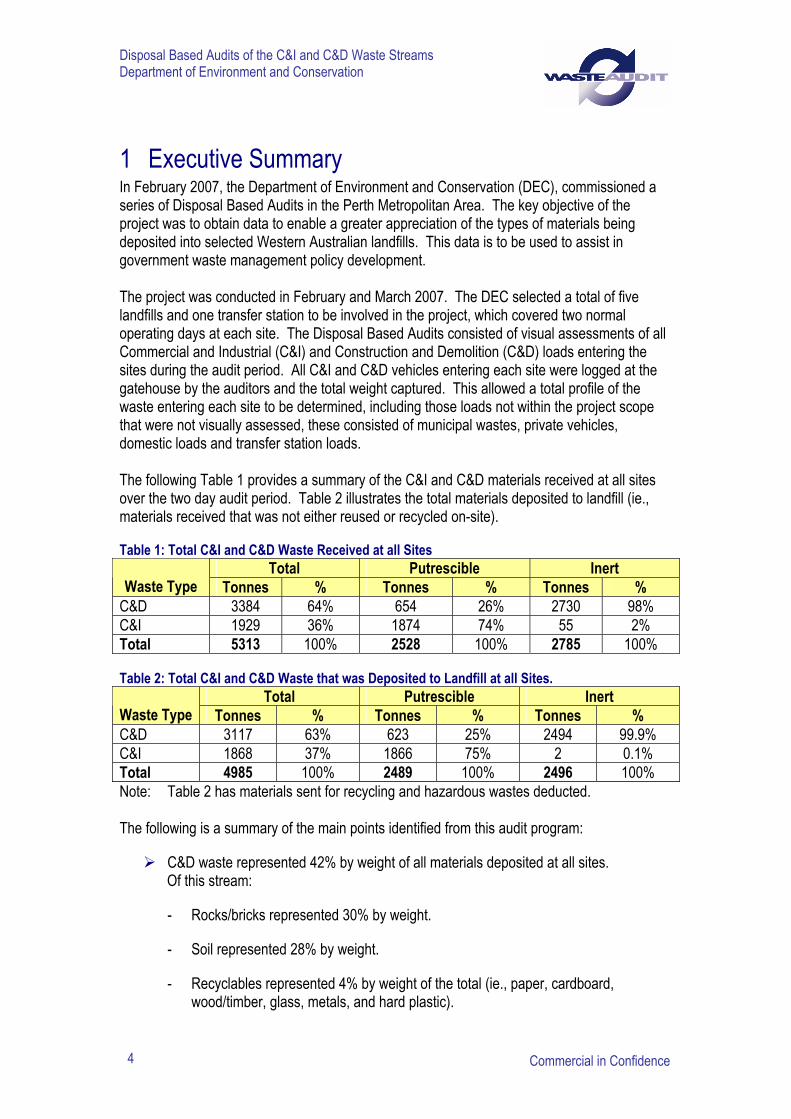
1 Executive Summary In February 2007, the Department of Environment and Conservation (DEC), commissioned a series of Disposal Based Audits in the Perth Metropolitan Area. The key objective of the project was to obtain data to enable a greater appreciation of the types of materials being deposited into selected Western Australian landfills. This data is to be used to assist in government waste management policy development. The project was conducted in February and March 2007. The DEC selected a total of five landfills and one transfer station to be involved in the project, which covered two normal operating days at each site. The Disposal Based Audits consisted of visual assessments of all Commercial and Industrial (C&I) and Construction and Demolition (C&D) loads entering the sites during the audit period. All C&I and C&D vehicles entering each site were logged at the gatehouse by the auditors and the total weight captured. This allowed a total profile of the waste entering each site to be determined, including those loads not within the project scope that were not visually assessed, these consisted of municipal wastes, private vehicles, domestic loads and transfer station loads. The following Table 1 provides a summary of the C&I and C&D materials received at all sites over the two day audit period. Table 2 illustrates the total materials deposited to landfill (ie., materials received that was not either reused or recycled on-site).
Table 1: Total C&I and C&D Waste Received at all Sites Total Putrescible Inert
Waste Type Tonnes % Tonnes % Tonnes % C&D 3384 64% 654 26% 2730 98% C&I 1929 36% 1874 74% 55 2% Total 5313 100% 2528 100% 2785 100%
Table 2: Total C&I and C&D Waste that was Deposited to Landfill at all Sites. Total Putrescible Inert
Waste Type Tonnes % Tonnes % Tonnes % C&D 3117 63% 623 25% 2494 99.9% C&I 1868 37% 1866 75% 2 0.1% Total 4985 100% 2489 100% 2496 100% Note: Table 2 has materials sent for recycling and hazardous wastes deducted. The following is a summary of the main points identified from this audit program:
C&D waste represented 42% by weight of all materials deposited at all sites. Of this stream:
- Rocks/bricks represented 30% by weight.
- Soil represented 28% by weight.
- Recyclables represented 4% by weight of the total (ie., paper, cardboard, wood/timber, glass, metals, and hard plastic).

Disposal Based Audits of the C&I and C&D Waste Streams Department of Environment and Conservation
Commercial in Confidence 5
C&I waste represented 24% by weight of all materials deposited at all sites. Of this stream:
- Food/kitchen waste represented 22% by weight.
- Recyclables represented 35% by weight of the total (ie., paper, cardboard, wood/timber, glass, metals, and hard plastic).
Mixed SME’s represented 37% by weight of the total C&I waste, followed by Retail Trade at 23% by weight.
Residential Development represented 26% by weight of the C&D waste followed by Residential Demolition at 23% by weight.
This project provides a snapshot of the types of C&I and C&D materials being deposited at the audited landfills for a two day period. DEC can use the compositional data contained in this report, in conjunction with the quantities of C&I and C&D materials reported by each of the landfills, to provide an estimate of the types and quantities of material deposited at these landfills per annum. There should be caution in extrapolating this data, and in particular the relative percentages of the C&I and C&D waste disposed to landfill. DEC advises that of the waste disposed of to landfill in the Perth Metropolitan Area:
Municipal waste stream represent approximately 20%-25%; C&I waste stream represents approximately 20%-25%; and C&D waste stream represents approximately 50%-55%.

Disposal Based Audits of the C&I and C&D Waste Streams The Western Australian Department of Environment and Conservation
Commercial in Confidence 6
2 Glossary A brief description of some of the more common terms used in this report is listed below.
ANZSIC Codes Australian New Zealand Standard Industry Classification Codes.
Calculated Weight Load weights calculated using visual assessment, standard waste densities and the percentage composition by waste category.
Clean fill Clay, soil and crushed rock which is not contaminated or mixed with any other material.
Commercial and Industrial (C&I) Waste
Wastes generated by businesses and industries (such as shopping centres, restaurants and offices) and institutions (such as schools, hospitals and government offices).
Construction and Demolition (C&D) Waste
Material resulting from the demolition, erection, construction, refurbishment or alteration of buildings or from the construction, repair or alteration of infrastructure-type development (such as roads, bridges, dams, tunnels, railways and airports).
Domestic Waste Waste collected as part of the Council rates system from residential premises.
General Tipping Face The main tipping area at a landfill site.
Hazardous Tipping Area Tipping area for hazardous materials (eg., asbestos).
Landfill A waste management site where waste material is disposed of to land.
Low Level Contaminated Soil Soil with levels of contaminants in the elutriable fraction within specified limits as set by the Western Australian Department of Environment and Conservation.
Municipal Waste Waste generated by councils during their maintenance of civic infrastructure such as roads, parks and gardens.
Private Waste Waste delivered by the householder directly to a waste facility.

Disposal Based Audits of the C&I and C&D Waste Streams Department of Environment and Conservation
Commercial in Confidence 7
Putrescible Waste Waste able to be decomposed by bacterial action. Includes domestic garbage, commercial waste, vegetables, supermarket processing, deli, butchers etc., garden clippings and prunings.
Recycling Areas All recycling tipping areas (eg. green waste, wood / pallets, bricks / rubble).
Small Vehicle Transfer Station Area / Small Vehicle Area
Separate on site area specifically set aside to allow smaller household and commercial vehicles to recycle and dispose of their waste away from the main tipping area. Waste is then consolidated and transferred to the main tipping face.
Soil Soil includes soil contained in mixed C&I and C&D loads; and soils mixed with clay, crushed rock and other material.
Solid Inert Waste Hard waste and dry vegetative material which has negligible activity or effect on the environment. For example, demolition material, concrete, bricks, timber, plastic, glass, metals, bitumen, trees and shredded tyres.
Standard Waste Densities Waste densities derived from physical audits undertaken during previous disposal based audits.
Transfer Station An intermediate waste management facility where waste is consolidated prior to transport off-site for treatment or disposal.
Transfer Station Waste Consolidated waste delivered by a transfer station to a waste facility.
Vehicle Net Weight The difference between the gross and tare weights of the vehicle at the weighbridge.
Visual Assessment The visual assessment of each waste load and recording of estimates of the percentage proportion of each waste category within the load.
Waste Audit The physical sorting of a waste sample into individual waste categories to determine the composition of the sample.

Disposal Based Audits of the C&I and C&D Waste Streams Department of Environment and Conservation
Commercial in Confidence
8
3 Project Objectives The key objective of the project, as outlined by the DEC, was to conduct a suite of Disposal Based Audits to gain an understanding of the main waste types and quantities being disposed in metropolitan Perth. The waste streams are:
Construction and Demolition (C&D) waste; and
Commercial and Industrial (C&I) waste. The primary aims of the Disposal Based Audit project were to:
Devise a methodology for analysing the composition of C&I and C&D waste from across the Perth Metropolitan Area.
Conduct Disposal Based Audits, based on the developed methodology to obtain data which provides a level of statistical significance to allow extrapolation to cover the majority of C&I and C&D waste generated in the Perth Metropolitan Area.
Conduct waste compositional analyses as per the methodology. Ensuring wastes are classified by material type and where possible by product type including packaging.
Analyse data to present a broad picture of the composition of waste from C&I and C&D sources in the Perth Metropolitan Area.

Disposal Based Audits of the C&I and C&D Waste Streams Department of Environment and Conservation
Commercial in Confidence 9
4 Project Methodology The following summarises the methodology undertaken to achieve the project objectives.
4.1 Overview In February 2007, the DEC commissioned Waste Audit & Consultancy Services (Aust) Pty Ltd (WACS) and Golder Associates Pty Ltd (Golder) to undertake a series of Disposal Based Audits at selected licensed waste management facilities within Western Australia. The key purpose of the study was to profile the materials being disposed of to landfill/transfer stations. Fundamental to the development of a strategic approach to resource management is access to accurate data and information. It is anticipated that this report and its results will assist in confirming priorities for solid waste reduction and the diversion of solid waste from landfill disposal. The methodology developed to achieve these outcomes involved detailed visual assessments of the materials disposed of at each of the selected sites to provide compositional analysis, by category, of the waste streams. This data was coupled with information collected at the facilities’ weighbridges on the primary waste category (ie., C&I or C&D) of the delivered materials, the main industry sector generating the materials and the source of the waste by locality. The project was programmed over a two week period from 21st February through to 2nd March 2007. The audits at each of the sites were conducted over two normal operating days.
4.2 Landfill/Transfer Station Audit Sites The following sites were selected by the DEC for participation in the Disposal Based Audits:
Tamala Park, Mindarie
Quinns Road (RCG), Neerabup
Transfer Station, Welshpool
Tims Thicket, Mandurah
Henderson (C&I), Henderson
Henderson (RCG), Henderson A summary of each of the sites is contained in Appendix A. The DEC Disposal Based Audit schedule for the sites is illustrated in Table 3.

Disposal Based Audits of the C&I and C&D Waste Streams The Western Australian Department of Environment and Conservation
Commercial in Confidence 10
Table 3: Disposal Based Audit Schedule for each Site.
Site Location Site Type Audit Period
Tamala Park, Mindarie C&I Landfill 21st and 22nd February 2007 Quinns Road (RCG), Neerabup
C&D Landfill 21st and 22nd February 2007
Welshpool C&I Transfer Station 26th and 27th February 2007 Tims Thicket, Mandurah C&D Landfill 26th and 27th February 2007 Henderson (C&I), Henderson C&I Landfill 1st and 2nd March 2007 Henderson (RCG), Henderson C&D Landfill 1st and 2nd March 2007
4.3 Audit Methodology The following provides an overview of the methodology for data collection and analysis for this project.
4.3.1 Pre-Audit
WACS and Golder met with the DEC Project Manager to agree on the proposed project timing and methodology, and project protocols.
Prior to the commencement of the project, WACS and Golder’s staff confirmed with representatives of the DEC in regards to the compositional analysis of the C&I and C&D waste streams. Agreement was reached to ensure data on all waste types that the DEC required would be collected.
The Project Director visited the nominated sites to ascertain logistical issues such as viewing area for auditors, operations of the gatehouse, facilities and site safety issues. These site visits also allowed for discussions to determine if there were any “site specific” additional occupational health and safety requirements. The visits also confirmed all necessary resources including auditing equipment and Personal Protective Equipment.
4.3.2 Data Collection
Gatehouse Data
The details of all vehicles that entered each of the sites were captured at the gatehouse, including those not within the project scope that were not visually assessed, these consisted of municipal wastes, private vehicles, domestic loads and transfer station loads.
The auditor stationed at the gatehouse questioned the drivers of the vehicles and identified each load in terms of the time of arrival; the waste transport company; the vehicle registration, type, weight and size; the primary source of the load by industry sector; the primary source of the load by suburb and the waste stream. Responses were then logged.
Visual Assessment Data
Auditors stationed at each of the on-site disposal points conducted visual assessments of those loads that represented the C&I and C&D streams. The auditors recorded the composition of each load by specified waste category. The gatehouse data and the visual assessment data

Disposal Based Audits of the C&I and C&D Waste Streams Department of Environment and Conservation
Commercial in Confidence 11
was matched using the vehicle registration number and time of arrival, allowing correlation of the vehicle net weight and the percentage composition of the load.
4.3.3 Waste Classification
Waste was classified according to the Australian Waste Database, (AWD) classification system.
There are some limitations to the AWD system in terms of detailed material types, for example “pallets” are not identified separately from wood. Where we believe that additional detail such as this is of value, we classify the material into sub-categories of the higher level AWD number. In this way the additional detail is available in the project database, but the information can be tallied back up to AWD level.
The distance auditors are required to be from the tipping face, and the often short time available for visual analysis may limit the degree of detail collected during the visual audit process. Details such as “printing paper” versus “paper” will only be recorded as such where the percentages are high. For example in loads from offices it may be clearly “printing paper” whereas in other mixed loads it may only be described as “paper”.
The following are the categories used for this Disposal Based Audit project. Table 4: Visual Assessment Waste Categories
Waste Categories
Paper Textile - Furniture Rubble > 150mm Compacted Dry Cardboard Textile Clay Compacted Wet Cardboard Textile - Carpet Concrete Loose Dry Cardboard Foam Rocks (specify if Limestone) Loose Wet Cardboard Tyres / Rubber (note if tyres) Bricks
Waxed Cardboard Glass (note panes or containers) Asphalt Food / Kitchen Bags & Film – Plastic Plasterboard Food – dense Hard Plastic Garbage Bags Vegetation – branches / grass clips
Polystyrene Other C&D (specify)
Wood / Timber Ferrous Metal Other C&I (specify) Wood / Timber - Pallets Non Ferrous Metal Controlled (specify) Wood / Timber - Furniture Soil Clean fill < 150mm Whitegoods / e-waste (details of
specific items were recorded)
As indicated in the table, auditors were required to make notes as to any specific types of materials observed. For example, the auditor would note if the rubber waste was tyres or other types of rubber. If both were present, then the auditor would note the two types and the relative volume.
In addition to the categories, auditors also made notes of any other materials that were in a load that relate to the project objectives.

Disposal Based Audits of the C&I and C&D Waste Streams The Western Australian Department of Environment and Conservation
Commercial in Confidence 12
Data Management
Dedicated data sheets were used for the Gatehouse and Visual Audits. As part of the quality control process, all data sheets were printed with a unique sequential number and signed out to auditors each day by the on-site audit manager. At the end of each day, auditors were required to account for all sheets issued to them (used and unused).
4.3.4 Data Processing
An ACCESS database is used for the project. This database has been used in previous disposal based audits. The database contains a number of sheets with automatic links to the source data input sheet. All data was entered into the source data file that records all information on the gatehouse data recording sheet and the visual data recording sheets. Loads are entered by percentage composition (by volume) of material.
Separate support files contain information on material densities. The density data is based on compaction levels as certain material densities vary greatly depending on degree of compaction.
Once a load is entered the volume data is automatically converted to weight data and the results displayed in a separate linked table. The ‘estimated’ weight, based on the conversion of visual audit data and densities, is then compared to the actual load weight (ie. weighbridge net weight) as recorded on the gatehouse sheets.
Quality control processes required that random quality checks were made with the data processing person to ensure that data input into the database is accurate.
4.4 Absolute and Calculated Tonnage It is important to note that the figures presented in this report are derived from two sources. The tonnage data relating to total waste, disposal point and industry sector are taken from net load weights collected at the weighbridge. Data relating to waste categories and load composition are derived from the visual audits. The derived data values will vary from the absolute data as they are produced from calculations using visual assessment, standard densities and volume estimates and as such are not absolute tonnage figures.
4.5 Limitations of Data The results presented in this study provide an excellent snapshot of the waste being delivered into the selected Western Australian landfill/transfer stations over the course of the Disposal Based Audits. This study has significant value in providing a profile of the materials being disposed of to landfill and assisting in the further development of the government’s waste management strategy. It should be noted however that the results do have limitations as outlined below:
The data collected does not take into account the weekly variations of individual sites or variations due to other factors such as seasonality and weather.
Disposal Based Audits of the C&I and C&D Waste Streams Department of Environment and Conservation
Commercial in Confidence 13
The compositional data is based on a visual assessment of loads as they are tipped at the general tipping face. Limitations of this process include the visibility and time available for auditors to visually assess the load before the material is compacted. Some items may not be seen due to their size and their being contained within the load. Every attempt was made to overcome these limitations by undertaking a second visual assessment of each load and where possible, observing as the load was moved by the compactor.
The waste density data used to determine the calculated tonnage data was derived from physical audits conducted during previous Disposal Based Audits. These densities are average material densities.
In addition, WACS has had discussions with organisations/individuals who manage specific materials on an ongoing basis, to verify the densities of these waste materials.
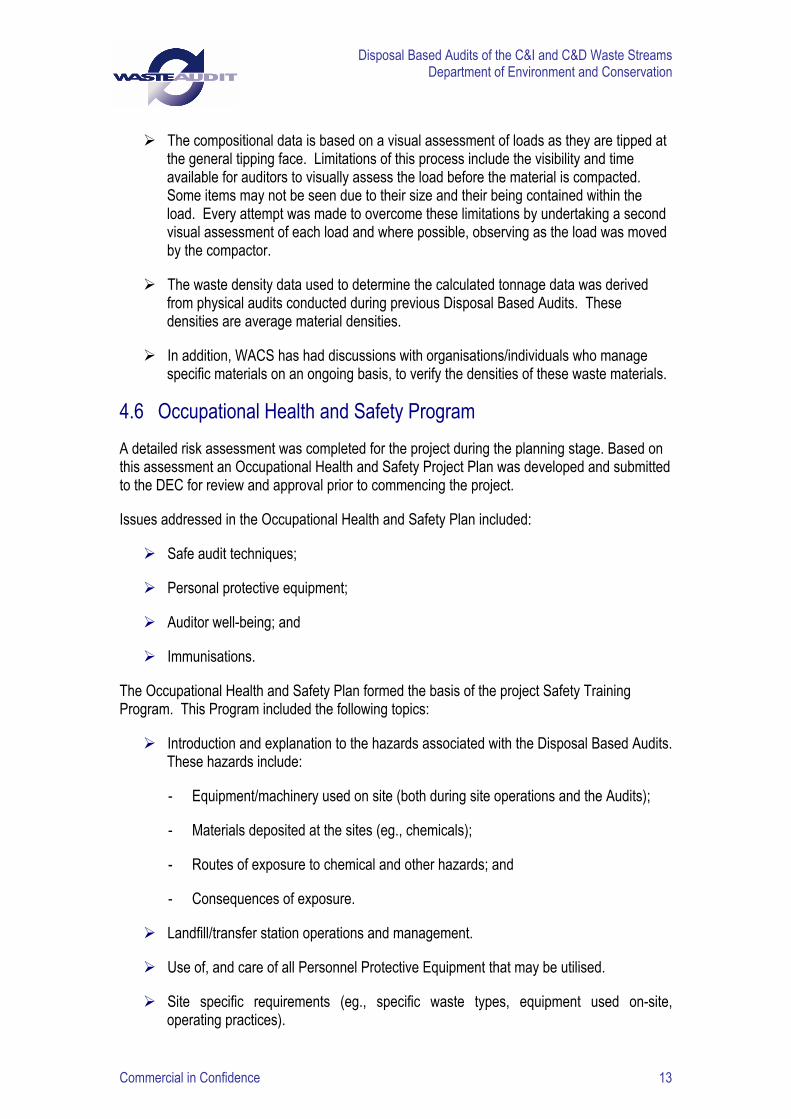
4.6 Occupational Health and Safety Program A detailed risk assessment was completed for the project during the planning stage. Based on this assessment an Occupational Health and Safety Project Plan was developed and submitted to the DEC for review and approval prior to commencing the project.
Issues addressed in the Occupational Health and Safety Plan included:
Safe audit techniques;
Personal protective equipment;
Auditor well-being; and
Immunisations.
The Occupational Health and Safety Plan formed the basis of the project Safety Training Program. This Program included the following topics:
Introduction and explanation to the hazards associated with the Disposal Based Audits. These hazards include:
- Equipment/machinery used on site (both during site operations and the Audits);
- Materials deposited at the sites (eg., chemicals);
- Routes of exposure to chemical and other hazards; and
- Consequences of exposure.
Landfill/transfer station operations and management.
Use of, and care of all Personnel Protective Equipment that may be utilised.
Site specific requirements (eg., specific waste types, equipment used on-site, operating practices).
Disposal Based Audits of the C&I and C&D Waste Streams The Western Australian Department of Environment and Conservation
Commercial in Confidence 14
Basic first-aid procedures.
Personal hygiene.
All staff working on this project were required to attend a Safety and Project Briefing. WACS and Golder staff were also issued with a copy of the project risk assessment and Occupational Health and Safety Plan. WACS and Golder staff were also required to confirm their understanding of the Plan and commitment to the safety protocols.
In addition, several sites conducted site specific safety inductions. Audit staff were required to attend these inductions.

Disposal Based Audits of the C&I and C&D Waste Streams Department of Environment and Conservation
Commercial in Confidence 15
5 Results Data gathered from Disposal Based Audits is used to arrive at a total estimate of the quantities and composition of the C&I and C&D waste streams. This information can then be used for the development or review of State government waste management strategies.
It should be noted that as some of the materials deposited to landfill had a very low weight, but a significant volume (eg., polystyrene and loose cardboard), it was deemed necessary to present data to two decimal places so that the proportion of these materials can be seen in relation to other materials.
The data from the Disposal Based Audits conducted for this project should be extrapolated with the data on the quantity of C&I and C&D waste being disposed of to landfills in the Perth Metropolitan area (as currently collected by the Western Australian Department of Environment and Conservation). This will then give an accurate understanding of the type and quantity of specific waste materials being deposited to landfill. From this, strategic programs can be developed to divert these materials from landfill.
In addition, the data gathered for this project will also indicate the specific industry sectors that can be targeted to achieve greater diversion of materials.
5.1 Overall Results Six sites were surveyed as part of this project, each over a two day operating period. During the survey period a total of 1,561 vehicles were logged at the gatehouses.
Table 5 illustrates the total waste received at all sites by waste stream.
Table 5: Total Waste Received at all Sites by Waste Streams Total Putrescible Inert Waste Type Tonnes % Tonnes % Tonnes %
C&D 3384 41% 654 12% 2730 96% C&I 1929 24% 1874 36% 55 2% Domestic 1262 16% 1262 24% 0 0% Transfer Station 678 8% 678 13% 0 0% Municipal 307 4% 299 6% 8 0.3% MRF 290 4% 290 6% 0 0% Domestic C&I 133 2% 133 3% 0 0% Private 90 1% 46 1% 45 2% Total 8073 100% 5236 100% 2838 100% Note: Domestic C&I waste refers to wastes that had been collected from domestic and commercial premises (ie., mixed together).

Disposal Based Audits of the C&I and C&D Waste Streams The Western Australian Department of Environment and Conservation
Commercial in Confidence 16
Graph 1 illustrates the proportional representation by weight of each of the waste streams across the total waste received at all sites during the waste audits. Graph 1: Total Waste Received at all Sites
C&I24%
Domestic16%
C&D41%
Transfer Station8%
Municipal4%
MRF4%
Domestic C&I2%
Private1%
Table 6 and Graph 2 illustrate for all sites the materials sent to landfill for disposal (ie., not reused on site or recycled).
Table 6: Total Waste to Landfill by Waste Stream at all Sites Total Putrescible Inert
Waste Type Tonnes % Tonnes % Tonnes % C&D 3117 42% 623 13% 2494 98% C&I 1868 25% 1866 38% 2 0.1% Domestic 1262 17% 1262 26% 0 0% Transfer Station 640 9% 640 13% 0 0% Municipal 307 4% 299 6% 8 0.3% Domestic C&I 133 2% 133 3% 0 0% Private 90 1% 46 1% 44 2% Total 7417 100% 4869 100% 2548 100%
Refer to Table 7 for detail as to the disposal point(s) for all materials. For example, some materials such as cleanfill were stockpiled on-site to be used as daily cover. Other material such as rubble was used for internal roads.

Disposal Based Audits of the C&I and C&D Waste Streams Department of Environment and Conservation
Commercial in Confidence 17
Graph 2: Total Waste Disposed of to Landfill at all Sites
Transfer Station9%
Domestic17%
C&I25%
C&D42%
Domestic C&I2%
Municipal4%
Private1%
5.2 Disposal Points The following table illustrates the disposal points for all the waste received at all sites during the course of the waste audits. The information was initially recorded by the gatehouse auditor and then recorded by the visual auditor on the datasheets as the waste was tipped. At each site the main tipping face was termed the general tipping face.
Table 7: Total Waste Received at all Sites by Disposal Point Total Putrescible Inert
Disposal Point tonnes % tonnes % tonnes % General Tipping Face 7594 94% 5046 96% 2548 90% Cleanfill 215 3% 29 1% 186 7% Small vehicle transfer station area 114 1% 114 2% 0 0% Hazardous 113 1% 10 0.2% 103 4% Other 38 0.5% 38 1% 0 0% Total 8074 100% 5236 100% 2837 100%
5.3 C&I and C&D Waste for all Sites by Waste Category Refer to Appendix B for tables and graphs illustrating the composition of the C&I and C&D wastes received at each individual site for this project. The C&I waste is illustrated with garbage bags as a separate waste category, and additionally with the composition of the garbage bags apportioned to the appropriate waste category.

Disposal Based Audits of the C&I and C&D Waste Streams The Western Australian Department of Environment and Conservation
Commercial in Confidence 18
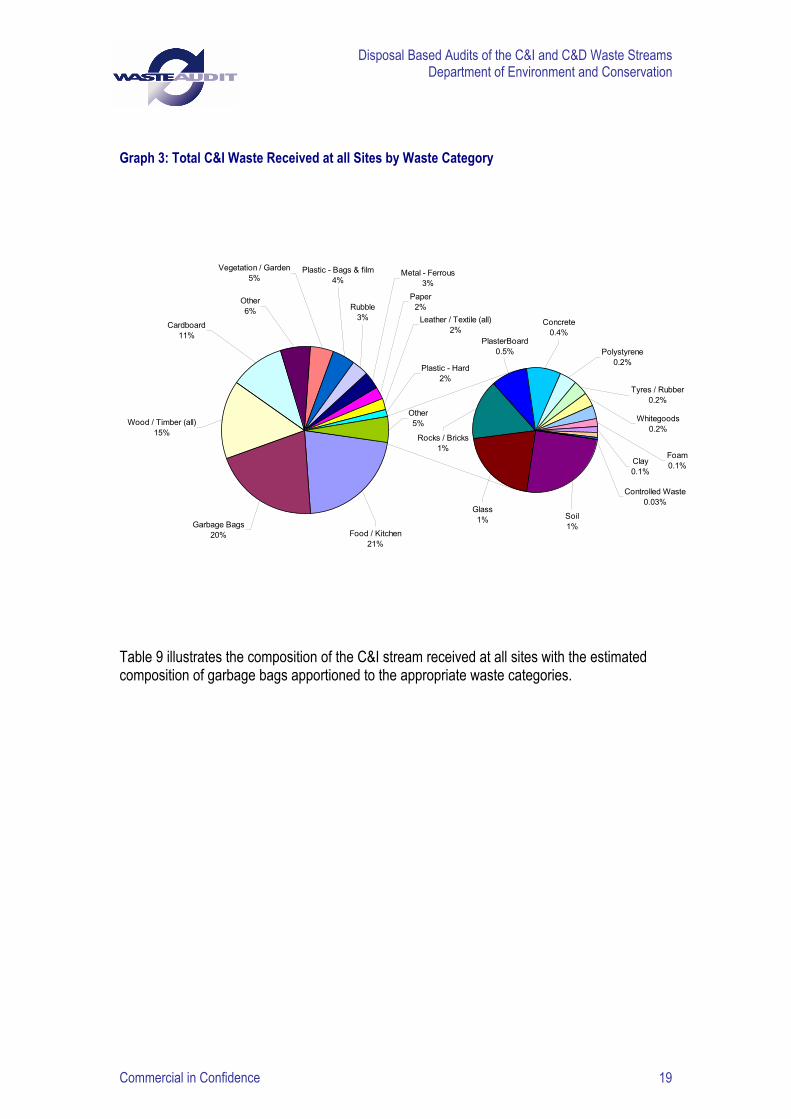
5.4 Commercial and Industrial Waste Stream Table 8 illustrates the composition of the C&I waste stream received at all of the sites during the waste audits. A comparison is provided for the C&I waste received at putrescible sites and the C&I waste stream received at the solid inert sites. Garbage bags represented 20.36% by weight of the total C&I waste stream. It should be noted that the soil illustrated in this table (23.24 tonnes) was observed during the visual assessments as being delivered as part of mixed loads of other materials.
Table 8: Total C&I Waste Received at All Sites by Waste Category Total Putrescible Inert
Waste Category Tonnes % tonnes % tonnes % Food / Kitchen 407 21% 407 22% 0 0% Garbage Bags 386 20% 386 21% 0 0% Wood / Timber (all) 291 15% 291 16% 0 0% Cardboard 201 11% 201 11% 0 0% Other 107 6% 107 6% 0 0% Vegetation / Garden 86 5% 85 5% 0 0% Plastic - Bags & film 84 4% 84 5% 0 0% Rubble 63 3% 12 1% 51 91% Metal - Ferrous 62 3% 62 3% 0 0% Paper 43 2% 43 2% 0 0% Leather / Textile (all) 40 2% 40 2% 0 0% Plastic - Hard 30 2% 30 2% 0 0% Soil 23 1% 23 1% 0 0% Glass 19 1% 19 1% 0 0% Rocks / Bricks 15 1% 10 1% 4 8% Plasterboard 9 0.5% 9 0.5% 0 0% Concrete 8 0.4% 8 0.4% 1 1% Polystyrene 4 0.2% 4 0.2% 0 0% Tyres / Rubber 4 0.2% 4 0.2% 0 0% Whitegoods 3 0.2% 3 0.2% 0 0% Metal - Non-Ferrous 3 0.2% 3 0.2% 0 0% Foam 2 0.1% 2 0.1% 0 0% Clay 1 0.1% 1 0.1% 0 0% Cardboard - Waxed 1 0.1% 1 0.1% 0 0% Controlled Waste 1 0.03% 1 0.03% 0 0% Asphalt 0 0% 0 0% 0 0% Total 1893 100% 1838 100% 56 100% Graph 3 illustrates the proportional representation of the C&I Waste stream received at all sites by waste category.
Disposal Based Audits of the C&I and C&D Waste Streams Department of Environment and Conservation
Commercial in Confidence 19
Graph 3: Total C&I Waste Received at all Sites by Waste Category
Other5%
Controlled Waste0.03%
Whitegoods0.2%
Tyres / Rubber0.2%
Clay0.1%
Foam0.1%
Polystyrene0.2%
Rocks / Bricks1%
Concrete0.4%
PlasterBoard0.5%
Metal - Ferrous3%
Paper2%
Leather / Textile (all)2%
Plastic - Hard2%
Rubble3%
Soil1%
Glass1%
Wood / Timber (all)15%
Garbage Bags20% Food / Kitchen
21%
Cardboard11%
Other6%
Vegetation / Garden5%
Plastic - Bags & film4%
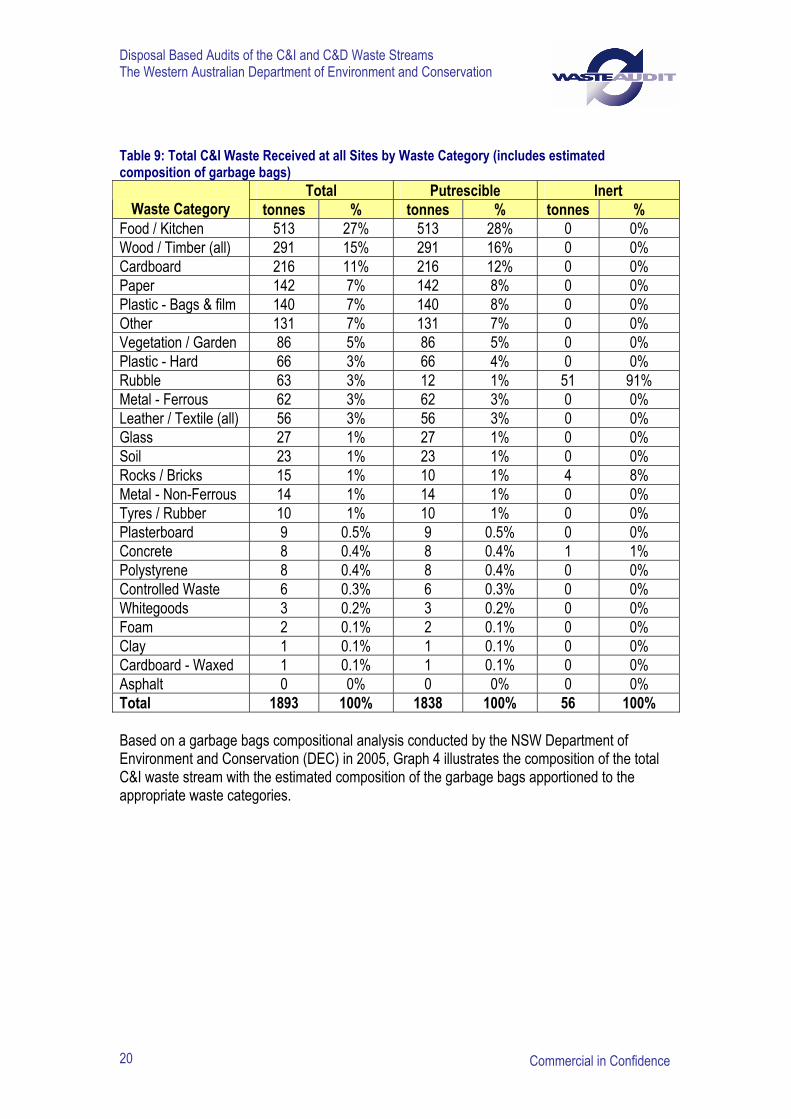
Table 9 illustrates the composition of the C&I stream received at all sites with the estimated composition of garbage bags apportioned to the appropriate waste categories.
Disposal Based Audits of the C&I and C&D Waste Streams The Western Australian Department of Environment and Conservation
Commercial in Confidence 20
Table 9: Total C&I Waste Received at all Sites by Waste Category (includes estimated composition of garbage bags)
Total Putrescible Inert Waste Category tonnes % tonnes % tonnes %
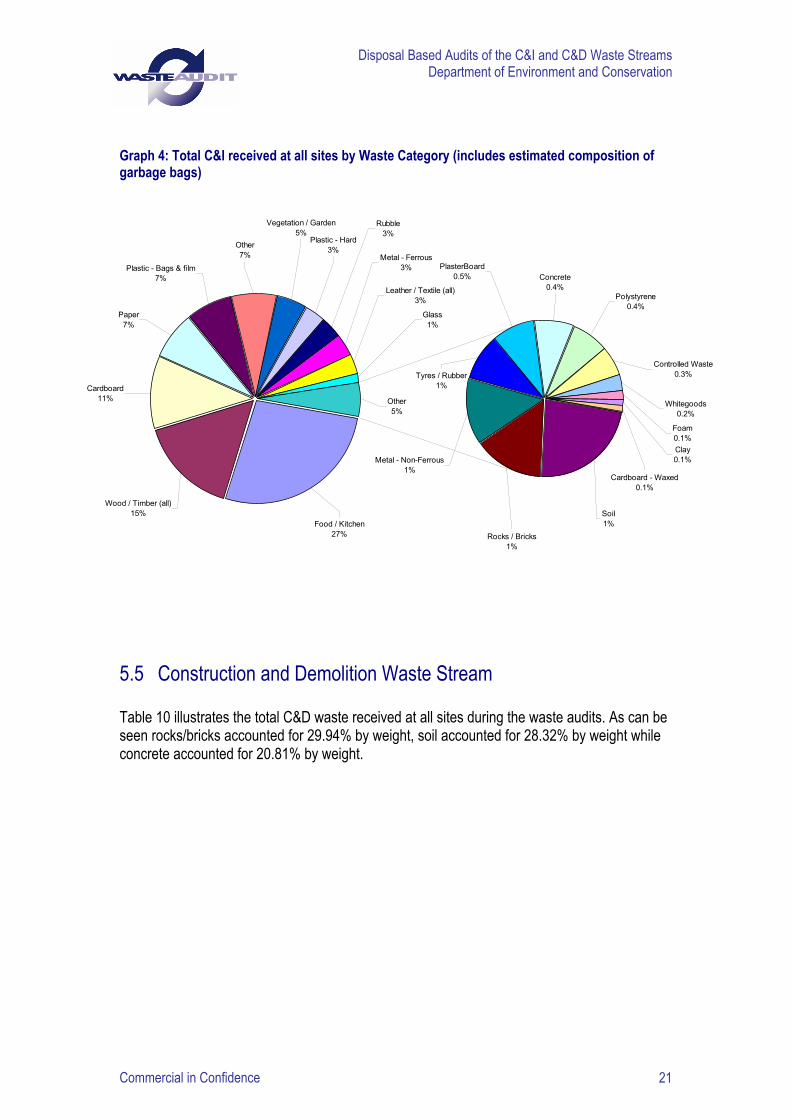
Food / Kitchen 513 27% 513 28% 0 0% Wood / Timber (all) 291 15% 291 16% 0 0% Cardboard 216 11% 216 12% 0 0% Paper 142 7% 142 8% 0 0% Plastic - Bags & film 140 7% 140 8% 0 0% Other 131 7% 131 7% 0 0% Vegetation / Garden 86 5% 86 5% 0 0% Plastic - Hard 66 3% 66 4% 0 0% Rubble 63 3% 12 1% 51 91% Metal - Ferrous 62 3% 62 3% 0 0% Leather / Textile (all) 56 3% 56 3% 0 0% Glass 27 1% 27 1% 0 0% Soil 23 1% 23 1% 0 0% Rocks / Bricks 15 1% 10 1% 4 8% Metal - Non-Ferrous 14 1% 14 1% 0 0% Tyres / Rubber 10 1% 10 1% 0 0% Plasterboard 9 0.5% 9 0.5% 0 0% Concrete 8 0.4% 8 0.4% 1 1% Polystyrene 8 0.4% 8 0.4% 0 0% Controlled Waste 6 0.3% 6 0.3% 0 0% Whitegoods 3 0.2% 3 0.2% 0 0% Foam 2 0.1% 2 0.1% 0 0% Clay 1 0.1% 1 0.1% 0 0% Cardboard - Waxed 1 0.1% 1 0.1% 0 0% Asphalt 0 0% 0 0% 0 0% Total 1893 100% 1838 100% 56 100% Based on a garbage bags compositional analysis conducted by the NSW Department of Environment and Conservation (DEC) in 2005, Graph 4 illustrates the composition of the total C&I waste stream with the estimated composition of the garbage bags apportioned to the appropriate waste categories.
Disposal Based Audits of the C&I and C&D Waste Streams Department of Environment and Conservation
Commercial in Confidence 21
Graph 4: Total C&I received at all sites by Waste Category (includes estimated composition of garbage bags)
Wood / Timber (all)15%
Cardboard11%
Paper7%
Other5%
Food / Kitchen27%
Leather / Textile (all)3%
Metal - Ferrous3%
Rubble3%
Plastic - Hard3%
Vegetation / Garden5%
Other7%
Plastic - Bags & film7%
Glass1%
Soil1%
Concrete0.4%
Tyres / Rubber1%
Rocks / Bricks1%
Metal - Non-Ferrous1%
PlasterBoard0.5%
Polystyrene0.4%
Controlled Waste0.3%
Whitegoods0.2%
Foam0.1%Clay0.1%
Cardboard - Waxed0.1%
5.5 Construction and Demolition Waste Stream Table 10 illustrates the total C&D waste received at all sites during the waste audits. As can be seen rocks/bricks accounted for 29.94% by weight, soil accounted for 28.32% by weight while concrete accounted for 20.81% by weight.

Disposal Based Audits of the C&I and C&D Waste Streams The Western Australian Department of Environment and Conservation
Commercial in Confidence 22
Table 10: Total C&D Waste received at all sites by Waste Category Total Putrescible Inert
Waste Category Tonnes % tonnes % tonnes % Rocks / Bricks 935 30% 63 12% 873 34% Soil 885 28% 296 55% 589 23% Concrete 650 21% 27 5% 623 24% Rubble 419 13% 57 11% 362 14% Other 65 2% 39 7% 26 1% Wood / Timber (all) 49 2% 17 3% 32 1% Metal - Ferrous 43 1% 10 2% 33 1% Plasterboard 19 1% 8 1% 11 0.4% Vegetation / Garden 17 1% 15 3% 2 0.1% Clay 12 0.4% 0 0% 12 0.5% Cardboard 8 0.3% 4 1% 4 0.2% Controlled Waste 6 0.2% 1 0.1% 6 0.2% Plastic - Hard 4 0.1% 2 0.3% 3 0.1% Polystyrene 3 0.1% 0.1 0.01% 2 0.1% Plastic - Bags & film 2 0.1% 1 0.1% 1 0.1% Leather / Textile (all) 2 0.1% 2 0.3% 0.2 0.01% Garbage Bags 2 0.1% 1 0.2% 0.4 0.01% Paper 1 0.04% 1 0.1% 1 0.02% Glass 1 0.04% 1 0.1% 0.4 0.02% Metal - Non-Ferrous 1 0.02% 0.2 0.03% 1 0.02% Whitegoods 1 0.02% 1 0.1% 0.04 0.002% Foam 1 0.02% 0.01 0.002% 1 0.02% Asphalt 0.2 0.01% 0 0% 0.2 0.01% Tyres / Rubber 0 0% 0 0% 0.04 0.002% Cardboard - Waxed 0 0% 0 0% 0 0% Food / Kitchen 0 0% 0 0% 0 0% Total 3125 100% 543 100% 2582 100%
Graph 5 illustrates the composition of the C&D waste stream received at all sites by waste category.

Disposal Based Audits of the C&I and C&D Waste Streams Department of Environment and Conservation
Commercial in Confidence 23
Graph 5: Total C&D Waste Received at all Sites by Waste Category
Cardboard0.3%
Foam0.02%
Whitegoods0.02%
Metal - Non-Ferrous0.02%
Plastic - Bags & film0.1%
Polystyrene0.1%
Rocks / Bricks30%
Soil28%
Concrete21%
Plastic - Hard0.1%
Asphalt0.01%
Controlled Waste0.2%
Glass0.04%
Paper0.04%
Garbage Bags0.1%
Leather / Textile (all)0.1%
Clay0.4%
PlasterBoard1%
Other1%
Vegetation / Garden1%
Metal - Ferrous1%
Wood / Timber (all)2%
Other2%
Rubble13%
5.6 Industry Sectors – Commercial and Industrial Waste Stream An important aspect of the waste audit was the recording of information on the industry sectors generating the waste received. This information was collected by questioning the drivers delivering waste and recorded by the gatehouse auditors.
Table 11 details the industry sectors generating C&I waste across all sites.

Disposal Based Audits of the C&I and C&D Waste Streams The Western Australian Department of Environment and Conservation
Commercial in Confidence 24
Table 11: Total C&I Waste Received at all Sites by Industry Sector Total Putrescible Inert Industry Type tonnes % tonnes % tonnes %
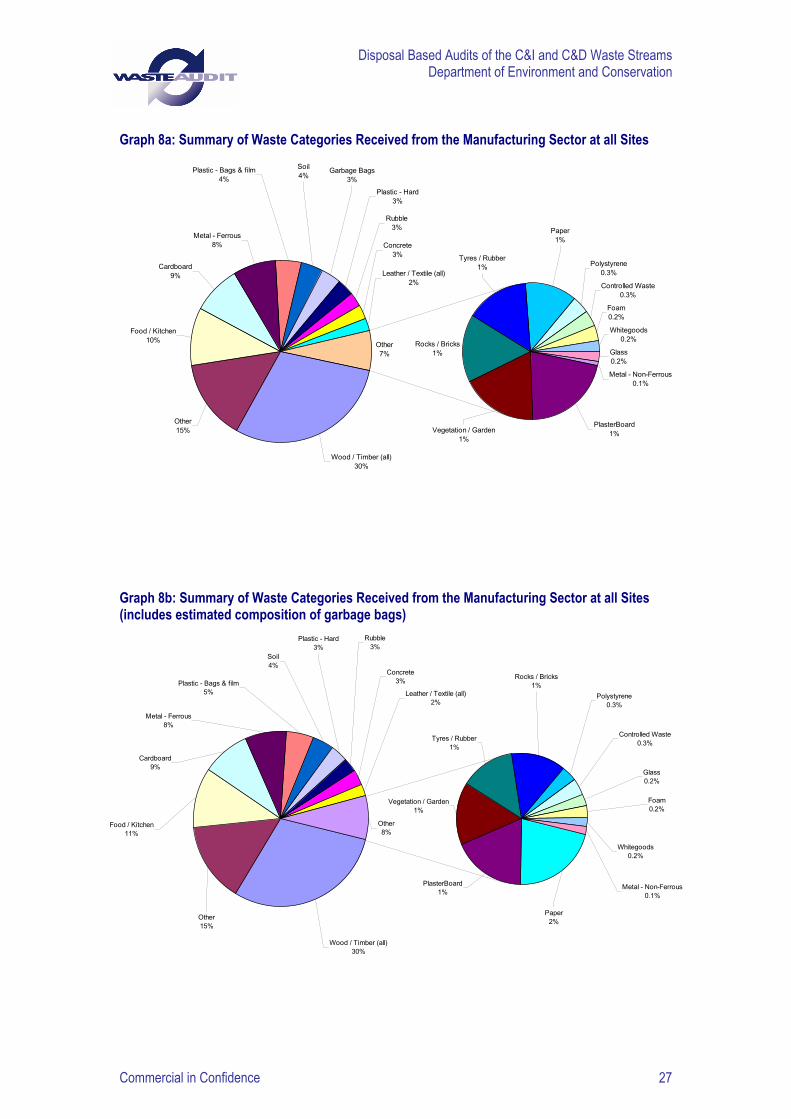
Mixed SME’s 658 37% 658 38% 0 0% Retail Trade 413 23% 411 24% 2 3% Manufacturing 213 12% 213 12% 0 0% Hospitality 86 5% 86 5% 0 0% Health & Community Services 64 4% 64 4% 0 0% Personal & other 55 3% 55 3% 0 0% Construction 53 3% 0 0% 53 97% Transport & Storage 52 3% 52 3% 0 0% Unknown 31 2% 31 2% 0 0% Cultural & Entertainment 31 2% 31 2% 0 0% Property & Business Services 29 2% 29 2% 0 0% Government/Admin/Defence 23 1% 23 1% 0 0% Trade (Plumber, kitchen fitter) 18 1% 18 1% 0 0% Wholesale Trade 17 1% 17 1% 0 0% Education 12 1% 12 1% 0 0% Garden Maintenance (Commercial) 8 0.4% 8 0.5% 0 0% Other C&D 6 0.3% 6 0.3% 0 0% Communication Services 3 0.2% 3 0.2% 0 0% Agriculture/Forestry/Fisheries 2 0.1% 2 0.1% 0 0% Services Supply 2 0.1% 2 0.1% 0 0% Finance & Insurance 2 0.1% 2 0.1% 0 0% Landscaping C&D 1 0.1% 1 0.1% 0 0% Total 1778 100% 1723 100% 55 100% Graphs 6a and 6b, Graphs 7a and 7b and Graphs 8a and 8b illustrate a breakdown, by waste category of the top three industry sectors in the C&I waste stream. This information provides the detail for developing waste minimisation strategies and importantly for targeting such initiatives. Garbage bag analysis was based on a 2005 compositional analysis conducted by the NSW Department of Environment and Conservation.

Disposal Based Audits of the C&I and C&D Waste Streams Department of Environment and Conservation
Commercial in Confidence 25
Graph 6a: Summary of Waste Categories received from Mixed SME’s at all Sites
Whitegoods0.1%
Tyres / Rubber0.1%
Leather / Textile (all)2%
Metal - Ferrous3%
Paper3%
Vegetation / Garden4%
Plastic - Bags & film5%
Other4%
Glass2%
Plastic - Hard1%
PlasterBoard1%
Soil1%
Polystyrene0.2%
Foam0.1%
Rocks / Bricks0.1%
Concrete0.1%
Metal - Non-Ferrous0.03%
Other2%
Cardboard - Waxed0.1%
Garbage Bags25%
Food / Kitchen23%
Wood / Timber (all)14%
Cardboard12%
Graph 6b: Summary of Waste Categories received from Mixed SME’s at all Sites (includes estimated composition of garbage bags)
Plastic - Bags & film9%
Paper9%
Cardboard13%
Foam0.1%
Controlled Waste0.4%
Polystyrene0.5%
Tyres / Rubber0.5%
Soil1%
Concrete0.1%
Whitegoods0.1%
Other6%
Cardboard - Waxed0.1%
PlasterBoard1%
Metal - Non-Ferrous1%
Glass2%
Metal - Ferrous3%
Food / Kitchen30%
Rocks / Bricks0.1%
Wood / Timber (all)14%
Leather / Textile (all)3%
Other6%
Plastic - Hard4%
Vegetation / Garden4%

Disposal Based Audits of the C&I and C&D Waste Streams The Western Australian Department of Environment and Conservation
Commercial in Confidence 26
Graph 7a: Summary of Waste Categories Received from the Retail Trade at all Sites
Cardboard12%
Wood / Timber (all)12%
Garbage Bags25%
Food / Kitchen30%
Foam0.1%
Other1%
Glass1%
Plastic - Hard1%
Leather / Textile (all)2%
Paper2%
Other2%
Metal - Ferrous3%
Plastic - Bags & film5%
Vegetation / Garden5%
Metal - Non-Ferrous0.1%
Cardboard - Waxed0.1% Tyres / Rubber
0.01%
Whitegoods0.04%
Concrete0.1%
Polystyrene0.2%
Rocks / Bricks0.5%
Graph 7b: Summary of Waste Categories Received from the Retail Trade at all Sites (includes estimated composition of garbage bags)
Paper8%
Plastic - Bags & film8%
Wood / Timber (all)12%
Cardboard - Waxed0.1%
Concrete0.1%
Tyres / Rubber0.4%
Controlled Waste0.4%
Polystyrene0.5%
Whitegoods0.04%
Other3%
Rocks / Bricks0.5%
Metal - Non-Ferrous1%
Glass1%
Leather / Textile (all)3%
Food / Kitchen37%
Foam0.1%
Cardboard13%
Metal - Ferrous3%Vegetation / Garden
5%
Plastic - Hard4%
Other4%
Disposal Based Audits of the C&I and C&D Waste Streams Department of Environment and Conservation
Commercial in Confidence 27
Graph 8a: Summary of Waste Categories Received from the Manufacturing Sector at all Sites
Rocks / Bricks1%
Other7%
Metal - Non-Ferrous0.1%
Glass0.2%
Whitegoods0.2%
Foam0.2%
Controlled Waste0.3%
Polystyrene0.3%
PlasterBoard1%Vegetation / Garden
1%
Wood / Timber (all)30%
Other15%
Food / Kitchen10%
Cardboard9%
Metal - Ferrous8%
Paper1%
Tyres / Rubber1%
Leather / Textile (all)2%
Concrete3%
Rubble3%
Plastic - Hard3%
Garbage Bags3%
Soil4%
Plastic - Bags & film4%
Graph 8b: Summary of Waste Categories Received from the Manufacturing Sector at all Sites (includes estimated composition of garbage bags)
Metal - Ferrous8%
Cardboard9%
Food / Kitchen11%
Controlled Waste0.3%
Polystyrene0.3%
Tyres / Rubber1%
Rocks / Bricks1%
Vegetation / Garden1%
Foam0.2%
Whitegoods0.2%
Other8%
Metal - Non-Ferrous0.1%
PlasterBoard1%
Paper2%
Leather / Textile (all)2%
Concrete3%
Wood / Timber (all)30%
Glass0.2%
Other15%
Rubble3%
Plastic - Bags & film5%
Soil4%
Plastic - Hard3%

Disposal Based Audits of the C&I and C&D Waste Streams The Western Australian Department of Environment and Conservation
Commercial in Confidence 28
5.7 Industry Sectors - Construction and Demolition Waste Stream The C&D sector was classified in terms of the industry sector, in which generated the waste. This information was recorded by the weighbridge auditor in response to questions asked to the vehicle drivers.
Table 12: Total C&D Waste Received at all Sites by Industry Sector Total Putrescible Inert
Industry Type tonnes % tonnes % tonnes % Residential Development 849 26% 81 13% 768 28% Residential Demolition 764 23% 14 2% 750 28% Residential C&D 653 20% 230 38% 423 16% Commercial Demolition 334 10% 0 0% 334 12% Landscaping C&D 212 6% 178 29% 34 1% Transfer Station 175 5% 0 0% 175 6% Commercial C&D 135 4% 56 9% 79 3% Institutional/Government C&D 53 2% 0 0% 53 2% Construction 43 1% 3 0.4% 40 1% Other C&D 42 1% 36 6% 7 0.2% Municipal (Local Government Services) 25 1% 0 0% 25 1% Institutional/Government development 11 0.3% 0 0% 11 0.4% Commercial Development 10 0.3% 4 1% 7 0.2% Unknown 3 0.1% 0 0% 3 0.1% Trade (Plumber, kitchen fitter) 1 0.04% 1 0.2% 0 0% Manufacturing 0.4 0.01% 0.4 0.1% 0 0% Total 3313 100% 604 100% 2709 100%
Graph 9: Summary of Residential Development Received at all Sites by Waste Category
Garbage Bags0.05%
Plastic - Hard0.04%
Plastic - Bags & film0.02%
Glass0.02%
Whitegoods0.01%
Leather / Textile (all)0.01%
Paper0.01%
Clay0.2%
Cardboard0.1%
Concrete18%
Soil29%
Rocks / Bricks33%
Metal - Non-Ferrous0.002%
Vegetation / Garden0.1%
Other1%
Metal - Ferrous0.3%
PlasterBoard1%
Wood / Timber (all)1%
Other2%
Rubble16%
Disposal Based Audits of the C&I and C&D Waste Streams Department of Environment and Conservation
Commercial in Confidence 29
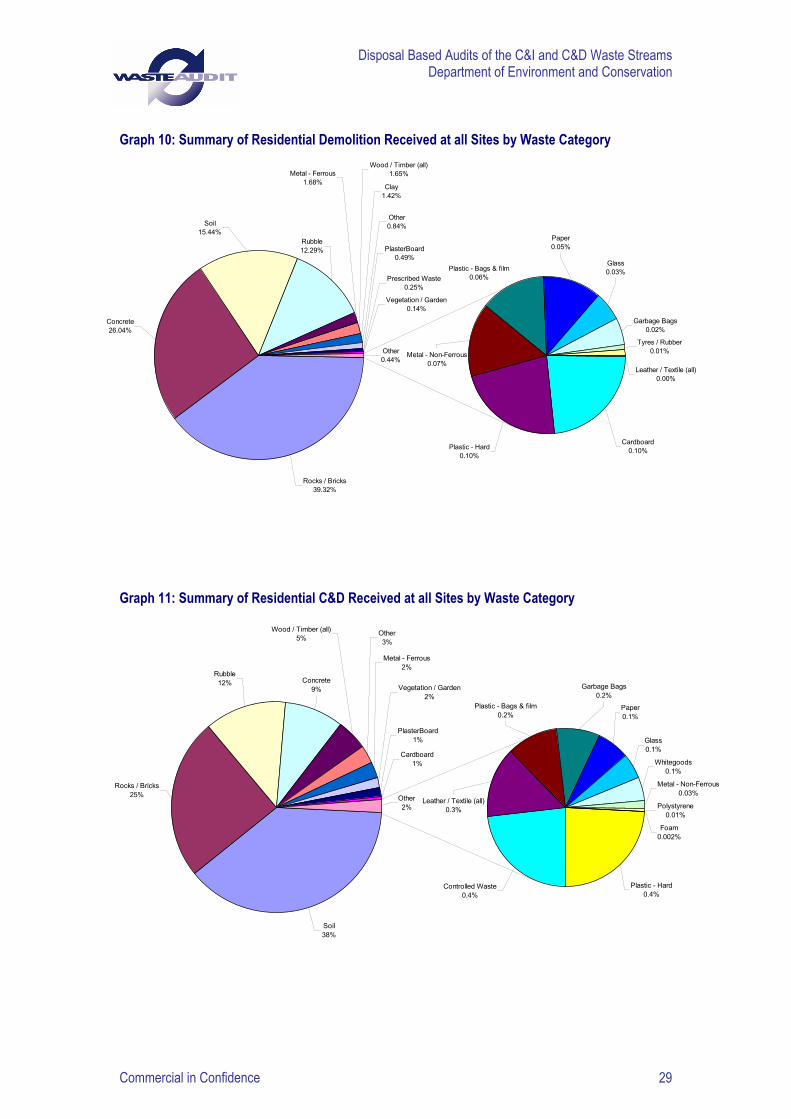
Graph 10: Summary of Residential Demolition Received at all Sites by Waste Category
Plastic - Bags & film0.06%
Garbage Bags0.02%
Tyres / Rubber0.01%
Leather / Textile (all)0.00%
Glass0.03%
Paper0.05%
Cardboard0.10%Plastic - Hard
0.10%
Rocks / Bricks39.32%
Soil15.44%
Concrete26.04%
Other0.44%
Vegetation / Garden0.14%
Prescribed Waste0.25%
PlasterBoard0.49%
Other0.84%
Clay1.42%
Wood / Timber (all)1.65%
Rubble12.29%
Metal - Ferrous1.68%
Metal - Non-Ferrous0.07%
Graph 11: Summary of Residential C&D Received at all Sites by Waste Category
Glass0.1%
Whitegoods0.1%
Metal - Non-Ferrous0.03%
Polystyrene0.01%
Foam0.002%
Rocks / Bricks25%
Rubble12% Concrete
9%
Other2%
Plastic - Bags & film0.2%
Paper0.1%
Garbage Bags0.2%
Plastic - Hard0.4%
Controlled Waste0.4%
Soil38%
Cardboard1%
PlasterBoard1%
Vegetation / Garden2%
Metal - Ferrous2%
Other3%
Wood / Timber (all)5%
Leather / Textile (all)0.3%

Disposal Based Audits of the C&I and C&D Waste Streams The Western Australian Department of Environment and Conservation
Commercial in Confidence 30
6 Discussion The discussion provides analysis of the results of the DEC Disposal Based Audit. It is important that the analysis is undertaken in a way that will provide relevant information to assist the DEC in meeting its strategic objectives. As such, the discussion will initially focus on the industry types and material types that were received at the audit sites in the highest quantities.
Many loads received at the sites audited comprised of loads that had large percentages of various recyclable materials in individual loads. This included such materials as; cardboard, paper, rocks, bricks, concrete, timber and plastics.
6.1 Commercial and Industrial Stream SME’s were the main generator of materials deposited at all sites. This sector represented 37% by weight of materials deposited.
Retail Trade was responsible for 23% by weight with Manufacturing representing 12% by weight of the waste classified as C&I.
Based on the observations made by our auditors, the manufacturing industry represents a significant opportunity for both waste avoidance through cleaner production and for resource recovery through recycling. Waste observed from the Manufacturing industry could be classified as primarily packaging (eg., cardboard and timber), or production waste including off-cuts.
6.2 Waste Materials The following summarises some issues in regards to specific types of materials deposited at the sites audited. Note the percentages refers to the contents of the garbage bags apportioned to the appropriate waste categories (garbage bags represented 20% by weight of the total C&I waste for all sites). This apportioning was based on a garbage bags compositional analysis conducted by the NSW Department of Environment and Conservation (DEC) in 2005.
Food and kitchen waste represented 27% by weight of the total materials. The next largest category of waste was wood/timber at 15% by weight and cardboard at 11% by weight.
It is evident from this audit project, that in order to reduce C&I waste to landfill, minimisation initiatives and programs should target the following waste categories:
Food and kitchen waste. Wood / timber waste. Cardboard and paper.
Wood/timber represented 15% by weight of the total C&I waste stream. As indicated in the photographs, many loads contained a large percentage of wood/timber. While some had the appearance of “single use” imported pallets or other timber and would be expected to have been treated, there is most certainly the potential to separate wood/timber for reuse/recycling.
Disposal Based Audits of the C&I and C&D Waste Streams Department of Environment and Conservation
Commercial in Confidence 31
Cardboard represented 11% by weight of the total C&I waste received during this audit project, with paper representing an additional 8% by weight. Reference to the photographs illustrates some of the loads that had large percentages of cardboard or paper in them.
6.3 Construction and Demolition Waste Stream The C&D stream represented 42% by weight of the total materials deposited at all sites.
26% by weight of the C&D sector material was generated by residential development. Residential demolition was the next largest source as 23% by weight. Commercial demolition accounted for 10% by weight of the C&D waste stream.
6.4 Waste Materials The following summarises some issues in regards to specific types of materials deposited at the sites audited.
Rocks/bricks represented 30% by weight of the C&D materials deposited at all sites. Soil was next largest category at 28% by weight, concrete at 21% by weight and rubble at 13% by weight.
It is evident from this audit project, that in order to reduce C&D waste to landfill, minimisation initiatives and programs should target the following waste categories:
Rocks/bricks. Soil. Concrete. Rubble.
It was of interest to note that of other recyclables such as; cardboard, paper, glass, metals, timber and plastics represented 3% by weight of materials deposited to landfill.
Disposal Based Audits of the C&I and C&D Waste Streams The Western Australian Department of Environment and Conservation
Commercial in Confidence 32
7 Concluding Remarks The key purpose of the Disposal Based Audits was to profile C&I and C&D materials being disposed of to landfill and provide information to assist in the development of waste reduction strategies.
This project provides a “snapshot” of the quantity and types of C&I and C&D waste materials deposited at the selected landfills over the two day period for which the Disposal Based Audits were conducted.
It is possible to achieve an estimate of the total per annum composition of the C&I and C&D waste materials deposited at the landfill sites where the Disposal Based Audits were conducted. Utilising landfill data (collected by the Department of Environment and Conservation) for each individual landfill will provide a per annum tonnage of C&I and C&D material deposited at each site. Then, using the percentage compositional data contained in this report, an estimate of the total annualised categories of C&I and C&D waste materials can be extrapolated.
During the DEC Disposal Based Audit period a total of 1561 vehicles were logged at the gatehouses. Of these, 864 separate loads were visually assessed, these being the C&I and C&D loads. A net total of 8074 tonnes of material was received at the sites during the audit period.
A considerable number of vehicles had loads that contained a percentage of one type of recyclable material such as cardboard or timber. In addition, there were many loads that also contained large percentages of recyclables. It was a concern that a MRF was depositing several loads of co-mingled recyclables at one landfill site.
Greater levels of source segregation at the generator’s premises need to be encouraged. In addition, there appeared to be minimal effort at sorting/separating potentially recyclable materials from loads as they arrived at the landfill sites.
WACS and Golder would like to thank all of the site operators, transporters and their staff who were involved in this project, for permission to visit their working sites and for their assistance whilst we were conducting the audits.