Displaying Distributions - Qualitative Variables
38
Displaying Distributions - Qualitative Variables Lecture 12 Sections 4.3.1 - 4.3.2 Robb T. Koether Hampden-Sydney College Tue, Sep 13, 2011 Robb T. Koether (Hampden-Sydney College) Displaying Distributions - Qualitative Variables Tue, Sep 13, 2011 1 / 24
Transcript of Displaying Distributions - Qualitative Variables
Displaying Distributions - Qualitative VariablesLecture 12
Sections 4.3.1 - 4.3.2
Robb T. Koether
Hampden-Sydney College
Tue, Sep 13, 2011
Robb T. Koether (Hampden-Sydney College)Displaying Distributions - Qualitative Variables Tue, Sep 13, 2011 1 / 24
Outline
1 Homework Review
2 Introduction
3 Pie Charts
4 Bar Graphs
5 How Not To Draw a Bar Graph
6 Assignment
7 Answers to Even-numbered Exercises
Robb T. Koether (Hampden-Sydney College)Displaying Distributions - Qualitative Variables Tue, Sep 13, 2011 2 / 24
Outline
1 Homework Review
2 Introduction
3 Pie Charts
4 Bar Graphs
5 How Not To Draw a Bar Graph
6 Assignment
7 Answers to Even-numbered Exercises
Robb T. Koether (Hampden-Sydney College)Displaying Distributions - Qualitative Variables Tue, Sep 13, 2011 3 / 24
Homework Review
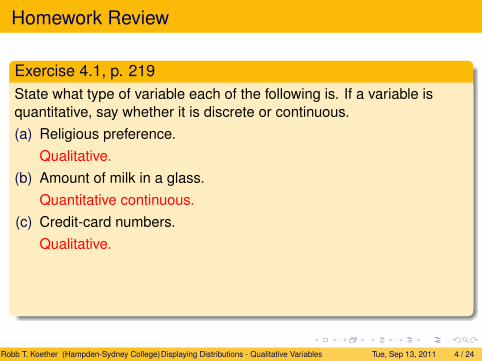
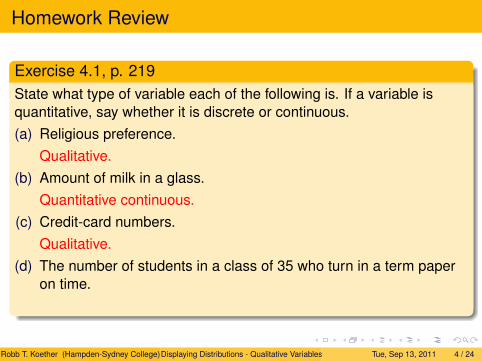
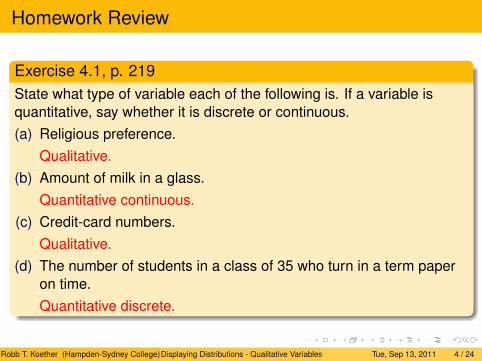
Exercise 4.1, p. 219State what type of variable each of the following is. If a variable isquantitative, say whether it is discrete or continuous.
(a) Religious preference.Qualitative.
(b) Amount of milk in a glass.Quantitative continuous.
(c) Credit-card numbers.Qualitative.
(d) The number of students in a class of 35 who turn in a term paperon time.Quantitative discrete.
Robb T. Koether (Hampden-Sydney College)Displaying Distributions - Qualitative Variables Tue, Sep 13, 2011 4 / 24
Homework Review
Exercise 4.1, p. 219State what type of variable each of the following is. If a variable isquantitative, say whether it is discrete or continuous.(a) Religious preference.
Qualitative.(b) Amount of milk in a glass.
Quantitative continuous.(c) Credit-card numbers.
Qualitative.(d) The number of students in a class of 35 who turn in a term paper
on time.Quantitative discrete.
Robb T. Koether (Hampden-Sydney College)Displaying Distributions - Qualitative Variables Tue, Sep 13, 2011 4 / 24
Homework Review
Exercise 4.1, p. 219State what type of variable each of the following is. If a variable isquantitative, say whether it is discrete or continuous.(a) Religious preference.
Qualitative.
(b) Amount of milk in a glass.Quantitative continuous.
(c) Credit-card numbers.Qualitative.
(d) The number of students in a class of 35 who turn in a term paperon time.Quantitative discrete.
Robb T. Koether (Hampden-Sydney College)Displaying Distributions - Qualitative Variables Tue, Sep 13, 2011 4 / 24
Homework Review
Exercise 4.1, p. 219State what type of variable each of the following is. If a variable isquantitative, say whether it is discrete or continuous.(a) Religious preference.
Qualitative.(b) Amount of milk in a glass.
Quantitative continuous.(c) Credit-card numbers.
Qualitative.(d) The number of students in a class of 35 who turn in a term paper
on time.Quantitative discrete.
Robb T. Koether (Hampden-Sydney College)Displaying Distributions - Qualitative Variables Tue, Sep 13, 2011 4 / 24
Homework Review
Exercise 4.1, p. 219State what type of variable each of the following is. If a variable isquantitative, say whether it is discrete or continuous.(a) Religious preference.
Qualitative.(b) Amount of milk in a glass.
Quantitative continuous.
(c) Credit-card numbers.Qualitative.
(d) The number of students in a class of 35 who turn in a term paperon time.Quantitative discrete.
Robb T. Koether (Hampden-Sydney College)Displaying Distributions - Qualitative Variables Tue, Sep 13, 2011 4 / 24
Homework Review
Exercise 4.1, p. 219State what type of variable each of the following is. If a variable isquantitative, say whether it is discrete or continuous.(a) Religious preference.
Qualitative.(b) Amount of milk in a glass.
Quantitative continuous.(c) Credit-card numbers.
Qualitative.(d) The number of students in a class of 35 who turn in a term paper
on time.Quantitative discrete.
Robb T. Koether (Hampden-Sydney College)Displaying Distributions - Qualitative Variables Tue, Sep 13, 2011 4 / 24
Homework Review
Exercise 4.1, p. 219State what type of variable each of the following is. If a variable isquantitative, say whether it is discrete or continuous.(a) Religious preference.
Qualitative.(b) Amount of milk in a glass.
Quantitative continuous.(c) Credit-card numbers.
Qualitative.
(d) The number of students in a class of 35 who turn in a term paperon time.Quantitative discrete.
Robb T. Koether (Hampden-Sydney College)Displaying Distributions - Qualitative Variables Tue, Sep 13, 2011 4 / 24
Homework Review
Exercise 4.1, p. 219State what type of variable each of the following is. If a variable isquantitative, say whether it is discrete or continuous.(a) Religious preference.
Qualitative.(b) Amount of milk in a glass.
Quantitative continuous.(c) Credit-card numbers.
Qualitative.(d) The number of students in a class of 35 who turn in a term paper
on time.
Quantitative discrete.
Robb T. Koether (Hampden-Sydney College)Displaying Distributions - Qualitative Variables Tue, Sep 13, 2011 4 / 24
Homework Review
Exercise 4.1, p. 219State what type of variable each of the following is. If a variable isquantitative, say whether it is discrete or continuous.(a) Religious preference.
Qualitative.(b) Amount of milk in a glass.
Quantitative continuous.(c) Credit-card numbers.
Qualitative.(d) The number of students in a class of 35 who turn in a term paper
on time.Quantitative discrete.
Robb T. Koether (Hampden-Sydney College)Displaying Distributions - Qualitative Variables Tue, Sep 13, 2011 4 / 24
Homework Review
Exercise 4.1, p. 219(e) The brand of personal computer purchased by a customer.
Qualitative.(f) The amount of fluid dispensed by a machine used to fill cups with
coffee.Quantitative continuous.
Robb T. Koether (Hampden-Sydney College)Displaying Distributions - Qualitative Variables Tue, Sep 13, 2011 5 / 24
Homework Review
Exercise 4.1, p. 219(e) The brand of personal computer purchased by a customer.
Qualitative.
(f) The amount of fluid dispensed by a machine used to fill cups withcoffee.Quantitative continuous.
Robb T. Koether (Hampden-Sydney College)Displaying Distributions - Qualitative Variables Tue, Sep 13, 2011 5 / 24
Homework Review
Exercise 4.1, p. 219(e) The brand of personal computer purchased by a customer.
Qualitative.(f) The amount of fluid dispensed by a machine used to fill cups with
coffee.
Quantitative continuous.
Robb T. Koether (Hampden-Sydney College)Displaying Distributions - Qualitative Variables Tue, Sep 13, 2011 5 / 24
Homework Review
Exercise 4.1, p. 219(e) The brand of personal computer purchased by a customer.
Qualitative.(f) The amount of fluid dispensed by a machine used to fill cups with
coffee.Quantitative continuous.
Robb T. Koether (Hampden-Sydney College)Displaying Distributions - Qualitative Variables Tue, Sep 13, 2011 5 / 24
Outline
1 Homework Review
2 Introduction
3 Pie Charts
4 Bar Graphs
5 How Not To Draw a Bar Graph
6 Assignment
7 Answers to Even-numbered Exercises
Robb T. Koether (Hampden-Sydney College)Displaying Distributions - Qualitative Variables Tue, Sep 13, 2011 6 / 24
Introduction
The two most basic characteristics of a sample that we areinterested in are averages and proportions.
How can we represent a proportion in a graph?How can we represent an average in a graph?What other characteristics might we want to represent in a graph?
Robb T. Koether (Hampden-Sydney College)Displaying Distributions - Qualitative Variables Tue, Sep 13, 2011 7 / 24
Introduction
The two most basic characteristics of a sample that we areinterested in are averages and proportions.How can we represent a proportion in a graph?
How can we represent an average in a graph?What other characteristics might we want to represent in a graph?
Robb T. Koether (Hampden-Sydney College)Displaying Distributions - Qualitative Variables Tue, Sep 13, 2011 7 / 24
Introduction
The two most basic characteristics of a sample that we areinterested in are averages and proportions.How can we represent a proportion in a graph?How can we represent an average in a graph?
What other characteristics might we want to represent in a graph?
Robb T. Koether (Hampden-Sydney College)Displaying Distributions - Qualitative Variables Tue, Sep 13, 2011 7 / 24
Introduction
The two most basic characteristics of a sample that we areinterested in are averages and proportions.How can we represent a proportion in a graph?How can we represent an average in a graph?What other characteristics might we want to represent in a graph?
Robb T. Koether (Hampden-Sydney College)Displaying Distributions - Qualitative Variables Tue, Sep 13, 2011 7 / 24
Outline
1 Homework Review
2 Introduction
3 Pie Charts
4 Bar Graphs
5 How Not To Draw a Bar Graph
6 Assignment
7 Answers to Even-numbered Exercises
Robb T. Koether (Hampden-Sydney College)Displaying Distributions - Qualitative Variables Tue, Sep 13, 2011 8 / 24
Pie Charts
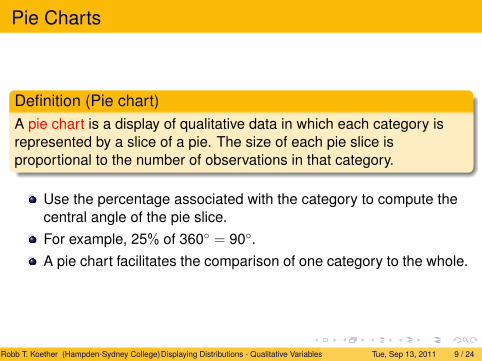
Definition (Pie chart)A pie chart is a display of qualitative data in which each category isrepresented by a slice of a pie. The size of each pie slice isproportional to the number of observations in that category.
Use the percentage associated with the category to compute thecentral angle of the pie slice.For example, 25% of 360◦ = 90◦.A pie chart facilitates the comparison of one category to the whole.
Robb T. Koether (Hampden-Sydney College)Displaying Distributions - Qualitative Variables Tue, Sep 13, 2011 9 / 24

Pie Charts
25%
75%
Robb T. Koether (Hampden-Sydney College)Displaying Distributions - Qualitative Variables Tue, Sep 13, 2011 10 / 24

Example
How was the weather in Farmville in January 2009?According to the National Weather Service:
Weather Conditions No. of DaysSunny 14Mostly Sunny 3Mostly Cloudy 3Cloudy 1Fog 0Rain 7Snow 3
Use Excel to draw a pie chart of the data.
Robb T. Koether (Hampden-Sydney College)Displaying Distributions - Qualitative Variables Tue, Sep 13, 2011 11 / 24
Example
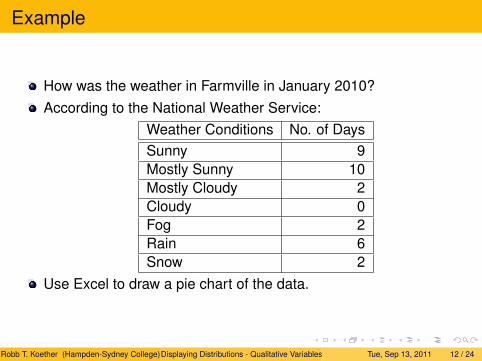
How was the weather in Farmville in January 2010?According to the National Weather Service:
Weather Conditions No. of DaysSunny 9Mostly Sunny 10Mostly Cloudy 2Cloudy 0Fog 2Rain 6Snow 2
Use Excel to draw a pie chart of the data.
Robb T. Koether (Hampden-Sydney College)Displaying Distributions - Qualitative Variables Tue, Sep 13, 2011 12 / 24
Example
How did the Farmville weather in January 2009 compare to theFarmville weather in January 2010?It is not a good idea to try to compare the two pie charts.Instead, a bar graph should be used.
Robb T. Koether (Hampden-Sydney College)Displaying Distributions - Qualitative Variables Tue, Sep 13, 2011 13 / 24
Outline
1 Homework Review
2 Introduction
3 Pie Charts
4 Bar Graphs
5 How Not To Draw a Bar Graph
6 Assignment
7 Answers to Even-numbered Exercises
Robb T. Koether (Hampden-Sydney College)Displaying Distributions - Qualitative Variables Tue, Sep 13, 2011 14 / 24
Bar Graphs
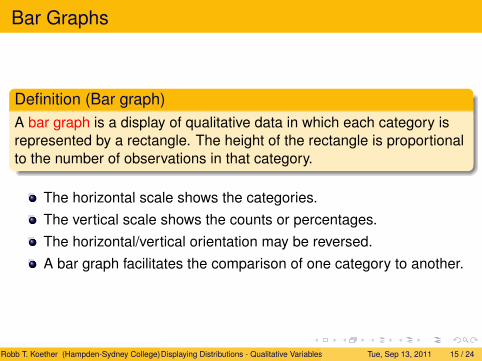
Definition (Bar graph)A bar graph is a display of qualitative data in which each category isrepresented by a rectangle. The height of the rectangle is proportionalto the number of observations in that category.
The horizontal scale shows the categories.The vertical scale shows the counts or percentages.The horizontal/vertical orientation may be reversed.A bar graph facilitates the comparison of one category to another.
Robb T. Koether (Hampden-Sydney College)Displaying Distributions - Qualitative Variables Tue, Sep 13, 2011 15 / 24
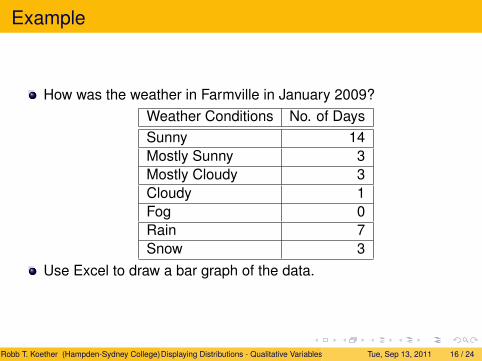
Example
How was the weather in Farmville in January 2009?Weather Conditions No. of DaysSunny 14Mostly Sunny 3Mostly Cloudy 3Cloudy 1Fog 0Rain 7Snow 3
Use Excel to draw a bar graph of the data.
Robb T. Koether (Hampden-Sydney College)Displaying Distributions - Qualitative Variables Tue, Sep 13, 2011 16 / 24
Example
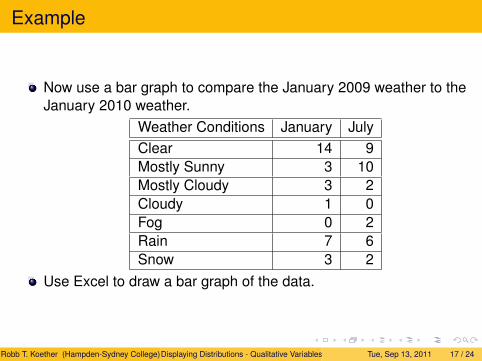
Now use a bar graph to compare the January 2009 weather to theJanuary 2010 weather.
Weather Conditions January JulyClear 14 9Mostly Sunny 3 10Mostly Cloudy 3 2Cloudy 1 0Fog 0 2Rain 7 6Snow 3 2
Use Excel to draw a bar graph of the data.
Robb T. Koether (Hampden-Sydney College)Displaying Distributions - Qualitative Variables Tue, Sep 13, 2011 17 / 24
Outline
1 Homework Review
2 Introduction
3 Pie Charts
4 Bar Graphs
5 How Not To Draw a Bar Graph
6 Assignment
7 Answers to Even-numbered Exercises
Robb T. Koether (Hampden-Sydney College)Displaying Distributions - Qualitative Variables Tue, Sep 13, 2011 18 / 24
How Not To Draw a Bar Graph
After the Republican debate last week, MSNBC conducted asurvey asking the viewers to tell which candidate they believe wonthe debate.The results were summarized in a bar graph.http://firstread.msnbc.msn.com/...
What is wrong with this bar graph?
Robb T. Koether (Hampden-Sydney College)Displaying Distributions - Qualitative Variables Tue, Sep 13, 2011 19 / 24
Outline
1 Homework Review
2 Introduction
3 Pie Charts
4 Bar Graphs
5 How Not To Draw a Bar Graph
6 Assignment
7 Answers to Even-numbered Exercises
Robb T. Koether (Hampden-Sydney College)Displaying Distributions - Qualitative Variables Tue, Sep 13, 2011 20 / 24
Assignment
HomeworkRead Section 4.3.1 - 4.3.2, pages 220 - 225.Let’s Do It! 4.3, 4.4, 4.5.Page 226, exercises 6 - 10.
Robb T. Koether (Hampden-Sydney College)Displaying Distributions - Qualitative Variables Tue, Sep 13, 2011 21 / 24
Outline
1 Homework Review
2 Introduction
3 Pie Charts
4 Bar Graphs
5 How Not To Draw a Bar Graph
6 Assignment
7 Answers to Even-numbered Exercises
Robb T. Koether (Hampden-Sydney College)Displaying Distributions - Qualitative Variables Tue, Sep 13, 2011 22 / 24
Answers to Even-numbered Exercises
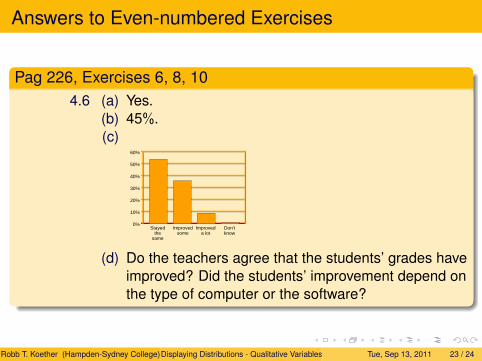
Pag 226, Exercises 6, 8, 104.6 (a) Yes.
(b) 45%.(c)
Stayedthe
same
Improveda lot
Improvedsome
Don'tknow
60%
50%
40%
30%
20%
10%
0%
(d) Do the teachers agree that the students’ grades haveimproved? Did the students’ improvement depend onthe type of computer or the software?
Robb T. Koether (Hampden-Sydney College)Displaying Distributions - Qualitative Variables Tue, Sep 13, 2011 23 / 24
Answers to Even-numbered Exercises
Pag 226, Exercises 6, 8, 104.8 NO!!! The categories do not add up to 100%.
4.10 (a) 69%.(b) 385.
Robb T. Koether (Hampden-Sydney College)Displaying Distributions - Qualitative Variables Tue, Sep 13, 2011 24 / 24