DonorTech Display Sampling Interactive Touch Screen Recognition Displays.

Christine Wall – National Physical Laboratory
Display Measurement and Evaluation

• Why measure displays?
• What will you measure?
• Units of measurement for light.
• Instruments that can be used.
• Examples of measurement.
• Summary.
Overview
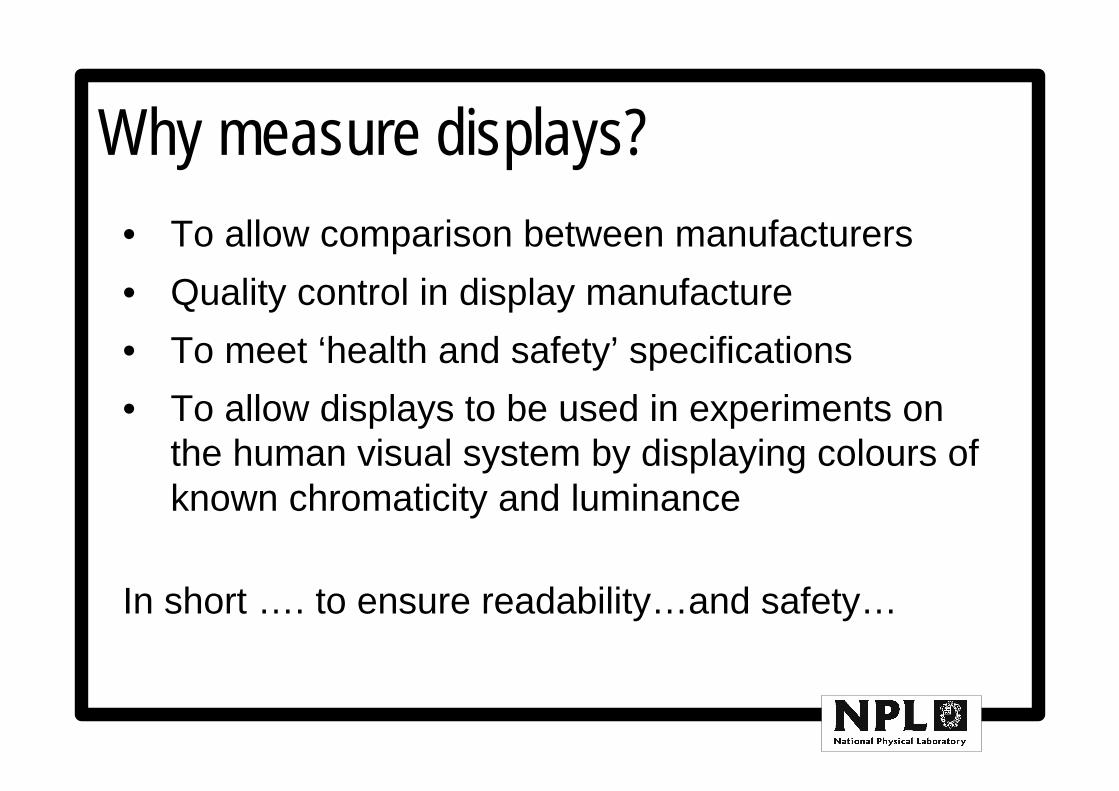
• To allow comparison between manufacturers
• Quality control in display manufacture
• To meet ‘health and safety’ specifications
• To allow displays to be used in experiments on the human visual system by displaying colours of known chromaticity and luminance
In short …. to ensure readability…and safety…
Why measure displays?

Displays are used in:
• Air traffic control• Car speedometers• Design of jet engines• Surgical diagnostics• Keyhole surgery• Military applications (night
vision goggles,missile guidance systems etc)
What sort of displays?
These are safety critical so let’s get it right first time here!!!

What will you measure?
Spatial Informationpixel size, viewing angle,
polarisation
Affects resolution, viewing field
Temporal Informationrefresh rate, flicker, grey-scaling
Affects visual fatigue, artefacts, contrast
Environmental InformationTemperature, EM fields,stray light
Affects distortion, contrast
Spectral InformationPhosphors, lamp + filtersOLEDs,laser illuminated…
Affects colour, brightnessreadability

What will you measure?
Display Characteristics•spectral•temporal•spatial•environmental
Human EyeCharacteristics•spectral•temporal•spatial
+ =Display Measurement

What will you measure?
Optical characteristics:
Brightness, colour, contrast, screen uniformity,
Electrical characteristics:
Total power consumption, efficiency
Physical characteristics:
Size, weight, dimensions

Light measurementVisible light is a very small part of the electromagnetic
spectrum
ATOM VIRUS GERMS POLLEN BEE CHILD FOOTBALL PITCHWavelength (λλ)in metres
Frequency (νν) in hertz
10-12 10-10 10-8 10-6 10-4 10-2 1 102
1020 1018 1016 1014 1012 1010 108 104
Gamma rays X rays Ultraviolet Infrared Microwaves Radio waves
Vis
ible
http://scholar.hw.ac.uk/site/chemistry/topic3.asp

Light MeasurementRadiometry: measurement of RADIATION from any part of the EM spectrum.Photometry: Considers VISIBLE light only (from the Greek “phos” meaning “light”) 380 to 780 nm
The photometric response of the eye V(λ) is based on a “standard human observer”… not one person but the average of a number of experiments carried out on white male students in 1920’s (so it’s not perfect… but it is accepted!)
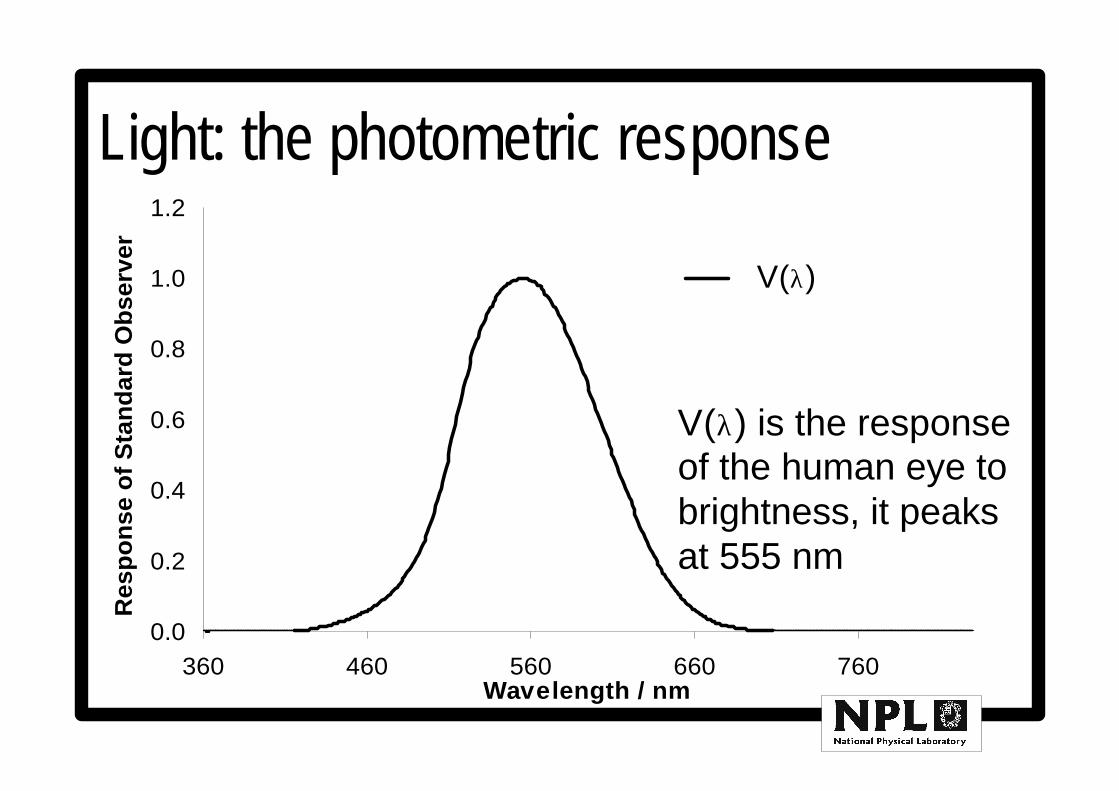
Light: the photometric response
0.0
0.2
0.4
0.6
0.8
1.0
1.2
360 460 560 660 760Wavelength / nm
Res
po
nse
of
Sta
nd
ard
Ob
serv
er
V(λ)
V(λ) is the response of the human eye to brightness, it peaks at 555 nm

Light: the photometric response
0.0
0.2
0.4
0.6
0.8
1.0
1.2
1.4
1.6
1.8
2.0
360 460 560 660 760Wavelength / nm
Res
po
nse
of
Sta
nd
ard
Ob
serv
er x(λ)y(λ)z(λ)
Note: V(λ) is co-incident withy(λ)

Light: the photometric response
380 430 480 530 580 630 680 730 780
So we can either measure light at each wavelength (spectrally), OR we can measure “red light”, “green light” and “blue light” with the detectors matched to the response of the human eye (colorimetrically)

Light: Basic Units
Candela: The SI unit of light
“The candela is the luminous intensity of a source that emits monochromatic light of wavelength 555 nm and that has a radiant intensity of 1/683 watts per steradian in a specified direction”
One candela will radiate one lumen in all directions, so… 1cd = 1lm/sr

Light: Basic UnitsSolid angle; a sphere contains 4π steradians. One steradian is the solid angle which cuts off a spherical surface area equal to the square of the radius
Five times rule.If the radius is 5 times larger than the circular area, you can assume a flat disk instead of a spherical surface.This is useful for displays, and for conversion between units. Separate the instrument and display by at least five times the measurement diameter.
Light: Basic UnitsFlux is rate of energy flow in joules per second i.e. power, in this case optical power.
Radiant flux: all light joules/second (≡ watts)
Luminous flux: visible light lumens/second
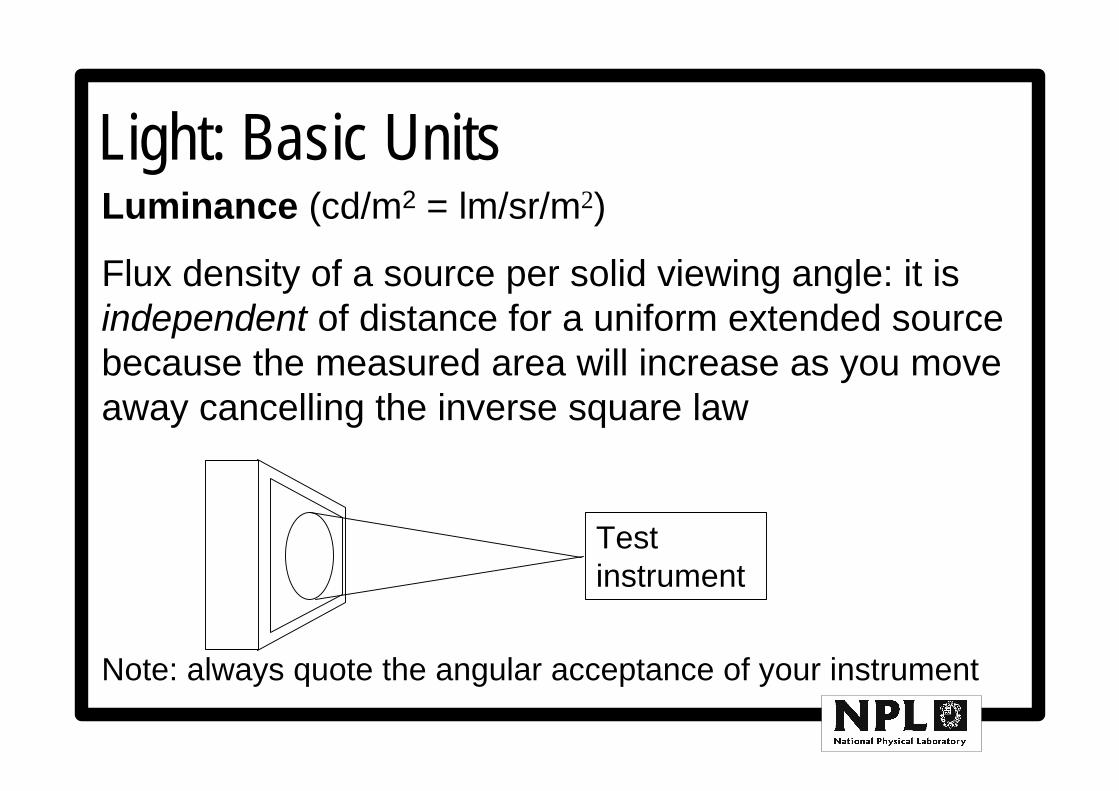
Light: Basic UnitsLuminance (cd/m2 = lm/sr/m2)
Flux density of a source per solid viewing angle: it is independent of distance for a uniform extended source because the measured area will increase as you move away cancelling the inverse square law
Note: always quote the angular acceptance of your instrument
Test instrument

Light: Basic UnitsIlluminance (lux = lm/m2)
Illuminance is a characteristic of an non-luminous surface. It is a measure of flux per unit area. A surface placed one meter from an isotropic light source of 1 candela will have an illuminance of 1 lm/m2.
1 lm/m2
1 metre
1 steradian1 square metre
1 Candela

Instruments for displays measurement
Focussing optics
Wavelength selective elements
Light sensitive
detector /sAperture
There may also be temperature control, diffusers, memory and computational software…..
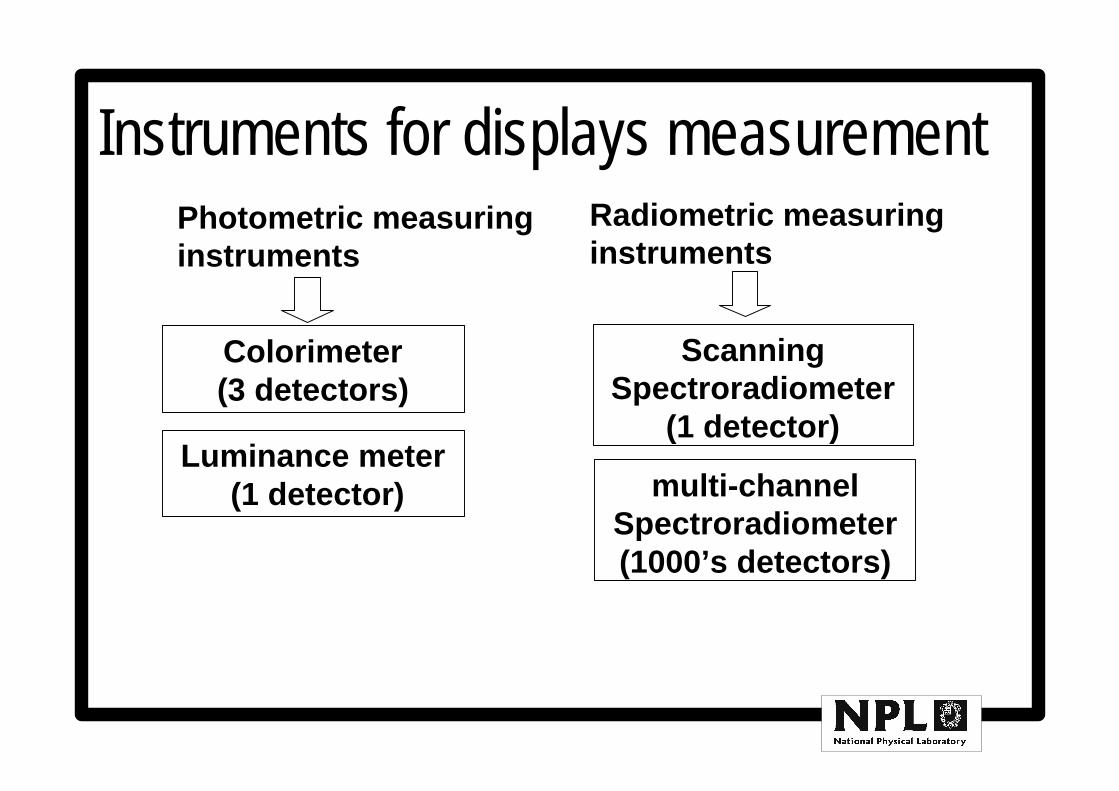
Instruments for displays measurement
Colorimeter (3 detectors)
Photometric measuring instruments
Luminance meter(1 detector) multi-channel
Spectroradiometer(1000’s detectors)
Scanning Spectroradiometer
(1 detector)
Radiometric measuring instruments

ColorimeterPro ConStable AccuracyPortableCheap simple
Sources of ErrorsImperfect CIE emulationSample time ‘beats’ with displayDetector saturationSpatial resolutionStray light.

Luminance meterPro ConStable AccuracyPortable No colour informationCheap simple
Sources of ErrorsImperfect CIE emulationSample time ‘beats’ with displayDetector saturationSpatial resolutionStray light.
www.minolta.com

Scanning SpectroradiometerPro ConAccurate BulkyVersatile Expensive
Long measurement time
Sources of ErrorsSample time ‘beats’ with displayDetector saturationSpatial resolutionStray light.Wavelength (drift and error)Bandwidth

Multi-channel SpectroradiometerPro ConFast limited versatilityMedium cost limited accuracyCompactAccuratespectral
Sources of ErrorsSample time ‘beats’ with displayDetector saturationSpatial resolutionStray light.bandwidth

Special Instruments: conoscope
www.eldim.fr www.autronic-melchers.com
Colorimeter or luminance meter with angular information
Typical result for contrast

Special Instruments: Conoscope
on axis measurement path
measurement path at θ
Optical relay system
Typical distribution of light in the Fourier plane (intensity vs.angle)
Cooled CCD camera
Fourier Lens
Device under test

Special Instruments: goniometerSpectral or non-spectral information can be collected, as any instrument can be used. Angular information from any angle can be collected
Can be slow

Special Instruments: goniometer
Goniometer results from LED’s

Measurement GeometryThe geometry of display testing is always test dependent. But the most basic test is looking at the centre of the screen, normal to the screen, at a distance 5 times greater than the measurement area. The instrument aperture is usually set to be similar to the human eye’s pupil (~20 arc minutes)
Display under test
Test instrument

Measurement GeometryNPL’s test lab.
Testing normal to the display screen, using a scanning spectroradiometer.

Calibrating a display screen2. Measure a stable well characterised light source
3. Make a correction file
1. Select the instrument
5.Apply correction file to find calibrated
result
4. Measure display

Calibrating an instrument
Reference Display
Test instrument
Calibrated
instrument
Using the calibrated instrument (usally a high accuracy device) set a test colour on the reference display.Measure with the instrument under testEnter error into memory channel, or create look up table

Typical values of display measurements
Luminance 100 cd/m2 for a CRT on full70 cd/m2 for and LCD on full400 cd/m2 for a plasma display on full
Colour 0.330 x, 0.330 y for a white CRT(CIE 1931 colorimetric units)
Contrast Ratio 5:1 to 300:1 very variable

Summary
1) Think about what you want to measure and what units you will use. (colour, luminance, contrast)
2) Ensure the measurement relates to the human eye.3) Select the right instrument for the measurement.4) Set up your measurement to emulate usage conditions.5) Make the measurements and calculate an uncertainty
budget.