Dispensing of psychotropic medication among 400,000 ... · Dispensing of psychotropic medication...
15
ORIGINAL PAPER Dispensing of psychotropic medication among 400,000 immigrants in The Netherlands Fabian Termorshuizen 1,2 • Jean-Paul Selten 2,3 • Eibert R. Heerdink 1,4 Received: 7 February 2017 / Accepted: 3 June 2017 / Published online: 14 June 2017 Ó The Author(s) 2017. This article is an open access publication Abstract Purpose Previously, a high prevalence of certain psychi- atric disorders was shown among non-Western immigrants. This study explores whether this results in more prescrip- tions for psychotropic medication. Methods Data on dispensing of medication among adults living in the four largest Dutch cities in 2013 were linked to demographic data from Statistics Netherlands. Incident (i.e., following no dispensing in 2010–2012) and prevalent dispensing among immigrants was compared to that among native Dutch (N = 1,043,732) and analyzed using multi- variable Poisson and logistic regression. Results High adjusted Odds Ratios (OR adj ) of prevalent and high Incidence Rate Ratios (IRR adj ) of incident dis- pensing of antipsychotics were found among Moroccan (N = 115,455) and Turkish individuals (N = 105,460), especially among young Moroccan males (OR adj = 3.22 [2.99–3.47]). Among Surinamese (N = 147,123) and Antillean individuals (N = 41,430), slightly higher rates of dispensed antipsychotics were found and the estimates decreased after adjustment. The estimates for antipsychotic dispensing among the Moroccan and Turkish increased, following adjustment for household composition. Rates for antidepressant dispensing among Turkish and Moroccan subjects were high (Moroccans: OR adj = 1.74 [1.70– 1.78]). Among Surinamese and Antillean subjects, the rates for antidepressant dispensing were low and the OR adj lag- ged behind the IRR adj (Surinamese: 0.69 [0.67–0.71] vs. 1.06 [1.00–1.13]). Similar results were found for anxi- olytics. For ADHD medication, lower dispensing rates were found among all migrant groups. Conclusions The findings agree with earlier reports of more mental health problems among Moroccan and Turk- ish individuals. Surinamese/Antillean individuals did not use psychotropic drugs at excess and discontinued antide- pressants and anxiolytics earlier. The data strongly suggest under-treatment for ADHD in all ethnic minority groups. Keywords Ethnic minorities Á Pharmacoepidemiology Á Antipsychotics Á Antidepressants Á Psychostimulants Introduction The mental health of immigrants to the Western world is an important issue. The processes of loss, change, and finding ways to satisfy the new requirements of the host society may bring along various sources of stress and increased risks of mental health problems [1]. Different data sources can be used to quantify differ- ences in the incidence and/or prevalence of mental health disorders between the native and migrant populations. Data from population surveys may be biased by the use of questionnaires that are not validated for certain ethnic minority groups, low response rates or high response rates & Fabian Termorshuizen [email protected] 1 Division of Pharmacoepidemiology and Clinical Pharmacology, Utrecht Institute for Pharmaceutical Sciences, Utrecht University, P.O. Box 80082, 3508 TB Utrecht, The Netherlands 2 Rivierduinen, Institute for Mental Health Care, Sandifortdreef 19, 2333 ZZ Leiden, The Netherlands 3 Department of Psychiatry and Psychology, School for Mental Health and Neuroscience MHeNS, Maastricht University, Universiteitssingel 40, 6229 ER Maastricht, The Netherlands 4 Department of Clinical Pharmacy, University Medical Center Utrecht, Heidelberglaan 100, 3584 CX Utrecht, The Netherlands 123 Soc Psychiatry Psychiatr Epidemiol (2017) 52:963–977 DOI 10.1007/s00127-017-1405-x
Transcript of Dispensing of psychotropic medication among 400,000 ... · Dispensing of psychotropic medication...
ORIGINAL PAPER
Dispensing of psychotropic medication among 400,000 immigrantsin The Netherlands
Fabian Termorshuizen1,2 • Jean-Paul Selten2,3 • Eibert R. Heerdink1,4
Received: 7 February 2017 / Accepted: 3 June 2017 / Published online: 14 June 2017
� The Author(s) 2017. This article is an open access publication
Abstract
Purpose Previously, a high prevalence of certain psychi-
atric disorders was shown among non-Western immigrants.
This study explores whether this results in more prescrip-
tions for psychotropic medication.
Methods Data on dispensing of medication among adults
living in the four largest Dutch cities in 2013 were linked to
demographic data from Statistics Netherlands. Incident
(i.e., following no dispensing in 2010–2012) and prevalent
dispensing among immigrants was compared to that among
native Dutch (N = 1,043,732) and analyzed using multi-
variable Poisson and logistic regression.
Results High adjusted Odds Ratios (ORadj) of prevalent
and high Incidence Rate Ratios (IRRadj) of incident dis-
pensing of antipsychotics were found among Moroccan
(N = 115,455) and Turkish individuals (N = 105,460),
especially among young Moroccan males (ORadj = 3.22
[2.99–3.47]). Among Surinamese (N = 147,123) and
Antillean individuals (N = 41,430), slightly higher rates of
dispensed antipsychotics were found and the estimates
decreased after adjustment. The estimates for antipsychotic
dispensing among the Moroccan and Turkish increased,
following adjustment for household composition. Rates for
antidepressant dispensing among Turkish and Moroccan
subjects were high (Moroccans: ORadj = 1.74 [1.70–
1.78]). Among Surinamese and Antillean subjects, the rates
for antidepressant dispensing were low and the ORadj lag-
ged behind the IRRadj (Surinamese: 0.69 [0.67–0.71] vs.
1.06 [1.00–1.13]). Similar results were found for anxi-
olytics. For ADHD medication, lower dispensing rates
were found among all migrant groups.
Conclusions The findings agree with earlier reports of
more mental health problems among Moroccan and Turk-
ish individuals. Surinamese/Antillean individuals did not
use psychotropic drugs at excess and discontinued antide-
pressants and anxiolytics earlier. The data strongly suggest
under-treatment for ADHD in all ethnic minority groups.
Keywords Ethnic minorities � Pharmacoepidemiology �Antipsychotics � Antidepressants � Psychostimulants
Introduction
The mental health of immigrants to the Western world is an
important issue. The processes of loss, change, and finding
ways to satisfy the new requirements of the host society
may bring along various sources of stress and increased
risks of mental health problems [1].
Different data sources can be used to quantify differ-
ences in the incidence and/or prevalence of mental health
disorders between the native and migrant populations. Data
from population surveys may be biased by the use of
questionnaires that are not validated for certain ethnic
minority groups, low response rates or high response rates
& Fabian Termorshuizen
1 Division of Pharmacoepidemiology and Clinical
Pharmacology, Utrecht Institute for Pharmaceutical Sciences,
Utrecht University, P.O. Box 80082, 3508 TB Utrecht,
The Netherlands
2 Rivierduinen, Institute for Mental Health Care,
Sandifortdreef 19, 2333 ZZ Leiden, The Netherlands
3 Department of Psychiatry and Psychology, School for Mental
Health and Neuroscience MHeNS, Maastricht University,
Universiteitssingel 40, 6229 ER Maastricht, The Netherlands
4 Department of Clinical Pharmacy, University Medical Center
Utrecht, Heidelberglaan 100, 3584 CX Utrecht,
The Netherlands
123
Soc Psychiatry Psychiatr Epidemiol (2017) 52:963–977
DOI 10.1007/s00127-017-1405-x
from individuals with a higher level of education, and
proficiency of the language of the host country [2].
Immigrants may underutilize mental health care, due to
cultural and linguistic barriers, and mismatches between
needs and provision of care [3]. As a consequence, the
results from clinical records or other indicators of health
care utilization, such as use of medication, may be influ-
enced by these differences in help-seeking behavior and/or
treatment compliance and, thus, may not yield valid fig-
ures. In a Spanish health region, contrary to the expectation
of a higher risk of mental health problems, a lower use of
antipsychotic and antidepressant medication was found
among immigrants from Eastern Europe and sub-Saharan
Africa [4, 5]. This may be explained by services not being
adapted to the needs of immigrants, physicians’ attitudes,
linguistic barriers, and/or cultural differences such as ill-
ness attributions and feelings of stigmatized [5, 6]. On the
other hand, it is also possible that the prevalence of
(mental) health problems among recent immigrants, such
as those in this Spanish region, is low: the so-called
‘healthy immigrant effect’ [7, 8]. The prevalence of mental
health problems may increase with the length of stay in the
host country due to adverse factors such as socioeconomic
hardship, discrimination, and disappointment with the
perspectives on the labor market [9–13].
In The Netherlands, large and stable immigrant popu-
lations from four non-Western countries (Turkey, Mor-
occo, Surinam, and Netherlands Antilles) have been
present since a number of decades. An increased risk of
mental disorders, especially schizophrenia among first- and
second-generation individuals of Moroccan or Surinamese
origin [14–16] and depressive disorder among subjects of
Turkish origin [17–20], has been reported consistently. An
analysis of data on dispensed psychotropic medication may
be helpful to find out whether prescription rates are in
accordance with the observed morbidity patterns and to
monitor possible under-treatment [9].
An earlier Dutch study of data from a health-insurance
company reported an increased rate of dispensed antipsy-
chotic and antidepressant drugs among Moroccan and
Turkish subjects and a lower rate of dispensed medication
for attention deficit and hyperactivity disorder (ADHD)
[21]. Unfortunately, those of Surinamese or Dutch Antil-
lean origin were not considered. Furthermore, no distinc-
tion was made between incident and prevalent dispensing
of medication. This may be important to reveal earlier
cessation of use and lower treatment compliance among
certain ethnic minorities, as was reported for the use of
psychostimulants by Moroccan and Turkish children
diagnosed with ADHD [22]. The present study used a large
population-based data set to compare the incidence and
prevalence of dispensing psychotropic medication to
members of the four largest ethnic minority groups to that
to Dutch natives.
Methods
Data sources
Two data sources were used. First, the population register
(Dutch: Gemeentelijke Basis Administratie, GBA) present
at Statistics Netherlands (Dutch: Centraal Bureau voor de
Statistiek, CBS) records information on date of birth, sex,
country of birth, country of birth of both parents, city and
neighborhood of residence, marital status, and date of death
for all legally residing citizens of The Netherlands. When a
subject marries or changes his place of abode, a new record
is added, but the historical records remain available for
analysis.
The second database, from the Health Care Institute
Netherlands (Dutch: Zorginstituut Nederland, ZiN), con-
tains information on prescribed and dispensed medication
reimbursed by health-insurance companies during the
period 2006–2013. The data have been derived from all
health-insurance companies in The Netherlands and have
been collected for the purpose of risk adjustments,
because some companies insure more patients with a high
risk of expensive health care utilization than others. Dutch
citizens are obliged by law to have a medical insurance.
Since there is no distinction between public and private
health-insurance companies, the results of our study are
not influenced by selection of immigrants who can afford
a health insurance. This database records information on
drugs dispensed to outpatients and patients in nursing
homes, not on drugs dispensed during episodes of in-pa-
tient treatment. For a particular calendar year and for a
given individual, the first four positions of the ATC code
of the medication(s) are registered. Dispensed medica-
tions within a calendar year with identical first four
positions are mentioned only once for that subject. Thus,
it is possible to establish whether a person had medication
dispensed within a certain calendar year and for which
class(es) of drugs (e.g., N06A, antidepressants; A10A:
insulins and analogs).
Staff of CBS linked the information from the two
databases, using the civil identification number, unique for
each Dutch citizen. Dutch privacy laws allow the use of
personal (health care) data for medical-scientific research
without informed consent, provided that the results of the
analysis cannot be traced to a unique person [23]. Conse-
quently, staff of the CBS removed the postal code and the
civil identification number from the files that were avail-
able to the researchers.
964 Soc Psychiatry Psychiatr Epidemiol (2017) 52:963–977
123

Data extraction and definition of ethnic origin
To prevent the presence of correlated data because of more
than one assessment of dispensing of a certain category of
drugs within the same individual during subsequent years, the
present analysis was restricted to one calendar year (2013).
The analysis was also restricted to those aged 18 years and
older and to persons resident during (a part of) this year in one
of the four large cities in The Netherlands (Amsterdam, Rot-
terdam, The Hague, Utrecht). Most members of ethnic
minorities in The Netherlands live in these cities, and this
restriction made adjustments for population density or for
urban–rural differences superfluous. Data on dispensed psy-
chotropic medication (ATC codes N05, N06, N07B) were
analyzed, leaving the use of medication for somatic disorders
out of consideration. Characteristics of the household (i.e.,
being married, part of one-parent family, being single or living
in an institute), as established at January 1st 2013, were
regarded as time-independent during 2013. Socioeconomic
status (SES) was established at the neighborhood level and
defined as the proportion of households receiving national
assistance benefit due to unemployment. If a person moved to
another neighborhood in the same or another city during 2013,
an average of this proportion for that person was estimated.
This average was weighted for the duration of the subsequent
episodes of residence during 2013 in the pertinent
neighborhoods.
The CBS classifies ethnicity according to a citizen’s
country of birth and the country of his or her parents’ birth.
A Dutch-born subject with two Dutch-born parents is con-
sidered native Dutch. If a citizen has been born abroad, he or
she is assigned to the ethnicity of the people born in the same
country. A Dutch-born citizen is considered a second-gener-
ation citizen if at least one of his or her parents was foreign-
born. If the parents were born in different foreign countries,
the maternal country of birth was decisive for assignment to a
particular ethnic group. Since most non-Western ethnic
minorities in The Netherlands originate from Turkey, Mor-
occo, Surinam, and the Netherlands Antilles, the analysis was
restricted to these ethnic groups. Both first and second-gen-
eration immigrants were included according to the definition
of ethnic minority group used by the CBS.
Labor migration from Morocco started in the 1960s.
Many ‘guest workers’ decided to stay in The Netherlands and
brought their families with them. Their SES is in general
unfavorable compared to the Dutch majority, and they
experience high degrees of discrimination. Turkish immi-
grants arrived in the same period, but report lower degrees of
discrimination; they appear to have stronger bonds within
their own ethnic group [24]. Surinam is a former Dutch
colony that gained independence in 1975, which caused mass
emigration to The Netherlands during the years thereafter.
Most immigrants from the Netherlands Antilles, another
former Dutch colony, moved to The Netherlands for study
and work. The Surinamese population is racially diverse,
while the Dutch Antillean population is predominantly
black. Both populations speak Dutch fluently [25].
Analysis
The prevalent dispensing of psychotropic medication in
2013 was analyzed as a yes/no variable in multivariable
logistic regression models. The dispensing to members of
any of the four ethnic minority groups was compared to the
dispensing to the native Dutch in four separate analyses.
The difference in proportions was expressed as an odds
ratio (OR) with a 95% confidence interval (95% CI). The
OR was adjusted for age and gender, and in a next step also
for neighborhood SES and in a final step also for household
composition. We distinguished between antipsychotics
(N05A), antidepressants (N06A), anxiolytics (N05B), and
psychostimulants (N06B).
The incident dispensing of psychotropic medication was
analyzed using multivariable Poisson regression models.
Incident dispensing in 2013 was defined as supply of a
medication among subjects who had not filled a prescrip-
tion for this particular category of psychotropic medication
during the period 2010–2012. The difference in incidence
rates (new users/1000 person-years) was expressed as an
Incidence Rate Ratio (IRR), adjusted for age and gender,
neighborhood SES, and household composition. The 95%
CIs were adjusted for possible over-dispersion.
Data management and record linkage were performed
with SPSS version 21.0. The logistic and Poisson regres-
sion analyses were performed with STATA, version 14.0.
Results
Description and crude figures on dispensing
of psychotropic medication
Table 1 shows the numbers and characteristics of the
included subjects, by ethnic group. There were major dif-
ferences in age distribution, and SES of the neighborhood
and household composition. Comparatively high numbers
of Turkish–Dutch and Moroccan–Dutch subjects were
married or co-habiting (70.2 and 67.0% vs 55.7%, P values
\0.001), whereas high proportions of Surinamese and
Antillean–Dutch subjects were members of a single-parent
family (22.8 and 20.6% vs 5.8%, P values\0.001), which
necessitate adjustments in the analyses.
Table 1 also shows crude figures on dispensed antipsy-
chotics, antidepressants, anxiolytics, and psychostimulants
for the separate ethnic groups.
Soc Psychiatry Psychiatr Epidemiol (2017) 52:963–977 965
123

All psychotropic drugs (N05/N06/N07B)
Prevalence
The age- and gender-adjusted OR of filling a prescription for
psychotropic medication (all classes) among the four ethnic
minorities, compared to the native Dutch, mirrored the crude
figures of Table 1 (Table 2). The results showed a signifi-
cantly higher rate among the Turkish- (OR = 1.59) and
Moroccan–Dutch (OR = 1.53), a similar rate among the
Surinamese–Dutch (OR = 1.01), and a significantly lower
rate among the Antillean–Dutch (OR = 0.76). After further
adjustment for neighborhood SES, these ORs decreased sig-
nificantly, as evidenced by 95% CIs that did not overlap the
previous 95% CIs. Adjustment for household composition (in
addition to age, gender, and SES) resulted in a further low-
ering of the OR among the Surinamese–Dutch and the
Antillean–Dutch. Among the Turkish–Dutch and Moroccan–
Dutch, on the other hand, the same adjustment resulted in a
significant increase of the OR (to 1.54 and 1.50, respectively).
Thus, this variable appears to be a protective factor for
receiving a prescription for a psychotropic drug among
Turkish–Dutch and Moroccan–Dutch, but a risk factor for the
other two minorities, when comparing the model with
adjustment for household composition and SES with the
model with adjustment for SES (in addition to age and gender
in all models). Indeed, being married or co-habiting (often
found among the Turkish–Dutch and Moroccan–Dutch, see
Table 1) was associated with a lower prevalence of psy-
chotropic medication, whereas being part of a single-parent
family (more frequent among the Surinamese–Dutch and the
Antillean–Dutch) was associated with a higher prevalence of
psychotropic medication (data available on request).
Incidence
With incident dispensing as outcome, a similar picture was
found for the Turkish–Dutch and Moroccan–Dutch. For the
Table 1 Profile of cohort of citizens in four largest Dutch cities by ethnic group: sociodemographic data and incident and prevalent dispensing
of psychotropic drugs, 2013
N total Dutch native Turkish Moroccan Surinamese Neth. Antillean
N = 1,043,732 N = 105,460 N = 115,455 N = 147,123 N = 41,430
Age (years)
18–30 250,888 (24.0%) 32,931 (31.2%) 36,855 (31.9%) 38,336 (26.0%) 16,654 (40.2%)
30–40 178,711 (17.1%) 27,625 (26.1%) 29,548 (25.5%) 27,571 (18.7%) 8691 (20.9%)
40–60 328,407 (31.4%) 34,763 (32.9%) 36,141 (31.3%) 58,532 (39.7%) 12,067 (29.1%)
C60 285,726 (27.3%) 10,141 (9.6%) 12,911 (11.1%) 22,684 (15.4%) 4018 (9.7%)
Gender %male 507,138 (48.5%) 54,893 (52.0%) 59,857 (51.8%) 68,340 (46.4%) 20,297 (48.9%)
Unemployment rate neighborhood (SES)
(#/1000 households) 1.\25 193,130 (18.5%) 2,646 (2.5%) 2816 (2.4%) 6107 (4.1%) 2528 (6.1%)
2. 25–51 231,580 (22.1%) 9385 (8.9%) 8373 (7.2%) 15,704 (10.6%) 4009 (9.6%)
3. 51–88 256,707 (24.6%) 11,997 (11.3%) 15,404 (13.3%) 25,212 (17.1%) 6978 (16.8%)
4.99–138 209,508 (20.0%) 27,740 (26.3%) 34,858 (30.1%) 35,022 (23.8%) 10,995 (26.5%)
5. C138 147,806 (14.1%) 53,451 (50.6%) 53,609 (46.4%) 64,560 (43.8%) 16,646 (40.1%)
9. unknown 5001 (0.4%) 241 (0.2%) 395 (0.3%) 518 (0.3%) 274 (0.6%)
Household characteristics
Married/co-habiting 581,894 (55.7%) 74,081 (70.2%) 77,436 (67.0%) 63,287 (43.0%) 14,101 (34.0%)
Single-parent family 61,222 (5.8%) 10,808 (10.2%) 11,407 (9.8%) 33,679 (22.8%) 8570 (20.6%)
Unmarried/single 360,674 (34.5%) 16,183 (15.3%) 18,726 (16.2%) 42,741 (29.0%) 15,150 (36.5%)
Institute 20,619 (1.9%) 392 (0.3%) 979 (0.8%) 2429 (1.6%) 775 (1.8%)
9. Other/unknown 19,323 (1.8%) 3996 (3.7%) 6907 (5.9%) 4987 (3.3%) 2834 (6.8%)
Prevalence (%); incidence (N/1000py)
All psychotropic drugs 11.36%; 27.56 14.51%; 42.04 14.19%; 40.14 11.10%; 32.77 7.43%; 27.67
Antipsychotics (N05A) 2.10%; 5.94 3.58%; 8.70 4.50%; 9.20 2.88%; 5.59 2.29%; 4.79
Antidepressants (N06A) 6.99%; 15.20 10.50%; 28.42 10.16%; 29.15 5.48%; 18.11 3.5%; 15.21
Anxiolytics (N05B) 2.95%; 10.06 4.50%; 20.26 3.73%; 15.18 3.86%; 15.08 2.05%; 10.38
Psychostimulants (N06B) 0.94%; 2.62 0.31%; 1.37 0.25%; 0.95 0.25%; 0.91 0.48%; 1.76
py person-years
966 Soc Psychiatry Psychiatr Epidemiol (2017) 52:963–977
123
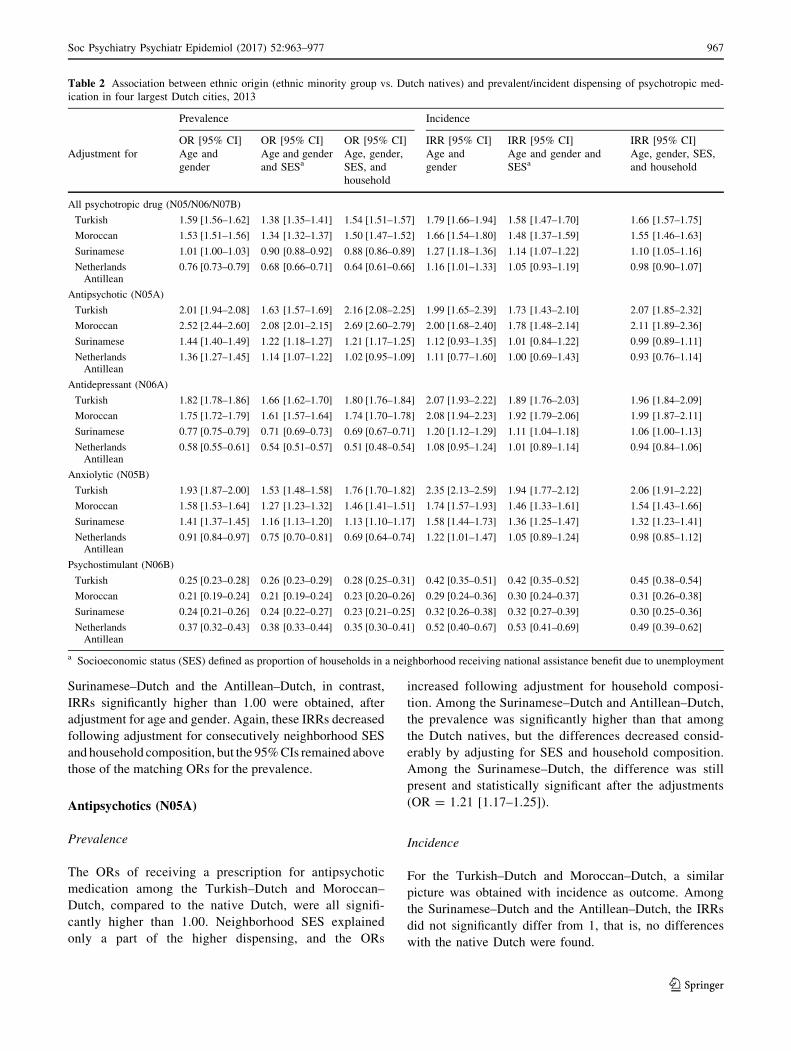
Surinamese–Dutch and the Antillean–Dutch, in contrast,
IRRs significantly higher than 1.00 were obtained, after
adjustment for age and gender. Again, these IRRs decreased
following adjustment for consecutively neighborhood SES
and household composition, but the 95% CIs remained above
those of the matching ORs for the prevalence.
Antipsychotics (N05A)
Prevalence
The ORs of receiving a prescription for antipsychotic
medication among the Turkish–Dutch and Moroccan–
Dutch, compared to the native Dutch, were all signifi-
cantly higher than 1.00. Neighborhood SES explained
only a part of the higher dispensing, and the ORs
increased following adjustment for household composi-
tion. Among the Surinamese–Dutch and Antillean–Dutch,
the prevalence was significantly higher than that among
the Dutch natives, but the differences decreased consid-
erably by adjusting for SES and household composition.
Among the Surinamese–Dutch, the difference was still
present and statistically significant after the adjustments
(OR = 1.21 [1.17–1.25]).
Incidence
For the Turkish–Dutch and Moroccan–Dutch, a similar
picture was obtained with incidence as outcome. Among
the Surinamese–Dutch and the Antillean–Dutch, the IRRs
did not significantly differ from 1, that is, no differences
with the native Dutch were found.
Table 2 Association between ethnic origin (ethnic minority group vs. Dutch natives) and prevalent/incident dispensing of psychotropic med-
ication in four largest Dutch cities, 2013
Prevalence Incidence
OR [95% CI] OR [95% CI] OR [95% CI] IRR [95% CI] IRR [95% CI] IRR [95% CI]
Adjustment for Age and
gender
Age and gender
and SESaAge, gender,
SES, and
household
Age and
gender
Age and gender and
SESaAge, gender, SES,
and household
All psychotropic drug (N05/N06/N07B)
Turkish 1.59 [1.56–1.62] 1.38 [1.35–1.41] 1.54 [1.51–1.57] 1.79 [1.66–1.94] 1.58 [1.47–1.70] 1.66 [1.57–1.75]
Moroccan 1.53 [1.51–1.56] 1.34 [1.32–1.37] 1.50 [1.47–1.52] 1.66 [1.54–1.80] 1.48 [1.37–1.59] 1.55 [1.46–1.63]
Surinamese 1.01 [1.00–1.03] 0.90 [0.88–0.92] 0.88 [0.86–0.89] 1.27 [1.18–1.36] 1.14 [1.07–1.22] 1.10 [1.05–1.16]
NetherlandsAntillean
0.76 [0.73–0.79] 0.68 [0.66–0.71] 0.64 [0.61–0.66] 1.16 [1.01–1.33] 1.05 [0.93–1.19] 0.98 [0.90–1.07]
Antipsychotic (N05A)
Turkish 2.01 [1.94–2.08] 1.63 [1.57–1.69] 2.16 [2.08–2.25] 1.99 [1.65–2.39] 1.73 [1.43–2.10] 2.07 [1.85–2.32]
Moroccan 2.52 [2.44–2.60] 2.08 [2.01–2.15] 2.69 [2.60–2.79] 2.00 [1.68–2.40] 1.78 [1.48–2.14] 2.11 [1.89–2.36]
Surinamese 1.44 [1.40–1.49] 1.22 [1.18–1.27] 1.21 [1.17–1.25] 1.12 [0.93–1.35] 1.01 [0.84–1.22] 0.99 [0.89–1.11]
NetherlandsAntillean
1.36 [1.27–1.45] 1.14 [1.07–1.22] 1.02 [0.95–1.09] 1.11 [0.77–1.60] 1.00 [0.69–1.43] 0.93 [0.76–1.14]
Antidepressant (N06A)
Turkish 1.82 [1.78–1.86] 1.66 [1.62–1.70] 1.80 [1.76–1.84] 2.07 [1.93–2.22] 1.89 [1.76–2.03] 1.96 [1.84–2.09]
Moroccan 1.75 [1.72–1.79] 1.61 [1.57–1.64] 1.74 [1.70–1.78] 2.08 [1.94–2.23] 1.92 [1.79–2.06] 1.99 [1.87–2.11]
Surinamese 0.77 [0.75–0.79] 0.71 [0.69–0.73] 0.69 [0.67–0.71] 1.20 [1.12–1.29] 1.11 [1.04–1.18] 1.06 [1.00–1.13]
NetherlandsAntillean
0.58 [0.55–0.61] 0.54 [0.51–0.57] 0.51 [0.48–0.54] 1.08 [0.95–1.24] 1.01 [0.89–1.14] 0.94 [0.84–1.06]
Anxiolytic (N05B)
Turkish 1.93 [1.87–2.00] 1.53 [1.48–1.58] 1.76 [1.70–1.82] 2.35 [2.13–2.59] 1.94 [1.77–2.12] 2.06 [1.91–2.22]
Moroccan 1.58 [1.53–1.64] 1.27 [1.23–1.32] 1.46 [1.41–1.51] 1.74 [1.57–1.93] 1.46 [1.33–1.61] 1.54 [1.43–1.66]
Surinamese 1.41 [1.37–1.45] 1.16 [1.13–1.20] 1.13 [1.10–1.17] 1.58 [1.44–1.73] 1.36 [1.25–1.47] 1.32 [1.23–1.41]
NetherlandsAntillean
0.91 [0.84–0.97] 0.75 [0.70–0.81] 0.69 [0.64–0.74] 1.22 [1.01–1.47] 1.05 [0.89–1.24] 0.98 [0.85–1.12]
Psychostimulant (N06B)
Turkish 0.25 [0.23–0.28] 0.26 [0.23–0.29] 0.28 [0.25–0.31] 0.42 [0.35–0.51] 0.42 [0.35–0.52] 0.45 [0.38–0.54]
Moroccan 0.21 [0.19–0.24] 0.21 [0.19–0.24] 0.23 [0.20–0.26] 0.29 [0.24–0.36] 0.30 [0.24–0.37] 0.31 [0.26–0.38]
Surinamese 0.24 [0.21–0.26] 0.24 [0.22–0.27] 0.23 [0.21–0.25] 0.32 [0.26–0.38] 0.32 [0.27–0.39] 0.30 [0.25–0.36]
NetherlandsAntillean
0.37 [0.32–0.43] 0.38 [0.33–0.44] 0.35 [0.30–0.41] 0.52 [0.40–0.67] 0.53 [0.41–0.69] 0.49 [0.39–0.62]
a Socioeconomic status (SES) defined as proportion of households in a neighborhood receiving national assistance benefit due to unemployment
Soc Psychiatry Psychiatr Epidemiol (2017) 52:963–977 967
123

Antidepressants (N06A)
Prevalence
Among the Turkish–Dutch and the Moroccan–Dutch, the
prevalence of antidepressants was significantly higher than
that among the native Dutch. SES explained only a minor
part of this difference. Again, adjustment for household
composition suggested the presence of a protective effect
of being married or co-habitation. Among the Surinamese–
Dutch and Antillean–Dutch, the prevalence was signifi-
cantly lower than that among the native Dutch, irrespective
of adjustments (all ORs\1.00).
Incidence
For the Turkish–Dutch and the Moroccan–Dutch, the IRRs
were somewhat higher than the ORs with non-overlapping
95% CIs. Remarkably, among the Surinamese–Dutch and
Antillean–Dutch, the IRRs indicated no difference with the
native Dutch, and the 95% CIs of the IRRs were all above
the 95% CIs of the matching ORs. This suggests a shorter
duration of treatment after starting antidepressants.
Anxiolytics (N05B)
The incidence and prevalence rates of prescriptions for
anxiolytics were higher among the Turkish–Dutch and the
Moroccan–Dutch compared to the native Dutch, with
similar effects of the various adjustments. Again, the IRRs
were somewhat higher than the ORs with non-overlapping
95% CIs. Albeit less pronounced, an increased prevalence
(OR = 1.13) and incidence (IRR = 1.32) were also
obtained for the Surinamese–Dutch, after adjustments. In
addition, the IRR was somewhat higher than the OR with
non-overlapping 95% CIs. Among the Antillean–Dutch;
however, a significantly lower prevalence (OR = 0.69) and
a similar incidence (IRR = 0.98) were observed.
Psychostimulants (N06B)
Among all ethnic minority groups, and irrespective of adjust-
ments, the dispensing of psychostimulants was markedly lower.
The IRRs were somewhat higher than the matching ORs, with
no or minor overlap in 95% CIs, suggesting shorter treatment
duration after starting psychostimulants among ethnic minority
groups compared to the native Dutch.
Subgroup analyses by gender and age (Tables 3, 4, 5,
6 in Appendix)
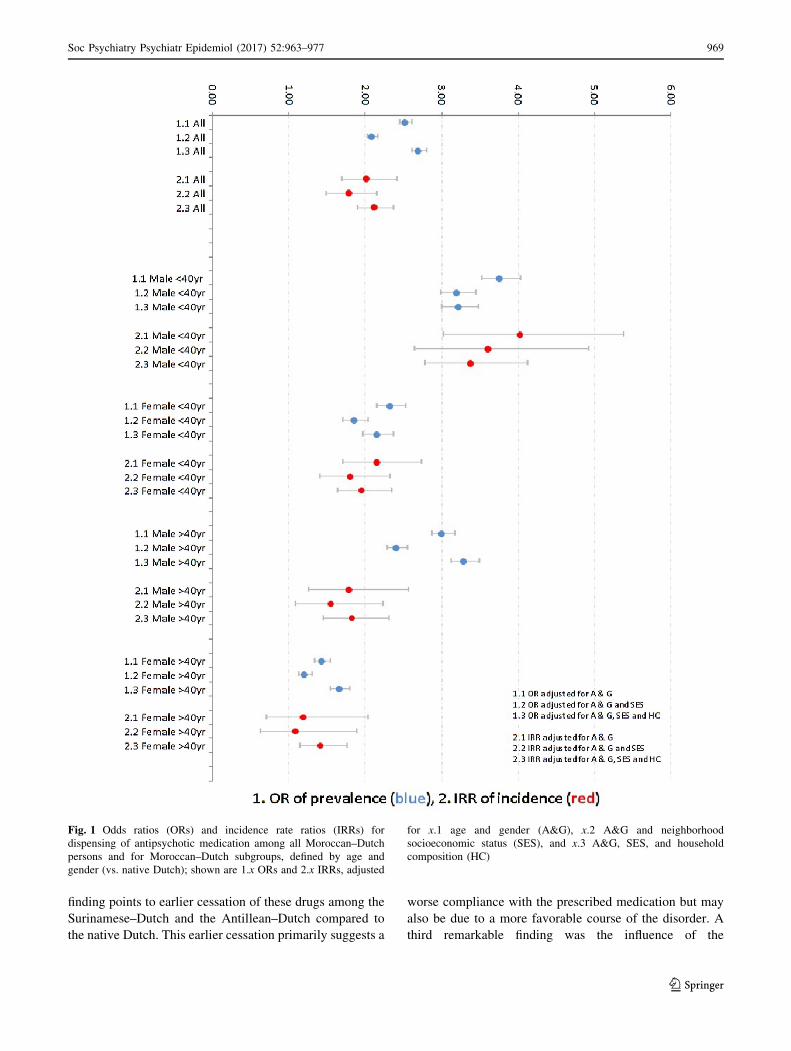
Very high rates of dispensed antipsychotic medication were
found among Moroccan–Dutch males aged \40 years
(Fig. 1). Their adjusted OR (compared to native Dutch males
aged\40 years) was 3.22 [2.99–3.47], and the adjusted IRR
was 3.38 [2.77–4.11]. Among Moroccan–Dutch males aged
C40 years, a high adjusted OR was found as well (3.29
[3.12–3.48]), whereas the IRR was considerably lower (1.82
[1.44–2.31]). The values related to antipsychotic medication
for Moroccan–Dutch women of both age categories (com-
pared to native Dutch females in the same age category) were
substantially lower than those for Moroccan–Dutch males,
but, after adjustment, still significantly higher than 1.0.
Among the Turkish–, the Surinamese–, and the Antillean–
Dutch, in contrast, no pronounced differences in adjusted
ORs and IRRs across age and gender strata were found.
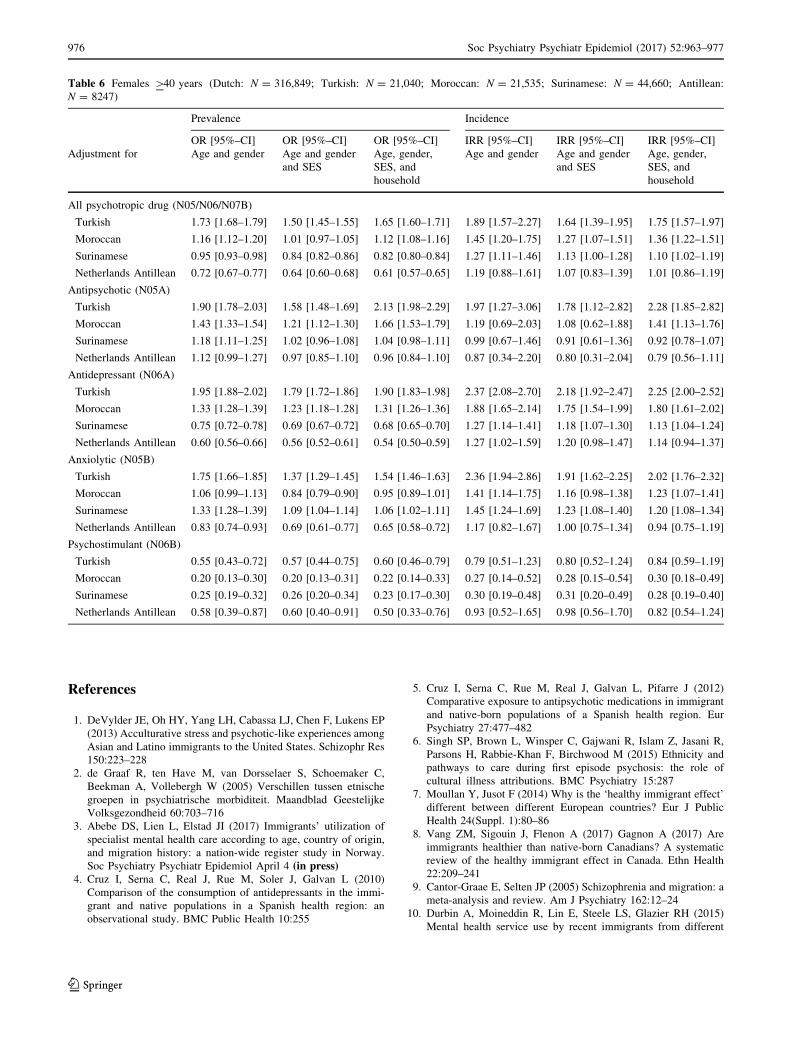
The discrepancies between the incidence and prevalence
of antidepressants dispensing were found in most age and
gender strata, especially among the Surinamese–Dutch
(Fig. 2) and Antillean–Dutch. Comparatively high ORs and
IRRs and—as an exception—a reverse pattern of a lower
IRR than the matching OR were found for antidepressants
among the Turkish–Dutch and Moroccan–Dutch males
aged C40 years.
A high prevalence of dispensing of anxiolytic medica-
tion was found among Moroccan males aged \40 years
(OR = 1.91 [1.74–2.09] and IRR = 2.00 [1.72–2.33]),
whereas this prevalence among Moroccan females aged
C40 years was comparatively low (OR = 0.95 [0.89–1.01]
and IRR = 1.23 [1.07–1.41]). Among the Antillean–
Dutch, similar or lower dispensing of anxiolytic medication
was found across the four age–gender strata, with IRRs
higher than the matching ORs.
The lower prevalence and incidence of prescriptions of
psychostimulants among the ethnic minority groups com-
pared to the native Dutch were found in almost all age–
gender strata. As an exception, among Turkish–Dutch
males aged C40 years, the IRR was 1.03 [0.78–1.36]. The
matching OR, however, was significantly lower (0.55
[0.44–0.70]. In most groups, the IRR was higher than the
matching OR.
Discussion
This study found comparatively high dispensing rates for
antipsychotics, antidepressants, and anxiolytics among the
Moroccan–Dutch and Turkish–Dutch, while the corre-
sponding rates among the Surinamese–Dutch and Antil-
lean–Dutch were less pronounced. Second, IRRs of
incident dispensing higher than the matching ORs of
prevalent dispensing of antidepressants and anxiolytics,
especially among the Surinamese–Dutch and the Antil-
lean–Dutch were found. As the prevalence is a result of
both the incidence and the duration of a certain condition
(here treatment with antidepressants and anxiolytics), this
968 Soc Psychiatry Psychiatr Epidemiol (2017) 52:963–977
123
finding points to earlier cessation of these drugs among the
Surinamese–Dutch and the Antillean–Dutch compared to
the native Dutch. This earlier cessation primarily suggests a
worse compliance with the prescribed medication but may
also be due to a more favorable course of the disorder. A
third remarkable finding was the influence of the
Fig. 1 Odds ratios (ORs) and incidence rate ratios (IRRs) for
dispensing of antipsychotic medication among all Moroccan–Dutch
persons and for Moroccan–Dutch subgroups, defined by age and
gender (vs. native Dutch); shown are 1.x ORs and 2.x IRRs, adjusted
for x.1 age and gender (A&G), x.2 A&G and neighborhood
socioeconomic status (SES), and x.3 A&G, SES, and household
composition (HC)
Soc Psychiatry Psychiatr Epidemiol (2017) 52:963–977 969
123

Fig. 2 Odds ratios (ORs) and incidence rate ratios (IRRs) for
dispensing of antidepressants among all Surinamese–Dutch persons
and among Surinamese-Dutch subgroups, defined by age and gender
(vs. native Dutch); shown are 1.x ORs and 2.x IRRs, adjusted for x.1
age and gender (A&G), x.2 A&G and neighborhood socioeconomic
status (SES), and x.3 A&G, SES, and household composition (HC)
970 Soc Psychiatry Psychiatr Epidemiol (2017) 52:963–977
123

composition of the household. This turned out to be a
favorable factor among the Turkish–Dutch and Moroccan–
Dutch, but an unfavorable one among their Surinamese and
Antillean counterparts. Those of Surinamese and Antillean
origin appeared to be more often part of a one-parent
family, and being part of an one-parent family was asso-
ciated with the multivariable models with a higher dis-
pensing rate of antipsychotics, antidepressants, anxiolytics,
and psychostimulants compared to being part of a house-
hold with a married couple (data available on request).
Finally, the dispensing rates for psychostimulants were
considerably lower among all ethnic minority groups (ORs
and IRRs\0.50).
Comparison with previous studies
A recent meta-analysis showed that the psychosis risks for
Moroccan–Dutch males are significantly higher than those
for Moroccan–Dutch females [26]. Possible explanations
for this hitherto unexplained phenomenon are the higher
risk of illicit drug use among Moroccan–Dutch males and
socioenvironmental risk factors such as achievement–ex-
pectation mismatch, discrimination, and stigmatization
[26]. The increased dispensing rates of antipsychotics
among the Moroccan–Dutch and the major gender gap
herein as found in the present study are in accordance with
the pertinent epidemiological studies conducted in The
Netherlands [15, 16, 25–27]. We have no ready explanation
for the much less increased OR of dispensed antipsychotic
medication among the Moroccan–Dutch reported by Wit-
tkampf et al. (OR = 1.15 [1.10–1.21]) [21].W Whether
this is due to restriction of individuals at one certain
insurance company remains a question.
As the mentioned studies focus on different links in the
chain from the true prevalence/incidence of psy-
chopathology, health seeking and diagnosis, hospital
admission, medication prescription, to medication dis-
pensing, actual use, and treatment compliance, comparison
of these studies has to be done with caution and agreement
does not necessarily preclude the presence of inconsisten-
cies and, the other way round, lack of agreement does not
necessarily indicate inconsistencies.
A remarkable finding in our study was the significantly
increased dispensing of antipsychotic medication among the
Turkish–Dutch. Epidemiological studies of non-affective
psychotic disorder have reported results that differed by
generation: a significant increase in risk for the second
generation [16, 18, 28], not for the first [16, 25]. As
antipsychotics are often prescribed for other indications, the
increased use among the Turkish aged 40 years and older
may be due to prescriptions in patients with dementia [29]
and among the Turkish of all ages for treatment of depressive
disorders. Indeed, there have been consistent reports in the
literature of an increased risk of depressive disorders among
the Turkish–Dutch [17–20, 30], and this may explain the
higher dispensing rates of both antipsychotic, antidepressant,
and anxiolytic medication in this ethnic group.
Higher risks for non-affective psychotic disorder have
also been reported for Surinamese and Antillean immi-
grants to The Netherlands [14–16, 25, 27]. For example, a
national register-based study reported an age- and gender-
adjusted RR of the first admission for schizophrenia of 3.80
[3.52–4.10] for Surinamese immigrants, and of 3.98
[3.50–4.53] for Antillean immigrants [14]. More recently, a
register-based study from the region of Utrecht found
higher Relative Risks of non-affective psychotic disorders
for the combined Surinamese and Antillean populations,
which ranged from 2.12 to 3.44 [27]. These effect measures
suggest that the dispensing of antipsychotic medication, as
assessed in the present study, does not match the true
occurrence of psychotic disorders. This may indicate
under-treatment and/or worse compliance with psy-
chotropic medication in general, as there was also a clear
discrepancy between incident and prevalent use of antide-
pressants and anxiolytic drugs in these ethnic groups. A
worse treatment compliance for antidepressants has been
reported before for non-Western minorities in The
Netherlands [31, 32]. Another interesting possibility,
however, is a decreasing incidence of psychotic disorder
among the Surinamese–Dutch and Antillean–Dutch over
time. This interpretation is suggested by relatively higher
prevalence rates for use of antipsychotics than incidence
rates. Future studies should resolve this important issue.
Interestingly, the effects of adjustment for household
composition on the risk for dispensing of antipsychotics
among the Surinamese–Dutch and Antillean–Dutch sup-
port the report of a major effect of parental separation on
the risk for psychosis among African-Caribbeans in the UK
[33].
The results with regard to psychostimulants (almost
always prescribed for ADHD), confirm the reports by
Wittkampf et al. (2010) [21] and van der Ban et al. (2015)
[22]. Lower use of ADHD medication by members of
ethnic minorities has also been reported in USA [34, 35].
There may be a higher treatment threshold and/or a greater
tolerance of behavioral problems among ethnic minorities
[36, 37]. Our results show that the lower utilization of
ADHD medication among ethnic minorities is not restric-
ted to children but is also clearly present among adults of
all age categories.
Strengths and limitations
Our population-based study included a very large sample
of more than one million native Dutch individuals and
more than 400,000 first- and second-generation
Soc Psychiatry Psychiatr Epidemiol (2017) 52:963–977 971
123

immigrants. It used administrative data of high quality that
was fully independent of willingness or ability to partici-
pate in surveys and that was not influenced by any recall
bias. The use of data from Statistics Netherlands guaran-
teed a correct identification of ethnic origin.
A number of limitations, however, have to be noted. The
data were available in a crude format, indicating use of
medication in broad ATC categories, but without details on
dosage, prescribing specialism, and clinical diagnosis.
Registered medication with ATC code N05A for antipsy-
chotics also includes lithium (N05AN), which is a mood
stabilizer, not an antipsychotic. Consequently, since evi-
dence suggests that the Moroccan–Dutch and Turkish–
Dutch use lithium less frequently than the native Dutch, the
present figures may underestimate the ethnic gap in the use
of antipsychotics [21]. Furthermore, antidepressants may
be prescribed for anxiety disorders and antipsychotic drugs
are also prescribed for non-psychotic disorders such as
sleep disorders and behavioral problems associated with
dementia and for psychotic mood disorders. Thus, the
observation of a higher dispensing of antipsychotic medi-
cation by Moroccan–Dutch individuals does not necessar-
ily point to an adequate treatment of those with a diagnosis
of non-affective psychotic disorder or to a higher inci-
dence/prevalence of psychotic disorders in this ethnic
group. Still, it is in accordance with earlier studies that
showed a higher frequency of mental health problems
among the Moroccan–Dutch.
The design of our study was cross-sectional with a
binary measure of medication dispensing in 2013.
Defining episodes of medication use with starting and
finishing dates and intermediate episodes of no use
would make it possible to study ethnic differences in
starting treatment and adherence in more detail. Still, the
data on subsequent calendar years allowed of a com-
parison between crude measures for prevalent and inci-
dent use, which brought to light important differences in
treatment adherence. The information from Statistics
Netherlands enabled us to adjust for two important
determinants of mental health care utilization: SES and
household composition. However, SES was measured at
the neighborhood level, not at the level of the individual.
Nevertheless, our results agree with those of earlier
studies, which showed that the relative risk of psychiatric
disorder for members of ethnic minorities is reduced by
adjustment for SES [38].
Household composition was handled as time-fixed, but
this may be regarded as sufficient for the short observation
period. The association with household composition is an
interesting finding. This warrants further exploration, e.g.,
to find out whether the so-called ethnic density effect (i.e.,
a lower prevalence of certain mental health outcomes for
members of ethnic minorities in neighborhoods with a
higher concentration of members of their own ethnic group
[27, 39] is (partly) mediated by this variable.
A limitation of the study was the relatively small number of
co-variables available for adjustments. However, this study
was not an in-depth etiological study aiming at establishing
causal relationships between different ethnic origins and
incidence of mental health problems, but to check whether
results from population-based administrative databases on
medication dispensing confirm epidemiological findings
derived from smaller samples. The available variables (age,
gender, SES, household composition and ethnicity) may be
regarded as the most important to characterize individuals in
studies of this kind. Of note, many epidemiological studies on
ethnic differences in risk of mental health problems adjusted
the results for age and gender only [9].
Conclusion and relevance
The observed ethnic pattern in the dispensing of psy-
chotropic medication at the population level is to a certain
degree in accordance with the pattern reported by earlier
studies. However, the findings also strongly suggest under-
treatment of psychotic and depressive disorders among the
Surinamese–Dutch and Antillean–Dutch and of ADHD
among all ethnic minority groups. Thus, data on use of
psychotropic medication at the population level are useful
for addressing ethnic disparities in mental health care uti-
lization and for the evaluation of public health interven-
tions that aim to adjust these disparities.
Acknowledgements The authors thank Statistics Netherlands (Cen-
traal Bureau voor de Statistiek, CBS) and Health Care Institute
Netherlands (Zorginstituut Nederland, ZiN) for kindly providing the
data necessary for the present analysis. The authors thank the
Netherlands Organization for Health Research and Development for
financial support of this project (Grant Number 836022003).
972 Soc Psychiatry Psychiatr Epidemiol (2017) 52:963–977
123
Compliance with ethical standards
Conflict of interest On behalf of all authors, the corresponding
author states that there is no conflict of interest.
Open Access This article is distributed under the terms of the Creative
Commons Attribution 4.0 International License (http://creative
commons.org/licenses/by/4.0/), which permits unrestricted use, distri-
bution, and reproduction in any medium, provided you give appropriate
credit to the original author(s) and the source, provide a link to the
Creative Commons license, and indicate if changes were made.
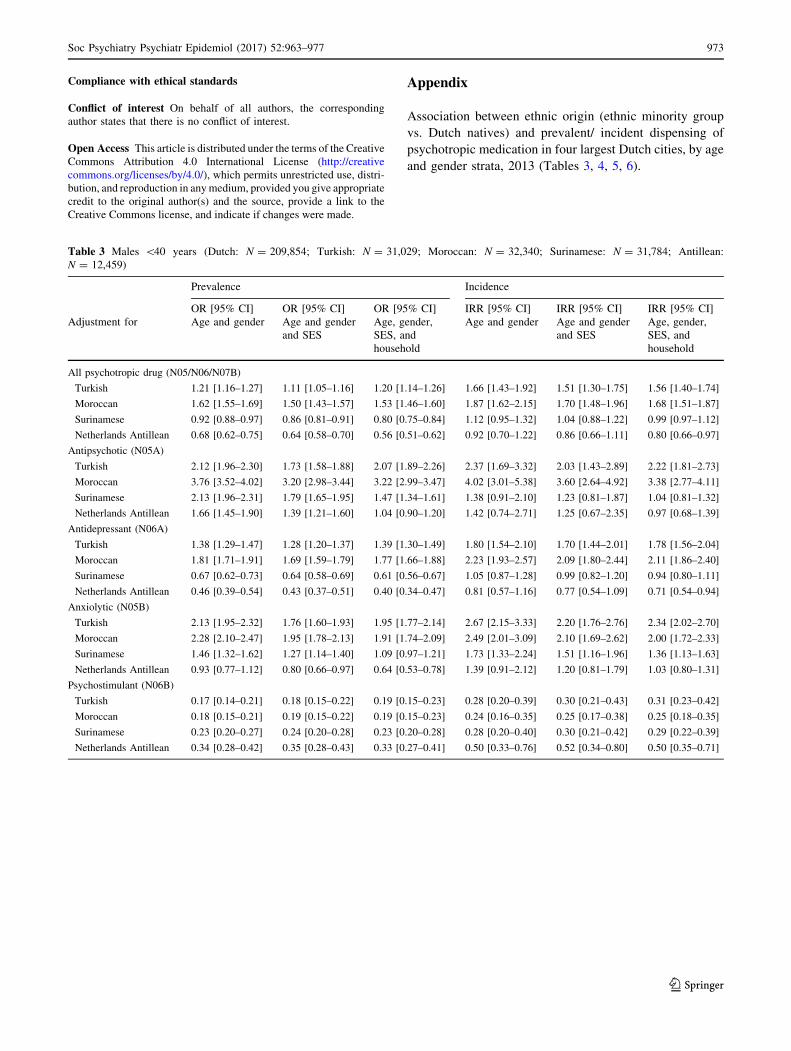
Appendix
Association between ethnic origin (ethnic minority group
vs. Dutch natives) and prevalent/ incident dispensing of
psychotropic medication in four largest Dutch cities, by age
and gender strata, 2013 (Tables 3, 4, 5, 6).
Table 3 Males \40 years (Dutch: N = 209,854; Turkish: N = 31,029; Moroccan: N = 32,340; Surinamese: N = 31,784; Antillean:
N = 12,459)
Prevalence Incidence
OR [95% CI] OR [95% CI] OR [95% CI] IRR [95% CI] IRR [95% CI] IRR [95% CI]
Adjustment for Age and gender Age and gender
and SES
Age, gender,
SES, and
household
Age and gender Age and gender
and SES
Age, gender,
SES, and
household
All psychotropic drug (N05/N06/N07B)
Turkish 1.21 [1.16–1.27] 1.11 [1.05–1.16] 1.20 [1.14–1.26] 1.66 [1.43–1.92] 1.51 [1.30–1.75] 1.56 [1.40–1.74]
Moroccan 1.62 [1.55–1.69] 1.50 [1.43–1.57] 1.53 [1.46–1.60] 1.87 [1.62–2.15] 1.70 [1.48–1.96] 1.68 [1.51–1.87]
Surinamese 0.92 [0.88–0.97] 0.86 [0.81–0.91] 0.80 [0.75–0.84] 1.12 [0.95–1.32] 1.04 [0.88–1.22] 0.99 [0.97–1.12]
Netherlands Antillean 0.68 [0.62–0.75] 0.64 [0.58–0.70] 0.56 [0.51–0.62] 0.92 [0.70–1.22] 0.86 [0.66–1.11] 0.80 [0.66–0.97]
Antipsychotic (N05A)
Turkish 2.12 [1.96–2.30] 1.73 [1.58–1.88] 2.07 [1.89–2.26] 2.37 [1.69–3.32] 2.03 [1.43–2.89] 2.22 [1.81–2.73]
Moroccan 3.76 [3.52–4.02] 3.20 [2.98–3.44] 3.22 [2.99–3.47] 4.02 [3.01–5.38] 3.60 [2.64–4.92] 3.38 [2.77–4.11]
Surinamese 2.13 [1.96–2.31] 1.79 [1.65–1.95] 1.47 [1.34–1.61] 1.38 [0.91–2.10] 1.23 [0.81–1.87] 1.04 [0.81–1.32]
Netherlands Antillean 1.66 [1.45–1.90] 1.39 [1.21–1.60] 1.04 [0.90–1.20] 1.42 [0.74–2.71] 1.25 [0.67–2.35] 0.97 [0.68–1.39]
Antidepressant (N06A)
Turkish 1.38 [1.29–1.47] 1.28 [1.20–1.37] 1.39 [1.30–1.49] 1.80 [1.54–2.10] 1.70 [1.44–2.01] 1.78 [1.56–2.04]
Moroccan 1.81 [1.71–1.91] 1.69 [1.59–1.79] 1.77 [1.66–1.88] 2.23 [1.93–2.57] 2.09 [1.80–2.44] 2.11 [1.86–2.40]
Surinamese 0.67 [0.62–0.73] 0.64 [0.58–0.69] 0.61 [0.56–0.67] 1.05 [0.87–1.28] 0.99 [0.82–1.20] 0.94 [0.80–1.11]
Netherlands Antillean 0.46 [0.39–0.54] 0.43 [0.37–0.51] 0.40 [0.34–0.47] 0.81 [0.57–1.16] 0.77 [0.54–1.09] 0.71 [0.54–0.94]
Anxiolytic (N05B)
Turkish 2.13 [1.95–2.32] 1.76 [1.60–1.93] 1.95 [1.77–2.14] 2.67 [2.15–3.33] 2.20 [1.76–2.76] 2.34 [2.02–2.70]
Moroccan 2.28 [2.10–2.47] 1.95 [1.78–2.13] 1.91 [1.74–2.09] 2.49 [2.01–3.09] 2.10 [1.69–2.62] 2.00 [1.72–2.33]
Surinamese 1.46 [1.32–1.62] 1.27 [1.14–1.40] 1.09 [0.97–1.21] 1.73 [1.33–2.24] 1.51 [1.16–1.96] 1.36 [1.13–1.63]
Netherlands Antillean 0.93 [0.77–1.12] 0.80 [0.66–0.97] 0.64 [0.53–0.78] 1.39 [0.91–2.12] 1.20 [0.81–1.79] 1.03 [0.80–1.31]
Psychostimulant (N06B)
Turkish 0.17 [0.14–0.21] 0.18 [0.15–0.22] 0.19 [0.15–0.23] 0.28 [0.20–0.39] 0.30 [0.21–0.43] 0.31 [0.23–0.42]
Moroccan 0.18 [0.15–0.21] 0.19 [0.15–0.22] 0.19 [0.15–0.23] 0.24 [0.16–0.35] 0.25 [0.17–0.38] 0.25 [0.18–0.35]
Surinamese 0.23 [0.20–0.27] 0.24 [0.20–0.28] 0.23 [0.20–0.28] 0.28 [0.20–0.40] 0.30 [0.21–0.42] 0.29 [0.22–0.39]
Netherlands Antillean 0.34 [0.28–0.42] 0.35 [0.28–0.43] 0.33 [0.27–0.41] 0.50 [0.33–0.76] 0.52 [0.34–0.80] 0.50 [0.35–0.71]
Soc Psychiatry Psychiatr Epidemiol (2017) 52:963–977 973
123

Table 4 Females \40 years (Dutch: N = 219,745; Turkish: N = 29,527; Moroccan: N = 34,063; Surinamese: N = 34,123; Antillean:
N = 12,886)
Prevalence Incidence
OR [95%–CI] OR [95%–CI] OR [95%–CI] IRR [95%–CI] IRR [95%–CI] IRR [95%–CI]
Adjustment for Age and gender Age and gender
and SES
Age, gender,
SES, and
household
Age and Gender Age and gender
and SES
Age, gender,
SES, and
household
All psychotropic drug (N05/N06/N07B)
Turkish 1.49 [1.43–1.55] 1.31 [1.25–1.36] 1.37 [1.31–1.43] 1.85 [1.61–2.12] 1.62 [1.41–1.86] 1.62 [1.47–1.78]
Moroccan 1.48 [1.42–1.53] 1.31 [1.26–1.36]] 1.37 [1.32–1.43] 1.87 [1.64–2.13] 1.66 [1.45–1.90] 1.66 [1.51–1.82]
Surinamese 0.89 [0.85–0.93] 0.81 [0.77–0.85] 0.72 [0.69–0.76] 1.30 [1.13–1.50] 1.17 [1.02–1.35] 1.04 [0.93–1.16]
Netherlands Antillean 0.73 [0.68–0.79] 0.66 [0.61–0.72] 0.57 [0.53–0.62] 1.25 [1.00–1.57] 1.12 [0.91–1.39] 0.95 [0.82–1.11]
Antipsychotic (N05A)
Turkish 1.95 [1.78–2.14] 1.54 [1.40–1.71] 1.81 [1.63–2.00] 2.07 [1.57–2.73] 1.69 [1.26–2.26] 1.83 [1.48–2.25]
Moroccan 2.32 [2.14–2.52] 1.85 [1.69–2.03] 2.15 [1.96–2.36] 2.15 [1.69–2.73] 1.80 [1.40–2.32] 1.95 [1.63–2.34]
Surinamese 1.43 [1.30–1.58] 1.20 [1.08–1.33] 1.09 [0.98–1.22] 1.31 [0.98–1.75] 1.13 [0.83–1.52] 0.99 [0.79–1.25]
Netherlands Antillean 1.15 [0.97–1.36] 0.93 [0.78–1.11] 0.78 [0.65–0.94] 1.54 [1.00–2.37] 1.29 [0.85–1.97] 1.08 [0.80–1.45]
Antidepressant (N06A)
Turkish 1.58 [1.51–1.66] 1.42 [1.35–1.49] 1.47 [1.40–1.55] 1.87 [1.62–2.15] 1.67 [1.44–1.93] 1.65 [1.48–1.85]
Moroccan 1.66 [1.59–1.74] 1.51 [1.44–1.58] 1.57 [1.50–1.65] 2.13 [1.88–2.43] 1.93 [1.68–2.21] 1.91 [1.73–2.12]
Surinamese 0.73 [0.69–0.78] 0.67 [0.63–0.71] 0.60 [0.56–0.64] 1.11 [0.95–1.29] 1.00 [0.86–1.16] 0.87 [0.77–0.99]
Netherlands Antillean 0.63 [0.57–0.69] 0.57 [0.52–0.64] 0.50 [0.45–0.56] 1.09 [0.86–1.40] 0.98 [0.78–1.24] 0.83 [0.70–0.98]
Anxiolytic (N05B)
Turkish 2.35 [2.19–2.53] 1.87 [1.73–2.03] 1.93 [1.78–2.10] 2.49 [2.11–2.95] 2.05 [1.74–2.42] 2.03 [1.80–2.29]
Moroccan 1.80 [1.67–1.94] 1.45 [1.33–1.57] 1.52 [1.39–1.65] 1.91 [1.60–2.28] 1.59 [1.33–1.89] 1.59 [1.39–1.83]
Surinamese 1.50 [1.38–1.63] 1.26 [1.15–1.37] 1.08 [0.99–1.19] 1.71 [1.43–2.04] 1.47 [1.24–1.75] 1.29 [1.12–1.50]
Netherlands Antillean 1.01 [0.87–1.18] 0.84 [0.72–0.98] 0.67 [0.57–0.79] 1.23 [0.89–1.71] 1.06 [0.79–1.44] 0.88 [0.70–1.12]
Psychostimulant (N06B)
Turkish 0.21 [0.17–0.26] 0.21 [0.17–0.26] 0.22 [0.18–0.28] 0.31 [0.21–0.46] 0.30 [0.20–0.45] 0.31 [0.22–0.42]
Moroccan 0.24 [0.20–0.29] 0,24 [0.20–0.29] 0.26 [0.21–0.31] 0.38 [0.26–0.54] 0.37 [0.26–0.54] 0.38 [0.28–0.52]
Surinamese 0.26 [0.22–0.31] 0.26 [0.22–0.31] 0.24 [0.20–0.29] 0.34 [0.24–0.50] 0.34 [0.23–0.51] 0.29 [0.21–0.40]
Netherlands Antillean 0.35 [0.27–0.45] 0.35 [0.27–0.45] 0.31 [0.24–0.40] 0.49 [0.29–0.82] 0.49 [0.29–0.82] 0.41 [0.26–0.63]
974 Soc Psychiatry Psychiatr Epidemiol (2017) 52:963–977
123
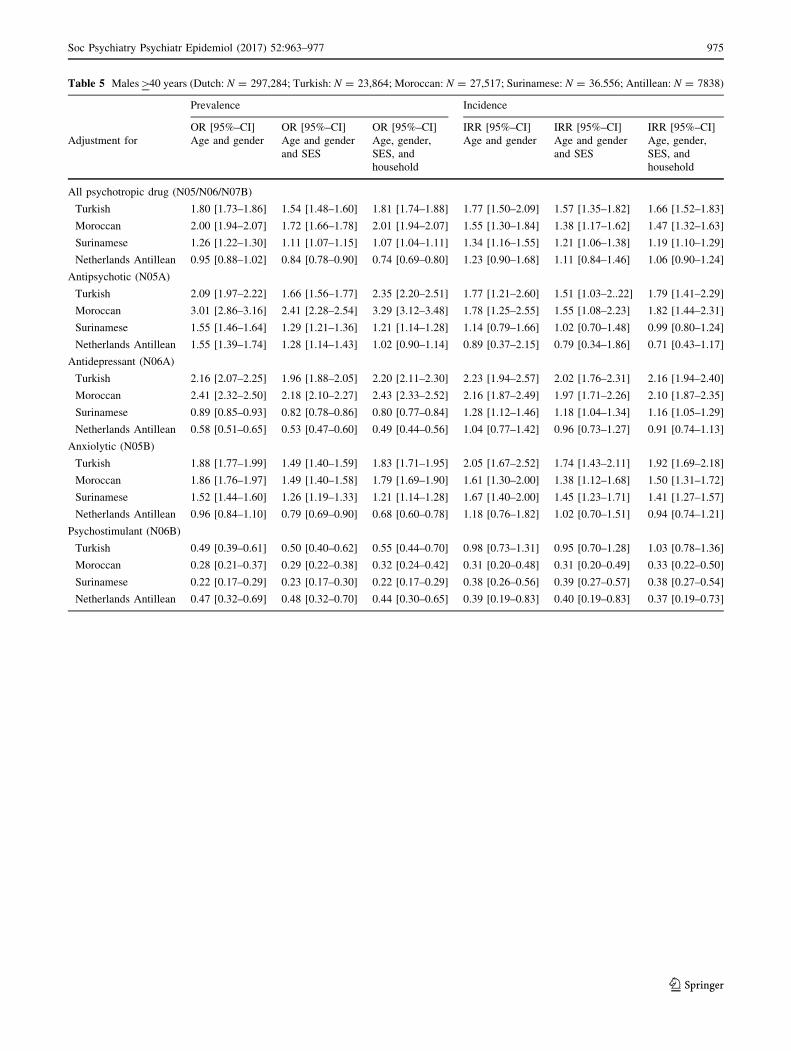
Table 5 Males[40 years (Dutch: N = 297,284; Turkish: N = 23,864; Moroccan: N = 27,517; Surinamese: N = 36.556; Antillean: N = 7838)
Prevalence Incidence
OR [95%–CI] OR [95%–CI] OR [95%–CI] IRR [95%–CI] IRR [95%–CI] IRR [95%–CI]
Adjustment for Age and gender Age and gender
and SES
Age, gender,
SES, and
household
Age and gender Age and gender
and SES
Age, gender,
SES, and
household
All psychotropic drug (N05/N06/N07B)
Turkish 1.80 [1.73–1.86] 1.54 [1.48–1.60] 1.81 [1.74–1.88] 1.77 [1.50–2.09] 1.57 [1.35–1.82] 1.66 [1.52–1.83]
Moroccan 2.00 [1.94–2.07] 1.72 [1.66–1.78] 2.01 [1.94–2.07] 1.55 [1.30–1.84] 1.38 [1.17–1.62] 1.47 [1.32–1.63]
Surinamese 1.26 [1.22–1.30] 1.11 [1.07–1.15] 1.07 [1.04–1.11] 1.34 [1.16–1.55] 1.21 [1.06–1.38] 1.19 [1.10–1.29]
Netherlands Antillean 0.95 [0.88–1.02] 0.84 [0.78–0.90] 0.74 [0.69–0.80] 1.23 [0.90–1.68] 1.11 [0.84–1.46] 1.06 [0.90–1.24]
Antipsychotic (N05A)
Turkish 2.09 [1.97–2.22] 1.66 [1.56–1.77] 2.35 [2.20–2.51] 1.77 [1.21–2.60] 1.51 [1.03–2..22] 1.79 [1.41–2.29]
Moroccan 3.01 [2.86–3.16] 2.41 [2.28–2.54] 3.29 [3.12–3.48] 1.78 [1.25–2.55] 1.55 [1.08–2.23] 1.82 [1.44–2.31]
Surinamese 1.55 [1.46–1.64] 1.29 [1.21–1.36] 1.21 [1.14–1.28] 1.14 [0.79–1.66] 1.02 [0.70–1.48] 0.99 [0.80–1.24]
Netherlands Antillean 1.55 [1.39–1.74] 1.28 [1.14–1.43] 1.02 [0.90–1.14] 0.89 [0.37–2.15] 0.79 [0.34–1.86] 0.71 [0.43–1.17]
Antidepressant (N06A)
Turkish 2.16 [2.07–2.25] 1.96 [1.88–2.05] 2.20 [2.11–2.30] 2.23 [1.94–2.57] 2.02 [1.76–2.31] 2.16 [1.94–2.40]
Moroccan 2.41 [2.32–2.50] 2.18 [2.10–2.27] 2.43 [2.33–2.52] 2.16 [1.87–2.49] 1.97 [1.71–2.26] 2.10 [1.87–2.35]
Surinamese 0.89 [0.85–0.93] 0.82 [0.78–0.86] 0.80 [0.77–0.84] 1.28 [1.12–1.46] 1.18 [1.04–1.34] 1.16 [1.05–1.29]
Netherlands Antillean 0.58 [0.51–0.65] 0.53 [0.47–0.60] 0.49 [0.44–0.56] 1.04 [0.77–1.42] 0.96 [0.73–1.27] 0.91 [0.74–1.13]
Anxiolytic (N05B)
Turkish 1.88 [1.77–1.99] 1.49 [1.40–1.59] 1.83 [1.71–1.95] 2.05 [1.67–2.52] 1.74 [1.43–2.11] 1.92 [1.69–2.18]
Moroccan 1.86 [1.76–1.97] 1.49 [1.40–1.58] 1.79 [1.69–1.90] 1.61 [1.30–2.00] 1.38 [1.12–1.68] 1.50 [1.31–1.72]
Surinamese 1.52 [1.44–1.60] 1.26 [1.19–1.33] 1.21 [1.14–1.28] 1.67 [1.40–2.00] 1.45 [1.23–1.71] 1.41 [1.27–1.57]
Netherlands Antillean 0.96 [0.84–1.10] 0.79 [0.69–0.90] 0.68 [0.60–0.78] 1.18 [0.76–1.82] 1.02 [0.70–1.51] 0.94 [0.74–1.21]
Psychostimulant (N06B)
Turkish 0.49 [0.39–0.61] 0.50 [0.40–0.62] 0.55 [0.44–0.70] 0.98 [0.73–1.31] 0.95 [0.70–1.28] 1.03 [0.78–1.36]
Moroccan 0.28 [0.21–0.37] 0.29 [0.22–0.38] 0.32 [0.24–0.42] 0.31 [0.20–0.48] 0.31 [0.20–0.49] 0.33 [0.22–0.50]
Surinamese 0.22 [0.17–0.29] 0.23 [0.17–0.30] 0.22 [0.17–0.29] 0.38 [0.26–0.56] 0.39 [0.27–0.57] 0.38 [0.27–0.54]
Netherlands Antillean 0.47 [0.32–0.69] 0.48 [0.32–0.70] 0.44 [0.30–0.65] 0.39 [0.19–0.83] 0.40 [0.19–0.83] 0.37 [0.19–0.73]
Soc Psychiatry Psychiatr Epidemiol (2017) 52:963–977 975
123
References
1. DeVylder JE, Oh HY, Yang LH, Cabassa LJ, Chen F, Lukens EP
(2013) Acculturative stress and psychotic-like experiences among
Asian and Latino immigrants to the United States. Schizophr Res
150:223–228
2. de Graaf R, ten Have M, van Dorsselaer S, Schoemaker C,
Beekman A, Vollebergh W (2005) Verschillen tussen etnische
groepen in psychiatrische morbiditeit. Maandblad Geestelijke
Volksgezondheid 60:703–716
3. Abebe DS, Lien L, Elstad JI (2017) Immigrants’ utilization of
specialist mental health care according to age, country of origin,
and migration history: a nation-wide register study in Norway.
Soc Psychiatry Psychiatr Epidemiol April 4 (in press)4. Cruz I, Serna C, Real J, Rue M, Soler J, Galvan L (2010)
Comparison of the consumption of antidepressants in the immi-
grant and native populations in a Spanish health region: an
observational study. BMC Public Health 10:255
5. Cruz I, Serna C, Rue M, Real J, Galvan L, Pifarre J (2012)
Comparative exposure to antipsychotic medications in immigrant
and native-born populations of a Spanish health region. Eur
Psychiatry 27:477–482
6. Singh SP, Brown L, Winsper C, Gajwani R, Islam Z, Jasani R,
Parsons H, Rabbie-Khan F, Birchwood M (2015) Ethnicity and
pathways to care during first episode psychosis: the role of
cultural illness attributions. BMC Psychiatry 15:287
7. Moullan Y, Jusot F (2014) Why is the ‘healthy immigrant effect’
different between different European countries? Eur J Public
Health 24(Suppl. 1):80–86
8. Vang ZM, Sigouin J, Flenon A (2017) Gagnon A (2017) Are
immigrants healthier than native-born Canadians? A systematic
review of the healthy immigrant effect in Canada. Ethn Health
22:209–241
9. Cantor-Graae E, Selten JP (2005) Schizophrenia and migration: a
meta-analysis and review. Am J Psychiatry 162:12–24
10. Durbin A, Moineddin R, Lin E, Steele LS, Glazier RH (2015)
Mental health service use by recent immigrants from different
Table 6 Females [40 years (Dutch: N = 316,849; Turkish: N = 21,040; Moroccan: N = 21,535; Surinamese: N = 44,660; Antillean:
N = 8247)
Prevalence Incidence
OR [95%–CI] OR [95%–CI] OR [95%–CI] IRR [95%–CI] IRR [95%–CI] IRR [95%–CI]
Adjustment for Age and gender Age and gender
and SES
Age, gender,
SES, and
household
Age and gender Age and gender
and SES
Age, gender,
SES, and
household
All psychotropic drug (N05/N06/N07B)
Turkish 1.73 [1.68–1.79] 1.50 [1.45–1.55] 1.65 [1.60–1.71] 1.89 [1.57–2.27] 1.64 [1.39–1.95] 1.75 [1.57–1.97]
Moroccan 1.16 [1.12–1.20] 1.01 [0.97–1.05] 1.12 [1.08–1.16] 1.45 [1.20–1.75] 1.27 [1.07–1.51] 1.36 [1.22–1.51]
Surinamese 0.95 [0.93–0.98] 0.84 [0.82–0.86] 0.82 [0.80–0.84] 1.27 [1.11–1.46] 1.13 [1.00–1.28] 1.10 [1.02–1.19]
Netherlands Antillean 0.72 [0.67–0.77] 0.64 [0.60–0.68] 0.61 [0.57–0.65] 1.19 [0.88–1.61] 1.07 [0.83–1.39] 1.01 [0.86–1.19]
Antipsychotic (N05A)
Turkish 1.90 [1.78–2.03] 1.58 [1.48–1.69] 2.13 [1.98–2.29] 1.97 [1.27–3.06] 1.78 [1.12–2.82] 2.28 [1.85–2.82]
Moroccan 1.43 [1.33–1.54] 1.21 [1.12–1.30] 1.66 [1.53–1.79] 1.19 [0.69–2.03] 1.08 [0.62–1.88] 1.41 [1.13–1.76]
Surinamese 1.18 [1.11–1.25] 1.02 [0.96–1.08] 1.04 [0.98–1.11] 0.99 [0.67–1.46] 0.91 [0.61–1.36] 0.92 [0.78–1.07]
Netherlands Antillean 1.12 [0.99–1.27] 0.97 [0.85–1.10] 0.96 [0.84–1.10] 0.87 [0.34–2.20] 0.80 [0.31–2.04] 0.79 [0.56–1.11]
Antidepressant (N06A)
Turkish 1.95 [1.88–2.02] 1.79 [1.72–1.86] 1.90 [1.83–1.98] 2.37 [2.08–2.70] 2.18 [1.92–2.47] 2.25 [2.00–2.52]
Moroccan 1.33 [1.28–1.39] 1.23 [1.18–1.28] 1.31 [1.26–1.36] 1.88 [1.65–2.14] 1.75 [1.54–1.99] 1.80 [1.61–2.02]
Surinamese 0.75 [0.72–0.78] 0.69 [0.67–0.72] 0.68 [0.65–0.70] 1.27 [1.14–1.41] 1.18 [1.07–1.30] 1.13 [1.04–1.24]
Netherlands Antillean 0.60 [0.56–0.66] 0.56 [0.52–0.61] 0.54 [0.50–0.59] 1.27 [1.02–1.59] 1.20 [0.98–1.47] 1.14 [0.94–1.37]
Anxiolytic (N05B)
Turkish 1.75 [1.66–1.85] 1.37 [1.29–1.45] 1.54 [1.46–1.63] 2.36 [1.94–2.86] 1.91 [1.62–2.25] 2.02 [1.76–2.32]
Moroccan 1.06 [0.99–1.13] 0.84 [0.79–0.90] 0.95 [0.89–1.01] 1.41 [1.14–1.75] 1.16 [0.98–1.38] 1.23 [1.07–1.41]
Surinamese 1.33 [1.28–1.39] 1.09 [1.04–1.14] 1.06 [1.02–1.11] 1.45 [1.24–1.69] 1.23 [1.08–1.40] 1.20 [1.08–1.34]
Netherlands Antillean 0.83 [0.74–0.93] 0.69 [0.61–0.77] 0.65 [0.58–0.72] 1.17 [0.82–1.67] 1.00 [0.75–1.34] 0.94 [0.75–1.19]
Psychostimulant (N06B)
Turkish 0.55 [0.43–0.72] 0.57 [0.44–0.75] 0.60 [0.46–0.79] 0.79 [0.51–1.23] 0.80 [0.52–1.24] 0.84 [0.59–1.19]
Moroccan 0.20 [0.13–0.30] 0.20 [0.13–0.31] 0.22 [0.14–0.33] 0.27 [0.14–0.52] 0.28 [0.15–0.54] 0.30 [0.18–0.49]
Surinamese 0.25 [0.19–0.32] 0.26 [0.20–0.34] 0.23 [0.17–0.30] 0.30 [0.19–0.48] 0.31 [0.20–0.49] 0.28 [0.19–0.40]
Netherlands Antillean 0.58 [0.39–0.87] 0.60 [0.40–0.91] 0.50 [0.33–0.76] 0.93 [0.52–1.65] 0.98 [0.56–1.70] 0.82 [0.54–1.24]
976 Soc Psychiatry Psychiatr Epidemiol (2017) 52:963–977
123
world regions and by non-immigrants in Ontario, Canada: a
cross-sectional study. BMC Health Serv Res 15:336
11. Kim IH, Carrasco C, Muntaner C, McKenzie K, Noh S (2013)
Ethnicity and postmigration health trajectory in new immigrants
to Canada. Am J Public Health 103:e96–e104
12. Oh H, Abe J, Negi N, DeVylder J (2015) Immigration and psy-
chotic experiences in the United States: Another example of the
epidemiological paradox? Psychiatry Res 229:784–790
13. Gimeno-Feliu LA, Calderon-Larranaga A, Prados-Torres A,
Revilla-Lopez C, Diaz E (2016) Patterns of pharmaceutical use
for immigrants to Spain and Norway: a comparative study of
prescription databases in two European countries. Int J Equity
Health 15:32
14. Selten JP, Slaets JP, Kahn RS (1997) Schizophrenia in Suri-
namese and Dutch Antillean immigrants to The Netherlands:
evidence of an increased incidence. Psychol Med 27:807–811
15. Selten JP, Veen N, Feller W, Blom JD, Schols D, Camoenie W,
Oolders J, van der Velden M, Hoek HW, Vladar Rivero VM, van
der Graaf Y, Kahn R (2001) Incidence of psychotic disorders in
immigrant groups to The Netherlands. Br J Psychiatry
178:367–372
16. Veling W, Selten JP, Veen N, Laan W, Blom JD, Hoek HW
(2006) Incidence of schizophrenia among ethnic minorities in the
Netherlands: a four-year first-contact study. Schizophr Res
86:189–193
17. van der Wurff FB, Beekman AT, Dijkshoorn H, Spijker JA, Smits
CH, Stek ML, Verhoeff A (2004) Prevalence and risk-factors for
depression in elderly Turkish and Moroccan migrants in the
Netherlands. J Affect Disord 83:33–41
18. Selten JP, Laan W, Kupka R, Smeets HM, van OJ (2012) Risk of
psychiatric treatment for mood disorders and psychotic disorders
among migrants and Dutch nationals in Utrecht, The Netherlands.
Soc Psychiatry Psychiatr Epidemiol 47:271–278
19. Schrier AC, de Wit MA, Rijmen F, Tuinebreijer WC, Verhoeff
AP, Kupka RW, Dekker J, Beekman AT (2010) Similarity in
depressive symptom profile in a population-based study of
migrants in the Netherlands. Soc Psychiatry Psychiatr Epidemiol
45:941–951
20. de Wit MA, Tuinebreijer WC, Dekker J, Beekman AJ, Gorissen
WH, Schrier AC, Penninx BW, Komproe IH, Verhoeff AP (2008)
Depressive and anxiety disorders in different ethnic groups: a
population based study among native Dutch, and Turkish,
Moroccan and Surinamese migrants in Amsterdam. Soc Psychi-
atry Psychiatr Epidemiol 43:905–912
21. Wittkampf LC, Smeets HM, Knol MJ, Geerlings MI, Braam AW,
de Wit NJ (2010) Differences in psychotropic drug prescriptions
among ethnic groups in the Netherlands. Soc Psychiatry Psychiatr
Epidemiol 45:819–826
22. van den Ban EF, Souverein PC, van EH, Swaab H, Egberts TC,
Heerdink ER (2015) Differences in ADHD medication usage
patterns in children and adolescents from different cultural
backgrounds in the Netherlands. Soc Psychiatry Psychiatr Epi-
demiol 50:1153–1162
23. Hooghiemstra TFM (2002) Privacy bij wetenschappelijk onder-
zoek en statistiek Kader voor een gedragscode. College
Bescherming Persoonsgegevens, Den Haag
24. Landman N (1992) The Islamic Institutions in the Netherlands.
Free University Press, Amsterdam
25. Selten JP, Sijben N (1994) First admission rates for schizophrenia
in immigrants to The Netherlands. The Dutch National Register.
Soc Psychiatry Psychiatr Epidemiol 29:71–77
26. van der Ven E, Veling W, Tortelli A, Tarricone I, Berardi D,
Bourque F, Selten JP (2016) Evidence of an excessive gender gap
in the risk of psychotic disorder among North African immigrants
in Europe: a systematic review and meta-analysis. Soc Psychiatry
Psychiatr Epidemiol 51:1603–1613
27. Termorshuizen F, Smeets HM, Braam AW, Veling W (2014)
Neighborhood ethnic density and psychotic disorders among
ethnic minority groups in Utrecht City. Soc Psychiatry Psychiatr
Epidemiol 49:1093–1102
28. Selten JP, Laan W, Kupka R, Smeets HM, van OJ (2015) Erratum
to: Risk of psychiatric treatment for mood disorders and psy-
chotic disorders among migrants and Dutch nationals in Utrecht,
The Netherlands. Soc Psychiatry Psychiatr Epidemiol
50:167–169
29. Olfson M, King M, Schoenbaum M (2015) Antipsychotic treat-
ment of adults in the United States. J Clin Psychiatry
76:1346–1353
30. Levecque K, Lodewyckx I, Vranken J (2007) Depression and
generalised anxiety in the general population in Belgium: a
comparison between native and immigrant groups. J Affect
Disord 97:229–239
31. van Geffen EC, Gardarsdottir H, van Hulten R, van Dijk L,
Egberts AC, Heerdink ER (2009) Initiation of antidepressant
therapy: do patients follow the GP’s prescription? Br J Gen Pract
59:81–87
32. van Dijk L, Heerdink ER, Somai D, van Dulmen S, Sluijs EM, de
Ridder DT, Griens AM, Bensing JM (2007) Patient risk profiles
and practice variation in nonadherence to antidepressants, anti-
hypertensives and oral hypoglycemics. BMC Health Serv Res
7:51
33. Morgan C, Kirkbride J, Leff J, Craig T, Hutchinson G, McKenzie
K, Morgan K, Dazzan P, Doody GA, Jones P, Murray R, Fearon
P (2007) Parental separation, loss and psychosis in different
ethnic groups: a case-control study. Psychol Med 37:495–503
34. Stevens J, Harman JS, Kelleher KJ (2005) Race/ethnicity and
insurance status as factors associated with ADHD treatment
patterns. J Child Adolesc Psychopharmacol 15:88–96
35. Bruckner TA, Hodgson A, Mahoney CB, Fulton BD, Levine P,
Scheffler RM (2012) Health care supply and county-level varia-
tion in attention-deficit hyperactivity disorder prescription med-
ications. Pharmacoepidemiol Drug Saf 21:442–449
36. Zwirs BW, Burger H, Buitelaar JK, Schulpen TW (2006) Ethnic
differences in parental detection of externalizing disorders. Eur
Child Adolesc Psychiatry 15:418–426
37. Zwirs BW, Burger H, Schulpen TW, Buitelaar JK (2006) Dif-
ferent treatment thresholds in non-Western children with behav-
ioral problems. J Am Acad Child Adolesc Psychiatry 45:476–483
38. Kirkbride JB, Barker D, Cowden F, Stamps R, Yang M, Jones
PB, Coid JW (2008) Psychoses, ethnicity and socio-economic
status. Br J Psychiatry 193:18–24
39. Shaw RJ, Atkin K, Becares L, Albor CB, Stafford M, Kiernan
KE, Nazroo JY, Wilkinson RG, Pickett KE (2012) Impact of
ethnic density on adult mental disorders: narrative review. Br J
Psychiatry 201:11–19
Soc Psychiatry Psychiatr Epidemiol (2017) 52:963–977 977
123