Disparities in chronic conditions and health status by type of disability
7
Research Paper Disparities in chronic conditions and health status by type of disability Willi Horner-Johnson, Ph.D. a, * , Konrad Dobbertin, M.P.H. a , Jae Chul Lee, Ph.D. b , Elena M. Andresen, Ph.D. a , and the Expert Panel on Disability and Health Disparities 1 a Institute on Development & Disability, Oregon Health & Science University, 707 SW Gaines Street, Portland, OR 97239, USA b Rehabilitation Medicine Department, Clinical Research Center, National Institutes of Health, USA Abstract Background: Prior research has established health disparities between people with and without disabilities. However, disparities within the disability population, such as those related to type of disability, have been much less studied. Objective: To examine differences in chronic conditions and health status between subgroups of people with different types of disability. Methods: We analyzed Medical Expenditure Panel Survey annual data files from 2002 to 2008. Logistic regression analyses considered disparity from three perspectives: 1) basic differences, unadjusted for other factors; 2) controlling for key demographic and health cova- riates; and 3) controlling for a larger set of demographic variables and socioeconomic status as well as health and access to healthcare. Results: Individuals with vision, physical, cognitive, or multiple disability types fared worse than people with hearing impairment on most health outcomes. This was most consistently true for people with multiple disabilities. Even when all covariates were accounted for, people with multiple types of disability were significantly more likely ( p ! 0.05) than those with hearing impairment (reference group) to report every poor health outcome with the exception of BMI > 25 and lung disease. Conclusions: While many of the differences between disability types were reduced when controlling for other factors, some differences remained significant. This argues for a more individualized approach to understanding and preventing chronic conditions and poor health in specific disability groups. Ó 2013 Elsevier Inc. All rights reserved. Keywords: People with disabilities; Health status disparities; Chronic conditions; Adult; Population surveillance Public health research has a long history of illumi- nating health disparities impacting various population groups. Much of the research has focused on race, ethnicity, or socioeconomic status, but studies have also examined disparities related to characteristics such as gender, sexual orientation, and rural residence. 1e3 There is gathering momentum within the disability and health field to build broader recognition of people with disabilities as another population experiencing health disparities. Although recent conceptualizations of disa- bility and health 4 recognize that people with disabilities can enjoy good health, research indicates that they are more likely to experience poor health than people without disabilities. For example, obesity, oral disease, diabetes, depression, and anxiety are highly prevalent among people with disabilities. 5e8 People with disabilities are also much more likely than those without disabilities to rate their health as fair or poor. 9,10 In fact, some public health agencies already report on health and healthcare dispar- ities between people with and without disabilities, con- firming overall disparity. 11 As the population of people with disabilities continues to grow 12 and gain attention as a public health priority group, there is an increasing need for research on the specific aspects of health disparities within this population. The general disparity patterns described above are apparent despite the broad range of variation within the disability population. However, health may differ considerably among people with disabilities in relation to other factors This work was supported by grant # H133A080031 from the National Institute on Disability and Rehabilitation Research/DOE. However, the contents do not necessarily represent the policy of the Department of Education, and you should not assume endorsement by the Federal Government. A portion of the findings reported here were presented at the 140 th annual meeting of the American Public Health Association, Oct. 27e31, 2012, San Francisco, CA. * Corresponding author. Tel.: þ1 503 494 9273. E-mail address: [email protected] (W. Horner-Johnson). 1 The members of the Expert Panel are Charles E. Drum, J.D., Ph.D.; Glenn T. Fujiura, Ph.D.; Lisa I. Iezzoni, M.D., M.Sc.; Gloria L. Krahn, Ph.D., M.P.H.; and Jana J. Peterson-Besse, M.P.H., Ph.D. 1936-6574/$ - see front matter Ó 2013 Elsevier Inc. All rights reserved. http://dx.doi.org/10.1016/j.dhjo.2013.04.006 Disability and Health Journal 6 (2013) 280e286 www.disabilityandhealthjnl.com
Transcript of Disparities in chronic conditions and health status by type of disability

Disability and Health Journal 6 (2013) 280e286
Research Paper
Disparities in chronic conditions and health status by type of disability
Willi Horner-Johnson, Ph.D.a,*, Konrad Dobbertin, M.P.H.a, Jae Chul Lee, Ph.D.b,Elena M. Andresen, Ph.D.a, and
the Expert Panel on Disability and Health Disparities1aInstitute on Development & Disability, Oregon Health & Science University, 707 SW Gaines Street, Portland, OR 97239, USA
bRehabilitation Medicine Department, Clinical Research Center, National Institutes of Health, USA
www.disabilityandhealthjnl.com
Abstract
Background: Prior research has established health disparities between people with and without disabilities. However, disparities withinthe disability population, such as those related to type of disability, have been much less studied.
Objective: To examine differences in chronic conditions and health status between subgroups of people with different types ofdisability.
Methods: We analyzed Medical Expenditure Panel Survey annual data files from 2002 to 2008. Logistic regression analyses considereddisparity from three perspectives: 1) basic differences, unadjusted for other factors; 2) controlling for key demographic and health cova-riates; and 3) controlling for a larger set of demographic variables and socioeconomic status as well as health and access to healthcare.
Results: Individuals with vision, physical, cognitive, or multiple disability types fared worse than people with hearing impairment onmost health outcomes. This was most consistently true for people with multiple disabilities. Even when all covariates were accounted for,people with multiple types of disability were significantly more likely ( p ! 0.05) than those with hearing impairment (reference group) toreport every poor health outcome with the exception of BMI > 25 and lung disease.
Conclusions: While many of the differences between disability types were reduced when controlling for other factors, some differencesremained significant. This argues for a more individualized approach to understanding and preventing chronic conditions and poor health inspecific disability groups. � 2013 Elsevier Inc. All rights reserved.
Keywords: People with disabilities; Health status disparities; Chronic conditions; Adult; Population surveillance
Public health research has a long history of illumi-nating health disparities impacting various populationgroups. Much of the research has focused on race,ethnicity, or socioeconomic status, but studies havealso examined disparities related to characteristics suchas gender, sexual orientation, and rural residence.1e3
There is gathering momentum within the disability andhealth field to build broader recognition of people with
This work was supported by grant # H133A080031 from the National
Institute on Disability and Rehabilitation Research/DOE. However, the
contents do not necessarily represent the policy of the Department of
Education, and you should not assume endorsement by the Federal
Government.
A portion of the findings reported here were presented at the 140th
annual meeting of the American Public Health Association, Oct. 27e31,
2012, San Francisco, CA.
* Corresponding author. Tel.: þ1 503 494 9273.
E-mail address: [email protected] (W. Horner-Johnson).1 The members of the Expert Panel are Charles E. Drum, J.D., Ph.D.;
Glenn T. Fujiura, Ph.D.; Lisa I. Iezzoni, M.D., M.Sc.; Gloria L. Krahn,
Ph.D., M.P.H.; and Jana J. Peterson-Besse, M.P.H., Ph.D.
1936-6574/$ - see front matter � 2013 Elsevier Inc. All rights reserved.
http://dx.doi.org/10.1016/j.dhjo.2013.04.006
disabilities as another population experiencing healthdisparities. Although recent conceptualizations of disa-bility and health4 recognize that people with disabilitiescan enjoy good health, research indicates that they aremore likely to experience poor health than people withoutdisabilities. For example, obesity, oral disease, diabetes,depression, and anxiety are highly prevalent among peoplewith disabilities.5e8 People with disabilities are also muchmore likely than those without disabilities to rate theirhealth as fair or poor.9,10 In fact, some public healthagencies already report on health and healthcare dispar-ities between people with and without disabilities, con-firming overall disparity.11
As the population of people with disabilities continues togrow12 and gain attention as a public health priority group,there is an increasing need for research on the specificaspects of health disparities within this population. Thegeneral disparity patterns described above are apparentdespite the broad range of variation within the disabilitypopulation. However, health may differ considerablyamong people with disabilities in relation to other factors

281W. Horner-Johnson et al. / Disability and Health Journal 6 (2013) 280e286
such as age, race, or type of disability. Yet, there is limitedresearch examining health differences between subgroupsof people with disabilities. A recent literature review found17 studies of health outcomes (e.g., cardiovascular disease,injury) reporting results by disability type. Of these, onlyfive used population-based data, and just one of that subsetcompared multiple different categories of functionaldisability.13 More research is clearly warranted in order toidentify disability groups most in need of health interven-tions and inform the types of interventions to apply.
The present study was designed to help build theevidence base regarding health disparities within the popu-lation of people with disabilities. The purpose was to: 1)provide population-level estimates on the prevalence ofvarious chronic conditions and perceived fair or poormental and physical health among adults with differenttypes of disabilities, and 2) examine the impact of control-ling for demographic, health, and socioeconomic covariateswhen analyzing the association between disability type andhealth outcome variables. The study was guided by theExpert Panel on Disability and Health Disparities, a nationaladvisory group convened specifically for this project. TheExpert Panel provided extensive experience in disability,epidemiology, medicine, and public health.
Methods
Data source
We combined 2002e2008 full-year consolidated filesfrom the Medical Expenditure Panel Survey (MEPS)Household Component (HC) to create our data set. TheAgency for Healthcare Research and Quality (AHRQ)conducts the MEPS to collect data concerning demo-graphics, healthcare utilization, quality of care, healthcareexpenditures, sources of payment, and health insurance.Each year a new panel of sample households is selectedfor the HC from the previous year’s National Health Inter-view Survey (NHIS) sample using an overlapping paneldesign.14,15 For each panel, information is gathered throughfive in-person interviews providing data over a 2 yearperiod. The MEPS uses multistage stratified sampling toprovide a nationally representative sample of the U.S.civilian non-institutionalized population. The MEPS over-samples Hispanics, African Americans, Asians, and low-income persons to increase the precision of estimates forthese groups. AHRQ creates full-year consolidated filesthat include data from two consecutive panels, weightedto provide annualized U.S. population estimates. Responserates for the years we analyzed ranged from 56.9% (2007)to 64.7% (2002).16
Sample
Our analyses focused specifically on working-age(18e64 years) adults with disabilities. We decided to limitour analyses to this age group because health and
healthcare access issues change substantially for adultsage 65 and older, most of whom are on Medicare. Wedefined disability based on categories of basic actions diffi-culty described by Altman & Bernstein.17 These categoriesincluded limitations in physical functions (e.g., walking,lifting), cognition (e.g., memory, decision-making), vision,or hearing. These groupings mirror broad functional cate-gories described in the International Classification of Func-tioning, Disability and Health (ICF).4 The MEPS interviewhas a series of items assessing level of difficulty with eachof the above functions; we included people with any re-ported degree of difficulty other than ‘‘none’’.
Measures
Dependent variablesThe Expert Panel selected key chronic health conditions
addressed in Healthy People 2020.18 These includedwhether individuals had ever been diagnosed with arthritis,cardiovascular disease, diabetes, stroke, or lung disease(yes or no to each). We also examined body mass index(BMI: 18.5 to !25 versus >25) and perceived physicalhealth and perceived mental health (excellent/very good/good versus fair/poor). Dependent variables were basedon interviewee responses to questions about each diagnosisas well as perceived health. BMI was based on interviewee-reported height and weight.
Primary independent variableThe multiple items used to identify difficulties in basic
actions (see Sample section above) were recoded intoa single variable reflecting type of disability. The categorieswere: 1) hearing impairment only; 2) vision impairmentonly; 3) limitation in physical function only; 4) cognitivelimitation only; 5) more than one type of impairment orlimitation.
CovariatesWe used an iterative regression model building process,
with core covariates included in partially adjusted modelsand a more extensive set of covariates added in expandedmodels. We defined covariates as those that were associatedwith health outcomes and disability type, but not variablesthat were proxies for either exposure or outcome to avoidover-adjusting our models. A test of collinearity amongmodel covariates revealed that all correlations werer ! 0.5.
Core covariates in the partially adjusted models includedrace/ethnicity (non-Hispanic White, non-Hispanic Black,non-Hispanic American/Indian/Alaskan Native, non-Hispanic Asian/Native Hawaiian/Pacific Islander, non-Hispanic multiple races, or Hispanic), gender, and age(18e29, 30e39, 40e49, 50e59, 60e64). These variableswere included given their known association with healthdisparities in the general population.19,20 Health outcomevariables served as additional covariates when modeling
282 W. Horner-Johnson et al. / Disability and Health Journal 6 (2013) 280e286
other health outcomes, to help us disentangle disparitiesspecifically attributable to disability type. For example,when perceived physical health status was the dependentvariable, perceived mental health status and chronic condi-tions were covariates. We also controlled for body massindex (18.5 to!25, 25 to!30, 30 to!40, and 40 or high-er) as a health covariate. To control for variations in limita-tions within disability type, the Expert Panel recommendedadjusting for presence of complex activity limitation (yes orno). Complex activity limitations are defined as restrictionsin the ability to fully participate in activities such as work,housework, and self-care tasks. We identified such limita-tions using responses to questions about need for assistancewith activities of daily living, and limitations in work,housework, social, or recreational activities.17
In addition to the covariates above, expanded modelscontrolled for marital status (married; widowed, divorcedor separated; or never married), region of the U.S. (North-east, Midwest, South, or West), residence in a metropolitanstatistical area (MSA: yes or no), language spoken most inthe home (English or other), education (bachelor’s,master’s, or doctorate; other degree; General EducationalDevelopment (GED)/high school diploma; or no degree),family income as percent of Federal Poverty Line(>400%, 200 to !400%, 125 to !200%, 100 to!125%, !100%), and employment status (employed ornot employed). We also included two healthcare accessvariables as covariates in expanded models. First, we useddata on sources of healthcare coverage during each monthto categorize presence and type of health insurance as:1) privately insured all year; 2) publicly insured all year;3) uninsured part of the year and either privately or publiclyinsured the remainder; and 4) uninsured all year. Second,we assessed presence of a usual source of medical careother than an emergency room (yes/no).
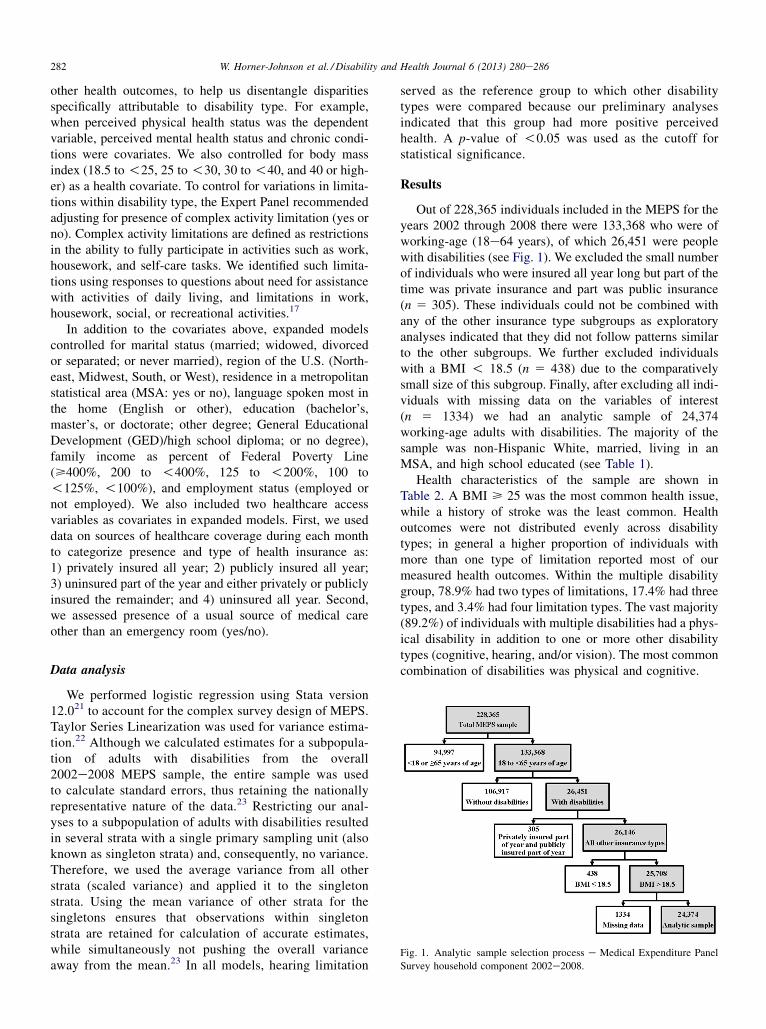
Fig. 1. Analytic sample selection process e Medical Expenditure Panel
Survey household component 2002e2008.
Data analysis
We performed logistic regression using Stata version12.021 to account for the complex survey design of MEPS.Taylor Series Linearization was used for variance estima-tion.22 Although we calculated estimates for a subpopula-tion of adults with disabilities from the overall2002e2008 MEPS sample, the entire sample was usedto calculate standard errors, thus retaining the nationallyrepresentative nature of the data.23 Restricting our anal-yses to a subpopulation of adults with disabilities resultedin several strata with a single primary sampling unit (alsoknown as singleton strata) and, consequently, no variance.Therefore, we used the average variance from all otherstrata (scaled variance) and applied it to the singletonstrata. Using the mean variance of other strata for thesingletons ensures that observations within singletonstrata are retained for calculation of accurate estimates,while simultaneously not pushing the overall varianceaway from the mean.23 In all models, hearing limitation
served as the reference group to which other disabilitytypes were compared because our preliminary analysesindicated that this group had more positive perceivedhealth. A p-value of !0.05 was used as the cutoff forstatistical significance.
Results
Out of 228,365 individuals included in the MEPS for theyears 2002 through 2008 there were 133,368 who were ofworking-age (18e64 years), of which 26,451 were peoplewith disabilities (see Fig. 1). We excluded the small numberof individuals who were insured all year long but part of thetime was private insurance and part was public insurance(n 5 305). These individuals could not be combined withany of the other insurance type subgroups as exploratoryanalyses indicated that they did not follow patterns similarto the other subgroups. We further excluded individualswith a BMI ! 18.5 (n 5 438) due to the comparativelysmall size of this subgroup. Finally, after excluding all indi-viduals with missing data on the variables of interest(n 5 1334) we had an analytic sample of 24,374working-age adults with disabilities. The majority of thesample was non-Hispanic White, married, living in anMSA, and high school educated (see Table 1).
Health characteristics of the sample are shown inTable 2. A BMI > 25 was the most common health issue,while a history of stroke was the least common. Healthoutcomes were not distributed evenly across disabilitytypes; in general a higher proportion of individuals withmore than one type of limitation reported most of ourmeasured health outcomes. Within the multiple disabilitygroup, 78.9% had two types of limitations, 17.4% had threetypes, and 3.4% had four limitation types. The vast majority(89.2%) of individuals with multiple disabilities had a phys-ical disability in addition to one or more other disabilitytypes (cognitive, hearing, and/or vision). The most commoncombination of disabilities was physical and cognitive.

Table 1
Demographic characteristics of Medical Expenditure Panel Survey
household component 2002e2008 adults aged 18e64 years with
disabilities
Characteristics N (weighted %)
Race/ethnicitya
White 14,669 (72.7)
Black 4216 (12.1)
American Indian/Alaskan Native 198 (0.8)
Asian/Native Hawaiian/Pacific Islander 648 (2.5)
Multiple races 553 (2.1)
Hispanic 4090 (9.6)
Female 13,808 (52.4)
Age (years)
18e29 2827 (12.2)
30e39 3418 (13.5)
40e49 6438 (26.3)
50e59 8155 (33.3)
60e64 3536 (14.8)
English language spoken most in home 21,669 (93.5)
Marital status
Married 12,067 (50.8)
Widowed, divorced or separated 7028 (27.0)
Never married 5279 (22.1)
Region
Northeast 3317 (15.8)
Midwest 5187 (23.3)
South 10,226 (38.4)
West 5644 (22.5)
Resides in metropolitan statistical area 18,731 (79.5)
Education
Bachelor’s, Master’s, or Doctorate 3714 (19.2)
Other degree 1914 (8.9)
GED/HSb 12,903 (55.2)
No degree 5843 (16.7)
Family incomec
>400% 6476 (35.0)
200% to !400% 6619 (29.3)
125% to !200% 3823 (13.4)
100 to !125% 1505 (4.7)
!100% 5951 (17.6)
Employed 13,123 (61.0)
Total 24,374 (100)
a Except for Hispanic, all categories are ethnically non-Hispanic.b General educational development/high school degree.c Percent of Federal Poverty Line.
283W. Horner-Johnson et al. / Disability and Health Journal 6 (2013) 280e286
Table 3 presents results of the regression analyses.Across all three models, people with vision limitations weresignificantly less likely than the hearing impairment refer-ence group to have arthritis or to have a BMI > 25. Thevision limitation group was more likely to have diabetes,but this was only significant in the expanded model. Inthe crude model, people with vision limitations were morelikely to have fair/poor mental health, but this was nolonger statistically significant when controlling for covari-ates in the partially adjusted and expanded models.
People with cognitive disabilities were less likely tohave arthritis in unadjusted analyses, and did not differsignificantly from the reference group in partially adjustedand expanded models. This group was less likely to haveBMI > 25 in both crude and partially adjusted models.
With the addition of the expanded set of covariates, theassociation with BMI was no longer statistically significant.In all three models, the cognitive limitation group hadsignificantly elevated odds of stroke and fair/poor mentalhealth. They also had higher odds of fair/poor physicalhealth in the crude model, but this effect was fully ac-counted for by the covariates in the partially adjusted andexpanded models.
In unadjusted models, people with physical disabilitiesand those with multiple disabilities fared statistically signif-icantly worse than the reference group on all healthoutcomes. For people with physical disabilities only, allbut two of these associations ceased to be significant whencovariates were added. The exceptions were arthritis andperceived physical health. However, for people withmultiple disabilities, most associations remained significantin the partially adjusted and expanded models (see Table 3).
Discussion
Across the health outcomes we evaluated, the numberof statistically significant associations decreased as morecovariates were added to the models. The magnitude ofthe odds ratios also generally diminished as we accountedfor more covariates. For some associations, such as thatbetween cognitive limitations and mental health status,the attenuation was substantial. These trends were antici-pated and confirm that there is a confounding effect bycovariates on the health outcomes we evaluated. In otherwords, some portion of each association we observed incrude models was attributable in part to covariates whichwe controlled for in subsequent models. The implicationsfor health disparities research are obvious: whether or notone determines there are disparities depends on howdisparity is defined. If any difference between groups isconsidered a health disparity, there is evidence of ampledisparities related to type of disability. If, however,disparity is defined as differences remaining after control-ling for other factors that could explain the difference,fewer disparities were apparent between subgroups ofpeople with disabilities based on disability type.
In an effort to uncover disparities specifically attribut-able to disability type, we took a conservative approachand controlled for other health problems when examiningeach of our outcome variables in adjusted models. Thisapproach may raise concerns about over-adjustment, partic-ularly given the strong association of cognitive disabilitywith poor perceived mental health and of physical disabilitywith poor perceived physical health. We therefore conduct-ed sensitivity analyses (results available from authors) inwhich we did not control for perceived health status. Oddsratios for differences related to disability type increasedsomewhat, but not dramatically, in these analyses. Thechanges did not materially affect the interpretations wereport here, and overall patterns of findings remainedconsistent.

Table 2
Health characteristics of Medical Expenditure Panel Survey household component 2002e2008 adults aged 18e64 years with disabilities
Health outcome
All disability,
N (weighted %)
Disability type, N (weighted %)
Hearing Vision Physical Cognitive More than one
Arthritis 9814 (39.1) 651 (22.2) 579 (16.6) 3335 (47.3) 300 (18.3) 4949 (53.8)
BMI > 25 17,832 (71.7) 2153 (70.9) 2367 (62.8) 5370 (75.3) 1134 (62.8) 6808 (74.8)
Cardiovascular disease 3871 (15.4) 281 (9.3) 258 (7.5) 1049 (15.0) 165 (10.0) 2118 (23.2)
Diabetes 3639 (13.0) 234 (7.0) 286 (7.1) 949 (12.2) 158 (8.7) 2012 (19.8)
Lung disease 4374 (17.2) 335 (10.9) 390 (11.1) 1213 (16.9) 236 (13.3) 2200 (23.9)
Stroke 1211 (4.2) 33 (1.2) 51 (1.6) 224 (2.9) 59 (3.3) 844 (8.2)
Fair/poor mental health 5157 (18.0) 158 (4.8) 256 (6.3) 848 (10.5) 739 (38.7) 3156 (31.5)
Fair/poor physical health 9539 (33.7) 356 (10.6) 551 (12.1) 2611 (32.6) 616 (30.5) 5405 (55.3)
Totala 24,374 (100) 3023 (100) 3619 (100) 7039 (100) 1742 (100) 8951 (100)
a Weighted percent of total sample in each disability category: hearing 14.9%, vision 15.4%, physical 29.3%, cognitive 6.6%, more than one type 33.7%.
284 W. Horner-Johnson et al. / Disability and Health Journal 6 (2013) 280e286
In addition to definitional issues, understandingdisparity is complicated by possible variations in thedirectionality of the relationships in this study. While insome cases health problems may be the cause ofdisability, chronic conditions and other poor healthoutcomes also occur as secondary and preventable condi-tions among those with previously existing disabilities.24
For example, while arthritis may itself cause mobilitylimitations, people with pre-existing mobility limitationsalso appear to be at increased risk of developing arthritisdue to greater strain on limbs not impacted by the primarydisability.25
There were relatively few statistically significantdifferences between people with vision limitations andthe hearing limitation reference group. The most consis-tent differences were lower odds of arthritis and of over-weight/obesity in the vision limitation group. People withcognitive disabilities also had somewhat less risk ofarthritis and high BMI, but were more likely to havehad a stroke, and much more likely to have fair/poormental health. Even in the expanded model, the effectof cognitive limitations on the odds of fair or poor mentalhealth was quite high (OR 5 5.03, p ! 0.01); indeed thiswas the strongest association observed in the expandedmodels. This finding may reflect challenges in measuringmental health in a way that is distinct from symptoms ofcognitive conditions. In other words, an individual identi-fied as having cognitive limitations because of difficultywith decision-making or memory may perceive his orher mental health to be poor for the same reasons. Asimilar conundrum has been noted previously for peoplewith mental health disabilities.26 Alternatively, peoplewith cognitive limitations may be more likely to experi-ence other mental health issues such as depression andanxiety.27
Significant disparities were apparent across all depen-dent variables for people with physical disabilities onlyand for people with multiple disabilities (most of whomhad a physical disability). Physical disability may placeindividuals at greater risk for developing chronic conditionsand poor health. However, at least some of the physical
limitations experienced by individuals in these groupsmay actually have been due to the chronic conditionsstudied. In the case of people who only had physicaldisability, the relationship to poor health outcomes wasattenuated by controlling for covariates. This was not thecase, though, for people with multiple disabilities. In boththe partially adjusted and expanded models, people withmultiple disabilities continued to have elevated odds fora greater number of health problems than any otherdisability group. Again, individuals in this category mayhave acquired at least some of their limitations due tohealth problems, while in other categories disability andhealth may be less intertwined.
Limitations
Our analyses were cross-sectional and therefore do notallow determinations of cause and effect. As noted above,while people with certain disabilities may be at greaterrisk for health problems, it is also possible that somedisabilities have resulted from health problems. Lack ofclarity about the temporality of relationships is a typicalissue when comparing people with and without disabil-ities but is even more complex when all members of theanalytic sample have disabilities with a variety of etiolo-gies. The result may be that our models are a conservativeview of the differences among these groups of people withdisabilities. Long-term longitudinal studies are needed tobetter understand the overlap and distinctions betweendisability, chronic conditions, and health status. Further,while this study sheds some light on differences relatedto type of disability, our categories were quite broad. Assuch, variation within each category may have obscuredpatterns associated with more specific disability groups.For example, within the cognitive disability category,the health experiences of an individual with a develop-mental disability are likely to differ from those of a personwith dementia. Analyses of more nuanced data ondisability etiology could uncover additional disparities.Lastly, our variables were based on data reported by inter-viewees and are therefore subject to reporting bias, such

Table 3
Health outcomes by disability type among adults aged 18e64 with disabilities in the Medical Expenditure Panel Survey household component 2002e2008
Health outcome Disability type
Unadjusted model Partially adjusted modela Expanded modelb
ORc 95% CI p OR 95% CI p OR 95% CI p
Arthritis Hearing Reference
Vision 0.70 0.59e0.82 !0.01 0.78 0.66e0.92 !0.01 0.80 0.68e0.95 0.01
Physical 3.15 2.77e3.58 !0.01 2.39 2.08e2.73 !0.01 2.43 2.12e2.79 !0.01
Cognitive 0.79 0.64e0.97 0.02 0.83 0.66e1.03 0.09 0.86 0.69e1.07 0.18
OOne 4.08 3.60e4.62 !0.01 2.23 1.93e2.58 !0.01 2.30 1.98e2.67 !0.01
BMI > 25 Hearing Reference
Vision 0.69 0.60e0.79 !0.01 0.79 0.68e0.91 !0.01 0.82 0.71e0.95 0.01
Physical 1.25 1.11e1.41 !0.01 1.11 0.97e1.27 0.13 1.13 0.99e1.30 0.08
Cognitive 0.69 0.58e0.82 !0.01 0.82 0.68e0.99 0.04 0.87 0.72e1.05 0.15
OOne 1.22 1.07e1.38 !0.01 1.02 0.88e1.18 0.79 1.07 0.93e1.24 0.34
Cardiovascular disease Hearing Reference
Vision 0.80 0.63e1.01 0.06 1.00 0.78e1.28 0.97 1.03 0.81e1.33 0.80
Physical 1.74 1.44e2.09 !0.01 1.21 0.99e1.49 0.07 1.25 1.01e1.53 0.04
Cognitive 1.09 0.83e1.42 0.53 1.09 0.82e1.45 0.55 1.12 0.84e1.49 0.45
OOne 2.96 2.47e3.54 !0.01 1.35 1.09e1.67 0.01 1.39 1.12e1.72 !0.01
Diabetes Hearing Reference
Vision 1.02 0.80e1.29 0.88 1.29 1.00e1.67 0.05 1.36 1.05e1.75 0.02
Physical 1.86 1.52e2.28 !0.01 1.03 0.81e1.31 0.83 1.07 0.84e1.35 0.60
Cognitive 1.27 0.97e1.67 0.08 1.21 0.90e1.64 0.20 1.20 0.89e1.62 0.23
OOne 3.30 2.73e3.98 !0.01 1.25 1.00e1.57 0.05 1.28 1.02e1.60 0.03
Lung disease Hearing Reference
Vision 1.02 0.84e1.25 0.81 0.91 0.75e1.12 0.39 0.90 0.73e1.11 0.34
Physical 1.67 1.40e1.99 !0.01 1.03 0.85e1.24 0.78 1.03 0.85e1.24 0.78
Cognitive 1.26 0.98e1.62 0.07 0.91 0.69e1.18 0.47 0.87 0.66e1.14 0.30
OOne 2.57 2.15e3.07 !0.01 1.27 1.05e1.55 0.02 1.22 1.00e1.49 0.06
Stroke Hearing Reference
Vision 1.29 0.78e2.13 0.32 1.51 0.92e2.50 0.11 1.56 0.95e2.59 0.08
Physical 2.40 1.55e3.71 !0.01 1.34 0.86e2.08 0.20 1.40 0.90e2.20 0.14
Cognitive 2.78 1.64e4.74 !0.01 2.10 1.20e3.65 0.01 2.16 1.23e3.78 0.01
OOne 7.32 4.89e10.97 !0.01 2.43 1.57e3.76 !0.01 2.49 1.60e3.87 !0.01
Perceived mental healthd Hearing Reference
Vision 1.32 1.02e1.71 0.04 1.09 0.83e1.43 0.53 1.04 0.79e1.36 0.78
Physical 2.32 1.83e2.93 !0.01 0.81 0.62e1.05 0.11 0.82 0.63e1.06 0.13
Cognitive 12.49 9.79e15.94 !0.01 5.94 4.59e7.69 !0.01 5.03 3.87e6.54 !0.01
OOne 9.10 7.30e11.36 !0.01 2.06 1.58e2.68 !0.01 1.88 1.44e2.44 !0.01
Perceived physical healthd Hearing Reference
Vision 1.16 0.97e1.39 0.10 1.10 0.91e1.32 0.34 1.06 0.87e1.28 0.56
Physical 4.09 3.48e4.82 !0.01 2.03 1.70e2.42 !0.01 2.01 1.68e2.40 !0.01
Cognitive 3.72 3.03e4.57 !0.01 0.91 0.71e1.17 0.46 0.88 0.69e1.12 0.29
OOne 10.46 8.94e12.23 !0.01 2.44 2.04e2.92 !0.01 2.32 1.93e2.79 !0.01
a Models adjusted for gender, age, race/ethnicity, perceived physical health status, perceived mental health status, body mass index, diabetes, arthritis, stroke,
cardiovascular disease, lung disease, and complex activity limitation.b Models adjusted for gender, age, race/ethnicity, perceived physical health status, perceived mental health status, body mass index, diabetes, arthritis, stroke,
cardiovascular disease, lung disease, complex activity limitation, marital status, region of country, metropolitan statistical area, language spoken most in the
home, education, family income as percent of federal poverty line, employment status, insurance type or status, and usual source of care.c OR 5 odds ratio; CI 5 confidence interval.d Data on relationships between chronic conditions and perceived health available from authors on request.
285W. Horner-Johnson et al. / Disability and Health Journal 6 (2013) 280e286
as the tendency to over-report height and under-reportweight, leading to inaccurate (typically reduced) BMI.Estimates of BMI also may be somewhat less accuratefor people who have been weighed less recently (e.g.,wheelchair users receiving care at a clinic withouta wheelchair accessible scale). However, given the highproportion of overweight and obese people in our physicaland multiple disability groups, we do not believe under-reporting of weight substantially impacted the patternsof our findings.
Conclusion
Our results are derived from a nationally representativepopulation sample of working-age adults with disability.The findings advance our understanding of withindisability health differences, although temporal relation-ships between disability and poor health require furtherexploration. While many of the differences betweendisability types were reduced when controlling for otherfactors, other differences remained significant. This

286 W. Horner-Johnson et al. / Disability and Health Journal 6 (2013) 280e286
argues for a more individualized approach to under-standing and preventing chronic conditions and poorhealth in specific disability groups.
References
1. Bennett KJ, Probst JC, Pumkam C. Obesity among working age
adults: the role of county-level persistent poverty in rural disparities.
Health Place. 2011;17(5):1174e1181.
2. Conron KJ, Mimiaga MJ, Landers SJ. A population-based study of
sexual orientation identity and gender differences in adult health.
Am J Public Health. 2010;100(10):1953.
3. Cherepanov D, Palta M, Fryback DG, Robert SA, Hays RD,
Kaplan RM. Gender differences in multiple underlying dimensions
of health-related quality of life are associated with sociodemographic
and socioeconomic status. Med Care. 2011;49(11):1021.
4. World Health Organization. International Classification of Func-
tioning, Disability and Health. Geneva, Switzerland: World Health
Organization; 2001.
5. McDermott S, Platt T. The Health of Adults with Disability in Family
Practice-1990-2003. Paper presented at the Conference of the
National Center on Birth Defects and Developmental Disabilities,
Washington, DC; 2004.
6. National Institute of Dental and Craniofacial Research. A Plan to
Eliminate Craniofacial, Oral, and Dental Health Disparities.
Bethesda, MD: National Institute of Dental and Craniofacial
Research; 2002.
7. Nosek MA, Howland C, Rintala DH, Young ME, Chanpong GF.
National study of women with physical disabilities: final report. Sex
Disabil. 2001;19(1):5e40.8. Froehlich-Grobe K, Lollar D. Obesity and disability: time to act. Am J
Prev Med. 2011;41(5):541e545.
9. Chevarley FM, Thierry JM, Gill CJ, Ryerson AB, Nosek MA. Health,
preventive health care, and health care access among women with
disabilities in the 1994-1995 National Health Interview Survey,
Supplement on Disability. Womens Health Issues. 2006;16(6):
297e312.10. Drum CE, Horner-Johnson W, Krahn GL. Self-rated health and
healthy days: examining the ‘‘disability paradox’’. Disabil Health J.
2008;1(2):71e78.
11. Agency for Healthcare Research and Quality (AHRQ). National
Healthcare Disparities Report 2011. Rockville, MD: AHRQ; 2012.
12. Iezzoni LI. Eliminating health and health care disparities among the
growing population of people with disabilities. Health Aff.
2011;30(10):1947e1954.
13. Rowland M, Peterson J, Dobbertin K, Walsh ES, Horner-Johnson W,
and The Expert Panel on Health Disparities among Individuals with
Disabilities. Health outcome disparities among subgroups of people
with disabilities e a scoping review. In Review.
14. Ezzati-Rice TM, Rohde F, Greenblatt J. Sample Design of the Medical
Expenditure Panel Survey Household Component, 1998-2007. Rock-
ville, MD: Agency for Healthcare Research and Quality (AHRQ);
2008.
15. Cohen JW, Cohen SB, Banthin JS. The Medical Expenditure Panel
Survey: a national information resource to support healthcare cost
research and inform policy and practice. Med Care. 2009;47(7 suppl
1):S44eS50.16. Agency for Healthcare Research and Quality (AHRQ). MEPS-HC
Response Rates by Panel. Available at: http://meps.ahrq.gov/survey_
comp/hc_response_rate.jsp; 2009 [cited 13.03.13].
17. Altman B, Bernstein A. Disability and Health in the United States,
2001e2005. Hyattsville, MD: National Center for Health Statistics;
2008.
18. U.S. Department of Health and Human Services. Healthy People 2020.
Rockville, MD: U.S. Department of Health and Human Services;
2010.
19. Centers for Disease Control and Prevention (CDC). Measuring
Healthy Days. Atlanta, GA: CDC; 2000.
20. Centers for Disease Control and Prevention (CDC). CDC health
disparities and inequalities report e United States, 2011. MMWR
Morb Mortal Wkly Rep. 2011;60(suppl):1e113.
21. StataCorp. Stata. Version 12. College Station, TX: StataCorp; 2011.
22. Levy PS, Lemeshow S. Sampling of Populations. 4th ed. Hoboken, NJ:
J. Wiley; 2008.
23. StataCorp. Stata Survey Data Reference Manual: Release 12. College
Station, TX: StataCorp LP; 2011.
24. Turk MA. Secondary conditions and disability. In: Field MJ, Jette AM,
Martin L, eds. Workshop on Disability in America: A New Look.
Washington, DC: Institute of Medicine, National Academies Press;
2005:185e193.
25. Morgenroth DC, Gellhorn AC, Suri P. Osteoarthritis in the disabled
population: a mechanical perspective. PM R. 2012;4(5 suppl):
S20eS27.26. Hall T, Krahn GL, Horner-Johnson W, Lamb G; the RRTC Expert
Panel on Health Measurement. Examining functional content in
widely used health-related quality of life scales. Rehab Psych.
2011;56(2):94e99.27. Hassiotis A, Serfaty M, Azam K, et al. Cognitive behaviour therapy
(CBT) for anxiety and depression in adults with mild intellectual
disabilities (ID): a pilot randomised controlled trial. Trials.
2011;12(1):95e101.