Disorders of water and sodium balance Zhao Chenghai Pathophysiology.

2
Disorders of Sodium Balance
Sodium is the predominant cation in extracellular fluid (ECF); thevolume of ECF is directly proportional to the content of sodiumin the body. Disorders of sodium balance, therefore, may be
viewed as disorders of ECF volume. The body must maintain ECF vol-ume within acceptable limits to maintain tissue perfusion becauseplasma volume is directly proportional to ECF volume. The plasmavolume is a crucial component of the blood volume that determinesrates of organ perfusion. Many authors suggest that ECF volume ismaintained within narrow limits despite wide variations in dietarysodium intake. However, ECF volume may increase as much as 18%when dietary sodium intake is increased from very low to moderatelyhigh levels [1,2]. Such variation in ECF volume usually is well toler-ated and leads to few short-term consequences. In contrast, the samechange in dietary sodium intake causes only a 1% change in meanarterial pressure (MAP) in normal persons [3]. The body behaves as ifthe MAP, rather than the ECF volume, is tightly regulated. Underchronic conditions, the effect of MAP on urinary sodium excretiondisplays a remarkable gain; an increase in MAP of 1 mm Hg is asso-ciated with increases in daily sodium excretion of 200 mmol [4].
Guyton [4] demonstrated the importance of the kidney in controlof arterial pressure. Endogenous regulators of vascular tone, hormon-al vasoconstrictors, neural inputs, and other nonrenal mechanisms areimportant participants in short-term pressure homeostasis. Over thelong term, blood pressure is controlled by renal volume excretion,which is adjusted to a set point. Increases in arterial pressure lead tonatriuresis (called pressure natriuresis), which reduces blood volume.A decrease in blood volume reduces venous return to the heart andcardiac output. Urinary volume excretion exceeds dietary intake untilthe blood volume decreases sufficiently to return the blood pressure tothe set point.
Disorders of sodium balance resulting from primary renal sodiumretention lead only to modest volume expansion without edemabecause increases in MAP quickly return sodium excretion to baseline
David H. Ellison
C H A P T E R

2.2 Disorders of Water, Electrolytes, and Acid-Base
levels. Examples of these disorders include chronic renal failureand states of mineralocorticoid excess. In this case, the price ofa return to sodium balance is hypertension. Disorders of sodi-um balance that result from secondary renal sodium retention,as in congestive heart failure, lead to more profound volumeexpansion owing to hypotension. In mild to moderates cases,volume expansion eventually returns the MAP to its set point;the price of sodium balance in this case is edema. In more severecases, volume expansion never returns blood pressure to nor-mal, and renal sodium retention is unremitting. In still other sit-uations, such as nephrotic syndrome, volume expansion resultsfrom changes in both the renal set point and body volume dis-tribution. In this case, the price of sodium balance may be bothedema and hypertension. In each of these cases, renal sodium(and chloride) retention results from a discrepancy between theexisting MAP and the renal set point.
The examples listed previously emphasize that disorders ofsodium balance do not necessarily abrogate the ability toachieve sodium balance. When balance is defined as the equa-tion of sodium intake and output, most patients with ECFexpansion (and edema or hypertension) or ECF volume deple-tion achieve sodium balance. They do so, however, at theexpense of expanded or contracted ECF volume. The failure toachieve sodium balance at normal ECF volumes characterizesthese disorders.
Frequently, distinguishing disorders of sodium balance fromdisorders of water balance is useful. According to this scheme, dis-orders of water balance are disorders of body osmolality and usu-ally are manifested by alterations in serum sodium concentration
(see Chapter 1). Disorders of sodium balance are disorders ofECF volume. This construct has a physiologic basis becausewater balance and sodium balance can be controlled separatelyand by distinct hormonal systems. It should be emphasized,however, that disorders of sodium balance frequently lead to orare associated with disorders of water balance. This is evidentfrom Figure 2-24 in which hyponatremia is noted to be a signof either ECF volume expansion or contraction. Thus, the dis-tinction between disorders of sodium and water balance is use-ful in constructing differential diagnoses; however, the closeinterrelationships between factors that control sodium andwater balance should be kept in mind.
The figures herein describe characteristics of sodium home-ostasis in normal persons and also describe several of the regu-latory systems that are important participants in controllingrenal sodium excretion. Next, mechanisms of sodium transportalong the nephron are presented, followed by examples of dis-orders of sodium balance that illuminate current understandingof their pathophysiology. Recently, rapid progress has beenmade in unraveling mechanisms of renal volume homeostasis.Most of the hormones that regulate sodium balance have beencloned and sequenced. Intracellular signaling mechanismsresponsible for their effects have been characterized. The renaltransport proteins that mediate sodium reabsorption also havebeen cloned and sequenced. The remaining challenges are tointegrate this information into models that describe systemicvolume homeostasis and to determine how alterations in one ormore of the well-characterized systems lead to volume expan-sion or contraction.
Normal Extracellular Fluid Volume Homeostasis
Extravascular(15%) Extravascular
(11%)
Plasma (4%)
RBC (3%)
Adult male
Adult female
ECF volume(20%)
ICF volume(40%)
ECF volume(15%)
ICF volume(35%)
Blood volume(9%)
A B
Blood volume(7%)
Plasma (5%)
RBC (4%)
FIGURE 2-1
Fluid volumes in typical adult men andwomen, given as percentages of bodyweight. In men (A), total body water typi-cally is 60% of body weight (Total bodywater = Extracellular fluid [ECF] volume +Intracellular fluid [ICF] volume). The ECFvolume comprises the plasma volume andthe extravascular volume. The ICF volumecomprises the water inside erythrocytes(RBCs) and inside other cells. The bloodvolume comprises the plasma volume plusthe RBC volume. Thus, the RBC volume isa unique component of ICF volume thatcontributes directly to cardiac output andblood pressure. Typically, water comprises asmaller percentage of the body weight in awoman (B) than in a man; thus, whenexpressed as a percentage of body weight,fluid volumes are smaller. Note, however,that the percentage of total body water thatis intracellular is approximately 70% inboth men and women [5].
2.3Disorders of Sodium BalanceEC
F vo
lum
e, L
14
13
12
11
10
Days
0 5 10 15 20 25
109876543210
Dietary so
diu
m in
take, g
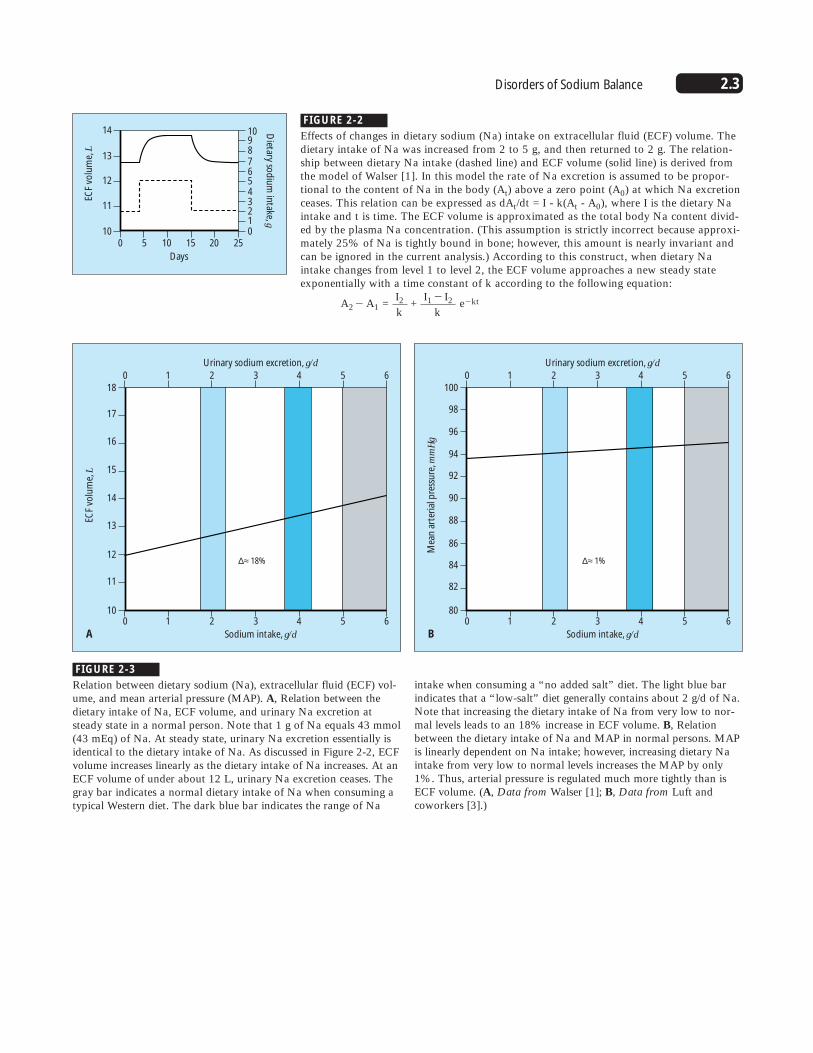
FIGURE 2-2
Effects of changes in dietary sodium (Na) intake on extracellular fluid (ECF) volume. Thedietary intake of Na was increased from 2 to 5 g, and then returned to 2 g. The relation-ship between dietary Na intake (dashed line) and ECF volume (solid line) is derived fromthe model of Walser [1]. In this model the rate of Na excretion is assumed to be propor-tional to the content of Na in the body (At) above a zero point (A0) at which Na excretionceases. This relation can be expressed as dAt/dt = I - k(At - A0), where I is the dietary Naintake and t is time. The ECF volume is approximated as the total body Na content divid-ed by the plasma Na concentration. (This assumption is strictly incorrect because approxi-mately 25% of Na is tightly bound in bone; however, this amount is nearly invariant andcan be ignored in the current analysis.) According to this construct, when dietary Naintake changes from level 1 to level 2, the ECF volume approaches a new steady stateexponentially with a time constant of k according to the following equation:
A2� A1 = I2 +
I1 � I2 e�ktk k
ECF
volu
me,
L
18
17
16
15
14
13
12
11
100 1 2 3 4 5 6
Sodium intake, g/d
0 1 2 3 4 5 6
Urinary sodium excretion, g/d
∆≈ 18%
A
Mea
n a
rter
ial p
ress
ure
, mm
Hg
100
98
96
94
92
90
88
86
84
82
800 1 2 3 4 5 6
Sodium intake, g/d
0 1 2 3 4 5 6
Urinary sodium excretion, g/d
∆≈ 1%
B
FIGURE 2-3
Relation between dietary sodium (Na), extracellular fluid (ECF) vol-ume, and mean arterial pressure (MAP). A, Relation between thedietary intake of Na, ECF volume, and urinary Na excretion atsteady state in a normal person. Note that 1 g of Na equals 43 mmol(43 mEq) of Na. At steady state, urinary Na excretion essentially isidentical to the dietary intake of Na. As discussed in Figure 2-2, ECFvolume increases linearly as the dietary intake of Na increases. At anECF volume of under about 12 L, urinary Na excretion ceases. Thegray bar indicates a normal dietary intake of Na when consuming atypical Western diet. The dark blue bar indicates the range of Na
intake when consuming a “no added salt” diet. The light blue barindicates that a “low-salt” diet generally contains about 2 g/d of Na.Note that increasing the dietary intake of Na from very low to nor-mal levels leads to an 18% increase in ECF volume. B, Relationbetween the dietary intake of Na and MAP in normal persons. MAPis linearly dependent on Na intake; however, increasing dietary Naintake from very low to normal levels increases the MAP by only1%. Thus, arterial pressure is regulated much more tightly than isECF volume. (A, Data from Walser [1]; B, Data from Luft andcoworkers [3].)
2.4 Disorders of Water, Electrolytes, and Acid-Base
UN
aV, X
no
rmal
6
3
4
5
2
1
0200150100500
MAP, mm Hg
Nonrenalfluid loss
NaCl andfluid intake
Arterialpressure
Kidney volumeoutput
Extracellularfluid volume
Blood volume
Mean circulatoryfilling pressure
Total peripheralresistance
Net volumeintake
Venous returnCardiac output
Autoregulation
Rate of changeof extracellular
fluid volume
+
+
++
+
+
+
+
+
++
–
–
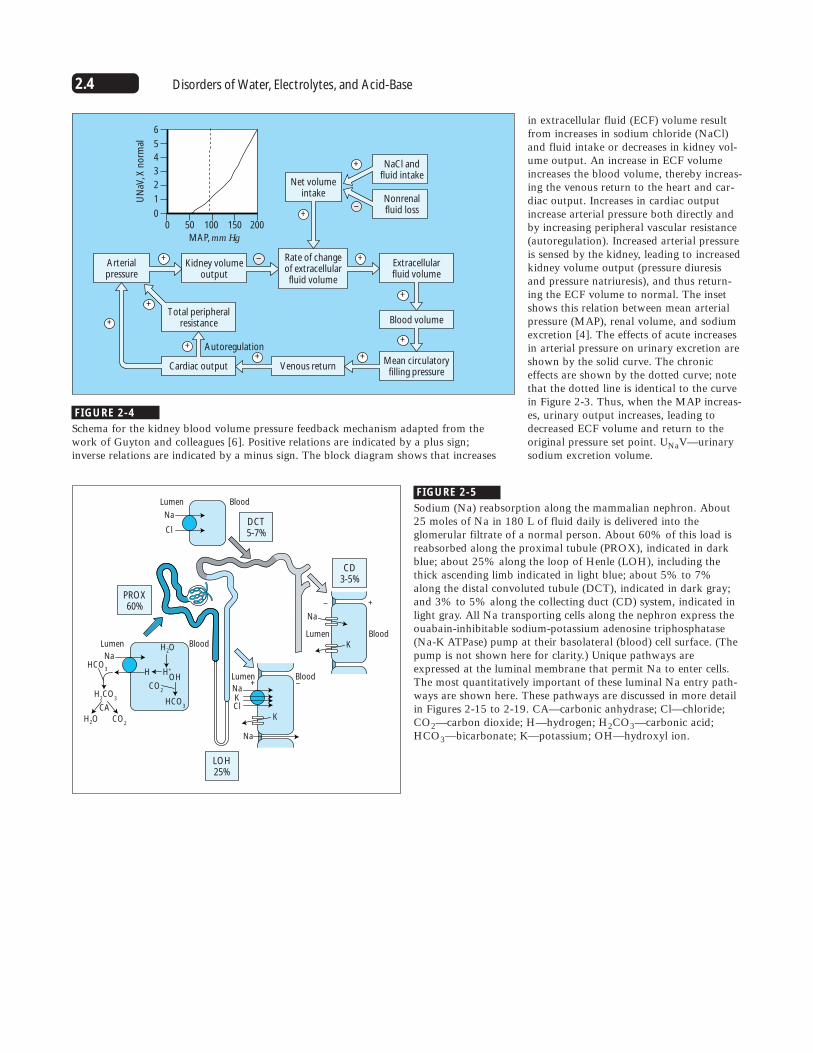
in extracellular fluid (ECF) volume resultfrom increases in sodium chloride (NaCl)and fluid intake or decreases in kidney vol-ume output. An increase in ECF volumeincreases the blood volume, thereby increas-ing the venous return to the heart and car-diac output. Increases in cardiac outputincrease arterial pressure both directly andby increasing peripheral vascular resistance(autoregulation). Increased arterial pressureis sensed by the kidney, leading to increasedkidney volume output (pressure diuresisand pressure natriuresis), and thus return-ing the ECF volume to normal. The insetshows this relation between mean arterialpressure (MAP), renal volume, and sodiumexcretion [4]. The effects of acute increasesin arterial pressure on urinary excretion areshown by the solid curve. The chroniceffects are shown by the dotted curve; notethat the dotted line is identical to the curvein Figure 2-3. Thus, when the MAP increas-es, urinary output increases, leading todecreased ECF volume and return to theoriginal pressure set point. UNaV—urinarysodium excretion volume.
FIGURE 2-4
Schema for the kidney blood volume pressure feedback mechanism adapted from the work of Guyton and colleagues [6]. Positive relations are indicated by a plus sign; inverse relations are indicated by a minus sign. The block diagram shows that increases
LOH25%
PROX60%
DCT5-7%
Na
Lumen Blood
Lumen Blood
Cl
H2O
H2O
CA
OH
HCO3
HCO3
Na
H2CO
3
CO2
CO2
H H+
Lumen Blood
CD3-5%
Na
Na
K
KCl
Lumen
– +
+ –
Blood
Na
K
FIGURE 2-5
Sodium (Na) reabsorption along the mammalian nephron. About25 moles of Na in 180 L of fluid daily is delivered into theglomerular filtrate of a normal person. About 60% of this load isreabsorbed along the proximal tubule (PROX), indicated in darkblue; about 25% along the loop of Henle (LOH), including thethick ascending limb indicated in light blue; about 5% to 7%along the distal convoluted tubule (DCT), indicated in dark gray;and 3% to 5% along the collecting duct (CD) system, indicated inlight gray. All Na transporting cells along the nephron express theouabain-inhibitable sodium-potassium adenosine triphosphatase(Na-K ATPase) pump at their basolateral (blood) cell surface. (Thepump is not shown here for clarity.) Unique pathways areexpressed at the luminal membrane that permit Na to enter cells.The most quantitatively important of these luminal Na entry path-ways are shown here. These pathways are discussed in more detailin Figures 2-15 to 2-19. CA—carbonic anhydrase; Cl—chloride;CO2—carbon dioxide; H—hydrogen; H2CO3—carbonic acid;HCO3—bicarbonate; K—potassium; OH—hydroxyl ion.
2.5Disorders of Sodium Balance
Mechanisms of Extracellular Fluid Volume Control
↑ Renal tubular sodium reabsoption
↓ Renal tubular sodium reabsoption
↑ ERSNA
↑ Activation ofbaroreceptors
↑ FF↑ Angiotensin II ↑ Aldosterone
↑ Renin
↓ Arterial pressure
↑ Arterial pressure
↑ RIHP ↑ Prostaglandins
↑ ANP ↑ Kinins
ECFV contraction
ECFV expansion
Normal ECF volume
UNaV
ACE
Angiotensinogen
SVR
Renin
Aldo
Angiotensin I
DRVYIHPFHL DRVYIHPF
Angiotensin II
+
+
+
––
+
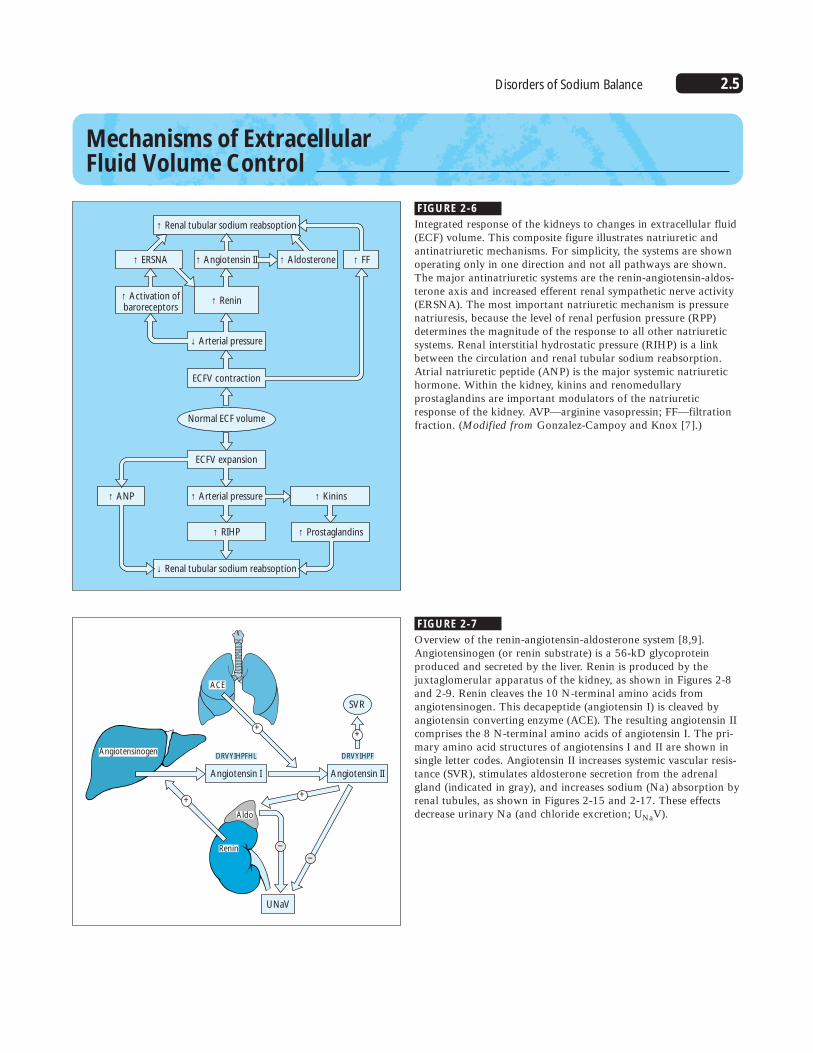
FIGURE 2-6
Integrated response of the kidneys to changes in extracellular fluid(ECF) volume. This composite figure illustrates natriuretic andantinatriuretic mechanisms. For simplicity, the systems are shownoperating only in one direction and not all pathways are shown.The major antinatriuretic systems are the renin-angiotensin-aldos-terone axis and increased efferent renal sympathetic nerve activity(ERSNA). The most important natriuretic mechanism is pressurenatriuresis, because the level of renal perfusion pressure (RPP)determines the magnitude of the response to all other natriureticsystems. Renal interstitial hydrostatic pressure (RIHP) is a linkbetween the circulation and renal tubular sodium reabsorption.Atrial natriuretic peptide (ANP) is the major systemic natriuretichormone. Within the kidney, kinins and renomedullaryprostaglandins are important modulators of the natriureticresponse of the kidney. AVP—arginine vasopressin; FF—filtrationfraction. (Modified from Gonzalez-Campoy and Knox [7].)
FIGURE 2-7
Overview of the renin-angiotensin-aldosterone system [8,9].Angiotensinogen (or renin substrate) is a 56-kD glycoprotein produced and secreted by the liver. Renin is produced by the juxtaglomerular apparatus of the kidney, as shown in Figures 2-8and 2-9. Renin cleaves the 10 N-terminal amino acids fromangiotensinogen. This decapeptide (angiotensin I) is cleaved byangiotensin converting enzyme (ACE). The resulting angiotensin IIcomprises the 8 N-terminal amino acids of angiotensin I. The pri-mary amino acid structures of angiotensins I and II are shown insingle letter codes. Angiotensin II increases systemic vascular resis-tance (SVR), stimulates aldosterone secretion from the adrenalgland (indicated in gray), and increases sodium (Na) absorption byrenal tubules, as shown in Figures 2-15 and 2-17. These effectsdecrease urinary Na (and chloride excretion; UNaV).
2.6 Disorders of Water, Electrolytes, and Acid-Base
MD
E
N
JGG
GIM
JG
AN
N
B
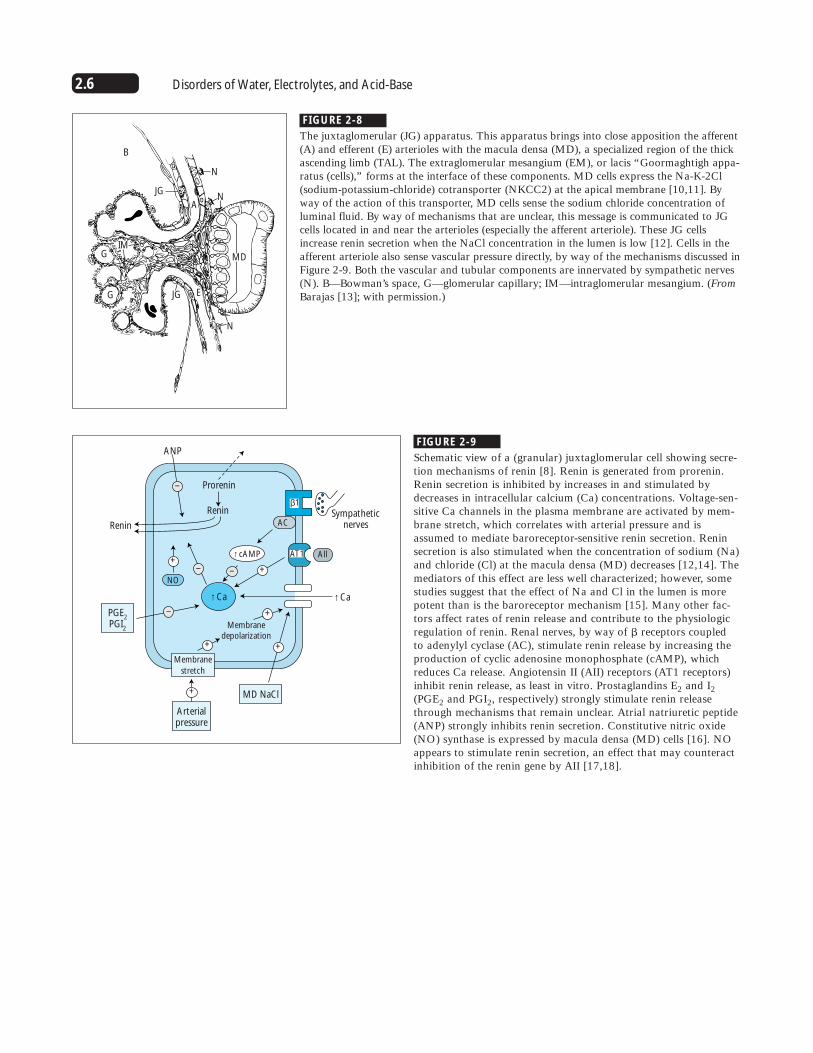
FIGURE 2-8
The juxtaglomerular (JG) apparatus. This apparatus brings into close apposition the afferent(A) and efferent (E) arterioles with the macula densa (MD), a specialized region of the thickascending limb (TAL). The extraglomerular mesangium (EM), or lacis “Goormaghtigh appa-ratus (cells),” forms at the interface of these components. MD cells express the Na-K-2Cl(sodium-potassium-chloride) cotransporter (NKCC2) at the apical membrane [10,11]. Byway of the action of this transporter, MD cells sense the sodium chloride concentration ofluminal fluid. By way of mechanisms that are unclear, this message is communicated to JGcells located in and near the arterioles (especially the afferent arteriole). These JG cellsincrease renin secretion when the NaCl concentration in the lumen is low [12]. Cells in theafferent arteriole also sense vascular pressure directly, by way of the mechanisms discussed inFigure 2-9. Both the vascular and tubular components are innervated by sympathetic nerves(N). B—Bowman’s space, G—glomerular capillary; IM—intraglomerular mesangium. (FromBarajas [13]; with permission.)
Renin
Renin
↑Ca ↑Ca
↑cAMP
Prorenin
ANP
AC
NO
Membranedepolarization
β1
Sympatheticnerves
Arterialpressure
Membrane
stretch
PGE2
PGI2
MD NaCl
–
–
+
+
+
+
++
–
–
AllAT1
FIGURE 2-9
Schematic view of a (granular) juxtaglomerular cell showing secre-tion mechanisms of renin [8]. Renin is generated from prorenin.Renin secretion is inhibited by increases in and stimulated bydecreases in intracellular calcium (Ca) concentrations. Voltage-sen-sitive Ca channels in the plasma membrane are activated by mem-brane stretch, which correlates with arterial pressure and isassumed to mediate baroreceptor-sensitive renin secretion. Reninsecretion is also stimulated when the concentration of sodium (Na)and chloride (Cl) at the macula densa (MD) decreases [12,14]. Themediators of this effect are less well characterized; however, somestudies suggest that the effect of Na and Cl in the lumen is morepotent than is the baroreceptor mechanism [15]. Many other fac-tors affect rates of renin release and contribute to the physiologicregulation of renin. Renal nerves, by way of � receptors coupled to adenylyl cyclase (AC), stimulate renin release by increasing theproduction of cyclic adenosine monophosphate (cAMP), whichreduces Ca release. Angiotensin II (AII) receptors (AT1 receptors)inhibit renin release, as least in vitro. Prostaglandins E2 and I2(PGE2 and PGI2, respectively) strongly stimulate renin releasethrough mechanisms that remain unclear. Atrial natriuretic peptide(ANP) strongly inhibits renin secretion. Constitutive nitric oxide(NO) synthase is expressed by macula densa (MD) cells [16]. NOappears to stimulate renin secretion, an effect that may counteractinhibition of the renin gene by AII [17,18].
2.7Disorders of Sodium Balance
AME or LicoriceBasolateral Apical
11β HSD
Cortisone
GR
MR
↑ ENaC↑ Na/K ATPase
MR
AldoAldo
Cortisol
11β HSD
Cortisone
Cortisol
Cortisol
Distal nephron cell
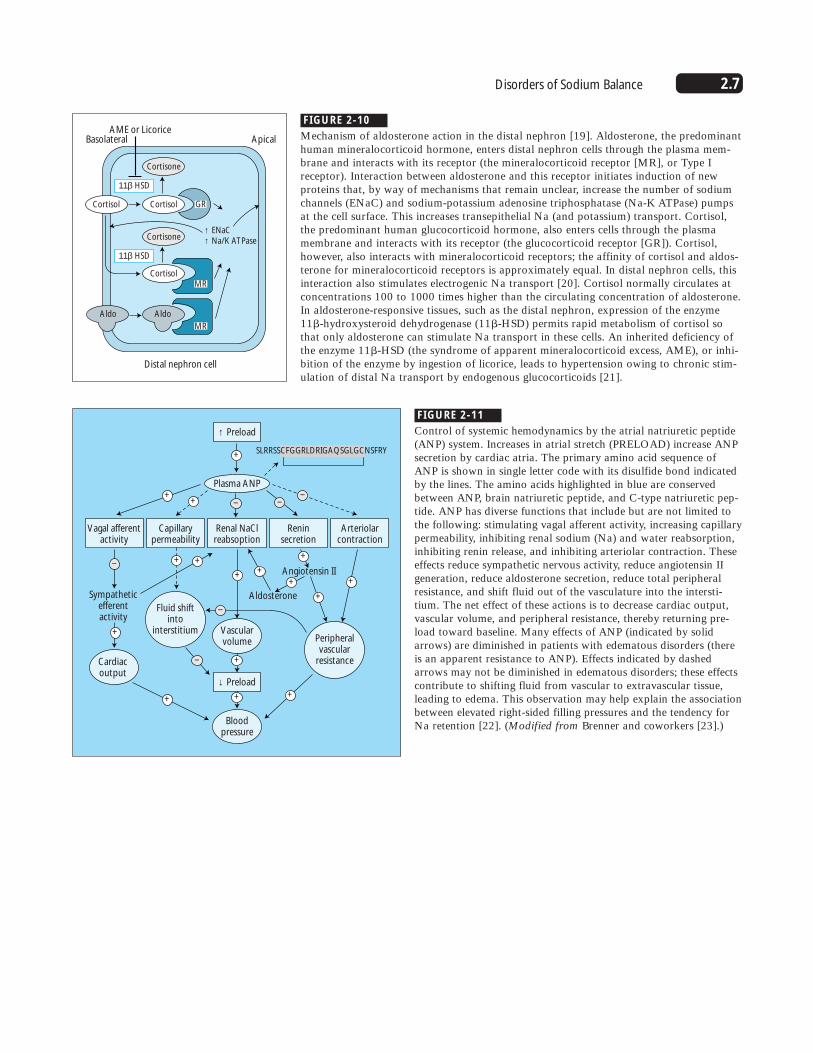
FIGURE 2-10
Mechanism of aldosterone action in the distal nephron [19]. Aldosterone, the predominanthuman mineralocorticoid hormone, enters distal nephron cells through the plasma mem-brane and interacts with its receptor (the mineralocorticoid receptor [MR], or Type Ireceptor). Interaction between aldosterone and this receptor initiates induction of new proteins that, by way of mechanisms that remain unclear, increase the number of sodiumchannels (ENaC) and sodium-potassium adenosine triphosphatase (Na-K ATPase) pumpsat the cell surface. This increases transepithelial Na (and potassium) transport. Cortisol,the predominant human glucocorticoid hormone, also enters cells through the plasmamembrane and interacts with its receptor (the glucocorticoid receptor [GR]). Cortisol,however, also interacts with mineralocorticoid receptors; the affinity of cortisol and aldos-terone for mineralocorticoid receptors is approximately equal. In distal nephron cells, thisinteraction also stimulates electrogenic Na transport [20]. Cortisol normally circulates atconcentrations 100 to 1000 times higher than the circulating concentration of aldosterone.In aldosterone-responsive tissues, such as the distal nephron, expression of the enzyme11�-hydroxysteroid dehydrogenase (11�-HSD) permits rapid metabolism of cortisol sothat only aldosterone can stimulate Na transport in these cells. An inherited deficiency ofthe enzyme 11�-HSD (the syndrome of apparent mineralocorticoid excess, AME), or inhi-bition of the enzyme by ingestion of licorice, leads to hypertension owing to chronic stim-ulation of distal Na transport by endogenous glucocorticoids [21].
↑ Preload
↓ Preload
SLRRSSCFGGRLDRIGAQSGLGCNSFRY
Plasma ANP
Vagal afferentactivity
Capillarypermeability
Fluid shiftinto
interstitiumPeripheralvascular
resistance
Sympatheticefferentactivity
Angiotensin II
Aldosterone
Cardiacoutput
Vascularvolume
Bloodpressure
Renal NaClreabsoption
Reninsecretion
Arteriolarcontraction
++
+
+
– ––
+
– + +
+
++
– +
+
–
+
+
++
FIGURE 2-11
Control of systemic hemodynamics by the atrial natriuretic peptide(ANP) system. Increases in atrial stretch (PRELOAD) increase ANPsecretion by cardiac atria. The primary amino acid sequence ofANP is shown in single letter code with its disulfide bond indicatedby the lines. The amino acids highlighted in blue are conservedbetween ANP, brain natriuretic peptide, and C-type natriuretic pep-tide. ANP has diverse functions that include but are not limited tothe following: stimulating vagal afferent activity, increasing capillarypermeability, inhibiting renal sodium (Na) and water reabsorption,inhibiting renin release, and inhibiting arteriolar contraction. Theseeffects reduce sympathetic nervous activity, reduce angiotensin IIgeneration, reduce aldosterone secretion, reduce total peripheralresistance, and shift fluid out of the vasculature into the intersti-tium. The net effect of these actions is to decrease cardiac output,vascular volume, and peripheral resistance, thereby returning pre-load toward baseline. Many effects of ANP (indicated by solidarrows) are diminished in patients with edematous disorders (thereis an apparent resistance to ANP). Effects indicated by dashedarrows may not be diminished in edematous disorders; these effectscontribute to shifting fluid from vascular to extravascular tissue,leading to edema. This observation may help explain the associationbetween elevated right-sided filling pressures and the tendency forNa retention [22]. (Modified from Brenner and coworkers [23].)
2.8 Disorders of Water, Electrolytes, and Acid-Base
Time, min
1801651501351201059075604530
Wild type
Knockout
ANP infusion
15
UN
AV
, mm
ol/m
in/g
bod
y w
t
20
18
16
14
12
10
8
6
4
2
0
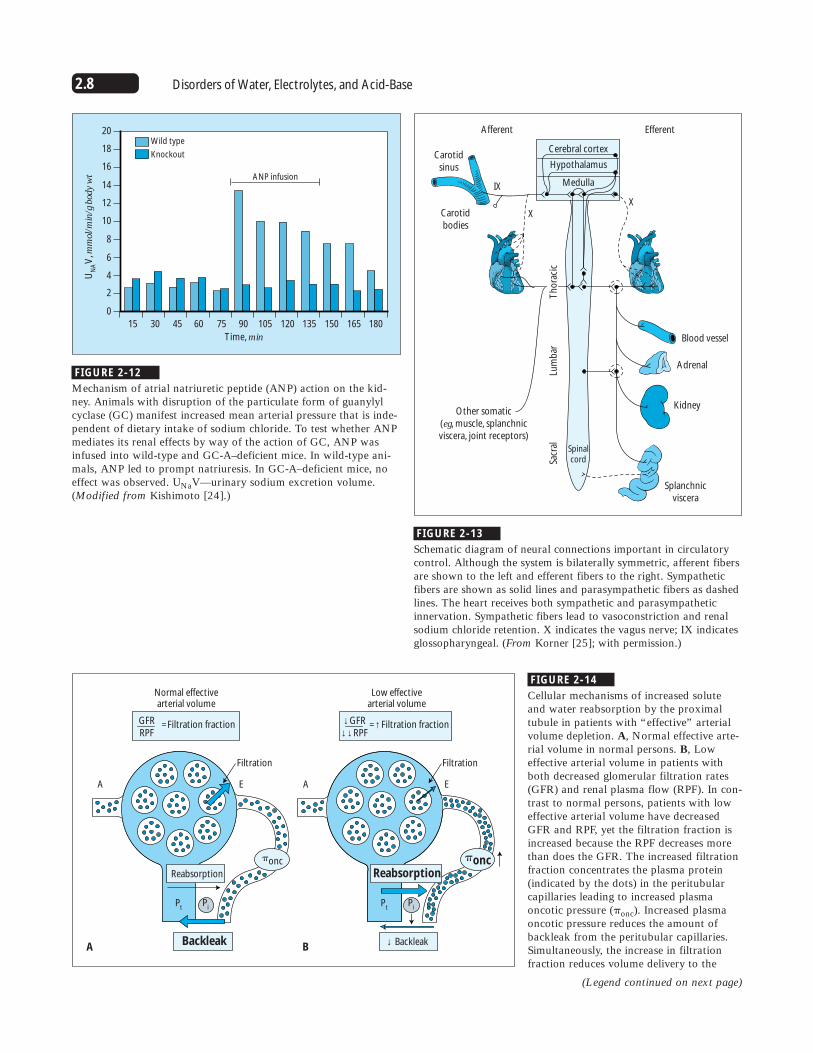
FIGURE 2-12
Mechanism of atrial natriuretic peptide (ANP) action on the kid-ney. Animals with disruption of the particulate form of guanylylcyclase (GC) manifest increased mean arterial pressure that is inde-pendent of dietary intake of sodium chloride. To test whether ANPmediates its renal effects by way of the action of GC, ANP wasinfused into wild-type and GC-A–deficient mice. In wild-type ani-mals, ANP led to prompt natriuresis. In GC-A–deficient mice, noeffect was observed. UNaV—urinary sodium excretion volume.(Modified from Kishimoto [24].)
Cerebral cortex
Hypothalamus
Medulla
EfferentAfferent
Blood vessel
Carotidbodies
XX
IX
Carotidsinus
Adrenal
Kidney
Splanchnicviscera
Other somatic(eg, muscle, splanchnicviscera, joint receptors)
Sacr
alLu
mb
arT
ho
raci
c
Spinalcord
FIGURE 2-13
Schematic diagram of neural connections important in circulatorycontrol. Although the system is bilaterally symmetric, afferent fibersare shown to the left and efferent fibers to the right. Sympatheticfibers are shown as solid lines and parasympathetic fibers as dashedlines. The heart receives both sympathetic and parasympatheticinnervation. Sympathetic fibers lead to vasoconstriction and renalsodium chloride retention. X indicates the vagus nerve; IX indicatesglossopharyngeal. (From Korner [25]; with permission.)
GFRRPF
=Filtration fraction
Normal effectivearterial volume
Filtration
EA
A B
Low effectivearterial volume
↓GFR↓↓ RPF
=↑Filtration fraction
Reabsorption
Pt
Pi
�onc
Backleak ↓ Backleak
�onc
Filtration
EA
Pt
Pi
Reabsorption
FIGURE 2-14
Cellular mechanisms of increased soluteand water reabsorption by the proximaltubule in patients with “effective” arterialvolume depletion. A, Normal effective arte-rial volume in normal persons. B, Loweffective arterial volume in patients withboth decreased glomerular filtration rates(GFR) and renal plasma flow (RPF). In con-trast to normal persons, patients with loweffective arterial volume have decreasedGFR and RPF, yet the filtration fraction isincreased because the RPF decreases morethan does the GFR. The increased filtrationfraction concentrates the plasma protein(indicated by the dots) in the peritubularcapillaries leading to increased plasmaoncotic pressure (�onc). Increased plasmaoncotic pressure reduces the amount ofbackleak from the peritubular capillaries.Simultaneously, the increase in filtrationfraction reduces volume delivery to the
(Legend continued on next page)

2.9Disorders of Sodium Balance
FIGURE 2-14 (continued)
peritubular capillary, decreasing its hydrostatic pressure, and there-by reducing the renal interstitial hydrostatic pressure (Pi). Eventhough the proximal tubule hydrostatic pressure (Pt) may be
reduced, owing to diminished GFR, the hydrostatic gradient fromtubule to interstitium is increased, favoring increased volume reab-sorption. A—afferent arteriole; E—efferent arteriole.
2K+
Interstitum
3Na+
Na+
H+
Na+
H2O
Cl-
Lumen
Dopamine
↑FF
↓Pi
↑�onc
All
See figure 2-13
See figure 2-7
See figure 2-14
AT1
DA1
~
α Renalnerves
+
+
+
–
–
+
+
FIGURE 2-15
Cellular mechanisms and regulation of sodium chloride (NaCl) andvolume reabsorption along the proximal tubule. The sodium-potas-sium adenosine triphosphate (Na-K ATPase) pump (shown aswhite circle with light blue outline) at the basolateral cell mem-brane keeps the intracellular Na concentration low; the K concen-tration high; and the cell membrane voltage oriented with the cellinterior negative, relative to the exterior. Many pathways partici-pate in Na entry across the luminal membrane. Only the sodium-hydrogen (Na-H) exchanger is shown because its regulation instates of volume excess and depletion has been characterized exten-sively. Activity of the Na-H exchanger is increased by stimulationof renal nerves, acting by way of � receptors and by increased lev-els of circulating angiotensin II (AII), as shown in Figures 2-7 and 2-13 [25–28]. Increased levels of dopamine (DA1) act to inhibitactivity of the Na-H exchanger [29,30]. Dopamine also acts toinhibit activity of the Na-K ATPase pump at the basolateral cellmembrane [30]. As described in Figure 2-14, increases in the filtra-tion fraction (FF) lead to increases in oncotic pressure (�onc) in per-itubular capillaries and decreases in peritubular and interstitialhydrostatic pressure (Pi). These changes increase solute and volumeabsorption and decrease solute backflux. Water flows throughwater channels (Aquaporin-1) Na and Cl also traverse the paracel-lular pathway.
Mechanisms of Sodium and Chloride Transport along the Nephron
2.10 Disorders of Water, Electrolytes, and Acid-Base
0.16 mol NaCl
V2
PR
Interstitum
Cl20-HETE20-COOH-AA
cAMP
Arachidonicacid
K
K2Cl
Na
Na
+ –
Lumen
PGE2
c-P450
?
AVP
H2O
120-
199-
kDA
87-
48-
+
––
–
2K+3Na+
~
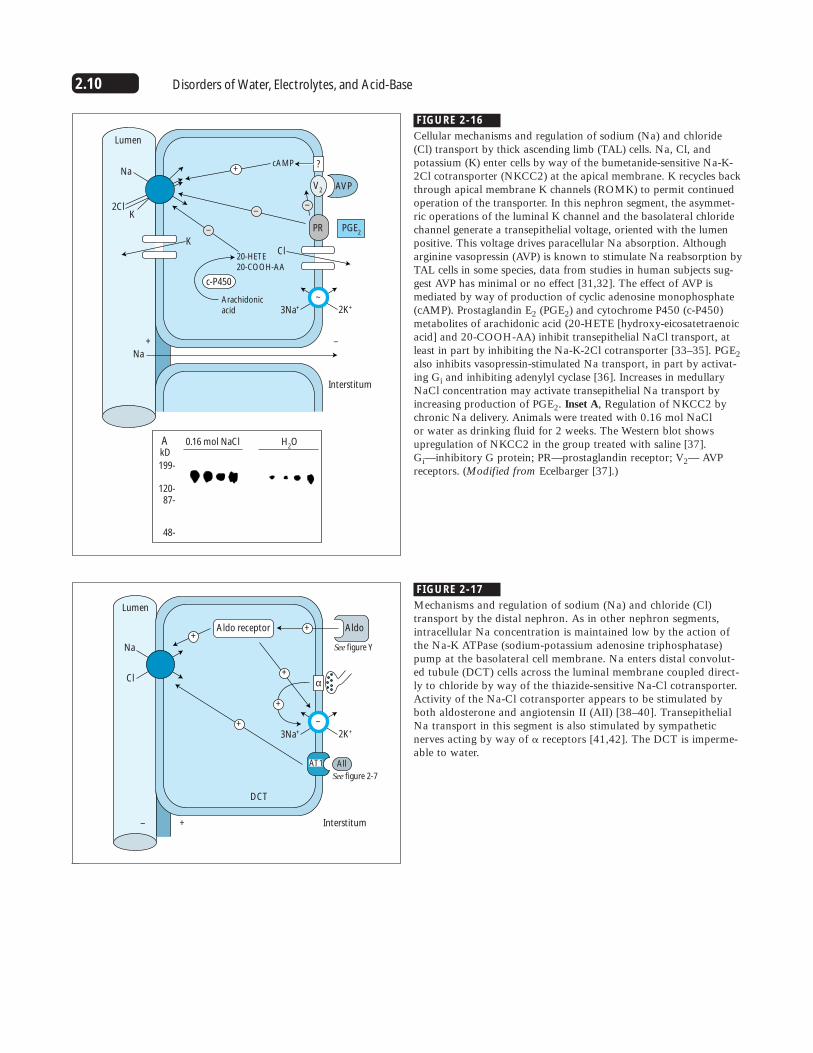
FIGURE 2-16
Cellular mechanisms and regulation of sodium (Na) and chloride(Cl) transport by thick ascending limb (TAL) cells. Na, Cl, andpotassium (K) enter cells by way of the bumetanide-sensitive Na-K-2Cl cotransporter (NKCC2) at the apical membrane. K recycles backthrough apical membrane K channels (ROMK) to permit continuedoperation of the transporter. In this nephron segment, the asymmet-ric operations of the luminal K channel and the basolateral chloridechannel generate a transepithelial voltage, oriented with the lumenpositive. This voltage drives paracellular Na absorption. Althougharginine vasopressin (AVP) is known to stimulate Na reabsorption byTAL cells in some species, data from studies in human subjects sug-gest AVP has minimal or no effect [31,32]. The effect of AVP ismediated by way of production of cyclic adenosine monophosphate(cAMP). Prostaglandin E2 (PGE2) and cytochrome P450 (c-P450)metabolites of arachidonic acid (20-HETE [hydroxy-eicosatetraenoicacid] and 20-COOH-AA) inhibit transepithelial NaCl transport, atleast in part by inhibiting the Na-K-2Cl cotransporter [33–35]. PGE2also inhibits vasopressin-stimulated Na transport, in part by activat-ing Gi and inhibiting adenylyl cyclase [36]. Increases in medullaryNaCl concentration may activate transepithelial Na transport byincreasing production of PGE2. Inset A, Regulation of NKCC2 bychronic Na delivery. Animals were treated with 0.16 mol NaCl or water as drinking fluid for 2 weeks. The Western blot showsupregulation of NKCC2 in the group treated with saline [37]. Gi—inhibitory G protein; PR—prostaglandin receptor; V2— AVPreceptors. (Modified from Ecelbarger [37].)
Interstitum
Na
Cl
Lumen
See figure Y
See figure 2-7
α
DCT
– +
AldoAldo receptor ++
+
+
+
AllAT1
2K+3Na+
~
FIGURE 2-17
Mechanisms and regulation of sodium (Na) and chloride (Cl)transport by the distal nephron. As in other nephron segments,intracellular Na concentration is maintained low by the action ofthe Na-K ATPase (sodium-potassium adenosine triphosphatase)pump at the basolateral cell membrane. Na enters distal convolut-ed tubule (DCT) cells across the luminal membrane coupled direct-ly to chloride by way of the thiazide-sensitive Na-Cl cotransporter.Activity of the Na-Cl cotransporter appears to be stimulated byboth aldosterone and angiotensin II (AII) [38–40]. TransepithelialNa transport in this segment is also stimulated by sympatheticnerves acting by way of � receptors [41,42]. The DCT is imperme-able to water.

2.11Disorders of Sodium Balance
H2O
InterstitumLumen
CCT –
– +
+
cAMP
Na
K
V2
AC
R
AVP
AldoAldo receptor ++
+
+
+
Gs
Gi
PGE2
α
ATP
2K+3Na+
~
MCT
PGE2
cGMP
↑GFR
Na
NaNa
Na Na
Na
Na
H2O
Lumen
–
–
+ V2 AVP
ANPARGC
2K+3Na+
~
FIGURE 2-18
Principal cortical collecting tubule (CCT) cells. In these cells, sodi-um (Na) enters across the luminal membrane through Na channels(ENaC). The movement of cationic Na from lumen to cell depolar-izes the luminal membrane, generating a transepithelial electricalgradient oriented with the lumen negative with respect to intersti-tium. This electrical gradient permits cationic potassium (K) to dif-fuse preferentially from cell to lumen through K channels(ROMK). Na transport is stimulated when aldosterone interactswith its intracellular receptor [43]. This effect involves bothincreases in the number of Na channels at the luminal membraneand increases in the number of Na-K ATPase (Sodium-potassiumadenosine triphosphatase) pumps at the basolateral cell membrane.Arginine vasopressin (AVP) stimulates both Na absorption (byinteracting with V2 receptors and, perhaps, V1 receptors) andwater transport (by interacting with V2 receptors) [44–46]. V2receptor stimulation leads to insertion of water channels (aquapor-in 2) into the luminal membrane [47]. V2 receptor stimulation ismodified by PGE2 and �2 agonists that interact with a receptorthat stimulates Gi [48]. AC—adenylyl cyclase; ATP—adenosinetriphosphate; cAMP—cyclic adenosine monophosphate; CCT—cor-tical collecting tubule; Gi—inhibitory G protein; Gs—stimulatory G protein; R—Ri receptor.
FIGURE 2-19
Cellular mechanism of the medullary collecting tubule (MCT).Sodium (Na) and water are reabsorbed along the MCT. Atrial natri-uretic peptide (ANP) is the best-characterized hormone that affectsNa absorption along this segment [22]. Data on the effects of argi-nine vasopressin (AVP) and aldosterone are not as consistent[46,49]. Prostaglandin E2 (PGE2) inhibits Na transport by innermedullary collecting duct cells and may be an important intracellu-lar mediator for the actions of endothelin and interleukin-1 [50,51].ANP inhibits medullary Na transport by interacting with a G-pro-tein–coupled receptor that generates cyclic guanosine monophos-phate (cGMP). This second messenger inhibits a luminal Na channelthat is distinct from the Na channel expressed by the principal cellsof the cortical collecting tubule, as shown in Figure 2-18 [52,53].Under normal circumstances, ANP also increases the glomerular fil-tration rate (GFR) and inhibits Na transport by way of the effectson the renin-angiotensin-aldosterone axis, as shown in Figures 2-7to 2-10. These effects increase Na delivery to the MCT. The combi-nation of increased distal Na delivery and inhibited distal reabsorp-tion leads to natriuresis. In patients with congestive heart failure,distal Na delivery remains depressed despite high levels of circulat-ing ANP. Thus, inhibition of apical Na entry does not lead to natri-uresis, despite high levels of MCT cGMP. AR—ANP receptor;GC—guanylyl cyclase; K—potassium; V2—receptors.
2.12 Disorders of Water, Electrolytes, and Acid-Base
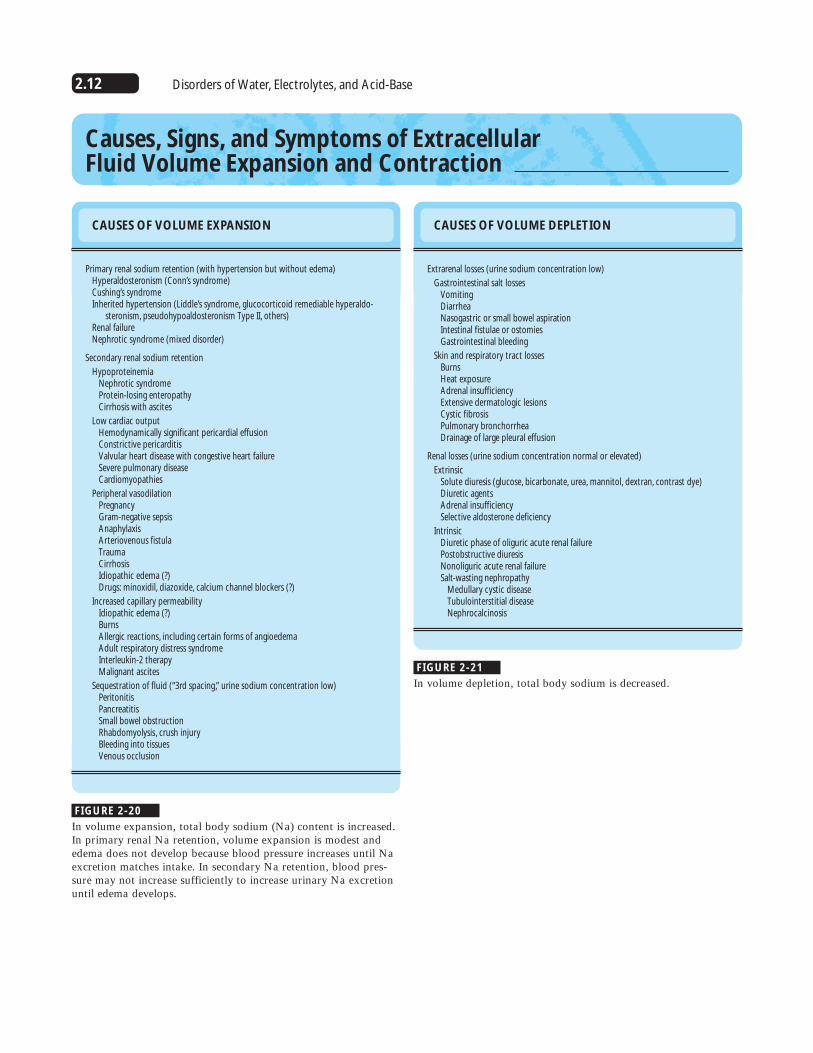
Causes, Signs, and Symptoms of Extracellular Fluid Volume Expansion and Contraction
CAUSES OF VOLUME EXPANSION
Primary renal sodium retention (with hypertension but without edema)Hyperaldosteronism (Conn’s syndrome)Cushing’s syndromeInherited hypertension (Liddle’s syndrome, glucocorticoid remediable hyperaldo-
steronism, pseudohypoaldosteronism Type II, others)Renal failureNephrotic syndrome (mixed disorder)
Secondary renal sodium retention
HypoproteinemiaNephrotic syndromeProtein-losing enteropathyCirrhosis with ascites
Low cardiac outputHemodynamically significant pericardial effusionConstrictive pericarditisValvular heart disease with congestive heart failureSevere pulmonary diseaseCardiomyopathies
Peripheral vasodilationPregnancyGram-negative sepsisAnaphylaxisArteriovenous fistulaTraumaCirrhosisIdiopathic edema (?)Drugs: minoxidil, diazoxide, calcium channel blockers (?)
Increased capillary permeabilityIdiopathic edema (?)BurnsAllergic reactions, including certain forms of angioedemaAdult respiratory distress syndromeInterleukin-2 therapyMalignant ascites
Sequestration of fluid (“3rd spacing,” urine sodium concentration low)PeritonitisPancreatitisSmall bowel obstructionRhabdomyolysis, crush injuryBleeding into tissuesVenous occlusion
FIGURE 2-20
In volume expansion, total body sodium (Na) content is increased.In primary renal Na retention, volume expansion is modest andedema does not develop because blood pressure increases until Naexcretion matches intake. In secondary Na retention, blood pres-sure may not increase sufficiently to increase urinary Na excretionuntil edema develops.
CAUSES OF VOLUME DEPLETION
Extrarenal losses (urine sodium concentration low)
Gastrointestinal salt lossesVomitingDiarrheaNasogastric or small bowel aspirationIntestinal fistulae or ostomiesGastrointestinal bleeding
Skin and respiratory tract lossesBurnsHeat exposureAdrenal insufficiencyExtensive dermatologic lesionsCystic fibrosisPulmonary bronchorrheaDrainage of large pleural effusion
Renal losses (urine sodium concentration normal or elevated)
ExtrinsicSolute diuresis (glucose, bicarbonate, urea, mannitol, dextran, contrast dye)Diuretic agentsAdrenal insufficiencySelective aldosterone deficiency
IntrinsicDiuretic phase of oliguric acute renal failurePostobstructive diuresisNonoliguric acute renal failureSalt-wasting nephropathy
Medullary cystic diseaseTubulointerstitial diseaseNephrocalcinosis
FIGURE 2-21
In volume depletion, total body sodium is decreased.
2.13Disorders of Sodium Balance
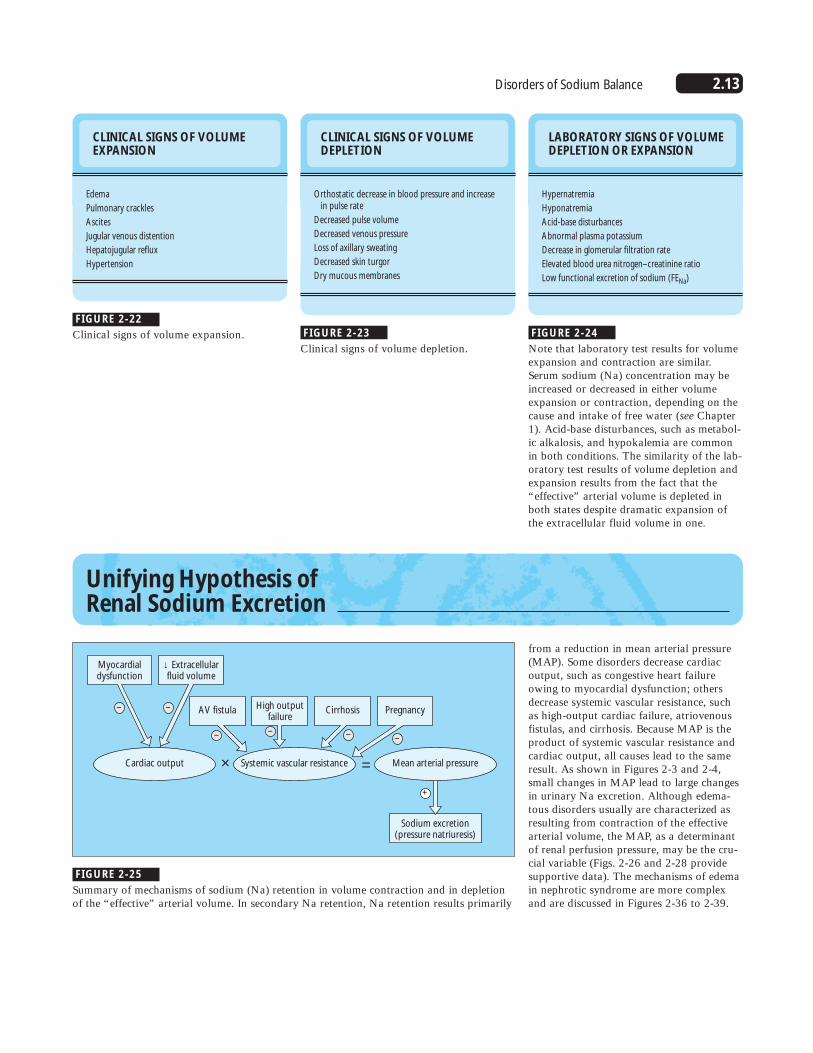
CLINICAL SIGNS OF VOLUMEEXPANSION
Edema
Pulmonary crackles
Ascites
Jugular venous distention
Hepatojugular reflux
Hypertension
CLINICAL SIGNS OF VOLUMEDEPLETION
Orthostatic decrease in blood pressure and increasein pulse rate
Decreased pulse volume
Decreased venous pressure
Loss of axillary sweating
Decreased skin turgor
Dry mucous membranes
LABORATORY SIGNS OF VOLUMEDEPLETION OR EXPANSION
Hypernatremia
Hyponatremia
Acid-base disturbances
Abnormal plasma potassium
Decrease in glomerular filtration rate
Elevated blood urea nitrogen–creatinine ratio
Low functional excretion of sodium (FENa)
FIGURE 2-22
Clinical signs of volume expansion. FIGURE 2-23
Clinical signs of volume depletion. FIGURE 2-24
Note that laboratory test results for volumeexpansion and contraction are similar.Serum sodium (Na) concentration may beincreased or decreased in either volumeexpansion or contraction, depending on thecause and intake of free water (see Chapter1). Acid-base disturbances, such as metabol-ic alkalosis, and hypokalemia are commonin both conditions. The similarity of the lab-oratory test results of volume depletion andexpansion results from the fact that the“effective” arterial volume is depleted inboth states despite dramatic expansion ofthe extracellular fluid volume in one.
Unifying Hypothesis of Renal Sodium Excretion
Sodium excretion(pressure natriuresis)
AV fistula Cirrhosis PregnancyHigh outputfailure
Myocardialdysfunction
Cardiac output Systemic vascular resistance
+
––
––
– –
× = Mean arterial pressure
↓ Extracellularfluid volume
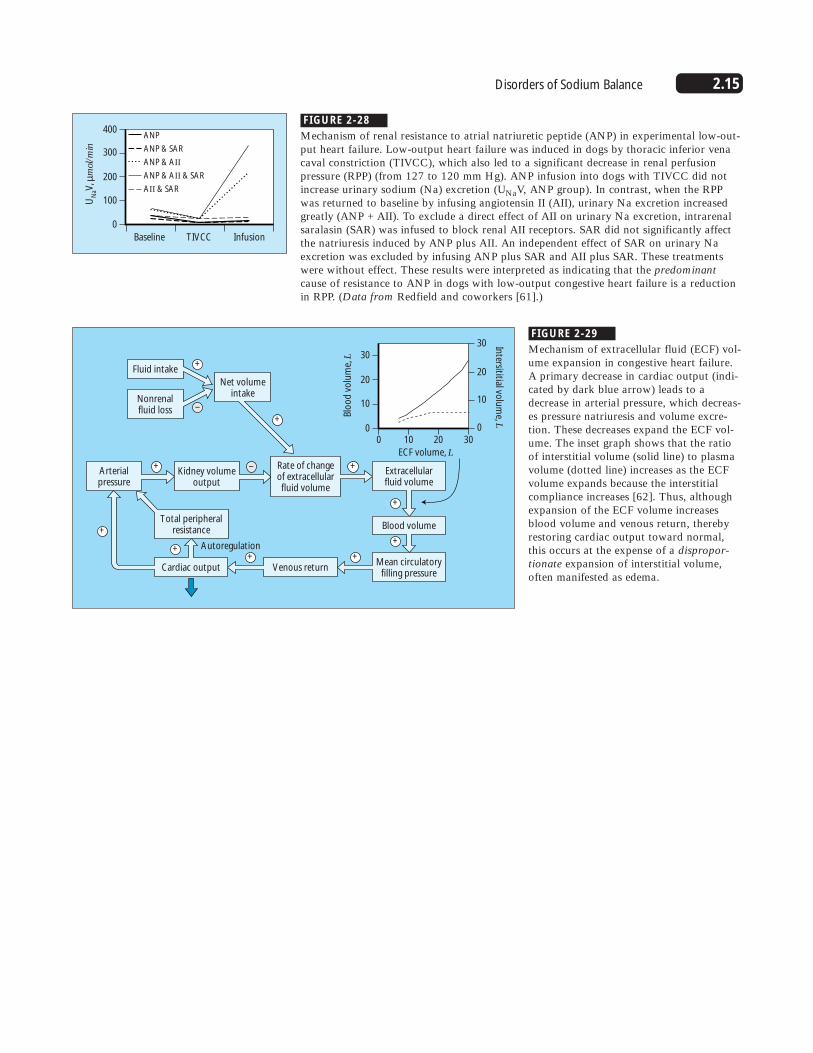
from a reduction in mean arterial pressure(MAP). Some disorders decrease cardiacoutput, such as congestive heart failureowing to myocardial dysfunction; othersdecrease systemic vascular resistance, suchas high-output cardiac failure, atriovenousfistulas, and cirrhosis. Because MAP is theproduct of systemic vascular resistance andcardiac output, all causes lead to the sameresult. As shown in Figures 2-3 and 2-4,small changes in MAP lead to large changesin urinary Na excretion. Although edema-tous disorders usually are characterized asresulting from contraction of the effectivearterial volume, the MAP, as a determinantof renal perfusion pressure, may be the cru-cial variable (Figs. 2-26 and 2-28 providesupportive data). The mechanisms of edemain nephrotic syndrome are more complexand are discussed in Figures 2-36 to 2-39.
FIGURE 2-25
Summary of mechanisms of sodium (Na) retention in volume contraction and in depletionof the “effective” arterial volume. In secondary Na retention, Na retention results primarily

2.14 Disorders of Water, Electrolytes, and Acid-Base
Mechanisms of Extracellular Fluid Volume Expansion in Congestive Heart Failure
Mea
n a
rter
ial p
ress
ure
, mm
Hg
130
125
120
115
110
105
100
95
90
AControl
MI
AVF
Small MI Large MIAVF
Mea
n a
rter
ial p
ress
ure
, mm
Hg
130
125
120
115
110
105
100
95
90
B Cirrhosis
Control
J Lab Clin Med 1978
Am J Physiol 1977
Balance Na Ret. Ascites
FIGURE 2-26
Role of renal perfusion pressure in sodium (Na) retention. A, Resultsfrom studies in rats that had undergone myocardial infarction (MI) orplacement of an arteriovenous fistula (AVF) [54]. Rats with small andlarge MIs were identified. Both small and large MIs induced signifi-cant Na retention when challenged with Na loads. Renal Na retentionoccurred in the setting of mild hypotension. AVF also induced signifi-cant Na retention, which was associated with a decrease in mean arte-rial pressure (MAP) [55,56]. Figure 2-3 has shown that Na excretiondecreases greatly for each mm Hg decrease in MAP. B, Results of twogroups of experiments performed by Levy and Allotey [57,58] in
which experimental cirrhosis was induced in dogs by sporadic feedingwith dimethylnitrosamine. Three cirrhotic stages were identified basedon the pattern of Na retention. In the first, dietary Na intake was bal-anced by Na excretion. In the second, renal Na retention began, butstill without evidence of ascites or edema. In the last, ascites weredetected. Because Na was retained before the appearance of ascites,“primary” renal Na retention was inferred. An alternative interpreta-tion of these data suggests that the modest decrease in MAP is respon-sible for Na retention in this model. Note that in both heart failureand cirrhosis, Na retention correlates with a decline in MAP.
Days
-5 0 5 10 15 20 25 30 35 40
10UNaV
ANP
MAP
PRA 8
6
4
2
0
600
500
400
300
200
100
0
UN
aV, m
mol
/d o
r p
lasm
a A
NP
, pg/
mL
or
MA
P, m
mH
g;
PR
A, ng A
NG
I mL
-1•h-1
FIGURE 2-27
Mechanism of sodium (Na) retention in high-output cardiac failure.Effects of high-output heart failure induced in dogs by arteriovenous(AV) fistula [59]. After induction of an AV fistula (day 0), plasmarenin activity (PRA; thick solid line) increased greatly, correlatingtemporally with a reduction in urinary Na excretion (UNaV; thinsolid line). During this period, mean arterial pressure (MAP; dottedline) declined modestly. After day 5, the plasma atrial natriureticpeptide concentration (ANP; dashed line) increased because of vol-ume expansion, returning urinary Na excretion to baseline levels.Thus, Na retention, mediated in part by the renin-angiotensin-aldos-terone system, led to volume expansion. The volume expansion sup-pressed the renin-angiotensin-aldosterone system and stimulatedANP secretion, thereby returning Na excretion to normal. Theseexperiments suggest that ANP secretion plays an important role inmaintaining Na excretion in compensated congestive heart failure.This effect of ANP has been confirmed directly in experiments usinganti-ANP antibodies [60]. AI—angiotensin I.
2.15Disorders of Sodium Balance
Baseline TIVCC Infusion
400
300
ANP
ANP & SAR
ANP & AII
ANP & AII & SAR
AII & SAR
200
100
0
UN
aV, µ
mol
/min
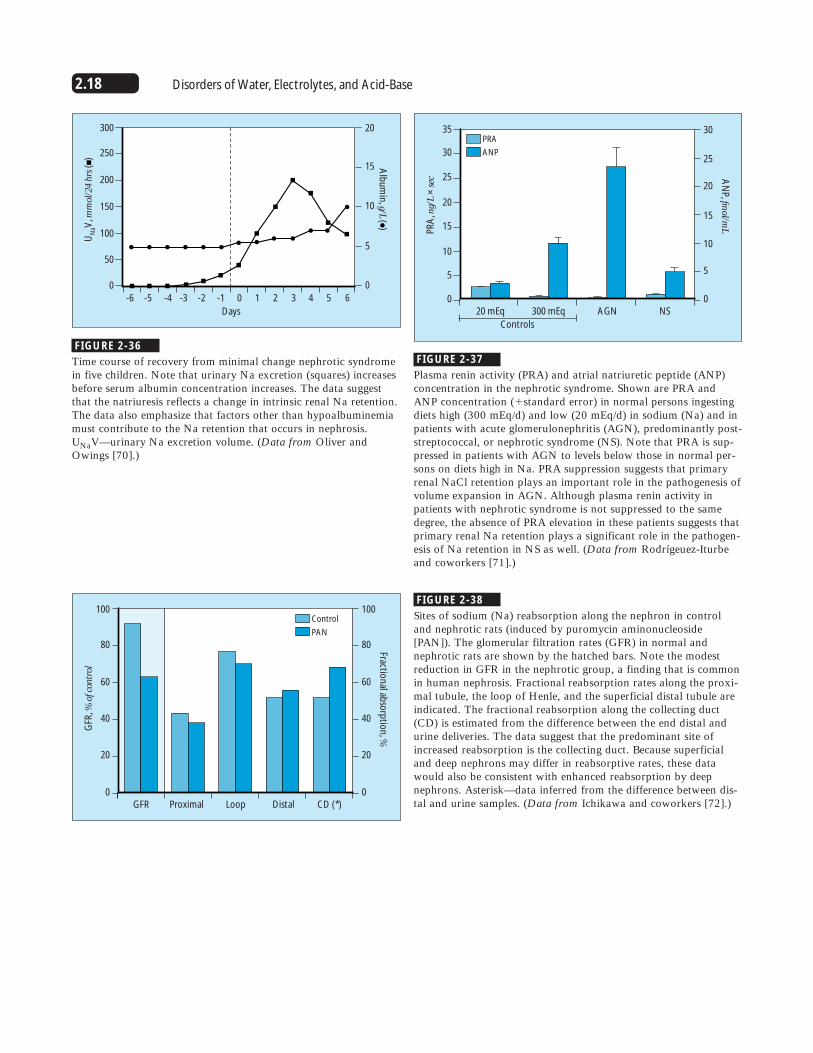
FIGURE 2-28
Mechanism of renal resistance to atrial natriuretic peptide (ANP) in experimental low-out-put heart failure. Low-output heart failure was induced in dogs by thoracic inferior venacaval constriction (TIVCC), which also led to a significant decrease in renal perfusionpressure (RPP) (from 127 to 120 mm Hg). ANP infusion into dogs with TIVCC did notincrease urinary sodium (Na) excretion (UNaV, ANP group). In contrast, when the RPPwas returned to baseline by infusing angiotensin II (AII), urinary Na excretion increasedgreatly (ANP + AII). To exclude a direct effect of AII on urinary Na excretion, intrarenalsaralasin (SAR) was infused to block renal AII receptors. SAR did not significantly affectthe natriuresis induced by ANP plus AII. An independent effect of SAR on urinary Naexcretion was excluded by infusing ANP plus SAR and AII plus SAR. These treatmentswere without effect. These results were interpreted as indicating that the predominantcause of resistance to ANP in dogs with low-output congestive heart failure is a reductionin RPP. (Data from Redfield and coworkers [61].)
Blo
od
vo
lum
e, L
Intersititial vo
lum
e, L
30
20
10
0
30
20
10
03020100
ECF volume, L
Nonrenalfluid loss
Arterialpressure
Kidney volumeoutput
Extracellularfluid volume
Blood volume
Mean circulatoryfilling pressure
Total peripheralresistance
Net volumeintake
Fluid intake
Venous returnCardiac output
Autoregulation
Rate of changeof extracellular
fluid volume
+
+
++
+
+
+
+
+
+
–
–
FIGURE 2-29
Mechanism of extracellular fluid (ECF) vol-ume expansion in congestive heart failure.A primary decrease in cardiac output (indi-cated by dark blue arrow) leads to adecrease in arterial pressure, which decreas-es pressure natriuresis and volume excre-tion. These decreases expand the ECF vol-ume. The inset graph shows that the ratioof interstitial volume (solid line) to plasmavolume (dotted line) increases as the ECFvolume expands because the interstitialcompliance increases [62]. Thus, althoughexpansion of the ECF volume increasesblood volume and venous return, therebyrestoring cardiac output toward normal,this occurs at the expense of a dispropor-tionate expansion of interstitial volume,often manifested as edema.

2.16 Disorders of Water, Electrolytes, and Acid-Base
Mechanisms of Extracellular Fluid Volume Expansion in Cirrhosis
UNaV
SVR
Underfill theory
Hepatic venousoutflow obstruction
↓ Blood volume
Transudation
Hepatic venousoutflow obstruction
↑ ECF volume
Transudation
Vasodilation theory Overflow theory
–
– ?
?
+
+
–
+
–
Renin
FIGURE 2-30
Three theories of ascites formation in hepatic cirrhosis. Hepaticvenous outflow obstruction leads to portal hypertension.According to the underfill theory, transudation from the liver leadsto reduction of the blood volume, thereby stimulating sodium (Na)retention by the kidney. As indicated by the question mark near theterm blood volume, a low blood volume is rarely detected in clini-cal or experimental cirrhosis. Furthermore, this theory predicts thatascites would develop before renal Na retention, when the reversegenerally occurs. According to the overflow theory, increased por-tal pressure stimulates renal Na retention through incompletelydefined mechanisms. As indicated by the question mark near thearrow from hepatic venous outflow obstruction to UNaV, thenature of the portal hypertension–induced signals for renal Naretention remains unclear. The vasodilation theory suggests thatportal hypertension leads to vasodilation and relative arterialhypotension. Evidence for vasodilation in cirrhosis that precedesrenal Na retention is now convincing, as shown in Figures 2-31and 2-33 [63].
Nitric oxideGlucagon
CGRPANPVIP
Substance PProstaglandin E2
EncephalinsTNF
Andrenomedullin
SNSRAAS
VasopressinET-1
Vasodilators Vasoconstrictors
C.O.=5.22 L/min C.O.=6.41 L/min
3.64 L 4.34 L
1.81 L
Control subjects, n=16
A BCirrhotic patients, n=60
Noncentralblood volume
Central bloodvolume
1.31 L
Central bloodvolume
Noncentralblood volume
FIGURE 2-31
Alterations in cardiovascular hemodynamics in hepatic cirrhosis. Hepatic dysfunction andportal hypertension increase the production and impair the metabolism of several vasoac-tive substances. The overall balance of vasoconstriction and vasodilation shifts in favor ofdilation. Vasodilation may also shift blood away from the central circulation toward theperiphery and away from the kidneys. Some of the vasoactive substances postulated toparticipate in the hemodynamic disturbances of cirrhosis include those shown here. ANP—atrial natrivretic peptide; ET-1—endothelin-1; CGRP—calcitonin gene related peptide; RAAS—renin/angiotensin/aldosterone system; TNF—tumor necrosis factor; VIP— vasoactive intestinal peptide. (Data from Møller and Henriksen [64].)
FIGURE 2-32
Effects of cirrhosis on central and noncentral blood volumes. The central blood volume isdefined as the blood volume in the heart, lungs, and central arterial tree. Compared withcontrol subjects (A), patients with cirrhosis (B) have decreased central and increased non-central blood volumes. The higher cardiac output (CO) results from peripheral vasodila-tion. Perfusion of the kidney is reduced significantly in patients with cirrhosis. (Data fromHillarp and coworkers [65].)

2.17Disorders of Sodium Balance
PRA AVP UNa
V
15
10
5
0
PR
A, n
g/m
in/h
or
AV
P, p
g/m
L
15Control
Cirrhosis
Cirrhosis & L-name
10
5
0
UN
a V, m
mol/d
FIGURE 2-33
Contribution of nitric oxide to vasodilation and sodium (Na)retention in cirrhosis. Compared with control rats, rats having cir-rhosis induced by carbon tetrachloride and phenobarbital exhibitedincreased plasma renin activity (PRA) and plasma arginine vaso-pressin (AVP) concentrations. At steady state, the urinary Na excre-tion (UNaV) was similar in both groups. After treatment with L-NAME for 7 days, plasma renin activity decreased to normal lev-els, AVP concentrations decreased toward normal levels, andurinary Na excretion increased by threefold. These changes wereassociated with a normalization of mean arterial pressure and car-diac output. (Data compiled from Niederberger and coworkers[66,67] and Martin and Schrier [68].)
Blo
od
vo
lum
e, L
Intersititial vo
lum
e, L(w
ith lo
w alb
um
in)
30
20
10
0
30
20
10
03020100
ECF volume, L
Nonrenalfluid loss
Arterialpressure
Kidney volumeoutput
Extracellularfluid volume
Mean circulatoryfilling pressure
Peripheralblood volume
Centralblood volume
Total peripheralresistance
Net volumeintake
Fluid intake
Venous returnCardiac output
Rate of changeof extracellular
fluid volume
+
++
+
+
+
+
+
+
–
–
FIGURE 2-34
Mechanisms of sodium (Na) retention incirrhosis. A primary decrease in systemicvascular resistance (indicated by dark bluearrow), induced by mediators shown inFigure 2-31, leads to a decrease in arterialpressure. The reduction in systemic vascularresistance, however, is not uniform andfavors movement of blood from the central(“effective”) circulation into the peripheralcirculation, as shown in Figure 2-32.Hypoalbuminemia shifts the interstitial toblood volume ratio upward (compare theinterstitial volume with normal [dashedline], and low [solid line], protein levels inthe inset graph). Because cardiac outputincreases and venous return must equal car-diac output, dramatic expansion of theextracellular fluid (ECF) volume occurs.
Mechanisms of Extracellular Fluid Volume Expansion in Nephrotic Syndrome
Plasma protein concentration, g/dL
0 2 4 6 8
�C
- �
i, mm
Hg
14
12
10
8
6
4
2
FIGURE 2-35
Changes in plasma protein concentration affect the net oncotic pressure difference acrosscapillaries (�c - �i) in humans. Note that moderate reductions in plasma protein concen-tration have little effect on differences in transcapillary oncotic pressure. Only when plas-ma protein concentration decreases below 5 g/dL do changes become significant. (Datafrom Fadnes and coworkers [69].)
2.18 Disorders of Water, Electrolytes, and Acid-Base
Days
-6 -5 -4 -3 -2 -1 0 1 2 3 4 5 6
20
15
10
5
0
300
250
200
100
50
150
0
UN
aV, m
mol
/24
hrs
( )
Alb
um
in, g/L ( )
20 mEq
Controls
300 mEq AGN NS
35
30
25
20
15
10
5
0
30
25
20
15
10
5
0
PR
A, n
g/L
× se
c AN
P, fm
ol/mL
PRA
ANP
GFR Proximal DistalLoop CD (*)
100
80
60
40
20
80
60
40
20
0
100
0
GFR
, % o
f con
trol
Fraction
al abso
rptio
n, %
Control
PAN
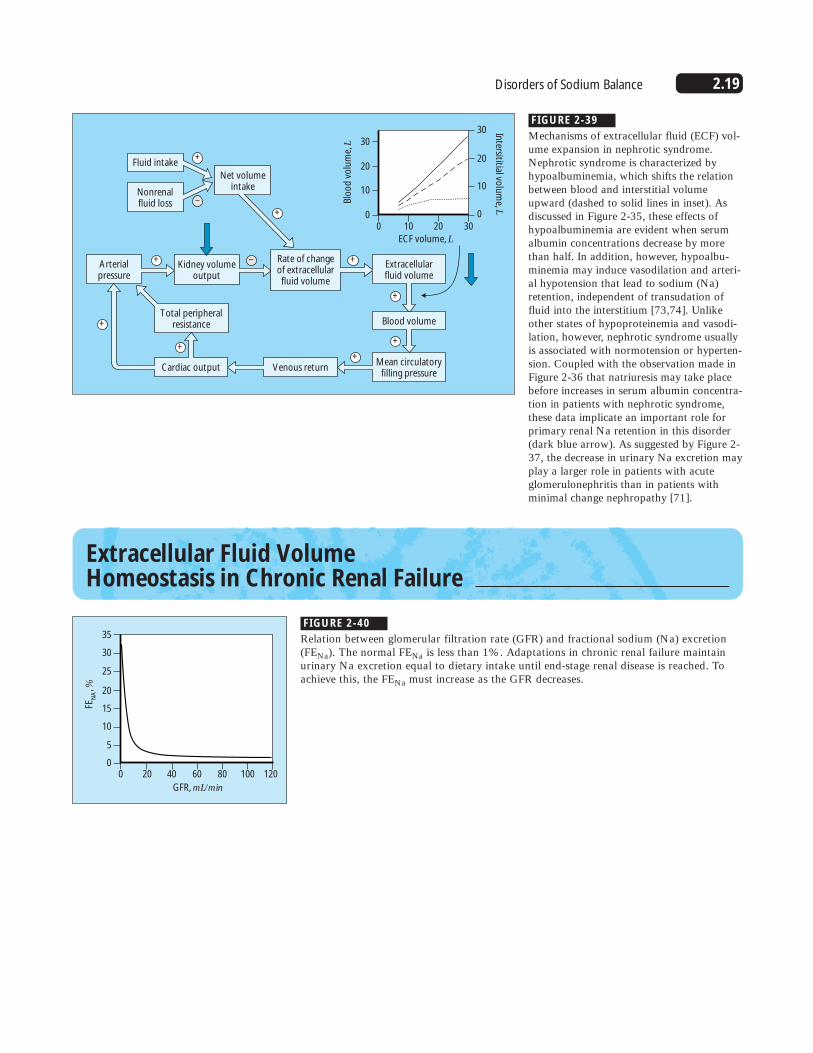
FIGURE 2-36
Time course of recovery from minimal change nephrotic syndromein five children. Note that urinary Na excretion (squares) increasesbefore serum albumin concentration increases. The data suggestthat the natriuresis reflects a change in intrinsic renal Na retention.The data also emphasize that factors other than hypoalbuminemiamust contribute to the Na retention that occurs in nephrosis.UNaV—urinary Na excretion volume. (Data from Oliver andOwings [70].)
FIGURE 2-37
Plasma renin activity (PRA) and atrial natriuretic peptide (ANP)concentration in the nephrotic syndrome. Shown are PRA andANP concentration (�standard error) in normal persons ingestingdiets high (300 mEq/d) and low (20 mEq/d) in sodium (Na) and inpatients with acute glomerulonephritis (AGN), predominantly post-streptococcal, or nephrotic syndrome (NS). Note that PRA is sup-pressed in patients with AGN to levels below those in normal per-sons on diets high in Na. PRA suppression suggests that primaryrenal NaCl retention plays an important role in the pathogenesis ofvolume expansion in AGN. Although plasma renin activity inpatients with nephrotic syndrome is not suppressed to the samedegree, the absence of PRA elevation in these patients suggests thatprimary renal Na retention plays a significant role in the pathogen-esis of Na retention in NS as well. (Data from Rodrígeuez-Iturbeand coworkers [71].)
FIGURE 2-38
Sites of sodium (Na) reabsorption along the nephron in controland nephrotic rats (induced by puromycin aminonucleoside[PAN]). The glomerular filtration rates (GFR) in normal andnephrotic rats are shown by the hatched bars. Note the modestreduction in GFR in the nephrotic group, a finding that is commonin human nephrosis. Fractional reabsorption rates along the proxi-mal tubule, the loop of Henle, and the superficial distal tubule areindicated. The fractional reabsorption along the collecting duct(CD) is estimated from the difference between the end distal andurine deliveries. The data suggest that the predominant site ofincreased reabsorption is the collecting duct. Because superficialand deep nephrons may differ in reabsorptive rates, these datawould also be consistent with enhanced reabsorption by deepnephrons. Asterisk—data inferred from the difference between dis-tal and urine samples. (Data from Ichikawa and coworkers [72].)
2.19Disorders of Sodium Balance
Blo
od
vo
lum
e, L
Intersititial vo
lum
e, L
30
20
10
0
30
20
10
03020100
ECF volume, L
Nonrenalfluid loss
Arterialpressure
Kidney volumeoutput
Extracellularfluid volume
Blood volume
Mean circulatoryfilling pressure
Total peripheralresistance
Net volumeintake
Fluid intake
Venous returnCardiac output
Rate of changeof extracellular
fluid volume
+
+
+
+
+
+
+
+
+
–
–
FIGURE 2-39
Mechanisms of extracellular fluid (ECF) vol-ume expansion in nephrotic syndrome.Nephrotic syndrome is characterized byhypoalbuminemia, which shifts the relationbetween blood and interstitial volumeupward (dashed to solid lines in inset). Asdiscussed in Figure 2-35, these effects ofhypoalbuminemia are evident when serumalbumin concentrations decrease by morethan half. In addition, however, hypoalbu-minemia may induce vasodilation and arteri-al hypotension that lead to sodium (Na)retention, independent of transudation offluid into the interstitium [73,74]. Unlikeother states of hypoproteinemia and vasodi-lation, however, nephrotic syndrome usuallyis associated with normotension or hyperten-sion. Coupled with the observation made inFigure 2-36 that natriuresis may take placebefore increases in serum albumin concentra-tion in patients with nephrotic syndrome,these data implicate an important role forprimary renal Na retention in this disorder(dark blue arrow). As suggested by Figure 2-37, the decrease in urinary Na excretion mayplay a larger role in patients with acuteglomerulonephritis than in patients withminimal change nephropathy [71].
Extracellular Fluid Volume Homeostasis in Chronic Renal Failure
GFR, mL/min
0 20 40 60 80 100 120
FEN
A, %
35
30
25
20
15
5
10
0
FIGURE 2-40
Relation between glomerular filtration rate (GFR) and fractional sodium (Na) excretion(FENa). The normal FENa is less than 1%. Adaptations in chronic renal failure maintainurinary Na excretion equal to dietary intake until end-stage renal disease is reached. Toachieve this, the FENa must increase as the GFR decreases.
2.20 Disorders of Water, Electrolytes, and Acid-Base
Days
0 5 10 15 20 25
15
14
13
12
11
10
9
8
7
5
6
4
3
2
1
18
17
15
16
13
14
12
11
10
ECF
volu
me,
L
Dietary so
diu
m in
take, g
Normal
Mild CRF
Severe CRF
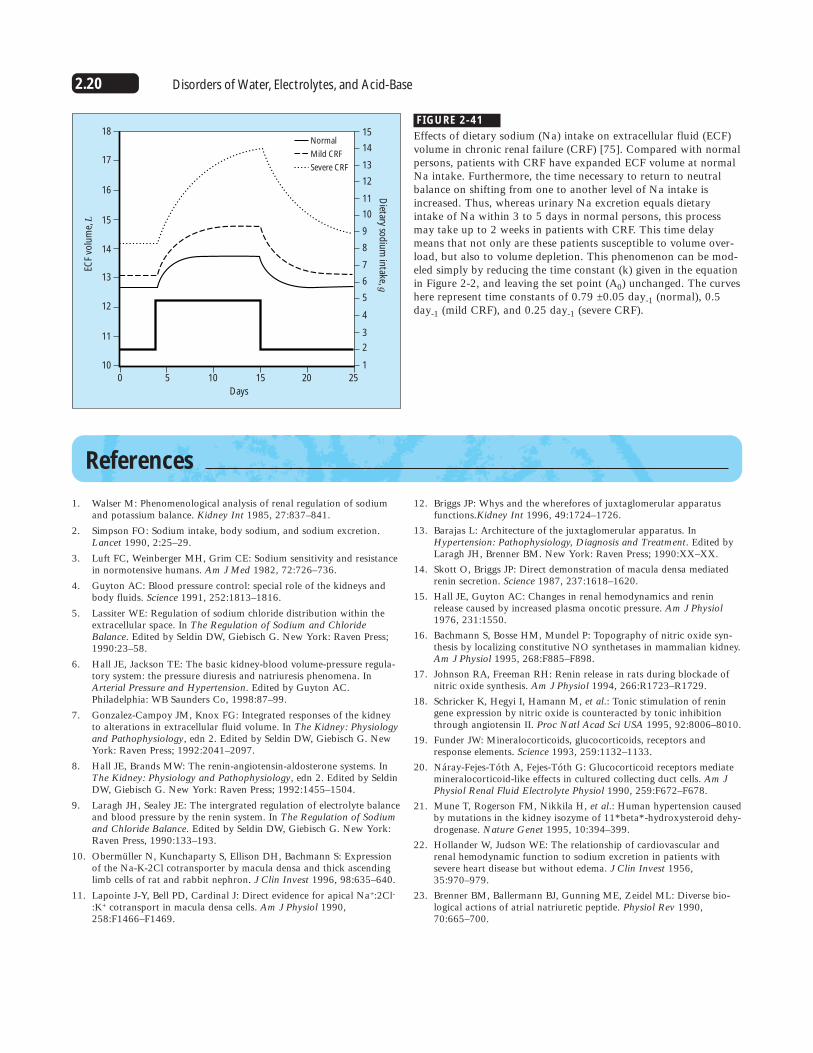
FIGURE 2-41
Effects of dietary sodium (Na) intake on extracellular fluid (ECF)volume in chronic renal failure (CRF) [75]. Compared with normalpersons, patients with CRF have expanded ECF volume at normalNa intake. Furthermore, the time necessary to return to neutralbalance on shifting from one to another level of Na intake isincreased. Thus, whereas urinary Na excretion equals dietaryintake of Na within 3 to 5 days in normal persons, this processmay take up to 2 weeks in patients with CRF. This time delaymeans that not only are these patients susceptible to volume over-load, but also to volume depletion. This phenomenon can be mod-eled simply by reducing the time constant (k) given in the equationin Figure 2-2, and leaving the set point (A0) unchanged. The curveshere represent time constants of 0.79 ±0.05 day-1 (normal), 0.5day-1 (mild CRF), and 0.25 day-1 (severe CRF).
References
1. Walser M: Phenomenological analysis of renal regulation of sodiumand potassium balance. Kidney Int 1985, 27:837–841.
2. Simpson FO: Sodium intake, body sodium, and sodium excretion.Lancet 1990, 2:25–29.
3. Luft FC, Weinberger MH, Grim CE: Sodium sensitivity and resistancein normotensive humans. Am J Med 1982, 72:726–736.
4. Guyton AC: Blood pressure control: special role of the kidneys andbody fluids. Science 1991, 252:1813–1816.
5. Lassiter WE: Regulation of sodium chloride distribution within theextracellular space. In The Regulation of Sodium and ChlorideBalance. Edited by Seldin DW, Giebisch G. New York: Raven Press;1990:23–58.
6. Hall JE, Jackson TE: The basic kidney-blood volume-pressure regula-tory system: the pressure diuresis and natriuresis phenomena. InArterial Pressure and Hypertension. Edited by Guyton AC.Philadelphia: WB Saunders Co, 1998:87–99.
7. Gonzalez-Campoy JM, Knox FG: Integrated responses of the kidneyto alterations in extracellular fluid volume. In The Kidney: Physiologyand Pathophysiology, edn 2. Edited by Seldin DW, Giebisch G. NewYork: Raven Press; 1992:2041–2097.
8. Hall JE, Brands MW: The renin-angiotensin-aldosterone systems. InThe Kidney: Physiology and Pathophysiology, edn 2. Edited by SeldinDW, Giebisch G. New York: Raven Press; 1992:1455–1504.
9. Laragh JH, Sealey JE: The intergrated regulation of electrolyte balanceand blood pressure by the renin system. In The Regulation of Sodiumand Chloride Balance. Edited by Seldin DW, Giebisch G. New York:Raven Press, 1990:133–193.
10. Obermüller N, Kunchaparty S, Ellison DH, Bachmann S: Expressionof the Na-K-2Cl cotransporter by macula densa and thick ascendinglimb cells of rat and rabbit nephron. J Clin Invest 1996, 98:635–640.
11. Lapointe J-Y, Bell PD, Cardinal J: Direct evidence for apical Na+:2Cl-:K+ cotransport in macula densa cells. Am J Physiol 1990,258:F1466–F1469.
12. Briggs JP: Whys and the wherefores of juxtaglomerular apparatusfunctions.Kidney Int 1996, 49:1724–1726.
13. Barajas L: Architecture of the juxtaglomerular apparatus. InHypertension: Pathophysiology, Diagnosis and Treatment. Edited byLaragh JH, Brenner BM. New York: Raven Press; 1990:XX–XX.
14. Skott O, Briggs JP: Direct demonstration of macula densa mediatedrenin secretion. Science 1987, 237:1618–1620.
15. Hall JE, Guyton AC: Changes in renal hemodynamics and reninrelease caused by increased plasma oncotic pressure. Am J Physiol1976, 231:1550.
16. Bachmann S, Bosse HM, Mundel P: Topography of nitric oxide syn-thesis by localizing constitutive NO synthetases in mammalian kidney.Am J Physiol 1995, 268:F885–F898.
17. Johnson RA, Freeman RH: Renin release in rats during blockade ofnitric oxide synthesis. Am J Physiol 1994, 266:R1723–R1729.
18. Schricker K, Hegyi I, Hamann M, et al.: Tonic stimulation of reningene expression by nitric oxide is counteracted by tonic inhibitionthrough angiotensin II. Proc Natl Acad Sci USA 1995, 92:8006–8010.
19. Funder JW: Mineralocorticoids, glucocorticoids, receptors andresponse elements. Science 1993, 259:1132–1133.
20. Náray-Fejes-Tóth A, Fejes-Tóth G: Glucocorticoid receptors mediatemineralocorticoid-like effects in cultured collecting duct cells. Am JPhysiol Renal Fluid Electrolyte Physiol 1990, 259:F672–F678.
21. Mune T, Rogerson FM, Nikkila H, et al.: Human hypertension causedby mutations in the kidney isozyme of 11*beta*-hydroxysteroid dehy-drogenase. Nature Genet 1995, 10:394–399.
22. Hollander W, Judson WE: The relationship of cardiovascular andrenal hemodynamic function to sodium excretion in patients withsevere heart disease but without edema. J Clin Invest 1956,35:970–979.
23. Brenner BM, Ballermann BJ, Gunning ME, Zeidel ML: Diverse bio-logical actions of atrial natriuretic peptide. Physiol Rev 1990,70:665–700.
2.21Disorders of Sodium Balance
24. Kishimoto I, Dubois SK, Garbers DL: The heart communicates withthe kidney exclusively through the guanylyl cyclase-A receptor: Acutehandling of sodium and water in response to volume expansion. ProcNatl Acad Sci USA 1996, 93:6215–6219.
25. Korner PI: Integrative neural cardiovascular control. Physiol Rev1971, 51:312–367.
26. Cogan MG: Neurogenic regulation of proximal bicarbonate and chlo-ride reabsorption. Am J Physiol 1986, 250:F22–F26.
27. Geibel J, Giebisch G, Boron WF: Angiotensin II stimulates both Na+-H+ exchange and Na+/HCO-
3 cotransport in the rabbit proximaltubule. Proc Natl Acad Sci USA 1990, 87:7917–7920.
28. Block RD, Zikos D, Fisher KA, et al.: Peterson DR: Activation ofproximal tubular Na+-H+ exchanger by angiotensin II. Am J Physiol1992, 263:F135–F143.
29. Bertorello A, Aperia A: Regulation of Na+-K+-ATPase activity in kid-ney proximal tubules: involvement of GTP binding proteins. Am JPhysiol 1989, 256:F57–F62.
30. Aperia AC: Regulation of sodium transport. Curr Opinion NephrolHypertens 1995, 4:416–420.
31. Bouby N, Bankir L, Trinh-Trang-Tan MM, et al.: Selective ADH-induced hypertrophy of the medullary thick ascending limb inBrattleboro rats. Kidney Int 1985, 28:456–466.
32. Chabardès D, Gagnan-Brunette M, Imbert-Tébol M: Adenylatecyclase responsiveness to hormones in various portions of the humannephron. J Clin Invest 1980, 65:439–448.
33. Stokes JB: Effects of prostaglandin E2 on chloride transport across therabbit thick ascending limb of Henle. J Clin Invest 1979, 64:495–502.
34. Escalante B, Erlij D, Falck JR, McGiff JC: Effect of cytochrome P450arachidonate metabolites on ion transport in rabbit kidney loop ofHenle. Science 1991, 251:799–802.
35. Amlal H, Legoff C, Vernimmen C, et al.: Na(+)-K+(NH4+)-2Cl-cotransport in medullary thick ascending limb: control by PKA, PKC,and 20-HETE. Am J Physiol 1996, 271:C455–C463.
36. Culpepper RM, Adreoli TE: Interactions among prostaglandin E2,antidiuretic hormone and cyclic adenosine monophosphate in modu-lating Cl- absorption in single mouse medullary thick ascending limbsof Henle. J Clin Invest 1983, 71:1588–1601.
37. Ecelbarger CA, Terris J, Hoyer JR, et al.: Localization and regulationof the rat renal Na+-K+-2Cl-, cotransporter, BSC-1. Am J PhysiolRenal Fluid Electrolyte Physiol 1996, 271:F619–F628.
38. Chen Z, Vaughn DA, Blakeley P, Fanestil DD: Adrenocortical steroidsincrease renal thiazide diuretic receptor density and response. J AmSoc Nephrol 1994, 5:1361–1368.
39. Velázquez H, Bartiss A, Bernstein PL, Ellison DH: Adrenal steroidsstimulate thiazide-sensitive NaCl transport by the rat renal distaltubule. Am J Physiol 1996, 39:F211–F219.
40. Wang T, Giebisch G: Effects of angiotensin II on electrolyte transportin the early and late distal tubule in rat kidney. Am J Physiol RenalFluid Electrolyte Physiol 1996, 271:F143–F149.
41. Wang T, Chan YL: Neural control of distal tubular bicarbonate andfluid transport. Am J Physiol 1989, 257:F72–F76.
42. Bencsáth P, Szénási G, Takács L: Water and electrolyte transport inHenle’s loop and distal tubule after renal sympathectomy in the rat.Am J Physiol 1985, 249:F308–F314.
43. Rossier BC, Palmer LG: Mechanisms of aldosterone action on sodiumand potassium transport. In The Kidney: Physiology andPathophysiology, edn 2. Edited by Seldin DW, Giebisch G. New York:Raven Press, 1992:1373–1409.
44. Breyer MD, Ando Y: Hormonal signalling and regulation of salt andwater transport in the collecting duct. Ann Rev Physiol 1994,56:711–739.
45. Schafer JA, Hawk CT: Regulation of Na+ channels in the cortical collect-ing duct by AVP and mineralocorticoids. Int Kidney 1992, 41:255–268.
46. Kudo LH, Van Baak AA, Rocha AS: Effects of vasopressin on sodiumtransport across inner medullary collecting duct. Am J Physiol 1990,258:F1438–F1447.
47. Nielsen S, Chou C-L, Marples D, et al.: Vasopressin increases waterpermeability of kidney collecting duct by inducing translocation ofaquaporin: CD water channels to plasma membrane. Proc Natl AcadSci USA 1995, 92:1013–1017.
48. Schafer JA: Salt and water homeostasis: Is it just a matter of goodbookkeeping? J Am Soc Nephrol 1994, 4:1933–1950.
49. Husted RF, Laplace JR, Stokes JB: Enhancement of electrogenic Na+
transport across rat inner medullary collecting duct cells in culture. J Clin Invest 1990, 86:498–506.
50. Zeidel ML, Jabs K, Kikeri D, Silva P: Kinins inhibit conductive Na+
uptake by rabbit inner medullary collecting duct cells. Am J PhysiolRenal Fluid Electrolyte Physiol 1990, 258:F1584–F1591.
51. Zeidel ML: Hormonal regulation of inner medullary collecting ductsodium transport. Am J Physiol Renal Fluid Electrolyte Physiol 1993,265:F159–F173.
52. Light DB, Ausiello DA, Stanton BA: Guanine nucleotide-binding pro-tein, �i�3, directly activates a cation channel in rat renal innermedullary collecting duct cells. J Clin Invest 1989, 84:352–356.
53. Light DB, Schwiebert EM, Karlson KH, Stanton BA: Atrial natriureticpeptide inhibits a cation channel in renal inner medullary collectingduct cells. Science 1989, 243:383–385.
54. Hostetter TH, Pfeffer JM, Pfeffer MA, et al.: Cardiorenal hemody-namics and sodium excretion in rats with myocardial dysfunction. AmJ Physiol 1983, 245:H98–H103.
55. Villarreal D, Freeman RH, Brands MW: DOCA administration andatrial natriuretic factor in dogs with chronic heart failure. Am JPhysiol 1989, 257:H739–H745.
56. Villarreal D, Freeman RH, Davis JO, et al.: Atrial natriuretic factorsecretion in dogs with experimental high-output heart failure. Am JPhysiol 1987, 252:H692–H696.
57. Levy M, Allotey JBK: Temporal relationsips between urinary saltretention and altered systemic hemodynamics in dogs with experimen-tal cirrhosis. J Lab Clin Med 1978, 92:560–569.
58. Levy M: Sodium retention and ascites formation in dogs with experi-mental portal cirrhosis. Am J Physiol 1977, 233:F572–F585.
59. Villarreal D, Freeman RH, Johnson RA: Neurohumoral modulatorsand sodium balance in experimental heart failure. Am J Physiol HeartCirc Physiol 1993, 264:H1187–H1193.
60. Awazu M, Ichikawa I: Alterations in renal function in experimentalcongestive heart failure. Sem Nephrology 1994, 14:401–411.
61. Redfield MM, Edwards BS, Heublein DM, Burnett JC Jr: Restorationof renal response to atrial natriuretic factor in experimental low-out-put heart failure. Am J Physiol 1989, 257:R917–R923.
62. Manning RD Jr, Coleman TG, Samar RE: Autoregulation, cardiacoutput, total peripheral resistance and the “quantitative cascade” ofthe kidney-blood volume system for pressure control. In ArterialPressure and Hypertension. Edited by Guyton AC. Philadelphia: WBSaunders Co; 1980:139–155.
63. Albillos A, Colombato LA, Groszmann RJ: Vasodilation and sodiumretention in prehepatic portal hypertension. Gastroenterology 1992,102:931–935.
64. Møller S, Henriksen JH: Circulatory abnormalities in cirrhosis withfocus on neurohumoral aspects. Sem Nephrol 1997, 17:505–519.
65. Hillarp A, Zöller B, Dahlbäck M: Activated protein C resistance as abasis for venous thrombosis. Am J Med 1996, 101:534–540.
66. Niederberger M, Martin P-Y, Ginès P, et al.: Normalization of nitricoxide production corrects arterial vasodilation and hyperdynamic cir-culation in cirrhotic rats. Gastroenterology 1995, 109:1624–1630.
2.22 Disorders of Water, Electrolytes, and Acid-Base
67. Niederberger M, Ginès P, Tsai P, et al.: Increased aortic cyclic guano-sine monophosphate concentration in experimental cirrhosis in rats:evidence for a role of nitric oxide in the pathogenesis of arterialvasodilation in cirrhosis. Hepatology 1995, 21:1625–1631.
68. Martin P-Y, Schrier RW: Pathogenesis of water and sodium retentionin cirrhosis. Kidney Int 1997, 51(suppl 59):S-43–S-49.
69. Fadnes HO, Pape JF, Sundsfjord JA: A study on oedema mechanismin nephrotic syndrome. Scand J Clin Lab Invest 1986, 46:533–538.
70. Oliver WJ, Owings CL: Sodium excretion in the nephrotic syn-drome: relation to serum albumin concentration, glomerular filtra-tion rate, and aldosterone secretion rate. Am J Dis Child 1967,113:352–362.
71. Rodrígeuez-Iturbe B, Colic D, Parra G, Gutkowska J: Atrial natriuret-ic factor in the acute nephritic and nephrotic syndromes. Kidney Int1990, 38:512–517.
72. Ichikawa I, Rennke HG, Hoyer JR, et al.: Role for intrarenal mecha-nisms in the impaired salt excretion of experimental nephrotic syn-drome. J Clin Invest 1983, 71:91–103.
73. Manning RD Jr: Effects of hypoproteinemia on renal hemodynamics,arterial pressure, and fluid volume. Am J Physiol 1997, 252:F91–F98.
74. Manning RD Jr, Guyton AC: Effects of hypoproteinemia on fluid vol-umes and arterial pressure. Am J Physiol 1983, 245:H284–H293.
75. Mitch WE, Wilcox CS: Disorders of body fluids, sodium and potassi-um in chronic renal failure. Am J Med 1982, 72:536–550.


![[353 ] IONIC REGULATION AND WATER BALANCE IN ...Ionic regulation and water balance in larva of Sialis lutaria 355 average concentration of 108 min./l. for sodium in the blood of larvae](https://static.fdocuments.us/doc/165x107/5ea440c8901a3f173e143452/353-ionic-regulation-and-water-balance-in-ionic-regulation-and-water-balance.jpg)