DISNEY-FOX Deal: Valuation of an acquisiton
54
DISNEY-FOX Deal: Valuation of an acquisiton Master's Degree Dissertation Master of Science in Management UPF Barcelona School of Management Author Tatiana Korenkova Academic Year 2018 – 2019 Mentor Luz Parrondo
Transcript of DISNEY-FOX Deal: Valuation of an acquisiton

DISNEY-FOX Deal: Valuation of an
acquisiton
Master's Degree Dissertation
Master of Science in Management UPF Barcelona School of Management
Author Tatiana Korenkova
Academic Year 2018 – 2019
Mentor Luz Parrondo

UPF Barcelona School of Management
DISNEY-FOX Deal: Valuation of an acquisiton
2
Project performed within the framework of the Master of Science in Management
program taught by Barcelona School of Management, a centre associated with Pompeu
Fabra University

UPF Barcelona School of Management
DISNEY-FOX Deal: Valuation of an acquisiton
3
Abstract
The entertainment and media industry is a constantly changing and fast-growing industry. Thanks
to the increasing number of M&A transactions and shifting consumer demand for high-quality
content on Internet, media market has to reshape and companies are encouraged to transform their
products by focusing on digitalization. This master thesis evaluates an acquisition of 21st Century
Fox by the Walt Disney Company, the two media giants inside the US market and beyond.
First of all, the paper examines what an M&A deal is and what drives some companies to proceed
these transactions. Also, the valuation methods for M&A are studied and applied in the research.
In addition, the media industry and the companies are analyzed by focusing on trends, competition,
and historical financial performance. After this, the fundamental analysis of both companies is
provided and the economic reasoning of the acquisition of Fox by the Disney Company is
determined by using Discounted Cash Flow method and the Data Envelopment Analysis. Both
companies are valued independently and as a combined firm.
As a consequence, the acquisition deal seems to be the perfect strategic and economic fit. The
transaction will increase a leading position of Disney in the movie and TV production and will
decrease the approaching competition from streaming and online companies.
Besides, the purchasing price of $71,3 billion is going to be beneficial for Disney. Also, the deal will
cause the efficiency score of Disney to grow from 41,6% to 47%. And, therefore, the estimated
value of a synergy is going to be twice as high as the current Disney’s EV ($1 281,568 billion as the
best estimate), which promises the high potential for this media corporation. Moreover, the
transaction will encourage Disney’s Revenues and Income to grow by 35% and by 48% in 6 years,
respectively, and will force its market share to increase from 15,6% in 2018 to 31,9% by 2024,
which also will strengthen the company’s position in the market.
Keywords: Media Industry, Mergers and Acquisitions (M&A), Disney, Fox, WACC, Valuation
models, Enterprise Value (EV), Terminal Value, Efficiency score, Fundamental analysis
This work is licensed under a Creative Commons Attribution-NonCommercial-NoDerivatives 4.0 International License

3
Acknowledgements
To begin with, I would like to thank my thesis supervisor Luz Parrondo Tort for the continuous
guidance and advice she has been providing throughout the entire process of writing this
research paper. I have been extremely happy to work with a supervisor, who truly cared about
my research, and who responded to my questions and doubts immediately.
Also, I would like to point out that the topic that I chose for my thesis was quite challenging for
me, because I had never used any valuation method for M&A before. So, Luz Parrondo never
denied helping me to figure this method out. I would say that I have learnt a lot from the whole
process of creating my research paper and, of cause, from my wonderful supervisor who has
been giving me continuous feedback.
Additionally, I would like to thank UPF Business School of Management for becoming one of the
best experiences in my life and contributing to my self-improvement, not only professionally and
academically, but also in personal side. I am glad that in this paper I managed to implement some
tools from the Managerial Accounting course, the Applied Statistics and Corporate Finance
classes and the Benchmarking course.
Finally, I would like to express my sincere gratitude to my parents and my sister for providing me
with constant support and encouragement throughout the whole year of my study and through
the process of writing this thesis. Especially, I am grateful to my father who motivated me to
choose the topic for my paper and helped me with useful advice.
I also want to thank my uncle who did not refuse to share his ideas with me regarding the analysis
part. This accomplishment would not have been possible without them. Thank you.

4
Table of Contents
1. Introduction.....................................................................................................................5-6
1.1. M&A and its motives............................................................................................................7-8
2. Methodology………………………………………………………………………………………………………….….…9-12
2.1. Review of valuation models............................................................................................... 9-10
2.2. Discounted Cash Flow Model………………………………………………………………………………….……10-12
2.3. Benchmarking Approach………………………………………………………………………………………………..…12
3. Industry and Companies Overview................................................................................13-19
3.1 Industry overview..............................................................................................................13-16
3.2 Companies overview.........................................................................................................16-17
3.3 Deal Rationale...................................................................................................................18-19
4. Results……………………………………………………………………....................................................20-36
4.1 Fundamental analysis of the companies…........................................................................20-29
The Walt Disney Company………….……………………………………………………………………………..….20-24
21st Century Fox…………………………….……………………………………………………………………....…….24-29
4.2 Benchmarking approach....................................................................................................29-32
4.3 Valuation of companies……………………………………………………………………………………………..…32-37
5. Conclusion....................................................................................................................38-39
List of Abbreviations and Acronyms…………………………………………………….……………………………….40 Bibliography.....................................................................................................................41-44 Appendicies......................................................................................................................45-53

5
1. Introduction
Mergers and Acquisitions are becoming drastically important for many companies, which target
to obtain economic benefits from these actions. Moreover, the main purpose of M&A
transactions is to create a higher shareholder value in a combination of two companies compared
to a single firm. In recent years it might be observed that M&A activities, for instance, in North
America have been intensifying significantly until 2017, when the number of M&A transactions
reached its historical maximum and amounted to 18 576 in 2017 and still had a rather high value
of 17 378 in 2018.
Notably, for such a fast evolutive sector as media industry, consolidation is becoming crucial for
companies not only because of their willingness to gain more power in the market, but also
because of their desire to quickly respond to the high competition of streaming and online
services like Netflix or Amazon Prime. The customer demand inside the industry is shifting
significantly to digitalization, forcing the entertainment industry to innovate its services and
adjust to the fast-changing conditions.
In March 2019 media industry of the US experienced a huge deal of Disney acquiring 21st Century
Fox, which, according to the Institute for Mergers and Acquisitions, was ranked the 8th largest
M&A Transaction in the world. This reorganization means to increase the competitive ability of
Disney against such leading streaming services as Netflix by acquiring 60% of stake in Hulu (a
video streaming service) through purchasing the Fox company and extend its content library for
a new streaming service Disney+ that Disney is going to launch in the near future.
Being one of the largest media giants in the world, Disney and Fox are very likely to reshape the
whole media industry with their consolidation deal and this acquisition might have a great impact
on the buyer-company itself. This is why the evaluation of an effect and possible consequences
of the transaction between these media giants is drastically important for their current or
potential investors and their management.
So, this paper is going to answer the following question:
Is the acquisition transaction going to be effective for Disney and generate more shareholders’
value?

6
In this research we analyze each company separately in terms of its financials to examine
companies’ current financial state and implement valuation models to estimate their individual
and joint potential; and, finally, we try to evaluate the transaction’s impact on Disney’s
effectiveness and its performance against its competitors in the market. This work seeks to prove
that the acquisition is going to increase the shareholders’ value and become effective for
Disney.
The remainder of this research is organized into four chapters. Firstly, the work provides an
overview of what a merger and acquisition transaction is and what its motives are. Subsequently,
Chapter 2 explains the methodology for the further analysis, including valuation models review,
the discounted cash flow method, price to earnings model and the benchmarking approach.
Chapter 3 gives an overview of the media industry as a whole, the companies overview and the
deal rationale. Chapter 4 evaluates and interprets the results. Finally, conclusions are drawn and
guidelines for future work are outlined.
7
1.1. M&A and its motives
Merger and Acquisitions are two business terms that are often confused or misinterpreted. This
confusion might happen because the both words describe joining of two companies, however,
there is a crucial difference between them.
A Merger is a result of two separate companies conjoining and forming a new independent
entity, while an acquisition, according to Prateek Agarwal (2014), is the process where a target
company is taken over and controlled by the purchasing company and becomes part of the
acquirer-company.
An Acquisition implies that the acquirer takes all assets and liabilities of a purchased company.
Besides, it is also worth mentioning that in frames of a merger new stocks are usually issued,
while for an acquisition stocks are not issued.
So, what are the main drivers that encourage companies to perform M&A activities? The
essential idea behind these processes is the improvement of a company’s financial state in
general which can be accomplished in the following ways (Prateek Agarwal, 2014):
Economy of Scale: This indicates that a joint company reduces its fixed costs by eliminating
double standards in both companies, while maintaining the revenue stream the same which
encourages the profit margin to grow.
Increase in Market Share: As the result of M&A the buyer acquire one of its key competitors and,
eventually, gets a bigger market share and market power.
Tax Minimization: It is typical for a profitable company to take over a loss-making company to
minimize the tax amount it has to pay.
Cross Selling: If merging entities come from different backgrounds it helps them to get each
other’s clients base and this mutual effect might stimulate the combined company’s sales
increase.
Diversification: This effect occurs when companies are willing to extend its operations and create
their departments in a different industry, which also potentially leads to gaining higher profits.

8
Vertical Integration: A company can benefit from a vertical merger by solving the hold-up issues
which leads to production and, consequently, sales increase.
According to Robert F. Bruner (2004) M&A is an instrument of macroeconomic renewal and one
of the most important tools, thanks to which companies can react and respond to changing
conditions. The authors underline that even if a company refuses to merge or acquire, most
probably its competitors would do it instead to gain a financial or strategic advantage, and,
eventually, it might appear to be devastating for the company in the long run. This is why simply
rejecting M&A is not feasible from the author’s standpoint.

9
2. Methodology
2.1. Review of Valuation models
Usually, a company’s valuation process normally consists of the following steps (Barbara S. Petitt,
2013):
1. Analyzing the financial performance of a target firm from the historical scale to make sure that
this company is a viable partner for an acquirer. Therefore, it is worth assessing the target’s
operations, its business model and capital structure to see if it might be a potential benefit for
purchasing company.
2. Predicting the future performance of the target company by forecasting the financial
statements for the next period. This step helps to understand the target’s potential to generate
value in the future that can be beneficial for an acquirer.
3. Using one or more valuation models to assess the target company’s value
4. Checking the sensitivity of the forecasted statements and valuation assumptions on the
target’s value.
Valuation methods
There are some valuation methods, application ability of which might differ for a particular
industry or a company’s life stage (for instance, if it is a mature company or a start-up) or simply
because of the analyst’s preference.
These methods are divided in 2 large groups: the first one includes direct and indirect (relative)
valuation methods; and the second one is composed of models that deal with cash flows and
models based on other financial ratios like revenues, book value or earnings.
Direct valuation methods allow a direct assessment of a company’s fundamental value to its
market value. If a company’s market value appears to be lower than its fundamental value it can
be estimated as undervalued and if it is the opposite situation then a company can be named
overvalued; the ideal situation when it is possible to say that a company is fair valued is when its
market and fundamental values coincide.

10
Relative valuation methods, on the contrary, do not estimate whether a firm is fundamentally
fairly priced or not; they only assess if a company is fairly priced relative to a particular benchmark
or a group of benchmarks. This method is usually called a comparable approach.
The table presented below shows the classification of existing valuation methods.
Direct Methods Relative (Indirect) Methods
Valuation methods
based on CF
Discounted cash flow models:
Free cash flow to the firm model
Free cash flow to equity model
Adjusted present value model
Option-pricing models:
Real option analysis
Price multiples:
Price-to-cash-flow ratio
Valuation methods
based on other
financial variables
Economic income models:
Economic value analysis
Price multiples:
Price-to-earnings ratios (P/E ratio,
P/EBIT ratio, and P/EBITDA ratio)
Price-to-sales ratio
Price-to-book ratio
Enterprise value multiples:
EV/EBITDA multiple
EV/Sales multiple
Table 1. Classification of valuation methods
However, the two most widely used valuation methods among those that are mentioned in the
table are the Discounted Cash Flow model and the P/E ratio. According to Imam (2008) almost
60% of analysts that had been interviewed preferred cash flow–based valuation methods. For
this reason, this paper is focused on the Discounted Cash Flow valuation method.
2.2. Discounted Cash Flow method
In this method, the value of an asset is measured based on the present value (PV) of future cash
flows generated by this asset. These cash flows are discounted by applying their risk. Therefore,
this approach is often used to value an entire company.
11
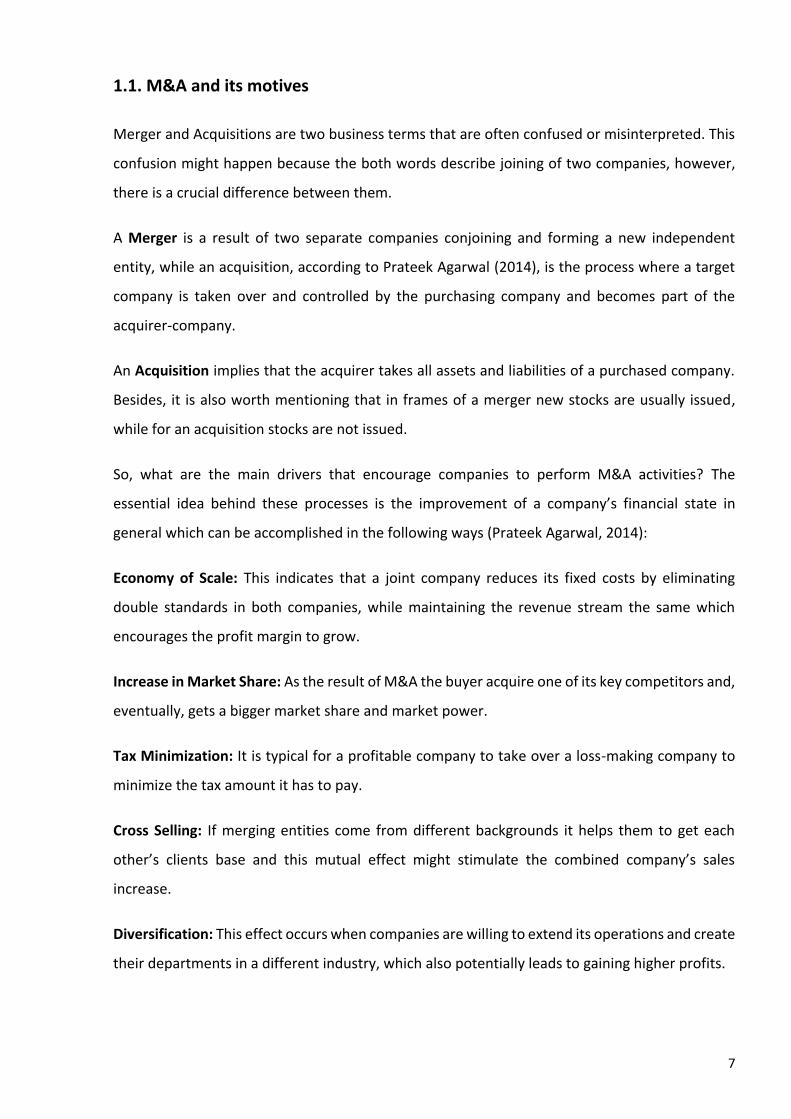
The model can be applied in four steps:
Step 1: The calculation of free cash flow
Free cash flows show the difference between cash inflows and outflows. We can find FCF
indirectly based on the company’s income statement:
𝐹𝑟𝑒𝑒 𝐶𝑎𝑠ℎ 𝐹𝑙𝑜𝑤 = 𝐸𝐵𝐼𝑇 ∗ (1 − 𝑇𝑎𝑥 𝑅𝑎𝑡𝑒) + 𝐷𝑒𝑝𝑟𝑒𝑐𝑖𝑎𝑡𝑖𝑜𝑛 − 𝐶𝑎𝑝𝑖𝑡𝑎𝑙 𝐸𝑥𝑝𝑒𝑛𝑑𝑖𝑡𝑢𝑟𝑒𝑠
− 𝐶ℎ𝑎𝑛𝑔𝑒𝑠 𝑖𝑛 𝑁𝑒𝑡 𝑊𝑜𝑟𝑘𝑖𝑛𝑔 𝐶𝑎𝑝𝑖𝑡𝑎𝑙
Step 2: Calculating the weighted average cost of capital (WACC)
The weighted average cost of capital is the rate of return that investors anticipate from investing
in a particular company instead of other companies with similar risk (Brealey & Myers et al.,
2007). In frames of the DCF approach we usually Weighted Average Cost of Capital (WACC) to
discount the free cash flow and is very crucial to the model, because even a small change in WACC
can result in significant changes in a company’s value (Steiger, 2010).
The WACC is calculated as follows:
𝑊𝐴𝐶𝐶 = 𝑘𝑒 ∗𝐸
𝑉+ 𝑘𝑑 ∗
𝐷
𝑉∗ (1 − 𝑇𝑎𝑥)
Where 𝑘𝑒is the cost of equity, E is the total equity, V is the enterprise value that is calculated as
the sum of total equity and the total liabilities of a company, 𝑘𝑑stands for the cost of debt and D
describes the total liabilities of a firm.
The cost of equity (𝑘𝑒) is defined by using the Capital Asset Pricing Model (CAPM), which is
computed as follows:
𝑘𝑒 = 𝑟𝑓 + ϐ ∗ 𝑟𝑚
Where 𝑟𝑓 stands for the risk-free rate, ϐ is the systematic risk of the company and 𝑟𝑚 is the
market risk premium.
The beta (ϐ) can be found using the regression of a company’s stock returns against market
returns for an estimated time period.
The cost of debt (𝑘𝑑) is the rate that a company pays for obtaining the debt.
The formula for the after-tax cost of debt is (Damodaran, 2012):
After tax cost of debt = (Risk free rate + Default spread) (1- Tax rate)
The risk-free rate is the same as mentioned earlier regarding CAPM.
We can estimate the default spread in the following ways:
1) based on the current market interest rate (yield to maturity) on the company’s long-term
bonds if a company has outstanding bonds
2) based on the ratings (Steiger, 2010) in case if a company has bond ratings from rating agencies
like Moody’s or S&P

12
3) based on the company’s interest coverage ratio (𝐸𝐵𝐼𝑇
𝐼𝑛𝑡𝑒𝑟𝑒𝑠𝑡 𝑒𝑥𝑝𝑒𝑛𝑠𝑒𝑠) if the firm is not rated
(Damodaran, 2012).
Step 3: Identifying the terminal value
We may calculate the terminal value of a company by increasing its last cash flow by the growth
rate of the firm and dividing it by the difference of WACC and the perpetual growth rate.
𝑇𝑒𝑟𝑚𝑖𝑛𝑎𝑙 𝑉𝑎𝑙𝑢𝑒 =𝐹𝐶𝐹𝐹𝑛(1 + 𝑔)
𝑊𝐴𝐶𝐶 − 𝑔
Step 4: Calculating the Enterprise Value
Then, we can find the enterprise value of a company by summing up the discounted free cash
flows and the discounted terminal value:
𝐸𝑛𝑡𝑒𝑟𝑝𝑟𝑖𝑠𝑒 𝑉𝑎𝑙𝑢𝑒 = ∑𝐹𝐶𝐹𝐹𝑖
(1 + 𝑊𝐴𝐶𝐶)𝑖+
𝑛
𝑖=1
𝑇𝑒𝑟𝑚𝑖𝑛𝑎𝑙 𝑉𝑎𝑙𝑢𝑒
(1 + 𝑊𝐴𝐶𝐶)𝑛
2.3. Benchmarking approach
There is also a benchmarking approach that allows to evaluate a merger by positioning it in the
market in terms of efficiency. It might be assumed that the benchmarking approach belongs to
the set of comparable valuation methods, because it is focused on measuring the performance
of a company against a group of competitors in the market. The approach allows us to analyze
best practice firms that form the efficiency frontier, so a company is able to position itself among
them in a market and look at the potential ways to improve its progress.
Paul Nillesen, et al. (2001) proposed a valuation model that is meant to determine the cost
savings and efficiency score development from a merger or an acquisition. So, this approach for
companies’ valuation includes identifying and qualifying the efficiency savings and enhanced
strategic positioning of a particular merger.
The benchmarking method utilizes Data Envelopment Analysis (DEA) that combines different
inputs and outputs from the production process that we can use for efficiency score estimation.

13
3. Industry and Companies Overview
3.1 Industry Overview
It is considered that the U.S. media and entertainment (M&E) industry is the largest in the world
and according to the U.S. Department of Commerce it represents one third of the global M&E
industry. Its market size is valued at $735 billion and includes television programs and
advertisements, streaming content, music and audio recordings, broadcast, motion pictures,
radio, book publishing, video games, and ancillary services and goods.
According to the most recent Entertainment & Media Outlook by Price Waterhouse Coopers
(PwC) this sector is anticipated to reach more than $830 billion by 2022. Though the United States
has a mature TV market, its competition degree is becoming more intense thanks to the new
digital economy and the rapid growth of the streaming content.
Grand View Research in one of its report’s states that the world’s video streaming market size
represents $36.64 billion in 2018 and is expected to expand at 19.6% pace from 2019 to 2025.
Such upcoming innovations as Artificial Intelligence (AI) and Block-chain system are meant to
enhance quality of video content, speed video production and accelerate the market growth.
The Deloitte report on the 2019 M&E Industry Outlook indicates that over the past year the 2
main trends appeared:
1) the accelerating growth of streaming and mobile video
2) a shift away from traditional pay TV
According to the latest Deloitte study, 55% of US households opt for paid streaming video
services, and almost half (48 %) of all US consumers stream TV content each day or week in 2017.
Another interesting found is the fact that across different age groups the consumers are
streaming more than ever before and are usually using smartphones and tablets for it. Nowadays,
US consumers pay about $2 billion monthly for subscription-video services. At the same time
subscribers that consume pay-TV report dissatisfaction with the service they use and 70% of
them claim they do not receive enough value for money they pay for it.

14
The Deloitte reports that while media & entertainment companies plan their strategies for 2019,
they should emphasize on the following key-trends that are going to reshape the whole industry:
Firstly, the increase of investments in original content production by steaming companies as a
response reaction to content recalls by media companies who are the original content makers.
For instance, Disney company is eliminating its movies from Netflix and is going to launch its own
streaming service Disney+ in 2019. Therefore, such media streaming companies as Amazon and
Prime and Netflix are investing more in their original content production.
Deloitte reports that Netflix’s chief content officer claims that 85% of its $8 billion content
investment in 2018 went toward original content making and, at the same time, Amazon also
stated that it would invest approximately $5 billion in video content during 2018.
Secondly, Media and Entertainment industry will keep on reshaping in 2019 in the result of
multiple mergers and acquisitions, while media companies try to extend their content libraries,
content’s quality, its distribution, and value delivering. Massive mergers will reduce the number
of big-name companies that possess a greater share of TV programs and movies, potentially
extending their content libraries.
Deloitte claims that the main drivers that force media companies to merge and acquire
aggressively and strategically reposition are changing consumer mobile-data and consumers’
streaming behavior.
In October 2016 the Wall Street Journal has published the diagram that portraits 6 “behemoths”
in the media industry – the biggest companies by market capitalization, where the first place
occupies Comcast company with $155.2 billion of capitalisation in 2016. However, Disney is up
there with Comcast and occupies the second place in this rating with capitalization os $147,9
billion. Then we can observe a huge gap between Disney and other companies mentioned futher
(Time-Warner, 21st Century Fox, CBS) in terms of market capitalization. Nevertheless, we can see
that the Fox company composes the top-5 largest media behemoths in the US and is an important
figure in the m&e industry.

15
Figure 1. Largest Media Companies by Market Capitalization
If have a look at the media landscape that is shown below (Jeff Desjardins, 2018), we may
conclude that the media industry is reshaping a lot. It is known that the biggest media streaming
competitor for older media companies is Netflix. Netflix not only purchases content from the
studios, but also makes its own and sells it directly to consumers. So, this becomes one of the
reasons traditional media companies are attempting to compete by consolidating. For instance,
Disney recently completed its acquisition of 21st Century Fox which also allows it to obtain a
bigger stake of 60% in Hulu (a media streaming service); a telecommunication company AT&T
bought Time Warner in 2018 and is becoming a media company as well.
Figure 2. Media Landscape
16
3.2 Companies overview
The Walt Disney Company
The Disney Company is a globally diversified entertainment company that operates in 5 major
sectors: Media; Parks, Consumer Products; Studio Entertainment; Disney Interactive. The
company was established in 1923 by brothers Walt Disney and Roy O. Disney and nowadays, its
headquarters are placed in the US, California.
Disney’s annual revenue in the Fiscal Year 2018 amounts to $59.4 billion, where the major
portion of $45 billion have been generated in the US and Canada. According to Statista the media
networks and parks occupy a significant portion of Disney’s total revenue at $24,5 billion and
$20,3 billion, respectively in 2018.
Recently, Disney is shifting from the traditional content delivering method to media streaming
services. Disney had a stake of 30% in Hulu until on March 20, 2019 Disney acquired 21st Century
Fox and through this consolidation Disney obtained 60% stake. And, moreover, the company has
announced its intentions to develop its own streaming service Disney+ (which is anticipated to
be released in November 2019).
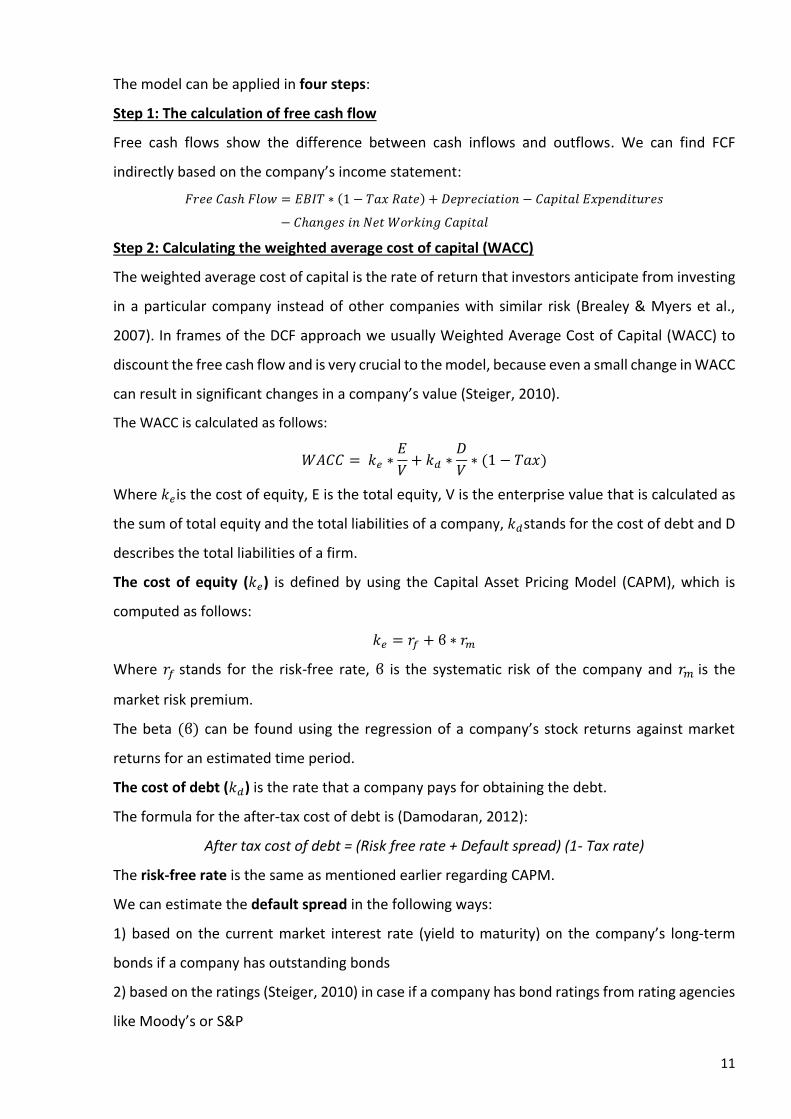
If we look at the Disney’s share price graph we will find out that it has a positive growing trend
over the last 10 years and, especially, in 2019 after its acquisition of 21st Century Fox the Disney’s
stock reached its historical maximum and now the price per share is estimated at the level of
$133,36 (23d of April, 2019). So, we can state that investors reacted positively on the M&A news.
Figure 3. Disney’s Stock Price (2008-2019)
17
21st Century Fox
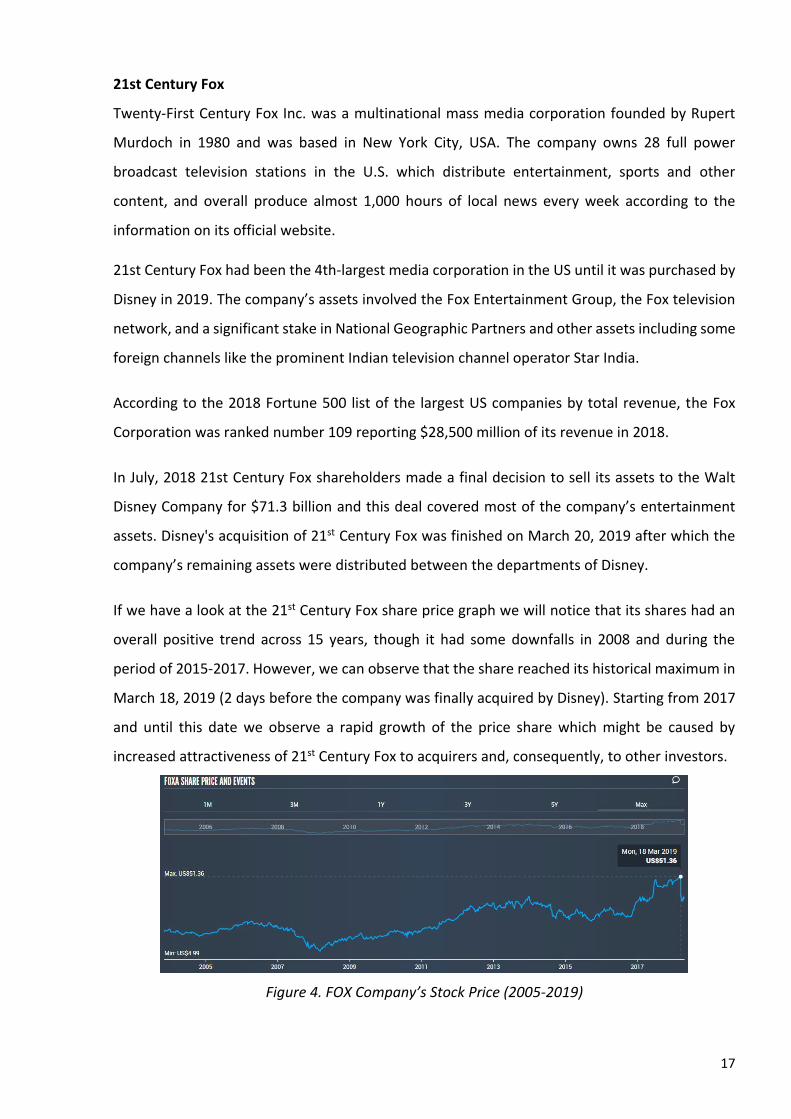
Twenty-First Century Fox Inc. was a multinational mass media corporation founded by Rupert
Murdoch in 1980 and was based in New York City, USA. The company owns 28 full power
broadcast television stations in the U.S. which distribute entertainment, sports and other
content, and overall produce almost 1,000 hours of local news every week according to the
information on its official website.
21st Century Fox had been the 4th-largest media corporation in the US until it was purchased by
Disney in 2019. The company’s assets involved the Fox Entertainment Group, the Fox television
network, and a significant stake in National Geographic Partners and other assets including some
foreign channels like the prominent Indian television channel operator Star India.
According to the 2018 Fortune 500 list of the largest US companies by total revenue, the Fox
Corporation was ranked number 109 reporting $28,500 million of its revenue in 2018.
In July, 2018 21st Century Fox shareholders made a final decision to sell its assets to the Walt
Disney Company for $71.3 billion and this deal covered most of the company’s entertainment
assets. Disney's acquisition of 21st Century Fox was finished on March 20, 2019 after which the
company’s remaining assets were distributed between the departments of Disney.
If we have a look at the 21st Century Fox share price graph we will notice that its shares had an
overall positive trend across 15 years, though it had some downfalls in 2008 and during the
period of 2015-2017. However, we can observe that the share reached its historical maximum in
March 18, 2019 (2 days before the company was finally acquired by Disney). Starting from 2017
and until this date we observe a rapid growth of the price share which might be caused by
increased attractiveness of 21st Century Fox to acquirers and, consequently, to other investors.
Figure 4. FOX Company’s Stock Price (2005-2019)
18
3.3 Deal Rationale
According to Disney's CEO Bob Iger, the idea of acquiring 21st Century Fox appeared after Disney
purchased the streaming company BAMTech with intentions to upgrade its own streaming
service Disney+ that was planned to be released in November 2019. The most important reason
why 21st Century Fox was so attractive to Disney was not its production capacity but its own
movie and TV libraries, because it could contribute a lot to the Disney’s streaming content library
expansion.
Together with 21st Century Fox’s portfolio of businesses and content, Disney will be capable of
providing higher quality of its content and entertainment options to respond to increasing
consumers’ demand, expand its international impact, and increase its direct-to-consumer
offerings including ESPN+ for sports fans, the Disney+ streaming service and obtained 60%
ownership stake in Hulu.
The acquisition includes 21st Century Fox’s film production businesses, involving Twentieth
Century Fox, Fox Searchlight Pictures, Fox 2000 Pictures, Fox Family and Fox Animation; Fox’s
television creative units, Twentieth Century Fox Television, FX Productions and Fox21; FX
Networks; National Geographic Partners; Fox Networks Group International; Star India; and Fox’s
interests in Hulu, Tata Sky and Endemol Shine Group and other Networks.
Disney is aware of the fact that its audience is almost the same as the Netflix’s audience. This is
because Disney had an agreement with Netflix to share its content. However, at the moment the
company is planning to leverage its brand profile and satisfy the consumers who grew up
watching Disney’s content which is highly competitive in terms of production and selection
standpoint compared to its competitors in the market. So, having spent many years getting close
to their customers and their needs, Disney might become a serious competitor for Netflix.
According to the Walt Disney Company and 21st Century Fox agreement:
- approximately $71 billion, including $35.7 billion in cash and nearly $35 billion in Disney
Common Stock were paid to the former holders of 21 Century Fox Common Stock in the result of
the merger;
- shares of 21CF Common Stock were exchanged for 0.4517 shares of Disney Common Stock;
- approximately $19.8 billion of cash and $19.2 billion of debt of 21 21 Century Fox were acquired
by Disney;

19
- the acquisition price includes a total equity value of $71 billion and a total transaction value of
$71 billion;
- the acquisition is anticipated to drive up Disney’s Earnings Per Share (EPS) before the effect of
purchase accounting for the second fiscal year after the close of the transaction, and to yield at
least $2 billion in cost synergies by 2021 from operations implemented by the combination of
businesses.
According to Statista analytics Disney-Fox deal is going to make a great impact on the movie
industry in the US. If we look at the histogram below, we might find out that by 2017 Disney
Company and 20th Century Fox (that was the 21st Century Fox property) occupied 15,38% and
12,75% of the market share respectively, which can make a highly competitive giant entity in the
market out of their merger.
Figure 5. Media Giants by Market Share

20
4. Results
4.1 Fundamental analysis of the companies
The Walt Disney Company
The results of the fundamental analysis indicate that the Walt Disney Company is profitable and
its profits are increasing each year as well as the revenue. What is also interesting to notice is
that the company’s Net Profit reached its historical maximum in 2018 growing by 40% from 2017.
What is also important to emphasize is that Net Income is growing at the faster pace than
Revenues of the company. The average growth of Disney’s revenue for last 8 years accounts to
5,8% while Income had been growing on average by 16%. Besides the profit margin of the
company had been increasing from 10,4% in 2010 to 21,2% in 2018.
Figure 6. Disney’s Revenue and Net Income historical values from 2000 to 2018
No wonder why such company’s ratios as ROE, ROA and Margin ratio look more than satisfying
and follow a positive trend, constantly growing from year to year. The results show that Disney’s
Assets and Equity are constantly generating more return.
Also, the financial leverage indicates that the company is able to cover its financial expenses (ROI
is sufficiently higher than the cost of debt).
Ratio Formula 2014 2015 2016 2017 2018 Optimal value
ROA Net Profit/Total Assets 8,9% 9,5% 10,2% 9,4% 12,8% >3%
Margin Net Profit/Revenue 15,4% 16,0% 16,9% 16,3% 21,2% >2%
ROE Net Profit /Equity 16,7% 18,8% 21,7% 21,7% 25,8% >6%
ROI EBIT/Total Assets 13,6% 14,9% 15,4% 14,5% 15,1% >i
i Cost of debt 2,0% 1,5% 1,8% 2,0% 3,3%
Table 2. Key metrics of Disney from 2014 to 2018

21
Disney’s growth rate allows to conclude that the company is now at the stage of rapid growth
and has reached its historical maximum of 17,1% in 2018.
Figure 7. Disney’s Growth rate from 1983 to 2018
And we also may conclude that this growth is balanced, since its assets are growing faster than
its debt, sales grow at a faster pace than sales and, finally, its profits’ increase exceed all of these
growth rates as a result.
If we have a look at the Price to Earnings ratio of Disney, we will notice that it has been going
down from 2015, which indicates that the company’s investors are willing to pay less for $1 of
current earnings in historical perspective. However, we may conclude that Disney is performing
better compared to the whole market growth in 2018 and the company’s investors anticipate
higher growth from Disney in the market scale, because its P/E is much higher than the S&P index.
Figure 8. Disney’s P/E ratio from 2012 to 2018
Next we would like to test Disney’s solvency and for these we are going to implement the
multidimensional Z - score that takes into account the ROE, ROA, Capitalization ratio and the
Current Ratio of the company and must be non-negative for a solvent company. and uses the
following equation (Amat, 2016):
𝑍 = −3,9 + 1,28𝐶𝑢𝑟𝑟𝑒𝑛𝑡 𝐴𝑠𝑠𝑒𝑡𝑠
𝐶𝑢𝑟𝑟𝑒𝑛𝑡 𝐿𝑖𝑎𝑏𝑖𝑙𝑖𝑡𝑖𝑒𝑠 + 6,1
𝐸𝑞𝑢𝑖𝑡𝑦
𝐴𝑠𝑠𝑒𝑡𝑠+ 6,5
𝑁𝑒𝑡 𝑃𝑟𝑜𝑓𝑖𝑡
𝐴𝑠𝑠𝑒𝑡𝑠+ 4,8
𝑁𝑒𝑡 𝑃𝑟𝑜𝑓𝑖𝑡
𝐸𝑞𝑢𝑖𝑡𝑦≥ 0

22
Having a look at the results of the z-score we may conclude that Disney’s Z-score is rather higher
than 0, which indicates that it is financially healthy and does not have a bankruptcy risk.
Moreover, it recovered significantly after its drop in 2017, which shows that the company is
performing better.
Figure 9. The Z-score of Disney from 2014 to 2018
If we consider the company’s Equity it becomes clear that Disney is a company that is financially
independent from the 3d parties, reporting 49,5% of equity in 2018. This means that almost half
of Disney’s financial resources are composed by its own financial resources.
Ratio Formula 2014 2015 2016 2017 2018 Optimal Value
Capitalization Equity/Total Assets
53,4% 50,5% 47,0% 43,1% 49,5% ≥40%
Table 3. Capitalization ratio of Disney from 2014 to 2018
Meanwhile, the company’s debt is composed by 35,8% of its current liabilities in 2018, though
the ratio is quite stable through years, this shows that the company attracts high quality debts.
Besides, it is important to mention that Disney’s capital return ability is improving a lot, especially
in 2018, when the amount of generated net cash flow covered almost 75% of company’s total
loans.
Debt ratios Formula 2014 2015 2016 2017 2018 Optimal value
Debt Total Liabilities
/Liabilities+Equity 46,6% 49,5% 53,0% 56,9% 50,5% 60%
Quality debt
Current Liabilities
/Total Liabilities 33,9% 37,4% 34,5% 36,0% 35,8% decreasing
Return
Capacity
Cash Flow/Total
Loans 66,0% 61,9% 59,1% 46,5% 74,8% increasing
Table 4. Debt ratios of Disney from 2014 to 2018

23
The asset management of Disney is also performing well which can be confirmed by the growing
assets turnover ratios, indicating that each year Disney’s fixed and current assets are generating
more revenue.
We can notice that the company has to wait around 2 months for its customers and other debtors
to pay and this number has not been improving drastically for the last 5 years. At the same time
the days payable were decreasing a bit and went to around 40 days in 2018.
Moreover, we can see that the stock days are constantly decreasing which is a positive trend,
that shows that Disney is getting rid of its inventory faster, which can reduce its inventory costs.
Ratio Formula 2014 2015 2016 2017 2018 Optimal Value
FA turnover Sales/FA 70,7% 73,5% 74,1% 69,0% 72,7% increasing
CA turnover Sales/CA 321,6% 313,1% 327,9% 347,0% 353,2% increasing
Stock Days Inventory/
Sales/365 11,77 10,93 9,12 9,09 8,55 decreasing
Days
Receivable
Receivables/
Sales/365 58,49 55,79 59,48 57,15 57,32 decreasing
Days Payable Payables/
Sales/365 40,16 38,29 45,01 42,96 39,94 increasing
Table 5. Assets management metrics of Disney from 2014 to 2018
However, the liquidity ratios of Disney do not look as promising. The table presented below
shows that for the last 4 years the company’s liquidity ratios could not reach an optimal value.
This might be a signal that Disney possessing not enough cash or other current assets to cover its
current liabilities. This shortage of liquid assets can be explained by the aggressive investing
activities of Disney that may produce high cash outflow.
Ratio Formula 2015 2016 2017 2018 Optimal value
Current Ratio CA/CL 1,03 1,01 0,81 0,94 1,5
Liquidity (CA -Inventory)/CL 0,93 0,92 0,74 0,86 1
Acid Test Cash/CL 0,26 0,27 0,21 0,23 0,3
Table 6. Liquidity ratios of Disney from 2015 to 2018
We can justify this assumption by looking at the Cash Flows of Disney. From the table below we
can observe that Disney’s Cash Flow from financing activities remains negative for the 4 analyzed
years meaning that the company is paying more interests and returning loans than attracting

24
new financial resources. We can also notice that its Cash Flow from Investing activities remains
negative and follows a decreasing trend. This indicates that the company is performing a lot of
investments by acquiring different assets than gaining positive cash flow from selling them.
Though, the company is generating more positive CF from operations each year, the combined
cash outflow from investing and financing activities exceed the inflow from operations until 2017
and in 2018 these values are almost equal. This tells us that cash that Disney generates from its
main operating activities can hardly cover its financial expenses and investing outflow.
Cash Flow 2014 2015 2016 2017 2018
CF from Operating Activities 9780 11385 13136 12343 14295
CF from Investing Activities -3345 -4245 -5758 -4111 -5336
CF from Financing Activities -6710 -5801 -7220 -8959 -8843
Table 7. Disney’s Cash Flows values from 2014 to 2018
Moreover, the company has a working capital deficit. So, we can conclude that the funds from
current liabilities have been utilized for acquiring fixed assets, which can be proven by the
aggressive behavior of Disney in terms of acquiring businesses lately.
Ratio 2015 2016 2017 2018 Optimal Value
Working Capital Balance -7931 -8081 -11239 -9408 If ≥0 – WC Surplus
If ≤0 – WC Deficit
Table 8. WC Balance of Disney from 2015 to 2018
In sum, Disney is a profitable and fast-growing company that is doing a lot of investments and,
consequently, has a lack of liquidity. However, it is generating more and more return on its
activities and its shareholders’ return.
21st Century Fox
What can be observed in the first place is that the growth rate of 21st Century Fox is more volatile
than the Disney’s and, therefore, it is visible that the growth rate reached its best historical values
in 2013 and 2015 and then decreased drastically in 2016 and the graphic returned to its previous
growth pace. The growth rate of Fox Company in 2018 is estimated at 14,79%.
25
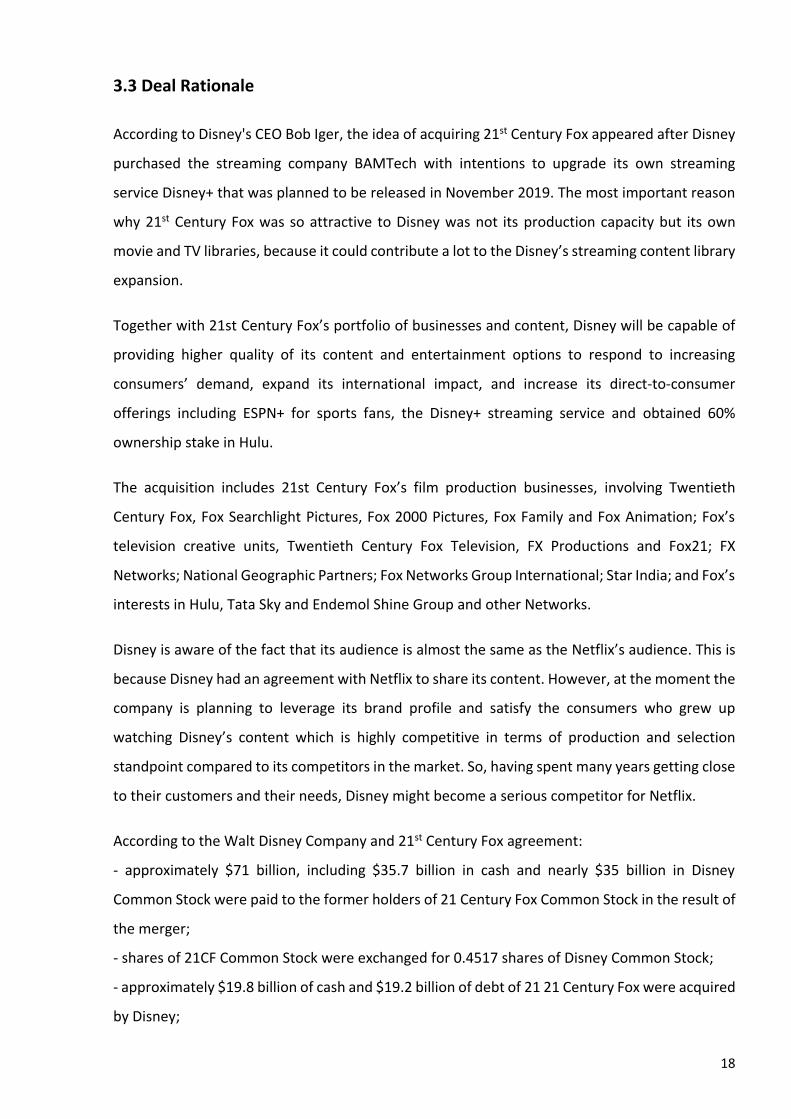
Figure 10. Growth rate of Fox from 1986 to 2018
However, we may notice that in 2018 the growth rate of Fox is balanced which implies that its
assets are growing faster than its debt, sales grow at a faster pace than sales and, consequently,
its profits’ growth surpass all of the growth rates mentioned before.
We can observe that the Net Income and Revenue of the company follow a positive growth trend,
but their values are more volatile than those of Disney. We can also say that the Fox’s Revenue
is growing at a slower pace than its Income and its Profit Margin has increased from 7,7% in 2010
to 14,7% in 2018.
Figure 11. Revenue and Net Income historical values of Fox from 2000 to 2018
Having a look at the ROE and ROA ratios it becomes clear that the company’s equity and assets
ability to generate net return is increasing. The Margin ratio of the Fox company is also rather
high for the 5 analyzed years and shows that the company is getting 15% of Net Income out of
its Revenues in 2018.
Ratio Formula 2014 2015 2016 2017 2018 Optimal value
ROA Net Profit/ Total Assets
8% 17% 6% 6% 8% >3%
Margin Net Profit/ Revenue
14% 29% 10% 10% 15% >2%
ROE Net Profit /Equity
26% 48% 20% 19% 23% >6%
Table 9. Key metrics of Fox from 2014 to 2018

26
Also, we can notice that from the historical perspective it might be stated that investors are
willing to pay more for $1 of Fox’s current earnings expecting growth of their investments in the
future. Comparing the Fox’s P/E ratio with the S&P 500 Index, it can be noticed that in 2018 the
company’s P/E became much bigger than the overall market index. This indicates that investors
expect higher growth from the company compared to the entire market.
Figure 12. Fox’s P/E ratio from 2012 to 2018
Regarding the solvency score of the Fox company, the Z-score shows that the company is solvent
and currently is in the financially healthy condition, though it experienced a significant drop in
2016. We can say that so far Fox does not have a bankruptcy risk and its Z-score is following a
positive trend.
Figure 13. Fox’s Z-Score from 2014 to 2018
We can also state that the company’s equity occupies less than 40% of its total liabilities. This
indicates that Fox is mostly financed by external financial resources and has a lack of Equity, so it
depends a lot on the 3d parties that provide it with these resources. However, the positive
financial leverage tells us that so far Fox is able to cover its financial expenses with its earnings.

27
Ratio Formula 2014 2015 2016 2017 2018 Optimal value
Capitalization Equity/Total Assets
31,8% 34,4% 28,4% 31,0% 36,3% ≥40%
ROI EBIT/Total Assets
9,5% 19,7% 8,6% 9,2% 8,2% >i
i Cost of debt 5,9% 6,3% 6,1% 6,1% 6,4%
Table 10. Financial leverage of Fox from 2014 to 2018
So, we can see that 21st Century Fox has more than 60% of debt in its liabilities, though after 2016
the company has been reducing it successfully. Also, the debt quality has a negative trend of
increasing its current liabilities and the return capacity of Fox is very low, compared to Disney’s
return capacity. This means that the Cash Flow amount that Fox generates is not enough to cover
its total loans.
Debt ratios Formula 2014 2015 2016 2017 2018 Optimal value
Debt Total Liabilities
/Liabilities+Equity
68,2% 65,6% 71,7% 69,0% 63,7% 60%
Quality debt
Current Liabilities
/Total Liabilities
23,7% 21,5% 20,5% 20,7% 24,1% decreasing
Return
Capacity
Cash Flow/Total
Loans
28,4% 44,3% 22,6% 30,9% 39,0% increasing
Table 11. Debt ratios of Fox from 2014 to 2018
Moreover, the increasing Revenue ratio is encouraging the Fox’s Fixed Assets turnover to grow,
however, it works oppositely with the Current asset turnover. This is because the Current assets
are growing with a faster pace than the company’s revenue.
It might also be noted that the Inventory and Receivables days are increasing through years and
days payable, on the contrary, have decreased up to 6 days in 2018 which are not positive signals
for the company. These trends tell us that Fox is waiting more days to receive payments from its
clients and has to pay to its creditors much faster.
Besides, we can see that the company’s inventory days are increasing, which can influence
company’s inventory costs to increase.
Ratio Formula 2014 2015 2016 2017 2018 Optimal Value
FA turnover Sales/FA 80,8% 88,7% 82,2% 82,8% 88,1% increasing
CA turnover Sales/CA 207,3% 167,1% 182,8% 175,0% 157,2% increasing

28
Stock Days Inventory/
Sales/365
35,42 34,61 43,96 39,71 44,05 decreasing
Days
Receivable
Receivables/
Sales/365
74,08 74,44 83,59 82,95 85,49 decreasing
Days Payable Payables/
Sales/365
47,91 46,80 42,49 5,20 5,32 increasing
Table 12. Assets management metrics of Fox from 2014 to 2018
What we can conclude from the liquidity ratios of Fox is that the company’s current assets exceed
its current liabilities and the company has enough cash and other liquid assets to cover its current
liabilities. So, unlike Disney, Fox is not suffering from with liquidity issues.
Ratio Formula 2014 2015 2016 2017 2018 Optimal value
Current Ratio CA/CL 1,74 2,46 2,12 2,25 2,35 1,5
Liquidity (CA -Inventory)/CL 1,39 2,07 1,65 1,82 1,90 1
Acid Test Cash/CL 0,61 1,20 0,63 0,85 0,92 0,3
Table 13. Liquidity ratios of Fox from 2014 to 2018
We can also prove it by looking at the Cash Flow statement. We are able to state that the
company is generating positive CF from its operating activities and it surpasses the combined
negative CF from financing and investing activities. This indicates that the Fox company is buying
more assets, investing more and repaying back its loans in higher amounts than obtaining new
loans and selling its assets.
Cash Flow 2014 2015 2016 2017 2018
CF from Operating Activities 3535 3568 3028 3757 4166
CF from Investing Activities -935 6736 -1638 -752 -1177
CF from Financing Activities -3776 -7102 -5330 -1281 -1464
Table 14. Cash Flow values of Fox from 2014 to 2018
Therefore, the Fox company has a working capital deficit, which implies that the working capital
needs exceed the real working capital of the company.
Ratio 2015 2016 2017 2018 Optimal Value
Working Capital Balance -433 44 -3537 -3763 If ≥0 – WC Surplus
If ≤0 – WC Deficit
Table 15. WC Balance of Fox from 2015 to 2018
In sum, Fox is a solvent and profitable company. Its metrics are more volatile than those of
Disney, however it is generating positive overall cash flows and does not keep such an aggressive

29
investment policy as Disney. Nevertheless, Disney is more financially independent from the 3d
parties than Fox. We may also notice from the P/E ratio of companies, that investors are ready
to pay more for $1 of Fox’s earnings ($21,7 in 2018) than for $1 of Disney’s earnings ($15,35 in
2018).
4.2 Benchmarking approach
Presentation of the sample
For the competitive analysis of the media industry a data sample of 215 public companies is taken
from the Thomson Reuters EIKON database for examination. The dataset contains mostly
quantitative and some qualitative variables about the financial, environmental, social and
governance performance of the companies from the year 2018. The table shows a numeric
analysis of the examined variables. Due to the fact that some companies might not have updated
the 2018 data to the database yet, there are some datasets lacking some variables.
Table 16. Description of the sample
DEA analysis
The competitive analysis of the media industry will be based on the data envelopment analysis
methodology (DEA). Before running the DEA analysis, statistically significant variables have to be
determined as inputs and outputs to measure the industry’s performance frontiers. Therefore, a
couple of regressions have been run with the company’s revenues as the dependent variable. In
this case, revenues can be considered a reasonable choice to measure output because it gives an
idea about the value a company has been able to generate to the market exploiting its assets.
While looking at potential input-variables, a strong and statistically significant correlation
between the company’s revenues and the number of employees has been observed.
Undoubtedly, the employees are one of the crucial assets of the company and should - in this
case - be included in the DEA as an input variable.
30
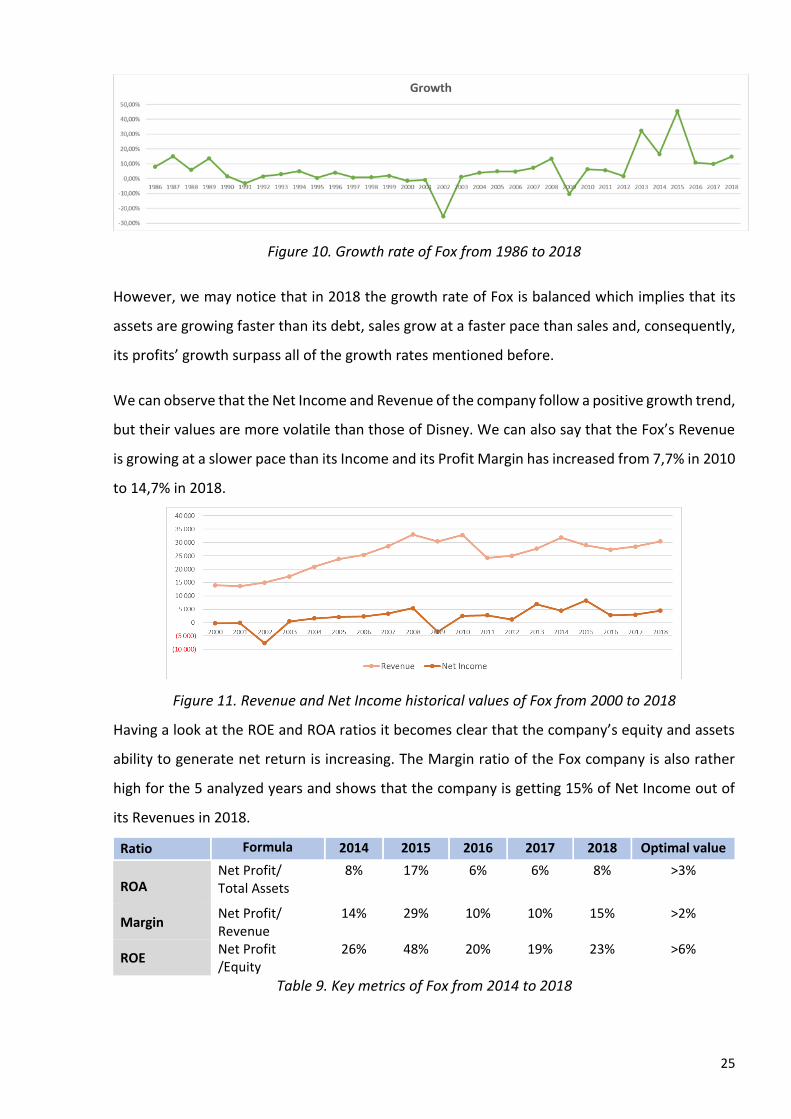
Table 17. Regression results of Revenues vs Number of Employees
Additionally, another statistically highly significant correlation has been observed between the
revenues and the total asset variable. Besides, the statistical significance of this variable
represents that this is a crucial variable for the companies.
Table 18. Regression results for Revenues vs Total Assets
The figures above provide an overview about the statistical regression data of the determined
inputs on the revenues as the output-variable.
For the efficiency measurement 42 companies that generate more than 1 billion revenues were
selected from the sample in order to increase the accuracy of the estimation.
The following table shows a list of companies by their efficiency scores obtained through the DEA
analysis with constant returns to scale and an input orientation. The most efficient companies in
generating revenues from its assets as well as the number of employees are Netflix and TV Tokyo
Holfings Corp. The Fox Corporation occupies the 6th place with its efficiency score of 76,94%. It
can be stated that the Walt Disney Company is performing worse in terms of efficiency than 21st
Century Fox, and is ranked the 24th among its competitors having an efficiency score of 41,61%.
Table 19. Rating of companies by their efficiency score
Regression on Revenues
Coefficient Std.Error t-ratio p-value R-squared
Number of employees 370600 15896,47 23,31 0,000 83,04%
Regression on Revenues
Coefficient Std.Error t-ratio p-value R-squared
Total Assets 0,386 0,00689 56,02 0,000 93,64%
Company Name CRS IO Score Total Assets Total Revenue EmployeesCountry of
Headquarters
1 Netflix Inc 100,00% 25 974 400 000,00 15 794 341 000,00 7 100,00 USA
2 TV TOKYO Holdings Corp 100,00% 1 156 437 041,22 1 384 368 530,02 1 539,00 Japan
3 Mediaset Espana Comunicacion SA 83,41% 1 371 879 300,85 1 117 622 029,54 1 258,00 Spain
4 CBS Corp 80,14% 21 859 000 000,00 14 514 000 000,00 12 770,00 USA
5 Kabel Deutschland Holding AG 79,71% 3 757 922 020,16 3 049 331 830,17 3 699,00 Germany
6 Fox Corp 76,94% 53 831 000 000,00 30 400 000 000,00 22 400,00 USA
7 AMC Networks Inc 76,20% 5 278 563 000,00 2 971 929 000,00 2 234,00 USA...
22 Comcast Corp 42,42% 251 684 000 000,00 94 507 000 000,00 184 000,00 USA
23 Cyfrowy Polsat SA 42,31% 7 973 799 879,34 2 823 580 108,59 4 810,00 Poland
24 Walt Disney Co 41,61% 98 598 000 000,00 59 434 000 000,00 201 000,00 USA
25 Cumulus Media Inc 41,36% 2 027 319 000,00 1 135 662 000,00 3 515,00 USA...
38 Liberty Media Corp 22,73% 10 957 000 000,00 1 827 000 000,00 4 555,00 USA
39 Hunan TV & Broadcast Intermediary Co Ltd 21,21% 3 649 969 397,35 1 343 541 210,83 12 807,00 China
40 Gray Television Inc 18,92% 4 213 445 000,00 1 084 132 000,00 7 371,00 USA
41 MNC Investama Tbk PT 13,92% 4 166 886 177,66 1 001 125 617,40 14 312,00 Indonesia
42 Jiangsu Broadcasting Cable Information Network Corp Ltd13,90% 4 949 585 554,00 1 244 194 792,74 20 354,00 China
31
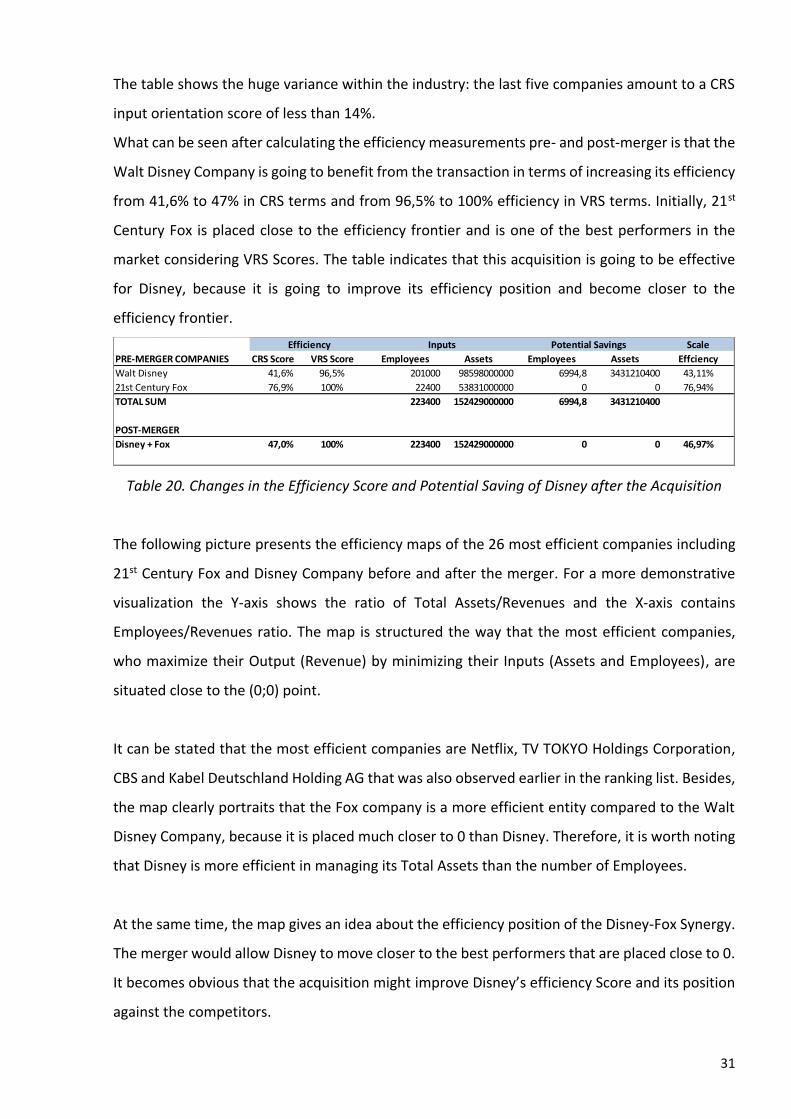
The table shows the huge variance within the industry: the last five companies amount to a CRS
input orientation score of less than 14%.
What can be seen after calculating the efficiency measurements pre- and post-merger is that the
Walt Disney Company is going to benefit from the transaction in terms of increasing its efficiency
from 41,6% to 47% in CRS terms and from 96,5% to 100% efficiency in VRS terms. Initially, 21st
Century Fox is placed close to the efficiency frontier and is one of the best performers in the
market considering VRS Scores. The table indicates that this acquisition is going to be effective
for Disney, because it is going to improve its efficiency position and become closer to the
efficiency frontier.
Table 20. Changes in the Efficiency Score and Potential Saving of Disney after the Acquisition
The following picture presents the efficiency maps of the 26 most efficient companies including
21st Century Fox and Disney Company before and after the merger. For a more demonstrative
visualization the Y-axis shows the ratio of Total Assets/Revenues and the X-axis contains
Employees/Revenues ratio. The map is structured the way that the most efficient companies,
who maximize their Output (Revenue) by minimizing their Inputs (Assets and Employees), are
situated close to the (0;0) point.
It can be stated that the most efficient companies are Netflix, TV TOKYO Holdings Corporation,
CBS and Kabel Deutschland Holding AG that was also observed earlier in the ranking list. Besides,
the map clearly portraits that the Fox company is a more efficient entity compared to the Walt
Disney Company, because it is placed much closer to 0 than Disney. Therefore, it is worth noting
that Disney is more efficient in managing its Total Assets than the number of Employees.
At the same time, the map gives an idea about the efficiency position of the Disney-Fox Synergy.
The merger would allow Disney to move closer to the best performers that are placed close to 0.
It becomes obvious that the acquisition might improve Disney’s efficiency Score and its position
against the competitors.
Scale
PRE-MERGER COMPANIES CRS Score VRS Score Employees Assets Employees Assets Effciency
Walt Disney 41,6% 96,5% 201000 98598000000 6994,8 3431210400 43,11%
21st Century Fox 76,9% 100% 22400 53831000000 0 0 76,94%
TOTAL SUM 223400 152429000000 6994,8 3431210400
POST-MERGER
Disney + Fox 47,0% 100% 223400 152429000000 0 0 46,97%
Inputs Potential SavingsEfficiency

32
Figure 14. Efficiency map of broadcasting industry
4.3 Valuation of companies
Discounted Cash Flow method
The discounted cash flow valuation of Fox and Disney is based on data from the companies’
annual reports and the Thomas Reuter Eikon database for the years 2013 to 2018.
First of all, we should estimate the Weighted Average Cost of Capital (WACC) for both
companies. The default spread of both firms is borrowed from the Moody’s Bond Rating System,
where Disney is given Aa2 rating which corresponds to the default spread of 0,5% and FOX
received Baa1 rating that corresponds to 1,5% for the default spread.
Besides, for the further analysis the US Treasury Bond yield rate is taken as the risk-free rate,
which according to Bloomberg, is estimated as 2,2% for 5 years. Expected rate of return on
market portfolio (Market Risk Premium) is considered to be 11,99% and the companies’ betas
are estimated to be 1,23 for FOX company and 1,3 for Disney.
33
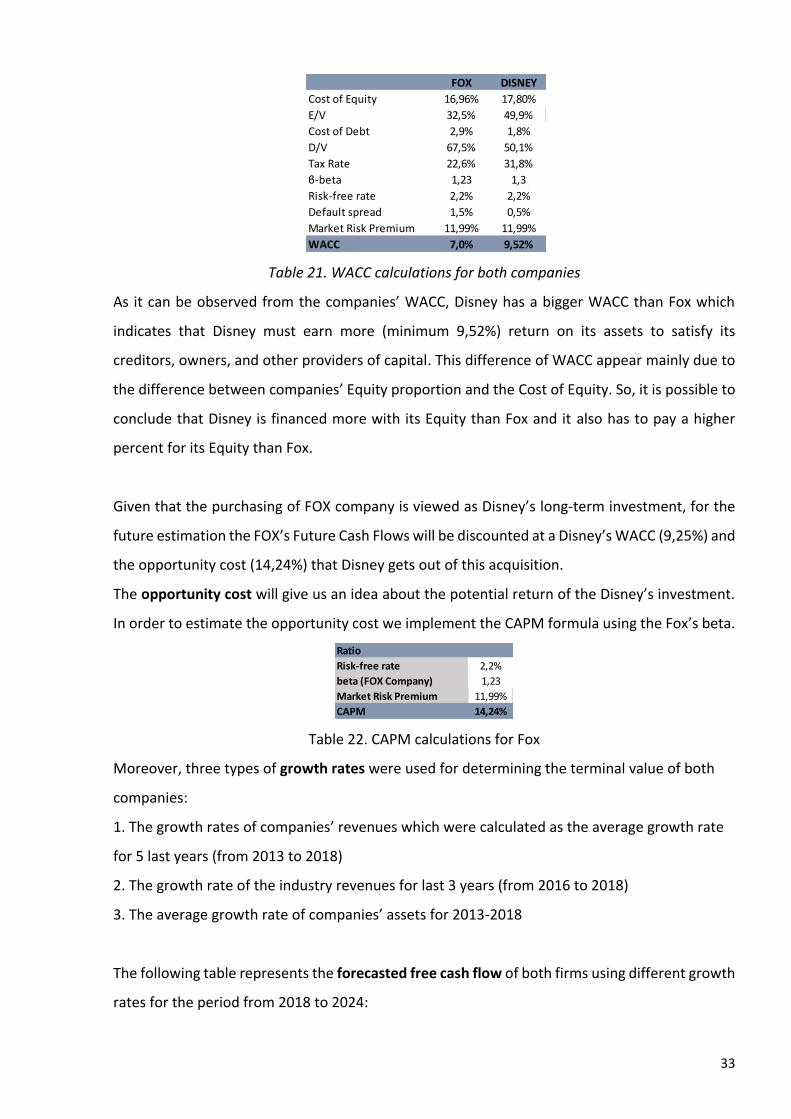
Table 21. WACC calculations for both companies
As it can be observed from the companies’ WACC, Disney has a bigger WACC than Fox which
indicates that Disney must earn more (minimum 9,52%) return on its assets to satisfy its
creditors, owners, and other providers of capital. This difference of WACC appear mainly due to
the difference between companies’ Equity proportion and the Cost of Equity. So, it is possible to
conclude that Disney is financed more with its Equity than Fox and it also has to pay a higher
percent for its Equity than Fox.
Given that the purchasing of FOX company is viewed as Disney’s long-term investment, for the
future estimation the FOX’s Future Cash Flows will be discounted at a Disney’s WACC (9,25%) and
the opportunity cost (14,24%) that Disney gets out of this acquisition.
The opportunity cost will give us an idea about the potential return of the Disney’s investment.
In order to estimate the opportunity cost we implement the CAPM formula using the Fox’s beta.
Table 22. CAPM calculations for Fox
Moreover, three types of growth rates were used for determining the terminal value of both
companies:
1. The growth rates of companies’ revenues which were calculated as the average growth rate
for 5 last years (from 2013 to 2018)
2. The growth rate of the industry revenues for last 3 years (from 2016 to 2018)
3. The average growth rate of companies’ assets for 2013-2018
The following table represents the forecasted free cash flow of both firms using different growth
rates for the period from 2018 to 2024:
FOX DISNEY
Cost of Equity 16,96% 17,80%
E/V 32,5% 49,9%
Cost of Debt 2,9% 1,8%
D/V 67,5% 50,1%
Tax Rate 22,6% 31,8%
ϐ-beta 1,23 1,3
Risk-free rate 2,2% 2,2%
Default spread 1,5% 0,5%
Market Risk Premium 11,99% 11,99%
WACC 7,0% 9,52%
Ratio
Risk-free rate 2,2%
beta (FOX Company) 1,23
Market Risk Premium 11,99%
CAPM 14,24%
34
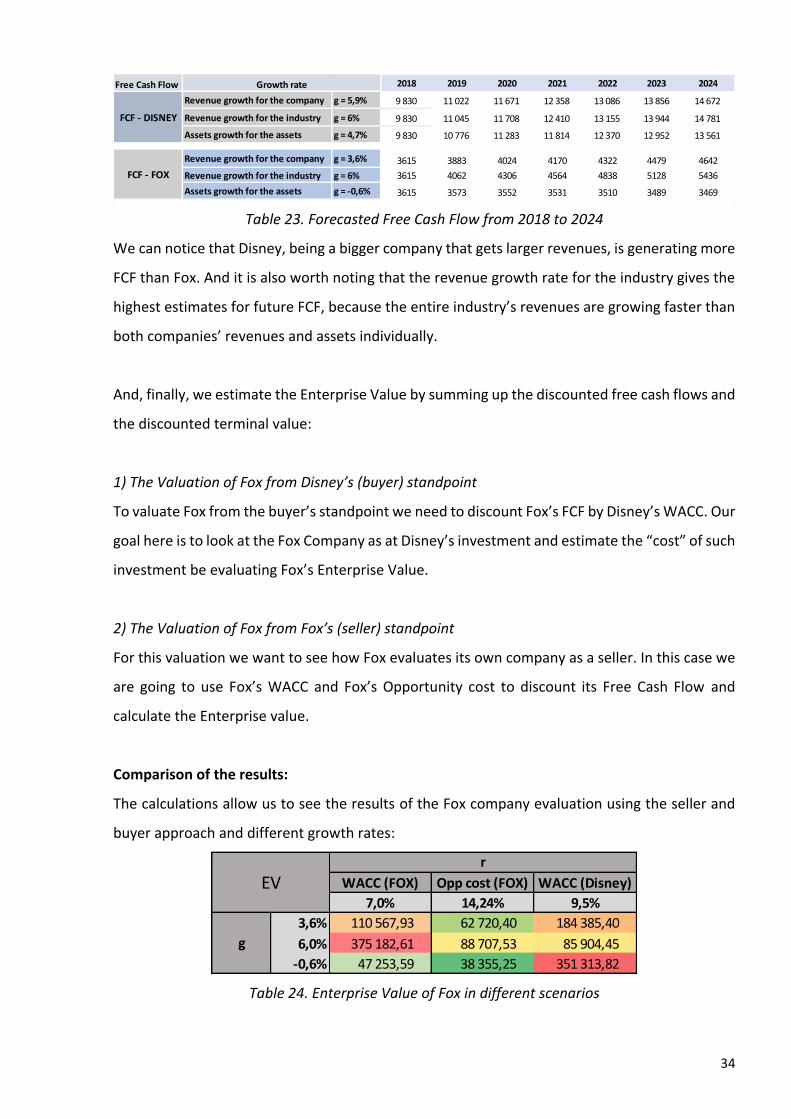
Table 23. Forecasted Free Cash Flow from 2018 to 2024
We can notice that Disney, being a bigger company that gets larger revenues, is generating more
FCF than Fox. And it is also worth noting that the revenue growth rate for the industry gives the
highest estimates for future FCF, because the entire industry’s revenues are growing faster than
both companies’ revenues and assets individually.
And, finally, we estimate the Enterprise Value by summing up the discounted free cash flows and
the discounted terminal value:
1) The Valuation of Fox from Disney’s (buyer) standpoint
To valuate Fox from the buyer’s standpoint we need to discount Fox’s FCF by Disney’s WACC. Our
goal here is to look at the Fox Company as at Disney’s investment and estimate the “cost” of such
investment be evaluating Fox’s Enterprise Value.
2) The Valuation of Fox from Fox’s (seller) standpoint
For this valuation we want to see how Fox evaluates its own company as a seller. In this case we
are going to use Fox’s WACC and Fox’s Opportunity cost to discount its Free Cash Flow and
calculate the Enterprise value.
Comparison of the results:
The calculations allow us to see the results of the Fox company evaluation using the seller and
buyer approach and different growth rates:
Table 24. Enterprise Value of Fox in different scenarios
Free Cash Flow 2018 2019 2020 2021 2022 2023 2024
Revenue growth for the company g = 5,9% 9 830 11 022 11 671 12 358 13 086 13 856 14 672
Revenue growth for the industry g = 6% 9 830 11 045 11 708 12 410 13 155 13 944 14 781
Assets growth for the assets g = 4,7% 9 830 10 776 11 283 11 814 12 370 12 952 13 561
Revenue growth for the company g = 3,6% 3615 3883 4024 4170 4322 4479 4642
Revenue growth for the industry g = 6% 3615 4062 4306 4564 4838 5128 5436
Assets growth for the assets g = -0,6% 3615 3573 3552 3531 3510 3489 3469
FCF - DISNEY
FCF - FOX
Growth rate
WACC (FOX) Opp cost (FOX) WACC (Disney)
7,0% 14,24% 9,5%
3,6% 110 567,93 62 720,40 184 385,40
6,0% 375 182,61 88 707,53 85 904,45
-0,6% 47 253,59 38 355,25 351 313,82
EV
g
r

35
We can state that the seller ranges the Enterprise Value of Fox between $38 355 million and
$375 183 million, while the buyer ranges it between $85 904 billion and $351 314 million taking
different scenarios into account. We can tell that Disney’s lowest estimate of Fox’s EV is almost
twice as higher than the lowest estimate of EV from the side of Fox.
It is also worth mentioning that the EV estimated using the expected grow of the industry and
opportunity cost for Fox is around $88 707 million which is very close to the buyer’s estimate,
which accounts to $85 904 million. In this case we may conclude that both companies agree on
the takeover price of Fox.
Since Fox’s purchase price for Disney accounts to $71 300 million and the Fox’s EV is estimated
in the range of $88 707 million - $85 904 million, we can conclude that Disney has acquired the
Fox company cheaper compared to the lower bound of EV estimates. This tells us that the deal
was beneficial for Disney.
Synergy effect
We can also estimate the consequences and effects of the acquisition deal on the buyer-company
Disney. For that we will look at how the revenue structure changes: discover the impact on
expenses, costs of goods sold and net income; estimate the shift in a market share of Disney and
its EV after the deal.
Revenue structure – Synergy Effect
First of all, we want to forecast potential revenues, net income and costs’ shift after the
acquisition.
36
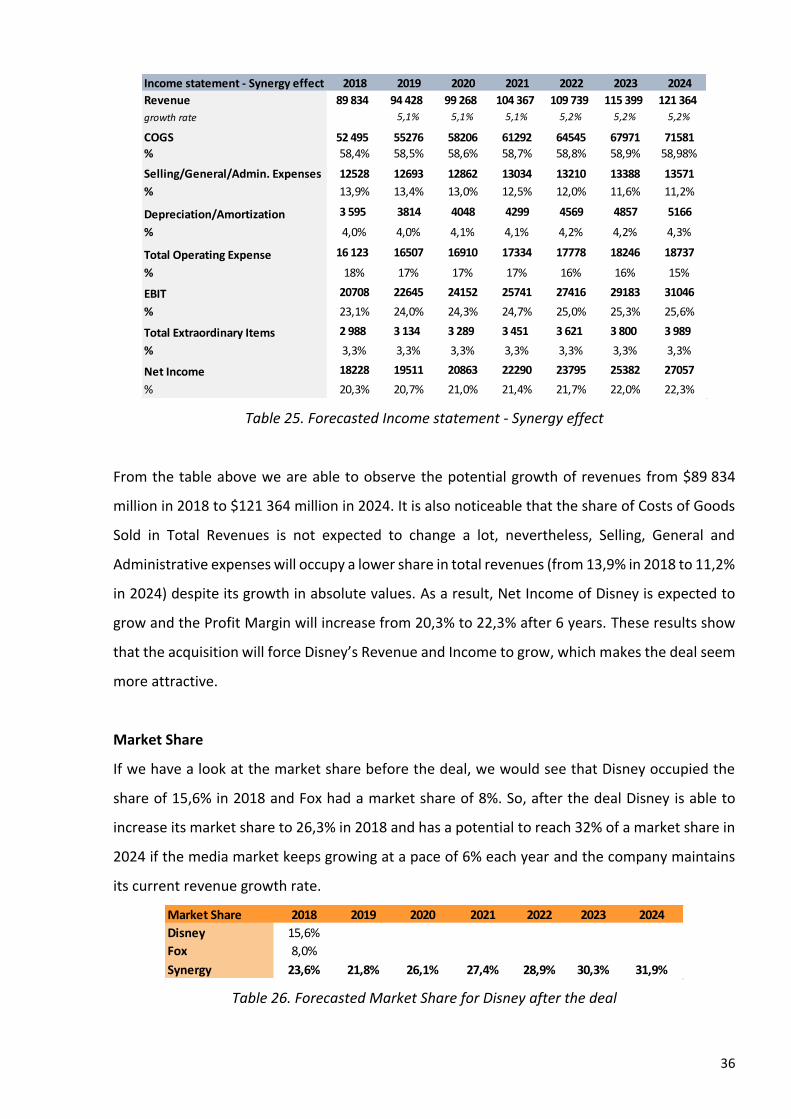
Table 25. Forecasted Income statement - Synergy effect
From the table above we are able to observe the potential growth of revenues from $89 834
million in 2018 to $121 364 million in 2024. It is also noticeable that the share of Costs of Goods
Sold in Total Revenues is not expected to change a lot, nevertheless, Selling, General and
Administrative expenses will occupy a lower share in total revenues (from 13,9% in 2018 to 11,2%
in 2024) despite its growth in absolute values. As a result, Net Income of Disney is expected to
grow and the Profit Margin will increase from 20,3% to 22,3% after 6 years. These results show
that the acquisition will force Disney’s Revenue and Income to grow, which makes the deal seem
more attractive.
Market Share
If we have a look at the market share before the deal, we would see that Disney occupied the
share of 15,6% in 2018 and Fox had a market share of 8%. So, after the deal Disney is able to
increase its market share to 26,3% in 2018 and has a potential to reach 32% of a market share in
2024 if the media market keeps growing at a pace of 6% each year and the company maintains
its current revenue growth rate.
Table 26. Forecasted Market Share for Disney after the deal
Income statement - Synergy effect 2018 2019 2020 2021 2022 2023 2024
Revenue 89 834 94 428 99 268 104 367 109 739 115 399 121 364
growth rate 5,1% 5,1% 5,1% 5,2% 5,2% 5,2%
COGS 52 495 55276 58206 61292 64545 67971 71581
% 58,4% 58,5% 58,6% 58,7% 58,8% 58,9% 58,98%
Selling/General/Admin. Expenses 12528 12693 12862 13034 13210 13388 13571
% 13,9% 13,4% 13,0% 12,5% 12,0% 11,6% 11,2%
Depreciation/Amortization 3 595 3814 4048 4299 4569 4857 5166
% 4,0% 4,0% 4,1% 4,1% 4,2% 4,2% 4,3%
Total Operating Expense 16 123 16507 16910 17334 17778 18246 18737
% 18% 17% 17% 17% 16% 16% 15%
EBIT 20708 22645 24152 25741 27416 29183 31046
% 23,1% 24,0% 24,3% 24,7% 25,0% 25,3% 25,6%
Total Extraordinary Items 2 988 3 134 3 289 3 451 3 621 3 800 3 989
% 3,3% 3,3% 3,3% 3,3% 3,3% 3,3% 3,3%
Net Income 18228 19511 20863 22290 23795 25382 27057
% 20,3% 20,7% 21,0% 21,4% 21,7% 22,0% 22,3%
Market Share 2018 2019 2020 2021 2022 2023 2024
Disney 15,6%
Fox 8,0%
Synergy 23,6% 21,8% 26,1% 27,4% 28,9% 30,3% 31,9%

37
Synergy Valuation
Next we would like to see the difference between the valuation of both companies individually
as if there is no acquisition deal and the valuation of Disney after the deal considering the synergy
effects.
Table 26. Disney’s EV before and after the acquisition
From the table above we can observe that potential takeover price of Disney is larger compared
to Fox and varies in a range from $352 375 million to $505 673 million, while Fox Enterprise Value
is estimated in a range from $47 254 million to $375 183 million. However, after the deal the
combined firm will be valuated much higher and can vary from $440 817 million to $1 281 568
million. These results allow us to assume that purchasing of Fox will increase the Enterprise Value
and investment attractiveness of Disney.
Deal
Disney Fox Sum 9,5%
3,6% 488 124,23 110 567,93 598 692,17 911 973,87
6,0% 505 672,63 375 182,61 880 855,24 1 281 567,40
-0,6% 352 374,94 47 253,59 399 628,53 440 816,79
g
No dealEV

38
5. Conclusion
Summing up the results we obtained, we can say that despite the doubtless benefits that Disney
is going to get out of the acquisition deal, which are: increasing its influence in the market,
extending its content library and increasing the facilities for introducing its own streaming
service, the company is going to get some efficiency and financial benefits.
Firstly, we can see that in the sale of efficiency the Walt Disney Company is not performing its
best among its competitors. However, after the acquisition deal it is able to increase its efficiency
score (from 41,6% to 47%) and generate more return using less assets and workforce.
Secondly, it is important to emphasize that the price of the acquisition ($71,3 billion) seems
reasonable for Disney and this deal is beneficial from the purchasing standpoint, because it does
not exceed much the estimated Enterprise Value of Fox.
Thirdly, the deal will encourage Disney’s Revenues and Income to grow in future (by 35% and
by 48% in 2024 respectively) and it also will influence its expenses to reduce.
In addition, purchasing of Fox will encourage Disney’s market share to grow from 15,6% in 2018
to 31,9% in 2024, which will strengthen the company’s position in the media market.
Finally, we are able to assume that the Enterprise Value of Disney will increase sufficiently (more
than twice as the best estimate).
In conclusion, the acquisition of 21st Century Fox by the Walt Disney Company seems reasonable
with regards to the business scope of both companies, efficiency improvement, increase of
market share and the value created through the deal. So, we can say that the hypothesis that we
stated in the introduction (that the deal is going to create positive value for Disney’s shareholders
and its investors) can be confirmed.
Limitations
In this paper the discounted cash flow method is applied using only 3 types of growth rates: the
companies’ revenues growth rates, their assets’ growth rates and the media industry’s growth

39
rate. For the more accurate analysis a larger number of growth rates could be used to estimate
the enterprise values of companies more accurately. For example, a growth rate of Earnings Per
Share could be used, or the US GDP growth rate etc.
Also, to establish the relationship in the regression between Revenues and such inputs as Assets
and Number of Employees we took 113 companies. So, for a more precise estimation a larger
sample can be used in future.
Besides, for the efficiency score estimation we used 42 companies that generate more than $1
billion of Revenues. In future more companies could be taken into account to make the results
more robust.
Moreover, we forecasted the synergy results assuming that the growth rates of both companies
are maintaining the same until 2024. However, in reality we cannot guarantee that the growth
rates will not change. So, for the future estimates some random variable can be introduced or
different scenarios could be taken into account for more accurate estimations.
Finally, in frames of this thesis we applied only one valuation method – the Discounted Cash Flow
Model. For the further research more methods could be implemented to value both companies,
such as Price multiple methods.
40
List of Abbreviations and Acronyms
CA – Current Assets
CAPM - Capital Asset Pricing Model
CF – Cash Flow
CL – Current Liabilities
CRS – Constant Return to Scale
DCF – Discounted Cash Flow
DEA - Data Envelopment Analysis
EBIT – Earnings Before Interests and Taxes
EBITDA - Earnings Before Interests, Taxes, Depreciation and Amortization
EPS - Earnings Per Share
EV – Enterprise Value
FA – Fixed Assets
FCF – Free Cash Flow
M&A – Mergers and Acquisitions
M&E – Media and Entertainment
P/E – Price per Earnings
ROA – Return on Assets
ROE – Return on Equity
ROI – Return on Investments
VRS - Variable Return to Scale
WACC – Weighted Average Cost of Capital
WC – Working Capital

41
References:
Barbara S. Petitt, Kenneth R. Ferris (2013). Valuation for Mergers and Acquisitions. v.2, p. 256
Bert M. Balk (2003). The Residual: On Monitoring and Benchmarking Firms, Industries, and
Economies with Respect to Productivity, Journal of Productivity Analysis, 20, pp. 5-47
Betas by Sector (US) (January, 2019). Available from:
http://pages.stern.nyu.edu/~adamodar/New_Home_Page/datafile/Betas.html
Bloomberg, Murdoch Billionaires Multiply After Disney Closes Fox Deal (March 19, 2019).
Available from: https://www.bloomberg.com/news/articles/2019-03-19/murdoch-billionaires-
to-multiply-after-disney-completes-fox-deal
Bloomberg, United States Rates & Bonds. Available from:
https://www.bloomberg.com/markets/rates-bonds/government-bonds/us
Brandon Katz (December 14, 2017). Disney vs. Netflix: How the Fox Sale Turns the Tide of the
Streaming Wars Forever. Available from: https://observer.com/2017/12/disney-fox-sale-netflix-
marvel-x-men-hulu-streaming-wars-details/
Capital Asset Pricing Model (CAPM) for 21st Century Fox. Available from: https://www.stock-
analysis-on.net/NASDAQ/Company/Twenty-First-Century-Fox-Inc/DCF/CAPM
Capital Asset Pricing Model (CAPM) for Disney. Available from: https://www.stock-analysis-
on.net/NYSE/Company/Walt-Disney-Co/DCF/CAPM
Damodaran, A. (2012). Investment Valuation: Tools and Techniques for Determining the Value of
Any Asset, 3rd Edition, John Wiley & Sons.
Deloitte Report (2019). 2019 Media & Entertainment Industry Outlook. Available from:
https://www2.deloitte.com/us/en/pages/technology-media-and-
telecommunications/articles/media-and-entertainment-industry-outlook-trends.html
Disney and 21st Century Fox Announce per Share Value in Connection with $71 Billion
Acquisition. Available from: https://www.thewaltdisneycompany.com/disney-and-21st-century-
fox-announce-per-share-value-in-connection-with-71-billion-acquisition/
Disney and 21st Century Fox Announce per Share Value in Connection with $71 Billion Acquisition
(March 19, 2019). Available from: https://www.thewaltdisneycompany.com/disney-and-21st-
century-fox-announce-per-share-value-in-connection-with-71-billion-acquisition/

42
Disney’s Acquisition of 21st Century Fox Will Bring an Unprecedented Collection of Content and
Talent to Consumers Around the World (March 19, 2019). Available from:
https://www.thewaltdisneycompany.com/disneys-acquisition-of-21st-century-fox-will-bring-
an-unprecedented-collection-of-content-and-talent-to-consumers-around-the-world/
Florian Steiger (2010). The Validity of Company Valuation Using Discounted Cash Flow Methods,
p. 21
Imam, S., Barker, R. and Clubb, C. (2008). The use of valuation models by UK investment analysts,
European Accounting Review, 17(3), 503-535.
Institute of Mergers, Acquisitions and Alliances (IMAA): M&A Statistics (2019). Available from:
https://imaa-institute.org/mergers-and-acquisitions-statistics/
Jeff Desjardins, Visualizing the Changing Landscape of Big Media (January 30, 2018). Available
from: https://www.visualcapitalist.com/changing-landscape-big-media
Jenifer Piesse, Cheng Few Lee, Lin Lin, Hsien Chang K Uo (November, 2013). Merger and
Acquisition: Definitions, Motives, and Market Responses, Lee Alice: Encyclopedia of Finance,
chapter 27, pp. 541-554
Kevin Plumen (2015). Mergers & Acquisitions: An Entertainment and Media Conglomerate,
Universidade Catolica Portuguesa, p. 71
Michael E. E. Frankel, Larry H. Forman (2005). Mergers and Acquisitions Basics, John Wiley &
Sons, Inc., Second Edition, p. 308
Moody's assigns A2 rating to Disney's new revolving credit facilities (March, 2018). Available
from: https://www.moodys.com/research/Moodys-assigns-A2-rating-to-Disneys-new-
revolving-credit-facilities--PR_380726
Moody's places 21st Century Fox's Baa1 ratings on review for upgrade (December, 2017).
Available from: https://www.moodys.com/research/Moodys-places-21st-Century-Foxs-Baa1-
ratings-on-review-for--PR_377115?cy=easterneur&lang=ru
Oriol Amat, Maria Jesus Soriano (2016). Finance and Accounting, p. 207
Paul Nillesen, Michael Pollitt and Kim Keats (2001). Identifying and qualifying the gains from m&a.
Strategic Benchmarking
Peter Bogetoft, Lars Otto (2011). Benchmarking with DEA, SFA, and R. Vol. 157, p. 351

43
Prateek Agarwal, Rahul Mittal (Month: April 2014 - September 2014). Mergers and Acquisitions
analysis with the case study method, International Journal of Management and Commerce
Innovations. Vol. 2, Issue 1, pp: 236-244
PricewaterhouseCoopers (PWC) (2017). Perspectives from the Global Entertainment and Media
Outlook 2017–2021. Available from: https://www.pwc.com/gx/en/entertainment-
media/pdf/outlook-2017-curtain-up.pdf
Robert F. Bruner (2004). Applied Mergers and Acquisitions. John Wiley & Sons, p. 1056
Statista Research Department, Revenue of the Walt Disney Company 2010-2018, by region
(November 27, 2018). Available from: https://www.statista.com/statistics/193263/revenue-of-
the-walt-disney-company-in-different-regions/
Stock Price of Disney. Available from: https://www.investing.com/equities/disney
Stock Price of Fox. Available from: https://simplywall.st/stocks/us/media/nasdaq-foxa/fox
The Media and Entertainment Industry in the United States. Available from:
https://www.selectusa.gov/media-entertainment-industry-united-states
The Wall Street Journal, Media Behemoths (December 7, 2016). Available from:
https://www.wsj.com/livecoverage/att-timewarner-senate-hearing/card/1481127262
Thomas Reuters Eikon Database (March 15,2019). Companies’ metrics in Media Industry by
company from 2016 to 2018
Thomas Reuters Eikon Database (March 15,2019). The Walt Disney Company Balance sheet
(1983-2018)
Thomas Reuters Eikon Database (March 15,2019). The Walt Disney Company Income Statement
(1983-2018)
Thomas Reuters Eikon Database (March 15,2019). The Walt Disney Company Cash Flow
Statement (1984-2018)
Thomas Reuters Eikon Database (March 15,2019). Twenty-First Century Fox Balance sheet (1986-
2018)
Thomas Reuters Eikon Database (March 15,2019). Twenty-First Century Income Statement
(1986-2018)

44
Thomas Reuters Eikon Database (March 15,2019). Twenty-First Century Cash Flow Statement
(1987-2018)
TWDC Enterprise Merger Agreement, Form 8-K (March 20, 2019). Available from:
https://www.sec.gov/Archives/edgar/data/1744489/000095015719000301/form8k-12b.htm
Video Streaming Market Size, Share & Trends Analysis Report by Streaming Scope, By Solution
Scope, By Platform Scope, By Revenue Model, By Service, By Deployment, By User, And Segment
Forecasts, 2019 – 2025 (February, 2019). p. 100. Available from:
https://www.grandviewresearch.com/industry-analysis/video-streaming-market

45
Appendices
Twenty-First Century Fox Inc - Balance Sheet - from 2014 to 2018 - Thomson Reuters Eikon
Twenty-First Century Fox Inc – Income Statement -- from 2014 to 2018 Thomson Reuters
Eikon
Balance Sheet 2014 % 2015 % 2016 % 2017 % 2018 %Assets ($ Mill ions)
Cash and Short Term Investments 5 415 9,9% 8 428 16,8% 4 424 9,2% 6 163 12,2% 7 622 14,2%
Accounts Receivable - Trade, Net 6 468 11,8% 5 912 11,8% 6 258 13,0% 6 477 12,8% 7 120 13,2%
Total Receivables, Net 6 468 11,8% 5 912 11,8% 6 258 13,0% 6 477 12,8% 7 120 13,2%
Total Inventory 3 092 5,6% 2 749 5,5% 3 291 6,8% 3 101 6,1% 3 669 6,8%
Other Current Assets, Total 401 0,7% 259 0,5% 976 2,0% 545 1,1% 922 1,7%
Total Current Assets 15 376 28,1% 17 348 34,7% 14 949 31,0% 16 286 32,1% 19 333 35,9%
0,0% 0,0%
Property/Plant/Equipment, Total - Gross 8 231 15,0% 4 188 8,4% 4 292 8,9% 4 494 8,9% 4 887 9,1%
Accumulated Depreciation, Total (5 300) -9,7% (2 466) -4,9% (2 600) -5,4% (2 713) -5,3% (2 931) -5,4%
Goodwill, Net 18 052 32,9% 12 513 25,0% 12 733 26,4% 12 792 25,2% 12 768 23,7%
Intangibles, Net 8 072 14,7% 6 320 12,6% 6 777 14,1% 6 574 13,0% 6 101 11,3%
Long Term Investments 2 859 5,2% 4 529 9,1% 3 863 8,0% 3 902 7,7% 4 112 7,6%
Other Long Term Assets, Total 7 049 12,9% 7 213 14,4% 7 790 16,2% 8 846 17,4% 8 837 16,4%
Total Assets 54 793 100,0% 50 039 100,0% 48 193 100,0% 50 724 100,0% 53 831 100,0%
Liabilities ($ Mill ions)
Accounts Payable 1 638 3,0% 1 001 2,0% 1 283 2,7% 1 093 2,2% 1 368 2,5%
Payable/Accrued 4 183 7,6% 3 717 7,4% 3 181 6,6% 406 0,8% 443 0,8%
Current Port. of LT Debt/Capital Leases 799 1,5% 244 0,5% 427 0,9% 457 0,9% 1 054 2,0%
Other Current l iabilities, Total 2 236 4,1% 2 080 4,2% 2 177 4,5% 2 850 5,6% 2 940 5,5%
Total Current Liabilities 8 856 16,2% 7 042 14,1% 7 068 14,7% 7 238 14,3% 8 244 15,3%
0,0% 0,0% 0,0% 0,0% 0,0%
Total Long Term Debt 18 259 33,3% 18 795 37,6% 19 126 39,7% 19 456 38,4% 18 469 34,3%
Total Debt 19 058 34,8% 19 039 38,0% 19 553 40,6% 19 913 39,3% 19 523 36,3%
Deferred Income Tax 2 729 5,0% 2 290 4,6% 2 888 6,0% 2 782 5,5% 1 892 3,5%
Minority Interest 4 024 7,3% 1 587 3,2% 1 772 3,7% 1 910 3,8% 1 998 3,7%
Other Liabilities, Total 3 507 6,4% 3 105 6,2% 3 678 7,6% 3 616 7,1% 3 664 6,8%
Total Liabilities 37 375 68,2% 32 819 65,6% 34 532 71,7% 35 002 69,0% 34 267 63,7%
Shareholders Equity ($ Mill ions)
Common Stock, Total 22 0,0% 20 0,0% 19 0,04% 19 0,04% 19 0,04%
Additional Paid-In Capital 15 041 27,5% 13 427 26,8% 12 211 25,3% 12 406 24,5% 12 612 23,4%
Retained Earnings (Accumulated Deficit) 2 389 4,4% 5 343 10,7% 3 575 7,4% 5 315 10,5% 8 934 16,6%
Other Equity, Total (34) -0,1% (1 570) -3,1% (2 144) -4,4% (2 018) -4,0% (2 001) -3,7%
Total Equity 17 418 31,8% 17 220 34,4% 13 661 28,3% 15 722 31,0% 19 564 36,3%
Total Liabilities & Shareholders' Equity 54 793 100% 50 039 100% 48 193 100,0% 50 724 100,0% 53 831 100,0%
2014 % 2015 % 2016 % 2017 % 2018 %31 867 100,0% 28 987 100,0% 27 326 100,0% 28 500 100,0% 30 400 100,0%
21 108 66,2% 18 561 64,0% 17 129 62,7% 17 775 62,4% 19 769 65,0%
10 759 33,8% 10 426 36,0% 10 197 37,3% 10 725 37,6% 10 631 35,0%
4 129 13,0% 3 784 13,1% 3 675 13,4% 3 617 12,7% 3 668 12,1%
1 142 3,6% 736 2,5% 530 1,9% 553 1,9% 584 1,9%
1 121 3,5% 1 198 4,1% 1 184 4,3% 1 219 4,3% 1 248 4,1%
(821) -2,6% (842) -2,9% 8 0,0% 5 0,0% 53 0,2%
10 0,0% (4 291) -14,8% 566 2,1% 578 2,0% 516 1,7%
(11) 0,0% (6) 0,0% 80 0,3% 64 0,2% 152 0,5%
26 678 83,7% 19 140 66,0% 23 172 84,8% 23 811 83,5% 25 990 85,5%
5 189 16,3% 9 847 34,0% 4 154 15,2% 4 689 16,5% 4 410 14,5%
1 272 4,0% 1 243 4,3% 1 130 4,1% 1 419 5,0% 936 3,1%
3 917 12,3% 8 604 29,7% 3 024 11,1% 3 270 11,5% 3 474 11,4%
(132) -0,4% (231) -0,8% (261) -1,0% (274) -1,0% (298) -1,0%
3 785 11,9% 8 373 28,9% 2 763 10,1% 2 996 10,5% 3 176 10,4%
729 2,3% (67) -0,2% (8) 0,0% (44) -0,2% (12) 0,0%
729 2,3% (67) -0,2% (8) 0,0% (44) -0,2% 1 288 4,2%
4 514 14,2% 8 306 28,7% 2 755 10,1% 2 952 10,4% 4 464 14,7%
Discontinued Operations
Total Extraordinary Items
Net Income
Minority Interest
Net Income Before Extra. Items
Net Income Before Taxes (EBT)
Provision for Income Taxes
Net Income After Taxes
Total Operating Expense
Other Operating Expenses, Total
Unusual Expense (Income)
Interest Expense, Net - Operating
Interest/Investment Income - Operating
Gross Profit (EBITDA)
Selling/General/Admin. Expenses, Total
Depreciation/Amortization
Revenue
Cost of Revenue, Total
Income Statement ($ Millions)

46
Twenty-First Century Fox Inc – Cash Flow Statement -- from 2014 to 2018 - Thomson Reuters
Eikon
Cash Flow ($ Millions) 2014 2015 2016 2017 2018
Net Income/Starting Line 4 646,0 8 537,0 3 016,0 3 226,0 4 762,0
Depreciation/Depletion 1 142,0 736,0 530,0 553,0 584,0
Deferred Taxes -- 171,0 466,0 89,0 (903,0)
Non-Cash Items (869,0) (4 919,0) 531,0 890,0 984,0
Changes in Working Capital (1 384,0) (957,0) (1 515,0) (1 001,0) (1 261,0)
Accounts Receivable (790,0) (261,0) (1 060,0) (401,0) (801,0)
Inventories (1 057,0) (825,0) (806,0) (991,0) (422,0)
Payable/Accrued 105,0 (223,0) 0,0 152,0 401,0
Other Operating Cash Flow 358,0 352,0 351,0 186,0 235,0
Cash from Operating Activities 3 535,0 3 568,0 3 028,0 3 757,0 4 166,0
Capital Expenditures (678,0) (424,0) (263,0) (377,0) (551,0)
Purchase of Fixed Assets (678,0) (424,0) (263,0) (377,0) (551,0)
Other Investing Cash Flow Items, Total (257,0) 7 160,0 (1 375,0) (375,0) (626,0)
Acquisition of Business (692,0) (142,0) (916,0) (75,0) (7,0)
Sale of Fixed Assets 518,0 8 627,0 0,0 0,0 365,0
Purchase of Investments (83,0) (1 325,0) (459,0) (300,0) (984,0)
Cash from Investing Activities (935,0) 6 736,0 (1 638,0) (752,0) (1 177,0)
Financing Cash Flow Items (137,0) (652,0) (290,0) (64,0) (68,0)
Other Financing Cash Flow (137,0) (652,0) (290,0) (64,0) (68,0)
Total Cash Dividends Paid (792,0) (878,0) (821,0) (943,0) (993,0)
Cash Dividends Paid - Common (792,0) (878,0) (821,0) (943,0) (993,0)
Issuance (Retirement) of Stock, Net (3 706,0) (5 888,0) (4 892,0) (619,0) 0,0
Repurchase/Retirement of Common (3 772,0) (5 939,0) (4 904,0) (619,0) 0,0
Common Stock, Net (3 706,0) (5 888,0) (4 892,0) (619,0) 0,0
Issuance (Retirement) of Debt, Net 859,0 316,0 673,0 345,0 (403,0)
Total Debt Issued 1 155,0 3 161,0 1 360,0 918,0 1 469,0
Total Debt Reduction (296,0) (2 845,0) (687,0) (573,0) (1 872,0)
Cash from Financing Activities (3 776,0) (7 102,0) (5 330,0) (1 281,0) (1 464,0)
Free Cash Flow 2 857,0 3 144,0 2 765,0 3 380,0 3 615,0

47
Twenty-First Century Fox Inc – Ratios- from 2014 to 2018

48
Walt Disney - Balance Sheet- from 2014 to 2018 - Thomson Reuters Eikon
Walt Disney - Income Statement - from 2014 to 2018 - Thomson Reuters Eikon
Balance Sheet 2014 % 2015 % 2016 % 2017 % 2018 %Assets ($ Millions)
Cash and Short Term Investments 3 421 4,1% 4 269 4,8% 4 610 5,0% 4 017 4,2% 4 150 4,2%
Accounts Receivable - Trade, Net 7 274 8,6% 7 456 8,5% 8 305 9,0% 7 826 8,2% 8 076 8,2%
Total Receivables, Net 7 822 9,3% 8 019 9,1% 9 065 9,8% 8 633 9,0% 9 334 9,5%
Total Inventory 1 574 1,9% 1 571 1,8% 1 390 1,5% 1 373 1,4% 1 392 1,4%
Prepaid Expenses 425 0,5% 469 0,5% 449 0,5% 445 0,5% 476 0,5%
Other Current Assets, Total 1 934 2,3% 2 430 2,8% 1 452 1,6% 1 421 1,5% 1 473 1,5%
Total Current Assets 15 176 18,0% 16 758 19,0% 16 966 18,4% 15 889 16,6% 16 825 17,1%
Property/Plant/Equipment, Total - Gross 47 054 55,9% 50 023 56,7% 54 198 58,9% 57 443 60,0% 60 304 61,2%
Accumulated Depreciation, Total (23 722) -28,2% (24 844) -28,2% (26 849) -29,2% (29 037) -30,3% (30 764) -31,2%
Goodwill, Net 27 881 33,1% 27 826 31,6% 27 810 30,2% 31 426 32,8% 31 269 31,7%
Intangibles, Net 12 759 15,2% 13 355 15,1% 13 288 14,4% 14 476 15,1% 14 700 14,9%
Long Term Investments 2 735 3,2% 2 730 3,1% 4 280 4,7% 3 202 3,3% 2 899 2,9%
Note Receivable - Long Term 1 485 1,8% 1 589 1,8% 1 651 1,8% 1 688 1,8% 1 928 2,0%
Other Long Term Assets, Total 818 1,0% 745 0,8% 689 0,7% 702 0,7% 1 437 1,5%
Total Assets 84 186 100,0% 88 182 100,0% 92 033 100,0% 95 789 100,0% 98 598 100,0%
Liabilities ($ Millions)
Accounts Payable 5 371 6,4% 5 504 6,2% 6 860 7,5% 6 490 6,8% 6 503 6,6%
Accrued Expenses 1 769 2,1% 1 797 2,0% 1 747 1,9% 1 819 1,9% 2 189 2,2%
Current Port. of LT Debt/Capital Leases 2 164 2,6% 4 563 5,2% 3 687 4,0% 6 172 6,4% 3 790 3,8%
Other Current l iabilities, Total 3 988 4,7% 4 470 5,1% 4 548 4,9% 5 114 5,3% 5 378 5,5%
Total Current Liabilities 13 292 15,8% 16 334 18,5% 16 842 18,3% 19 595 20,5% 17 860 18,1%
0,0% 0,0% 0,0% 0,0% 0,0%
Total Long Term Debt 12 676 15,1% 12 773 14,5% 16 483 17,9% 19 119 20,0% 17 084 17,3%
Total Debt 14 840 17,6% 17 336 19,7% 20 170 21,9% 25 291 26,4% 20 874 21,2%
Deferred Income Tax 4 098 4,9% 4 051 4,6% 3 679 4,0% 4 480 4,7% 3 109 3,2%
Minority Interest 3 220 3,8% 4 130 4,7% 4 058 4,4% 4 837 5,0% 5 182 5,3%
Other Liabilities, Total 5 942 7,1% 6 369 7,2% 7 706 8,4% 6 443 6,7% 6 590 6,7%
Total Liabilities 39 228 46,6% 43 657 49,5% 48 768 53,0% 54 474 56,9% 49 825 50,5%
Shareholders Equity ($ Millions)
Common Stock, Total 34 301 40,7% 35 122 39,8% 35 859 39,0% 36 248 37,8% 36 779 37,3%
Retained Earnings (Accumulated Deficit) 53 734 63,8% 59 028 66,9% 66 088 71,8% 72 606 75,8% 82 679 83,9%
Treasury Stock - Common (41 109) -48,8% (47 204) -53,5% (54 703) -59,4% (64 011) -66,8% (67 588) -68,5%
Unrealized Gain (Loss) 100 0,1% 13 0,0% 26 0,0% 8 0,0% 15 0,0%
Other Equity, Total (2 068) -2,5% (2 434) -2,8% (4 005) -4,4% (3 536) -3,7% (3 112) -3,2%
Total Equity 44 958 53,4% 44 525 50,5% 43 265 47,0% 41 315 43,1% 48 773 49,5%
Total Liabilities & Shareholders' Equity 84 186 100,0% 88 182 100,0% 92 033 100,0% 95 789 100,0% 98 598 100,0%
2014 % 2015 % 2016 % 2017 % 2018 %
48 813 100,0% 52 465 100,0% 55 632 100,0% 55 137 100,0% 59 434 100,0%
26 420 54,1% 28 364 54,1% 29 993 53,9% 30 306 55,0% 32 726 55,1%
22 393 45,9% 24 101 45,9% 25 639 46,1% 24 831 45,0% 26 708 44,9%
8 565 17,5% 8 523 16,2% 8 754 15,7% 8 176 14,8% 8 860 14,9%
2 288 4,7% 2 354 4,5% 2 527 4,5% 2 782 5,0% 3 011 5,1%
2 288 4,7% 2 354 4,5% 2 527 4,5% 2 782 5,0% 3 011 5,1%
140 0,3% 53 0,1% 156 0,3% 20 0,0% (8) -0,01%
(35) -0,1% 0 0,0% 0 0,0% 0 0,0% 0 0,00%
37 378 76,6% 39 294 74,9% 41 430 74,5% 41 284 74,9% 44 589 75,0%
11 435 23,4% 13 171 25,1% 14 202 25,5% 13 853 25,1% 14 845 25,0%
(294) -0,6% (265) -0,5% (354) -0,6% (507) -0,9% (682) -1,1%
1 028 2,1% 962 1,8% 1 020 1,8% 442 0,8% 6 0,0%
12 246 25,1% 13 868 26,4% 14 868 26,7% 13 788 25,0% 14 729 24,8%
4 242 8,7% 5 016 9,6% 5 078 9,1% 4 422 8,0% 3 363 5,7%
8 004 16,4% 8 852 16,9% 9 790 17,6% 9 366 17,0% 11 366 19,1%
(503) -1,0% (470) -0,9% (399) -0,7% (386) -0,7% (468) -0,8%
7 501 15,4% 8 382 16,0% 9 391 16,9% 8 980 16,3% 10 898 18,3%
0 0,0% 0 0,0% 0 0,0% 0 0,0% 1 700 2,9%
7 501 15,4% 8 382 16,0% 9 391 16,9% 8 980 16,3% 12 598 21,2%Net Income
Total Extraordinary Items
Provision for Income Taxes
Net Income After Taxes
Minority Interest
Net Income Before Extra. Items
Net Income Before Taxes (EBT)
Operating Income (EBIT)
Interest Expense, Net Non-Operating
Interest/Invest Income - Non-Operating
Other Operating Expenses, Total
Total Operating Expense
Unusual Expense (Income)
Depreciation/Amortization
Depreciation
Gross Profit (EBITDA)
Selling/General/Admin. Expenses, Total
Revenue
Cost of Revenue, Total
Income Statement ($ Millions)
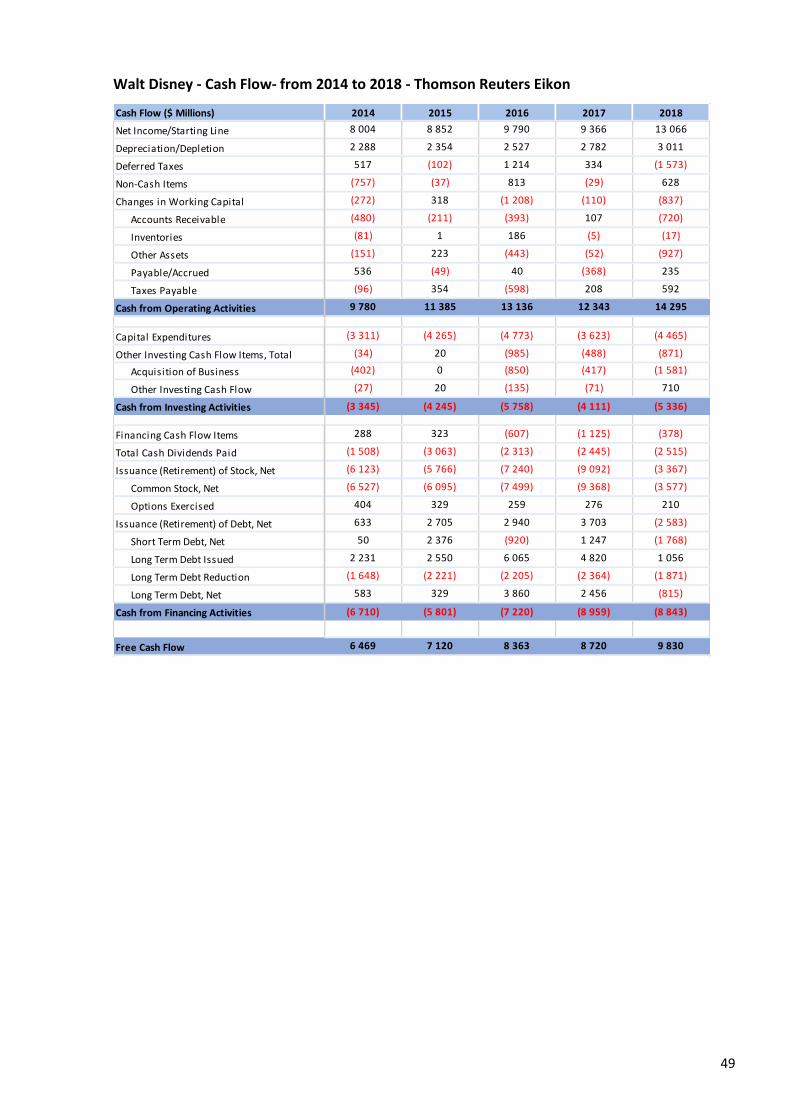
49
Walt Disney - Cash Flow- from 2014 to 2018 - Thomson Reuters Eikon
Cash Flow ($ Millions) 2014 2015 2016 2017 2018
Net Income/Starting Line 8 004 8 852 9 790 9 366 13 066
Depreciation/Depletion 2 288 2 354 2 527 2 782 3 011
Deferred Taxes 517 (102) 1 214 334 (1 573)
Non-Cash Items (757) (37) 813 (29) 628
Changes in Working Capital (272) 318 (1 208) (110) (837)
Accounts Receivable (480) (211) (393) 107 (720)
Inventories (81) 1 186 (5) (17)
Other Assets (151) 223 (443) (52) (927)
Payable/Accrued 536 (49) 40 (368) 235
Taxes Payable (96) 354 (598) 208 592
Cash from Operating Activities 9 780 11 385 13 136 12 343 14 295
Capital Expenditures (3 311) (4 265) (4 773) (3 623) (4 465)
Other Investing Cash Flow Items, Total (34) 20 (985) (488) (871)
Acquisition of Business (402) 0 (850) (417) (1 581)
Other Investing Cash Flow (27) 20 (135) (71) 710
Cash from Investing Activities (3 345) (4 245) (5 758) (4 111) (5 336)
Financing Cash Flow Items 288 323 (607) (1 125) (378)
Total Cash Dividends Paid (1 508) (3 063) (2 313) (2 445) (2 515)
Issuance (Retirement) of Stock, Net (6 123) (5 766) (7 240) (9 092) (3 367)
Common Stock, Net (6 527) (6 095) (7 499) (9 368) (3 577)
Options Exercised 404 329 259 276 210
Issuance (Retirement) of Debt, Net 633 2 705 2 940 3 703 (2 583)
Short Term Debt, Net 50 2 376 (920) 1 247 (1 768)
Long Term Debt Issued 2 231 2 550 6 065 4 820 1 056
Long Term Debt Reduction (1 648) (2 221) (2 205) (2 364) (1 871)
Long Term Debt, Net 583 329 3 860 2 456 (815)
Cash from Financing Activities (6 710) (5 801) (7 220) (8 959) (8 843)
Free Cash Flow 6 469 7 120 8 363 8 720 9 830
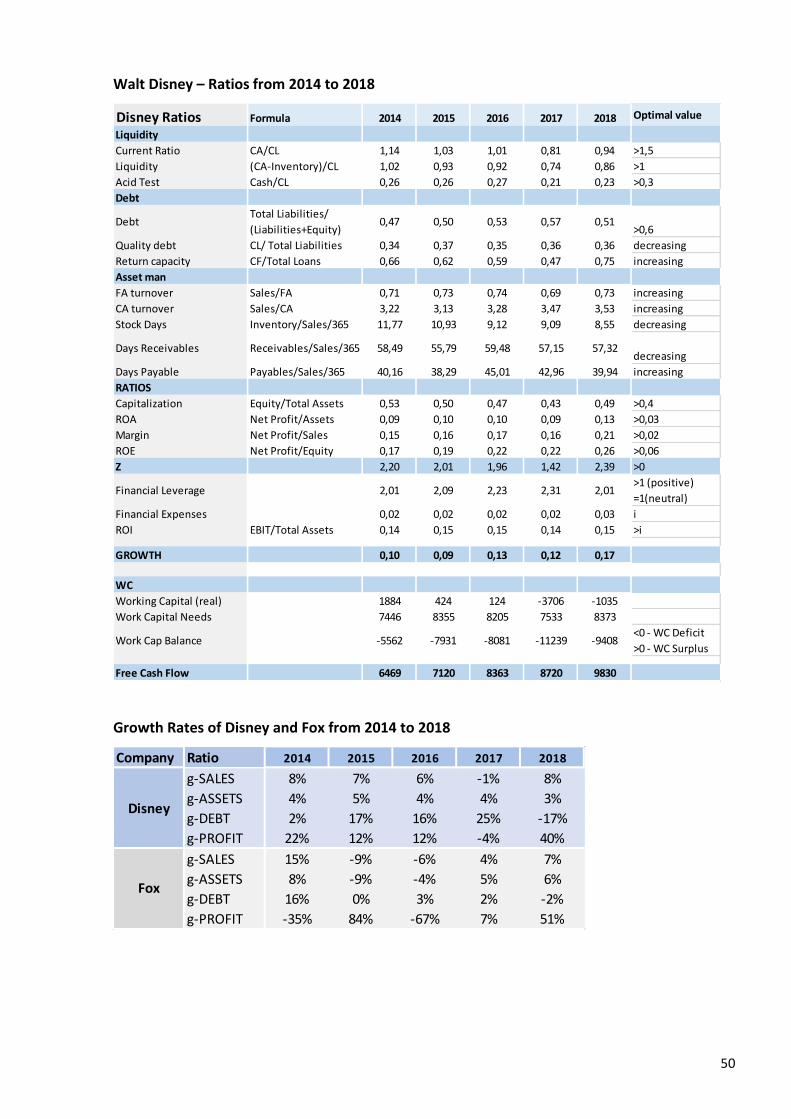
50
Walt Disney – Ratios from 2014 to 2018
Growth Rates of Disney and Fox from 2014 to 2018
Disney Ratios Formula 2014 2015 2016 2017 2018 Optimal value
Liquidity
Current Ratio CA/CL 1,14 1,03 1,01 0,81 0,94 >1,5
Liquidity (CA-Inventory)/CL 1,02 0,93 0,92 0,74 0,86 >1
Acid Test Cash/CL 0,26 0,26 0,27 0,21 0,23 >0,3
Debt
DebtTotal Liabilities/
(Liabilities+Equity)0,47 0,50 0,53 0,57 0,51
>0,6
Quality debt CL/ Total Liabilities 0,34 0,37 0,35 0,36 0,36 decreasing
Return capacity CF/Total Loans 0,66 0,62 0,59 0,47 0,75 increasing
Asset man
FA turnover Sales/FA 0,71 0,73 0,74 0,69 0,73 increasing
CA turnover Sales/CA 3,22 3,13 3,28 3,47 3,53 increasing
Stock Days Inventory/Sales/365 11,77 10,93 9,12 9,09 8,55 decreasing
Days Receivables Receivables/Sales/365 58,49 55,79 59,48 57,15 57,32decreasing
Days Payable Payables/Sales/365 40,16 38,29 45,01 42,96 39,94 increasing
RATIOS
Capitalization Equity/Total Assets 0,53 0,50 0,47 0,43 0,49 >0,4
ROA Net Profit/Assets 0,09 0,10 0,10 0,09 0,13 >0,03
Margin Net Profit/Sales 0,15 0,16 0,17 0,16 0,21 >0,02
ROE Net Profit/Equity 0,17 0,19 0,22 0,22 0,26 >0,06
Z 2,20 2,01 1,96 1,42 2,39 >0
Financial Leverage 2,01 2,09 2,23 2,31 2,01>1 (positive)
=1(neutral)
Financial Expenses 0,02 0,02 0,02 0,02 0,03 i
ROI EBIT/Total Assets 0,14 0,15 0,15 0,14 0,15 >i
GROWTH 0,10 0,09 0,13 0,12 0,17
WC
Working Capital (real) 1884 424 124 -3706 -1035
Work Capital Needs 7446 8355 8205 7533 8373
Work Cap Balance -5562 -7931 -8081 -11239 -9408<0 - WC Deficit
>0 - WC Surplus
Free Cash Flow 6469 7120 8363 8720 9830
Company Ratio 2014 2015 2016 2017 2018
g-SALES 8% 7% 6% -1% 8%
g-ASSETS 4% 5% 4% 4% 3%
g-DEBT 2% 17% 16% 25% -17%
g-PROFIT 22% 12% 12% -4% 40%
g-SALES 15% -9% -6% 4% 7%
g-ASSETS 8% -9% -4% 5% 6%
g-DEBT 16% 0% 3% 2% -2%
g-PROFIT -35% 84% -67% 7% 51%
Disney
Fox

51
Full Rating list of companies by the efficiency score
Company Name CRS IO Score Total Assets Total Revenue EmployeesCountry of
Headquarters
1 Netflix Inc 100,00% 25 974 400 000,00 15 794 341 000,00 7 100,00 USA
2 TV TOKYO Holdings Corp 100,00% 1 156 437 041,22 1 384 368 530,02 1 539,00 Japan
3 Mediaset Espana Comunicacion SA 83,41% 1 371 879 300,85 1 117 622 029,54 1 258,00 Spain
4 CBS Corp 80,14% 21 859 000 000,00 14 514 000 000,00 12 770,00 USA
5 Kabel Deutschland Holding AG 79,71% 3 757 922 020,16 3 049 331 830,17 3 699,00 Germany
6 Fox Corp 76,94% 53 831 000 000,00 30 400 000 000,00 22 400,00 USA
7 AMC Networks Inc 76,20% 5 278 563 000,00 2 971 929 000,00 2 234,00 USA
8 Metropole Television SA 73,67% 1 731 236 810,72 1 630 195 430,77 2 639,00 France
9 Television Francaise 1 SA 70,90% 3 620 859 711,90 2 624 438 021,84 3 591,00 France
10 SKY Perfect JSAT Holdings Inc 69,16% 3 381 733 483,91 1 369 292 301,90 858,00 Japan
11 TV Asahi Holdings Corp 61,06% 4 098 324 863,54 2 846 894 409,94 4 938,00 Japan
12 Fuji Media Holdings Inc 60,93% 11 728 072 651,99 6 084 472 049,69 7 484,00 Japan
13 Nippon Television Holdings Inc 59,61% 8 329 550 159,98 3 987 041 219,65 4 425,00 Japan
14 Zee Entertainment Enterprises Ltd 57,23% 1 709 368 760,56 1 026 831 515,90 1 776,00 India
15 DISH Network Corp 55,75% 30 587 012 000,00 13 621 302 000,00 16 000,00 USA
16 Discovery Inc 53,01% 32 550 000 000,00 10 553 000 000,00 9 000,00 USA
17 Seven West Media Ltd 50,49% 1 400 755 001,89 1 199 578 087,18 4 528,00 Australia
18 Tokyo Broadcasting System Holdings Inc 50,01% 7 733 267 457,18 3 406 305 288,91 5 552,00 Japan
19 Cable ONE Inc 46,25% 2 303 234 000,00 1 072 295 000,00 2 224,00 USA
20 WideOpenWest Inc 44,58% 2 419 600 000,00 1 153 800 000,00 2 600,00 USA
21 Shanghai Oriental Pearl Group Co Ltd 43,45% 5 737 856 434,53 2 499 294 446,92 5 500,00 China
22 Comcast Corp 42,42% 251 684 000 000,00 94 507 000 000,00 184 000,00 USA
23 Cyfrowy Polsat SA 42,31% 7 973 799 879,34 2 823 580 108,59 4 810,00 Poland
24 Walt Disney Co 41,61% 98 598 000 000,00 59 434 000 000,00 201 000,00 USA
25 Cumulus Media Inc 41,36% 2 027 319 000,00 1 135 662 000,00 3 515,00 USA
26 E. W. Scripps Co 40,70% 2 130 061 000,00 1 208 425 000,00 3 950,00 USA
27 Tegna Inc 40,46% 5 276 842 000,00 2 207 282 000,00 5 336,00 USA
28 Bertelsmann SE & Co KGaA 39,91% 28 436 559 062,39 20 621 153 776,95 119 089,00 Germany
29 Sinclair Broadcast Group Inc 38,28% 6 572 092 000,00 3 055 081 000,00 9 000,00 USA
30 Cogeco Communications Inc 36,69% 5 507 434 992,71 1 858 977 525,50 4 574,00 Canada
31 Cogeco Inc 35,27% 5 626 713 967,94 1 946 901 127,56 5 199,00 Canada
32 Nexstar Media Group Inc 35,01% 7 062 030 000,00 2 766 696 000,00 8 249,00 USA
33 Charter Communications Inc 34,56% 146 130 000 000,00 43 634 000 000,00 98 000,00 USA
34 Entercom Communications Corp 33,55% 4 020 358 000,00 1 462 567 000,00 4 428,00 USA
35 Liberty Global PLC 28,84% 53 154 600 000,00 11 957 900 000,00 26 000,00 UK
36 Tribune Media Co 27,82% 8 251 391 000,00 2 009 734 000,00 5 800,00 USA
37 ABS CBN Corp 26,72% 1 503 198 051,10 814 339 476,16 11 068,00 Philippines
38 Liberty Media Corp 22,73% 10 957 000 000,00 1 827 000 000,00 4 555,00 USA
39 Hunan TV & Broadcast Intermediary Co Ltd 21,21% 3 649 969 397,35 1 343 541 210,83 12 807,00 China
40 Gray Television Inc 18,92% 4 213 445 000,00 1 084 132 000,00 7 371,00 USA
41 MNC Investama Tbk PT 13,92% 4 166 886 177,66 1 001 125 617,40 14 312,00 Indonesia
42 Jiangsu Broadcasting Cable Information Network Corp Ltd13,90% 4 949 585 554,00 1 244 194 792,74 20 354,00 China
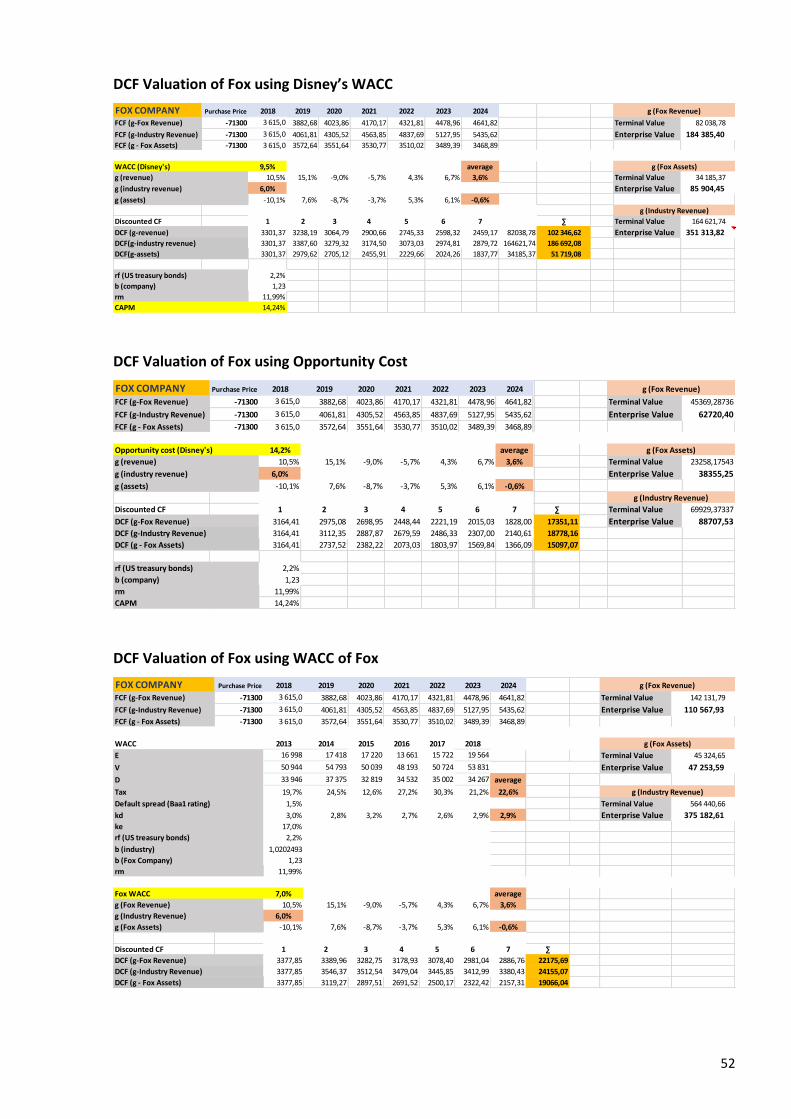
52
DCF Valuation of Fox using Disney’s WACC
DCF Valuation of Fox using Opportunity Cost
DCF Valuation of Fox using WACC of Fox
FOX COMPANY Purchase Price 2018 2019 2020 2021 2022 2023 2024
FCF (g-Fox Revenue) -71300 3 615,0 3882,68 4023,86 4170,17 4321,81 4478,96 4641,82 Terminal Value 82 038,78
FCF (g-Industry Revenue) -71300 3 615,0 4061,81 4305,52 4563,85 4837,69 5127,95 5435,62 Enterprise Value 184 385,40 FCF (g - Fox Assets) -71300 3 615,0 3572,64 3551,64 3530,77 3510,02 3489,39 3468,89
WACC (Disney's) 9,5% average
g (revenue) 10,5% 15,1% -9,0% -5,7% 4,3% 6,7% 3,6% Terminal Value 34 185,37
g (industry revenue) 6,0% Enterprise Value 85 904,45
g (assets) -10,1% 7,6% -8,7% -3,7% 5,3% 6,1% -0,6%
Discounted CF 1 2 3 4 5 6 7 ∑ Terminal Value 164 621,74
DCF (g-revenue) 3301,37 3238,19 3064,79 2900,66 2745,33 2598,32 2459,17 82038,78 102 346,62 Enterprise Value 351 313,82 DCF(g-industry revenue) 3301,37 3387,60 3279,32 3174,50 3073,03 2974,81 2879,72 164621,74 186 692,08
DCF(g-assets) 3301,37 2979,62 2705,12 2455,91 2229,66 2024,26 1837,77 34185,37 51 719,08
rf (US treasury bonds) 2,2%
b (company) 1,23
rm 11,99%
CAPM 14,24%
g (Fox Revenue)
g (Fox Assets)
g (Industry Revenue)
FOX COMPANY Purchase Price 2018 2019 2020 2021 2022 2023 2024
FCF (g-Fox Revenue) -71300 3 615,0 3882,68 4023,86 4170,17 4321,81 4478,96 4641,82 45369,2874 Terminal Value 45369,28736
FCF (g-Industry Revenue) -71300 3 615,0 4061,81 4305,52 4563,85 4837,69 5127,95 5435,62 79838,7805 Enterprise Value 62720,40
FCF (g - Fox Assets) -71300 3 615,0 3572,64 3551,64 3530,77 3510,02 3489,39 3468,89 23258,1754
Opportunity cost (Disney's) 14,2% average
g (revenue) 10,5% 15,1% -9,0% -5,7% 4,3% 6,7% 3,6% Terminal Value 23258,17543
g (industry revenue) 6,0% Enterprise Value 38355,25
g (assets) -10,1% 7,6% -8,7% -3,7% 5,3% 6,1% -0,6%
Discounted CF 1 2 3 4 5 6 7 ∑ Terminal Value 69929,37337
DCF (g-Fox Revenue) 3164,41 2975,08 2698,95 2448,44 2221,19 2015,03 1828,00 17351,11 Enterprise Value 88707,53DCF (g-Industry Revenue) 3164,41 3112,35 2887,87 2679,59 2486,33 2307,00 2140,61 18778,16
DCF (g - Fox Assets) 3164,41 2737,52 2382,22 2073,03 1803,97 1569,84 1366,09 15097,07
rf (US treasury bonds) 2,2%
b (company) 1,23
rm 11,99%
CAPM 14,24%
g (Fox Revenue)
g (Fox Assets)
g (Industry Revenue)
FOX COMPANY Purchase Price 2018 2019 2020 2021 2022 2023 2024
FCF (g-Fox Revenue) -71300 3 615,0 3882,68 4023,86 4170,17 4321,81 4478,96 4641,82 142131,794 Terminal Value 142 131,79
FCF (g-Industry Revenue) -71300 3 615,0 4061,81 4305,52 4563,85 4837,69 5127,95 5435,62 1663930,31 Enterprise Value 110 567,93
FCF (g - Fox Assets) -71300 3 615,0 3572,64 3551,64 3530,77 3510,02 3489,39 3468,89 45324,6471
WACC 2013 2014 2015 2016 2017 2018
E 16 998 17 418 17 220 13 661 15 722 19 564 Terminal Value 45 324,65
V 50 944 54 793 50 039 48 193 50 724 53 831 Enterprise Value 47 253,59
D 33 946 37 375 32 819 34 532 35 002 34 267 average
Tax 19,7% 24,5% 12,6% 27,2% 30,3% 21,2% 22,6%
Default spread (Baa1 rating) 1,5% Terminal Value 564 440,66
kd 3,0% 2,8% 3,2% 2,7% 2,6% 2,9% 2,9% Enterprise Value 375 182,61 ke 17,0%
rf (US treasury bonds) 2,2%
b (industry) 1,0202493
b (Fox Company) 1,23
rm 11,99%
Fox WACC 7,0% average
g (Fox Revenue) 10,5% 15,1% -9,0% -5,7% 4,3% 6,7% 3,6%
g (Industry Revenue) 6,0%
g (Fox Assets) -10,1% 7,6% -8,7% -3,7% 5,3% 6,1% -0,6%
Discounted CF 1 2 3 4 5 6 7 ∑
DCF (g-Fox Revenue) 3377,85 3389,96 3282,75 3178,93 3078,40 2981,04 2886,76 22175,69
DCF (g-Industry Revenue) 3377,85 3546,37 3512,54 3479,04 3445,85 3412,99 3380,43 24155,07
DCF (g - Fox Assets) 3377,85 3119,27 2897,51 2691,52 2500,17 2322,42 2157,31 19066,04
g (Fox Revenue)
g (Fox Assets)
g (Industry Revenue)

53
DCF Valuation of Disney using Disney’s WACC
Market Share forecast – Synergy effect
DCF Valuation of a combined firm – Synergy effect
DISNEY 2018 2019 2020 2021 2022 2023 2024
FCF (g- Disney Revenue) 9 830 11 022 11 671 12 358 13 086 13 856 14 672 Terminal Value 428386,7925
FCF (g - Industry Revenue) 9 830 11 045 11 708 12 410 13 155 13 944 14 781 Enterprise Value 488124,23
FCF (g - Disney Assets) 9 830 10 776 11 283 11 814 12 370 12 952 13 561
2013 2014 2015 2016 2017 2018 Terminal Value 445699,5258
E 45 429 44 958 44 525 43 265 41 315 48 773 Enterprise Value 505672,63
V 81 241 84 186 88 182 92 033 95 789 98 598
D 35 812 39 228 43 657 48 768 54 474 49 825 average
Tax 31,0% 34,6% 36,2% 34,2% 32,1% 22,8% 31,8% Terminal Value 295082,4815
Default spread (Aa2 rating) 0,5% Enterprise Value 352374,94kd 1,9% 1,8% 1,7% 1,8% 1,8% 2,1% 1,8%
ke (company) 17,80%
rf (US treasury bonds) 2,2%
b (industry) 1,02024928
b (company) 1,3
rm 11,99%
average
WACC 10,5% 10,0% 9,5% 9,0% 8,4% 9,6% 9,5%
g (revenue) 6,5% 8,4% 7,5% 6,0% -0,9% 7,8% 5,9%
g (industry revenue) 6,0%
g (assets) 8,5% 3,6% 4,7% 4,4% 4,1% 2,9% 4,7%
Discounted CF 1 2 3 4 5 6 7 ∑
DCF(g-revenue) 8967,36 9189,72 8885,40 8591,15 8306,65 8031,57 7765,59 59 737,44
DCF(g-industry revenue) 8967,36371 9209,0731 8913,4764 8627,3679 8350,4431 8082,4071 7822,9746 59 973,11
DCF(g-assets) 8967,36371 8985,1827 8590,4045 8212,9714 7852,1215 7507,126 7177,2885 57 292,46
g (Disney Assets)
g (Industry Revenue)
g (Disney Revenue)
2018 2019 2020 2021 2022 2023 2024
0 1 2 3 4 5 6
Total Industry Revenue 380250 403065 380250 380250 380250 380250 380250
Synergy Revenue 89834 94428 99268 104367 109739 115399 121364
g (industry revenue) 6,0%
Disney's market share 15,6%
Fox's market share 8,0%
Combined market share 23,6% 23,4% 26,1% 27,4% 28,9% 30,3% 31,9%
Ratios
2018 2019 2020 2021 2022 2023 2024
FCF (g-revenue) 3615 3883 4024 4170 4322 4479 4642 Terminal Value 467216
FCF (g-industry revenue) 3615 4112 4386 4678 4989 5322 5676 Enterprise Value 327611FCF (g - assets) 3615 3573 3552 3531 3510 3489 3469
FCF (g-revenue) 9830 11022 11671 12358 13086 13856 14672
FCF (g-industry revenue) 9830 11182 11927 12721 13567 14471 15434 Terminal Value 269277
FCF (g - assets) 9830 10776 11283 11814 12370 12952 13561 Enterprise Value 217525
FCF (g-revenue) 13445 14904 15695 16528 17408 18335 19314
FCF (g-industry revenue) 13445 15295 16313 17399 18557 19792 21110 Terminal Value 791942
FCF (g - assets) 13445 14349 14835 15345 15880 16441 17030 Enterprise Value 503575
9,5%
FOX 3,6%
DISNEY 5,9%
Synergy 5,2%
g (industry revenue) 6,7%
FOX -0,6%
DISNEY 4,7%
Synergy 3,0%
Discounted CF 1 2 3 4 5 6 7
DCF(g-revenue) 12278,54 12430,48 11953,90 11496,61 11057,77 10636,60 10232,35 80086,25
DCF(g-industry revenue) 12278,54 12755,90 12424,71 12102,12 11787,90 11481,84 11183,73 84014,73
DCF(g-assets) 12278,54 11967,31 11299,12 10673,47 10087,26 9537,66 9022,07 74865,42
g (assets)
g (revenue)
Free Cash Flow
FOX
DIS
COMBINED
g (revenue)
g (assets)
g (industry revenue)
WACC (Disney)