DISKUSI INTEGRASI ENERGI TERBARUKAN DENGAN GRID...
87
Dr. Hardiv Harris Situmeang Komite Nasional Indonesia - World Energy Council Anggota Dewan Riset Nasional Anggota Scientific Board BALITBANG-ESDM Member of Asia Pacific Energy Research Centre Advisory Board DISKUSI INTEGRASI ENERGI TERBARUKAN DENGAN GRID Integrasi Jaringan dan Pembangkit Energi Terbarukan: Tantangan, Pilihan dan Opsi Regulasi Institute for Essential Services Reform (IESR) Jakarta, 18 Agustus 2016
Transcript of DISKUSI INTEGRASI ENERGI TERBARUKAN DENGAN GRID...

Dr. Hardiv Harris Situmeang
Komite Nasional Indonesia - World Energy Council
Anggota Dewan Riset Nasional
Anggota Scientific Board BALITBANG-ESDM
Member of Asia Pacific Energy Research Centre Advisory Board
DISKUSI
INTEGRASI ENERGI
TERBARUKAN
DENGAN GRID
Integrasi Jaringan dan
Pembangkit Energi
Terbarukan: Tantangan,
Pilihan dan Opsi Regulasi
Institute for Essential Services
Reform (IESR)
Jakarta, 18 Agustus 2016

Cancun Beach, 8 December 2010
2 Degree Celsius is Attainable?
SUMMARY FOR POLICY MAKERS – IPCC WGI AR5
IPCC WGI AR5 12th Session of WG I 27 September 2013
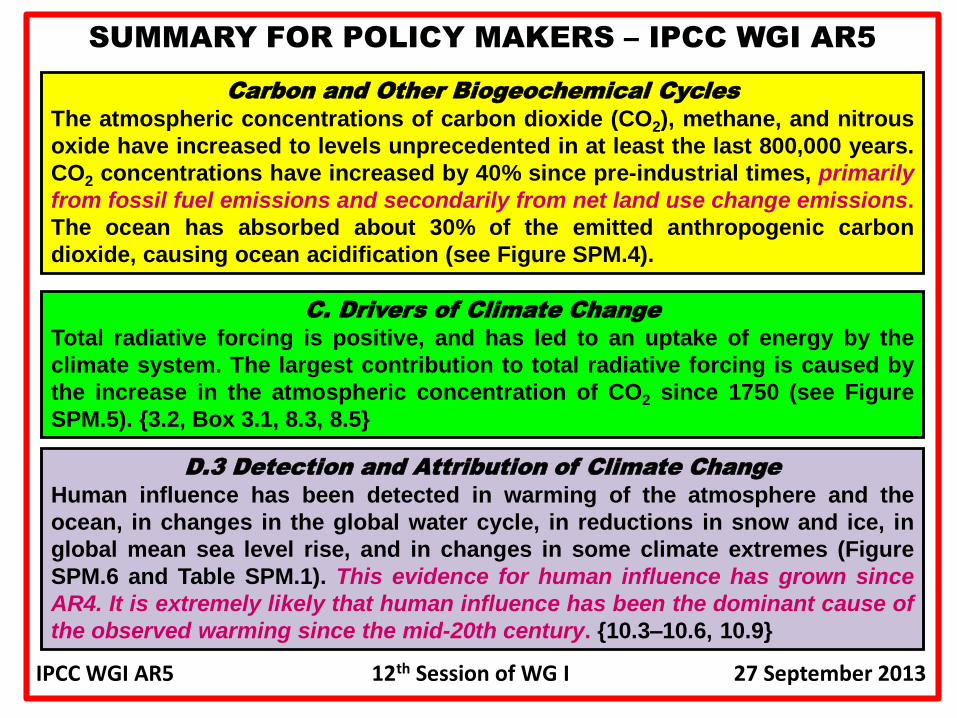
Carbon and Other Biogeochemical Cycles
The atmospheric concentrations of carbon dioxide (CO2), methane, and nitrous
oxide have increased to levels unprecedented in at least the last 800,000 years.
CO2 concentrations have increased by 40% since pre-industrial times, primarily
from fossil fuel emissions and secondarily from net land use change emissions.
The ocean has absorbed about 30% of the emitted anthropogenic carbon
dioxide, causing ocean acidification (see Figure SPM.4).
C. Drivers of Climate Change
Total radiative forcing is positive, and has led to an uptake of energy by the
climate system. The largest contribution to total radiative forcing is caused by
the increase in the atmospheric concentration of CO2 since 1750 (see Figure
SPM.5). {3.2, Box 3.1, 8.3, 8.5}
D.3 Detection and Attribution of Climate Change
Human influence has been detected in warming of the atmosphere and the
ocean, in changes in the global water cycle, in reductions in snow and ice, in
global mean sea level rise, and in changes in some climate extremes (Figure
SPM.6 and Table SPM.1). This evidence for human influence has grown since
AR4. It is extremely likely that human influence has been the dominant cause of
the observed warming since the mid-20th century. {10.3–10.6, 10.9}

Summary for Policymakers
SPM.4 - Mitigation Pathways and Measures in the Context of
Sustainable Development
Scenarios reaching atmospheric concentration levels of about 450 ppm
CO2eq by 2100 (consistent with a likely chance to keep temperature
change below 2°C relative to pre-industrial levels) include substantial
cuts in anthropogenic GHG emissions by mid-century through large-
scale changes in energy systems and potentially land use (high
confidence).
Scenarios reaching these concentrations by 2100 are characterized by
lower global GHG emissions in 2050 than in 2010, 40 % to 70 % lower
globally, and emissions levels near zero Gt CO2eq or below in 2100.

Delaying mitigation efforts beyond those in place today through 2030 is estimated tosubstantially increase the difficulty of the transition to low longer-term emissionslevels and narrow the range of options consistent with maintaining temperaturechange below 2 °C relative to pre-industrial levels (high confidence).
Cost-effective mitigation scenarios that make it at least as likely as not thattemperature change will remain below 2 °C relative to pre-industrial levels (2100concentrations between about 450 and 500 ppm CO2eq) are typically characterizedby annual GHG emissions in 2030 of roughly between 30 Gt CO2eq and 50 Gt CO2eq.
Scenarios with annual GHG emissions above 55 GtCO2eq in 2030 are
characterized by substantially higher rates of emissions reductions
from 2030 to 2050; much more rapid scale-up of low-carbon energy over thisperiod; a larger reliance on Carbon Dioxide Removal (CDR) technologies in the long-term; and higher transitional and long-term economic impacts.
Due to these increased mitigation challenges, many models with annual
2030 GHG emissions higher than 55 GtCO2eq could not produce
scenarios reaching atmospheric concentration levels that make it as
likely as not that temperature change will remain below 2 °C relative to
pre-industrial levels.
Annual 2030 GHG emissions higher than 55 GtCO2eq could
not produce scenarios reaching atmospheric concentration
levels that make it as likely as not that temperature change
will remain below 2° C relative to pre-industrial levels

2015 2020 2050
Glo
bal
GH
G e
mis
sio
ns
in G
tCO
2e
q Global GHG emissions path compatible with 20C
2025
Global Aggregation
Gap
2030 2100
40-70% below 2010 levels by 2050
Emissions levels near zero GtCO2eq, or below in 2100
Annual 2030 GHG emissions less than 55 GtCO2eq
Strongly Required: Pre-2020 and Post-2020 actions reinforce
each other and in the same direction of higher ambition.
Emisi GRK Indonesia 2000-2030 berdasarkan
Skenario Fair, Optimis dan Ambisius
(Reference: Proses Kaji Ulang RAN-GRK dan Penyusunan INDC, BAPPENAS)

0
500,000
1,000,000
1,500,000
2,000,000
2,500,000
3,000,000
3,500,000
1995 2000 2005 2010 2015 2020 2025 2030 2035
Skenario Kebijakan Emisi Indonesia
(Dalam Ribu Ton CO2e)
BAU Baseline Emisi Baseline Emisi Skenario Ambitious
Baseline Emisi Skenario Optimis Baseline Emisi Skenario Fair
Reduksi Emisi sebesar469 Juta ton CO2e atau setara 26% pada 2020 dari BAU
Skenario Fair: Reduksi Emisi sebesar848 Juta ton CO2e atau setara 29 % dari BAU pada 2030
Skenario Ambisius: Reduksi Emisisebesar 1,2 Giga ton ton CO2e atau setara 41 % dari BAU pada 2030
Skenario Optimis: Reduksi Emisi sebesar 921,5 Juta ton CO2e atausetara 32 % dari BAU pada 2030
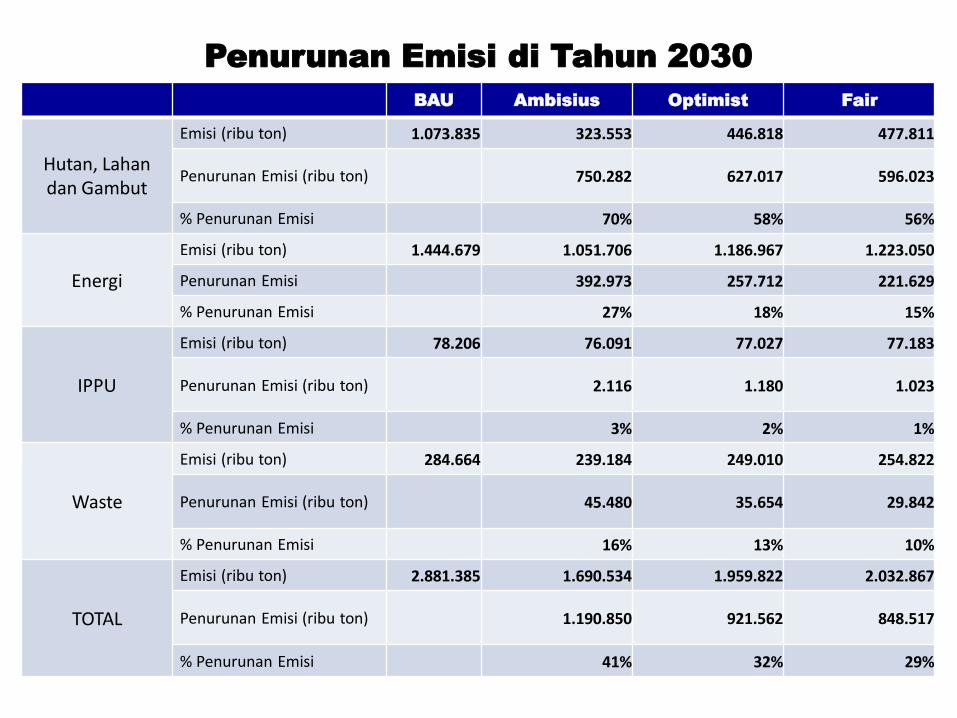
Penurunan Emisi di Tahun 2030
BAU Ambisius Optimist Fair
Hutan, Lahandan Gambut
Emisi (ribu ton) 1.073.835 323.553 446.818 477.811
Penurunan Emisi (ribu ton) 750.282 627.017 596.023
% Penurunan Emisi 70% 58% 56%
Energi
Emisi (ribu ton) 1.444.679 1.051.706 1.186.967 1.223.050
Penurunan Emisi 392.973 257.712 221.629
% Penurunan Emisi 27% 18% 15%
IPPU
Emisi (ribu ton) 78.206 76.091 77.027 77.183
Penurunan Emisi (ribu ton) 2.116 1.180 1.023
% Penurunan Emisi 3% 2% 1%
Waste
Emisi (ribu ton) 284.664 239.184 249.010 254.822
Penurunan Emisi (ribu ton) 45.480 35.654 29.842
% Penurunan Emisi 16% 13% 10%
TOTAL
Emisi (ribu ton) 2.881.385 1.690.534 1.959.822 2.032.867
Penurunan Emisi (ribu ton) 1.190.850 921.562 848.517
% Penurunan Emisi 41% 32% 29%
3 Core Dimensions of Energy Sustainability

3 Core Dimensions of Sustainable Energy System
Balancing the ‘Energy Trilemma’
Energy
Security
Energy
Equity
Environmental
Sustainability
Energy Security
The effective management of primary energysupply from domestic and external sources, thereliability of energy infrastructure, and theability of energy providers to meet current andfuture demand.
Energy Equity
Accessibility and affordability of energy supplyacross the population.
Environmental Sustainability
Encompasses the achievement of supply anddemand side energy efficiencies and thedevelopment of energy supply from renewableand other low-carbon sources.
World Energy Council 2013, “World Energy Trilemma”, Time to get real – the Agenda for Change.

Towards Sustainable
Energy PathBalancing the 3 core dimensions of the energy trilemma is a strongbasis for prosperity and competitiveness of individual countries.Secure energy is critical to fuelling economic growth. Energy must beaccessible and affordable at all levels of society to ensure socialstability. The impact of energy production and energy use on theenvironment needs to be minimized in order to combat climatechange as well as local air and water pollution and its implications.
Addressing the energy trilemma presents extraordinaryenvironmental, social, and economic challenges requiring nationaland international action by not only governments, but also theprivate sector and civil society. Robust and enabling environmentswill be required toward these ends, including appropriatetechnology mechanisms and a global trade and investment regimethat encourages and leverages investment, innovation, andtechnology uptake.
The Energy Trilemma
Drive the national energy systemtowards low-carbon energysources, low-carbon and zero-carbon energy technologies,renewable energy, greater role ofenergy efficiency and conservationfrom up-stream to down stream(energy end-use), and efficienttransmission & distributionsystems.
National Energy System
Governments & Policy Makers: Policymakers must focus on reducing political and regulatory risks: 1) Have a clearvision for sustainable energy and a master plan with clearly defined energy sustainability goals, 2) Define coherent,long-term, and predictable energy policies, underpinned by well-implemented regulations, and 3) Recognise thatinvestors are not going to provide capital without an attractive profit.
Financing Community: The financial infrastructure must exist for capital to flow easily to the energy sector: 1) Helppolicymakers and energy sector understand the role of different financial investors and instruments, 2) Supportefforts for the standardisation of instruments, and 3) Review existing rating models and develop new approaches tobundle smaller-scale projects.
Energy Industry: The energy sector must bring clearly bankable projects to the market: 1) Be more proactive in thedialogues around energy policies, 2) Establish standard procedures and best practices for data and disclosure, 3)Create new pricing models that meet the reality of changing business models and encourage demand side response.

THREE CLEAR OBJECTIVES TO BE ACHIEVED BY 2030*)
Ensuring universal access to modern energy services.
Doubling the global rate of improvement in energy
efficiency.
Doubling the share of renewable energy in the global
energy mix.
SUSTAINABLE ENERGY FOR ALL
*) At the opening of the UN General Assembly in September 2011

Some Routes to Enhance Energy Security Towards
Sustainable Energy Path

Some Routes to Enhance Energy Security
Cross border transaction: the ability of thestate or of market player, to draw on foreignresources and products that can be freelyimported through ports or other transportchannels and through cross boundary energygrids which are supported by enablingenvironments that need to be established.
Adequate national & regionalstrategic reserves to addressany transient interruption,shortage, or unpredictablesurge in demand.
Move the energy systemtowards using low carbonenergy sources (fuel switching)to improve national energy mixby geographic and fuel supplydiversity through government -industry partnerships.
Attracting large-scale investment innew low carbon electricity-generationsources and associated transmissionand distribution networks, togetherwith more sustainable transportinfrastructures.
Ensuring the security of energysupplies and the resilience ofenergy infrastructures so thatenergy is both available andaffordable during the transition tolow-carbon energy systems.
Deployment of low-carbon andzero-carbon energy technologies,renewable energy, promotegreater role of energy efficiencyand conservation from up-streamto down-stream (energy end-use), and provide efficienttransmission and distributionsystems.
Some Routes
to Enhance
Energy
Security
*) “World Energy Assessment: Energy and the Challenge of Sustainability”. UNDP, UN Dept. of Economic & Social Affairs, World Energy Council (WEC).

Enabling Frameworks for Technology Diffusion
(A Business Perspective)
Specific Enablers to Encourage Diffusion of Low-Carbon Technologies -Power Sector
The greatest emissions reduction are possible through action in the powersector. This will require technology breakthroughs, large-scale investment andunprecedented and far-reaching policies in the energy sector.
Recommendation for the power sector include:
Defining national road maps for low-carbon electricity
Directing subsidies to low-carbon alternatives
Putting a value on the reduction of carbon emissions
Covering all low-carbon technologies through market mechanism
Building efficient energy markets and more efficient electricity pricing
Providing sufficiently resilient transmission and distribution infrastructure.
Reference: “Enabling Frameworks for Technology Diffusion - A Business Perspective”, WorldBusiness Council for Sustainable Development (WBCSD), April 2010.
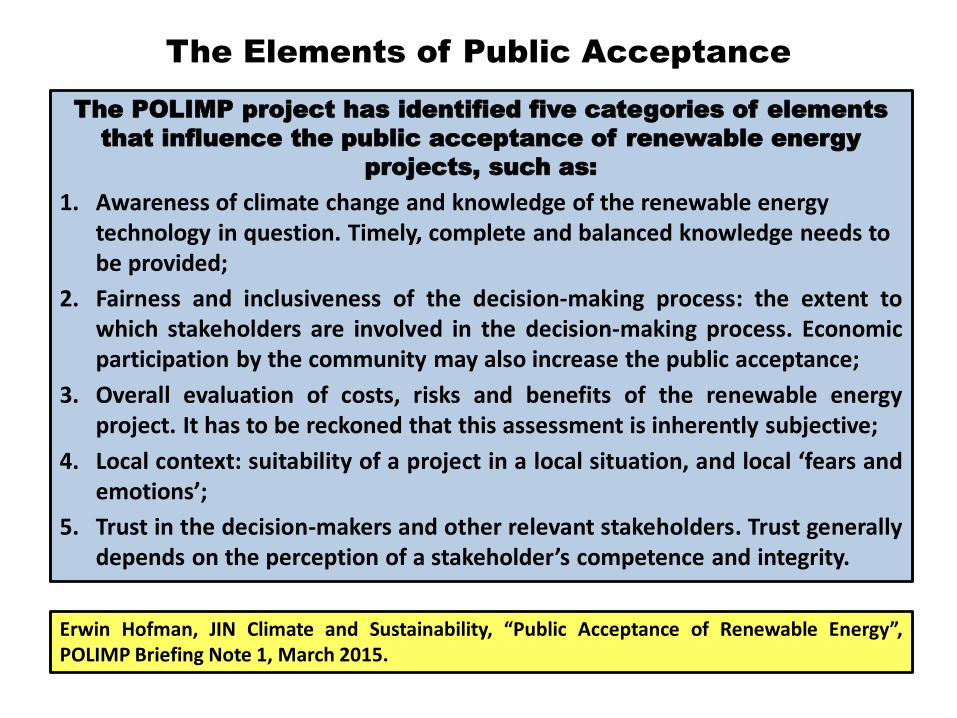
The POLIMP project has identified five categories of elements
that influence the public acceptance of renewable energy
projects, such as:
1. Awareness of climate change and knowledge of the renewable energy technology in question. Timely, complete and balanced knowledge needs to be provided;
2. Fairness and inclusiveness of the decision-making process: the extent towhich stakeholders are involved in the decision-making process. Economicparticipation by the community may also increase the public acceptance;
3. Overall evaluation of costs, risks and benefits of the renewable energyproject. It has to be reckoned that this assessment is inherently subjective;
4. Local context: suitability of a project in a local situation, and local ‘fears andemotions’;
5. Trust in the decision-makers and other relevant stakeholders. Trust generallydepends on the perception of a stakeholder’s competence and integrity.
The Elements of Public Acceptance
Erwin Hofman, JIN Climate and Sustainability, “Public Acceptance of Renewable Energy”,POLIMP Briefing Note 1, March 2015.

Kebijakan Energi Nasional
(Some of Its Key Elements)
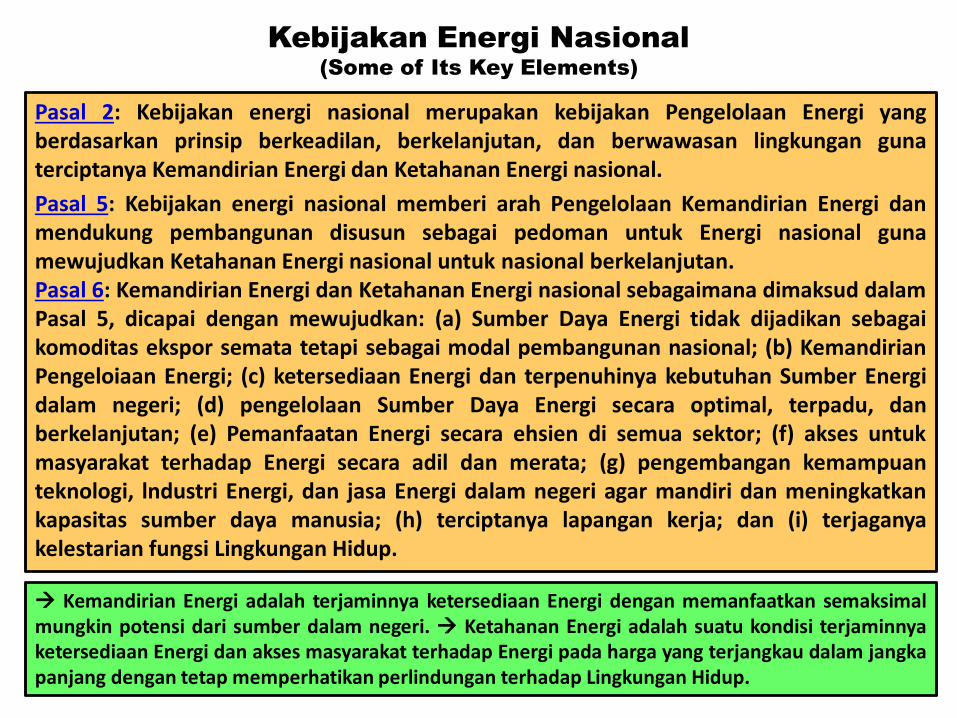
Pasal 2: Kebijakan energi nasional merupakan kebijakan Pengelolaan Energi yangberdasarkan prinsip berkeadilan, berkelanjutan, dan berwawasan lingkungan gunaterciptanya Kemandirian Energi dan Ketahanan Energi nasional.
Pasal 5: Kebijakan energi nasional memberi arah Pengelolaan Kemandirian Energi danmendukung pembangunan disusun sebagai pedoman untuk Energi nasional gunamewujudkan Ketahanan Energi nasional untuk nasional berkelanjutan.Pasal 6: Kemandirian Energi dan Ketahanan Energi nasional sebagaimana dimaksud dalamPasal 5, dicapai dengan mewujudkan: (a) Sumber Daya Energi tidak dijadikan sebagaikomoditas ekspor semata tetapi sebagai modal pembangunan nasional; (b) KemandirianPengeloiaan Energi; (c) ketersediaan Energi dan terpenuhinya kebutuhan Sumber Energidalam negeri; (d) pengelolaan Sumber Daya Energi secara optimal, terpadu, danberkelanjutan; (e) Pemanfaatan Energi secara ehsien di semua sektor; (f) akses untukmasyarakat terhadap Energi secara adil dan merata; (g) pengembangan kemampuanteknologi, lndustri Energi, dan jasa Energi dalam negeri agar mandiri dan meningkatkankapasitas sumber daya manusia; (h) terciptanya lapangan kerja; dan (i) terjaganyakelestarian fungsi Lingkungan Hidup.
Kebijakan Energi Nasional
(Some of Its Key Elements)
Kemandirian Energi adalah terjaminnya ketersediaan Energi dengan memanfaatkan semaksimalmungkin potensi dari sumber dalam negeri. Ketahanan Energi adalah suatu kondisi terjaminnyaketersediaan Energi dan akses masyarakat terhadap Energi pada harga yang terjangkau dalam jangkapanjang dengan tetap memperhatikan perlindungan terhadap Lingkungan Hidup.
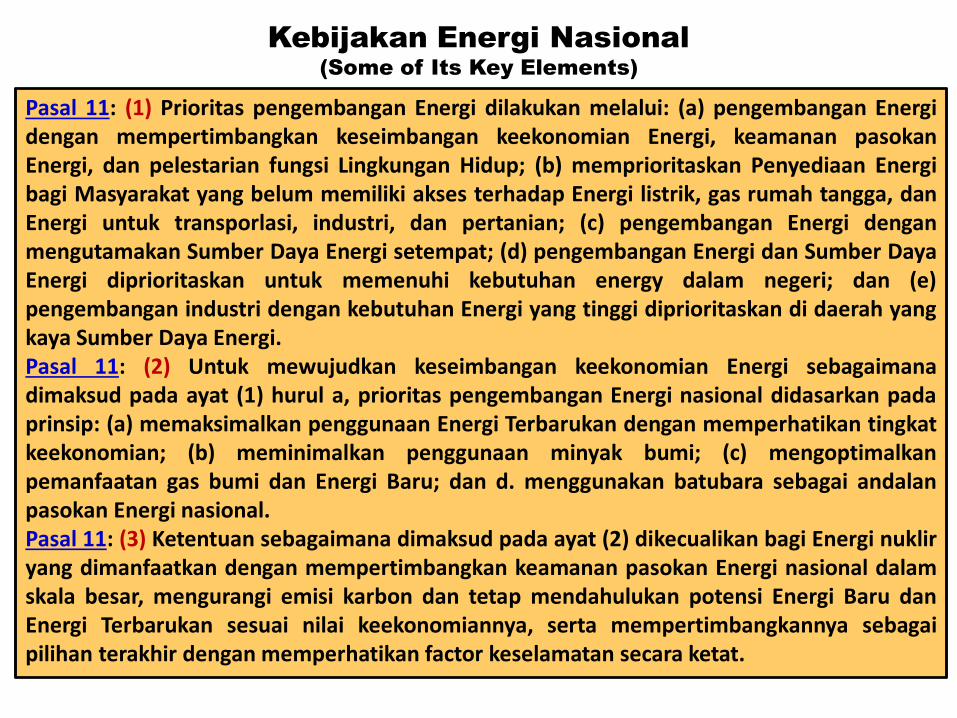
Pasal 11: (1) Prioritas pengembangan Energi dilakukan melalui: (a) pengembangan Energidengan mempertimbangkan keseimbangan keekonomian Energi, keamanan pasokanEnergi, dan pelestarian fungsi Lingkungan Hidup; (b) memprioritaskan Penyediaan Energibagi Masyarakat yang belum memiliki akses terhadap Energi listrik, gas rumah tangga, danEnergi untuk transporlasi, industri, dan pertanian; (c) pengembangan Energi denganmengutamakan Sumber Daya Energi setempat; (d) pengembangan Energi dan Sumber DayaEnergi diprioritaskan untuk memenuhi kebutuhan energy dalam negeri; dan (e)pengembangan industri dengan kebutuhan Energi yang tinggi diprioritaskan di daerah yangkaya Sumber Daya Energi.Pasal 11: (2) Untuk mewujudkan keseimbangan keekonomian Energi sebagaimanadimaksud pada ayat (1) hurul a, prioritas pengembangan Energi nasional didasarkan padaprinsip: (a) memaksimalkan penggunaan Energi Terbarukan dengan memperhatikan tingkatkeekonomian; (b) meminimalkan penggunaan minyak bumi; (c) mengoptimalkanpemanfaatan gas bumi dan Energi Baru; dan d. menggunakan batubara sebagai andalanpasokan Energi nasional.Pasal 11: (3) Ketentuan sebagaimana dimaksud pada ayat (2) dikecualikan bagi Energi nukliryang dimanfaatkan dengan mempertimbangkan keamanan pasokan Energi nasional dalamskala besar, mengurangi emisi karbon dan tetap mendahulukan potensi Energi Baru danEnergi Terbarukan sesuai nilai keekonomiannya, serta mempertimbangkannya sebagaipilihan terakhir dengan memperhatikan factor keselamatan secara ketat.
Kebijakan Energi Nasional
(Some of Its Key Elements)

National Energy Mix up to 2050

Supply of Primary Energy – By Type (%)
(2014 Handbook of Energy & Economic Statistics of Indonesia)
Note: Oil including crude oil, petroleum product and LPG; Coal including coal and briquette; Gas including naturalgas and LNG; Biomass including firewood and charcoal; Biofuel : pure bio energy (not blending product).

Potential of Renewable Energy - Indonesia

Basic Models for Industry Structure
Sequence of Main Tasks
System Planning Process
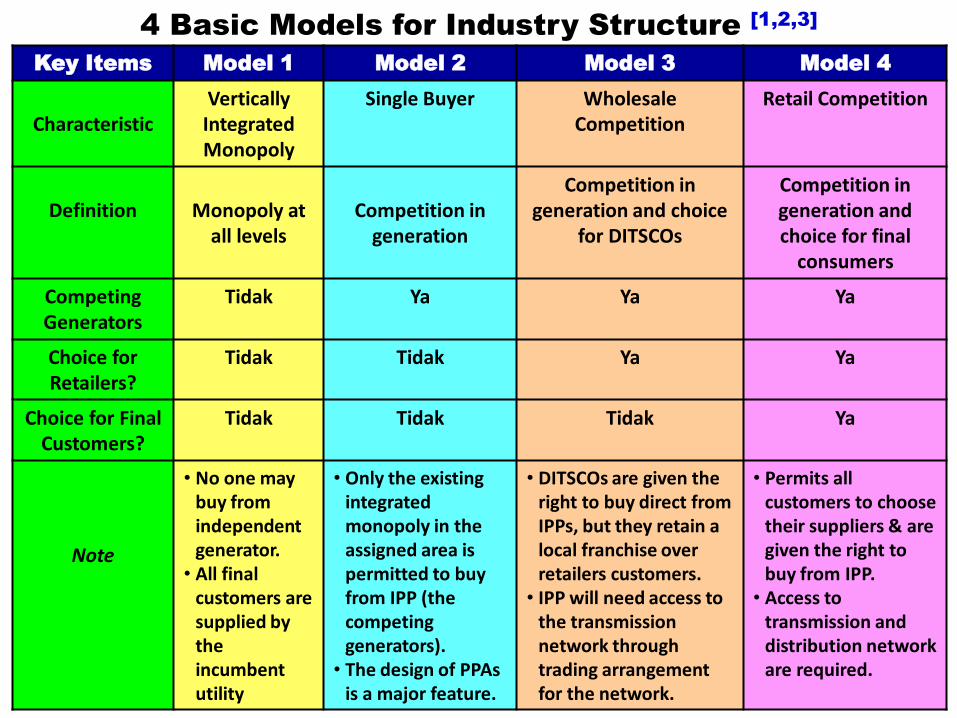
4 Basic Models for Industry Structure [1,2,3]
Key Items Model 1 Model 2 Model 3 Model 4
CharacteristicVertically Integrated Monopoly
Single Buyer Wholesale Competition
Retail Competition
Definition Monopoly at all levels
Competition in generation
Competition in generation and choice
for DITSCOs
Competition in generation and choice for final
consumers
Competing Generators
Tidak Ya Ya Ya
Choice for Retailers?
Tidak Tidak Ya Ya
Choice for Final Customers?
Tidak Tidak Tidak Ya
Note
• No one may buy from independent generator.
• All final customers are supplied by the incumbent utility
• Only the existing integrated monopoly in the assigned area is permitted to buy from IPP (the competing generators).
• The design of PPAs is a major feature.
• DITSCOs are given the right to buy direct from IPPs, but they retain a local franchise over retailers customers.
• IPP will need access to the transmission network through trading arrangement for the network.
• Permits all customers to choose their suppliers & are given the right to buy from IPP.
• Access to transmission and distribution network are required.

Pre
-Op
era
tio
nal
Ph
ase
of
Po
we
r Sy
ste
m
Op
era
tio
nal
Ph
ase
Co
nst
ruct
ion
Ph
ase
De
cisi
on
P
has
e
Key Elements of NPP Phase
(Example)
Planning Phase
Sequence of
Main Tasks
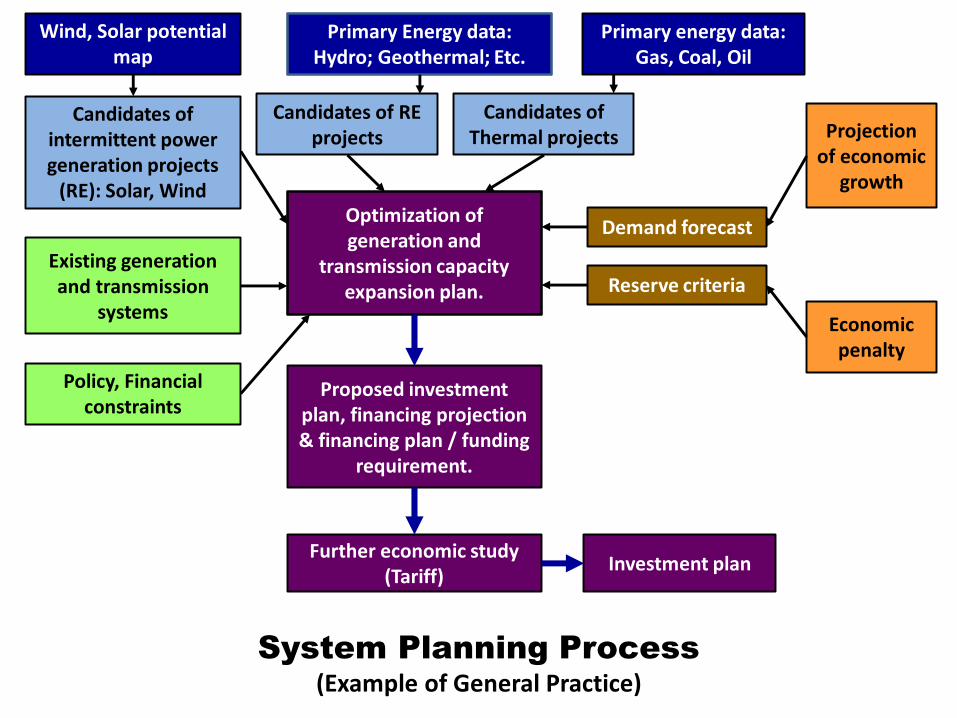
Optimization of generation and
transmission capacity expansion plan.
Proposed investment plan, financing projection & financing plan / funding
requirement.
Further economic study (Tariff)
Investment plan
Policy, Financial constraints
Existing generation and transmission
systems
Demand forecast
Reserve criteria
Projection of economic
growth
Economic penalty
Candidates of RE projects
Candidates of Thermal projects
Primary energy data:Gas, Coal, Oil
Primary Energy data:Hydro; Geothermal; Etc.
Candidates of intermittent power generation projects
(RE): Solar, Wind
Wind, Solar potential map
System Planning Process
(Example of General Practice)

Principal States of Power System Operation
Pre-Operational & Operational Phase

Principal States of Power System Operation [4]
Normal
State
Alert State
Emergency
State
Restoration
State
Actions
Restorative
Actions
Emergency
Actions
Contingency
Analysis
In 1967, Dy Liacco 4) presented his famous chart which introduced a view of the power systemoperations in terms of its principal states: (1) Normal, (2) Alert, (3) Emergency, and (4)Restoration, and the transitions spontaneous between theses states. In his framework, thelevel of the system security is tested with respect to a set of contingencies, and the systemstate is said to be secure if no contingency would violate the emergency operating constraints.
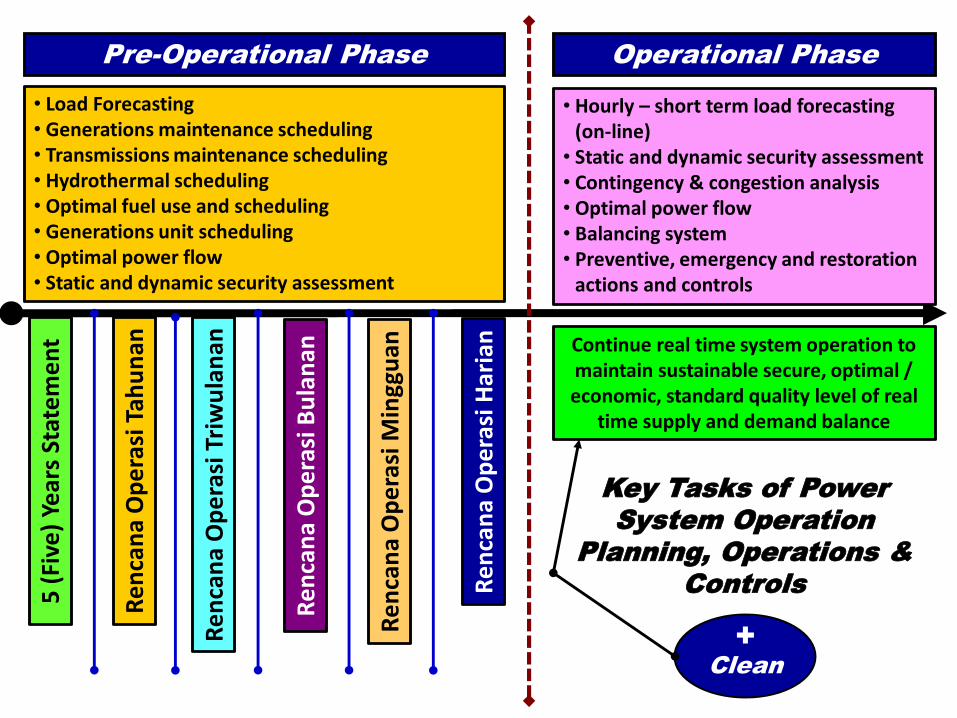
Pre-Operational Phase Operational Phase
Re
nca
na
Op
era
siH
aria
n
Re
nca
na
Op
era
siM
ingg
uan
Re
nca
na
Op
era
siTr
iwu
lan
an
Re
nca
na
Op
era
siB
ula
nan
Re
nca
na
Op
era
siTa
hu
nan
• Hourly – short term load forecasting (on-line)
• Static and dynamic security assessment• Contingency & congestion analysis• Optimal power flow• Balancing system• Preventive, emergency and restoration
actions and controls
Continue real time system operation to maintain sustainable secure, optimal / economic, standard quality level of real
time supply and demand balance
• Load Forecasting• Generations maintenance scheduling• Transmissions maintenance scheduling• Hydrothermal scheduling• Optimal fuel use and scheduling• Generations unit scheduling• Optimal power flow• Static and dynamic security assessment
Key Tasks of Power
System Operation
Planning, Operations &
Controls
+
Clean
5 (
Five
) Ye
ars
Stat
em
en
t
Off-Grid Connection Renewable Energy & Grid
Extension
(Associated Key Issues)

Off-Grid Connection Renewable Energy & Grid
Extension
(Associated Key Issues) [6,7,8]
Asso
ciate
d K
ey
Issu
es
Off-grid integration of variable
energy sources (RE) and
extension of off-grid RE
including hybrid set-up
RE for rural electrification
Reliable, clean, secure and
economic RE off-grid
integration
System operations and
dynamic stability of RE off-grid
integration
Required integrated
communication: sensing &
measurements, advance
components, advance control,
and decision support
Technical standards for off-
grid connection RE
applications
Asset management: cost (of assets, of
replacement, of operation & maintenance),
performance (efficiency, reliability and
security impacts), and risk (of failure, of
reliability impacts, of security impacts)
Integration of RE into grid
extension planning
Balancing Act
(Associated Key Issues)
Mark G. Lauby, Mark Ahlstrom, Daniel L. Brooks, et al., “Balancing Act. NERC’s Integration ofVariable Generation Task Force Plans for a Less Predictable Future”, IEEE Power & EnergyMagazine, Volume 9, Number 6, November/December 2011.
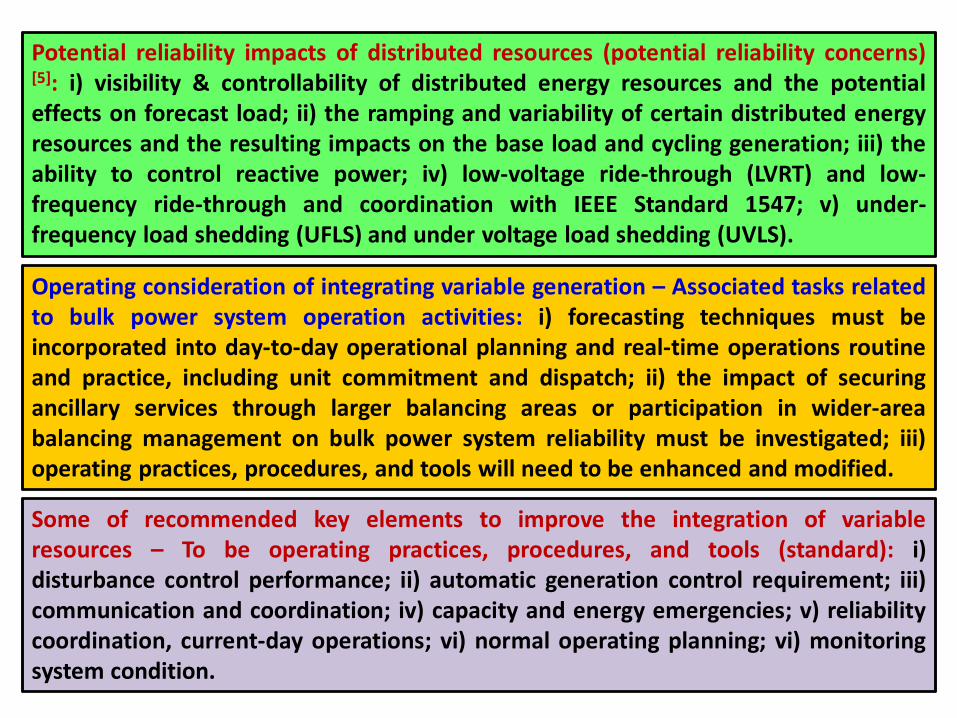
Potential reliability impacts of distributed resources (potential reliability concerns)[5]: i) visibility & controllability of distributed energy resources and the potentialeffects on forecast load; ii) the ramping and variability of certain distributed energyresources and the resulting impacts on the base load and cycling generation; iii) theability to control reactive power; iv) low-voltage ride-through (LVRT) and low-frequency ride-through and coordination with IEEE Standard 1547; v) under-frequency load shedding (UFLS) and under voltage load shedding (UVLS).
Operating consideration of integrating variable generation – Associated tasks relatedto bulk power system operation activities: i) forecasting techniques must beincorporated into day-to-day operational planning and real-time operations routineand practice, including unit commitment and dispatch; ii) the impact of securingancillary services through larger balancing areas or participation in wider-areabalancing management on bulk power system reliability must be investigated; iii)operating practices, procedures, and tools will need to be enhanced and modified.
Some of recommended key elements to improve the integration of variableresources – To be operating practices, procedures, and tools (standard): i)disturbance control performance; ii) automatic generation control requirement; iii)communication and coordination; iv) capacity and energy emergencies; v) reliabilitycoordination, current-day operations; vi) normal operating planning; vi) monitoringsystem condition.

Distributed Control Systems for Small-Scale Power
Networks
Ali Bidram, Frank L. Lewis, and Ali Davoudi, “Distributed Control Systems for Small-Scale PowerNetworks. USING MULTIAGENT COOPERATIVE CONTROL THEORY”, IEEE Control SystemMAGAZINE, December 2014, Volume 34, Number 6.

Hierarchical control strategy consists of (1) primary, (2) secondary, and (3) tertiary controls.The primary control maintains voltage and frequency stability of the microgrid subsequent tothe islanding Process. Secondary control compensates for the voltage and frequency deviationscaused by the operation of the primary controls. Tertiary control manages the power flowbetween the microgrid and the main grid and facilitates economically optimal operation.
The Hierarchical Control Structure of Microgrids

PERMEN ESDM NO. 19 TAHUN 2016
PEMBELIAN TENAGA LISTRIK DARI PLTS FOTOVOLTAIK
OLEH PT PLN (PERSERO)

Ketentuan Penyusunan
Dokumen Studi Penyambungan (Interconnection Study)
TujuanUntuk memastikan koneksi dan operasi paralel PLTS Fotovaltaik tidakberdampak negatif terhadap keselamatan, keandalan dan kualitas dayamaupun kontinuitas system tenaga listrik pada system distribusi PT PLN(Persero).
Persyaratan
Wajib memenuhi persyaratan sebagai berikut:a. Kapasitas PLTS Fotovoltaik tidak melebihi 25% (dua puluh lima persen)
dari kapasitas beban puncak siang penyulang;b. Short circuit level (SCL) tidak melebihi 10% (sepuluh persen) dari arus
hubung singkat maksimum penyulang;c. PLTS Fotovaltaik wajib memenuhi:
1. Persyaratan fungsi proteksi:a) Tegangan lebih atau tegangan kurang frekuensi;b) Fungsi peginderan tegangan dan frekuensi serta waktu tunda;c) Anti islanding;d) Deteksi gangguan jaringan distribusi;e) transfer trip;f) Alat pemutus interkoneksi manual;g) surge withstand capability;h) Peralatan parallel;i) reclose blocking;j) Peralatan tambahan yang diperlukan; dank) Proteksi cadangan;

Persyaratan
2. Persyaratan fungsi pencegahan interferensi sistema) Pengaturan tegangan;b) Respon terhadap tegangan abnormal;c) Respon terhadap frekuensi abnormal;d) Sinkronisasi;e) Flicker;f) Harmonisa; dang) Faktor Daya;
3. Persyaratan teknik spesifik teknologi pembangkita) Generator Sinkron;b) Generator Induksi; danc) Inverter memenuhi standar internasional;
4. Dalam kondisi beban rendah dan kondisi awan yang cepattertutup:
a) Membatasi ramp inverter (naik atau turun) pada laju 10%(sepuluh persen) per menit dari kapasitas inverter, berlakuuntuk start up dan shut down, operasi normal. Danperintah pembatasan, lecuali selama terjadi penurunanradiasi surya; dan
b) Mengatur waktu restart untuk inverter ganda pada 15(lima belas) detik atau lebih;
d. Persyaratan komunikasi dan metering;e. Penguijian, sertifikasi dan komisioning; danf. Persyaratan tambahan untuk stabilitas sistem.
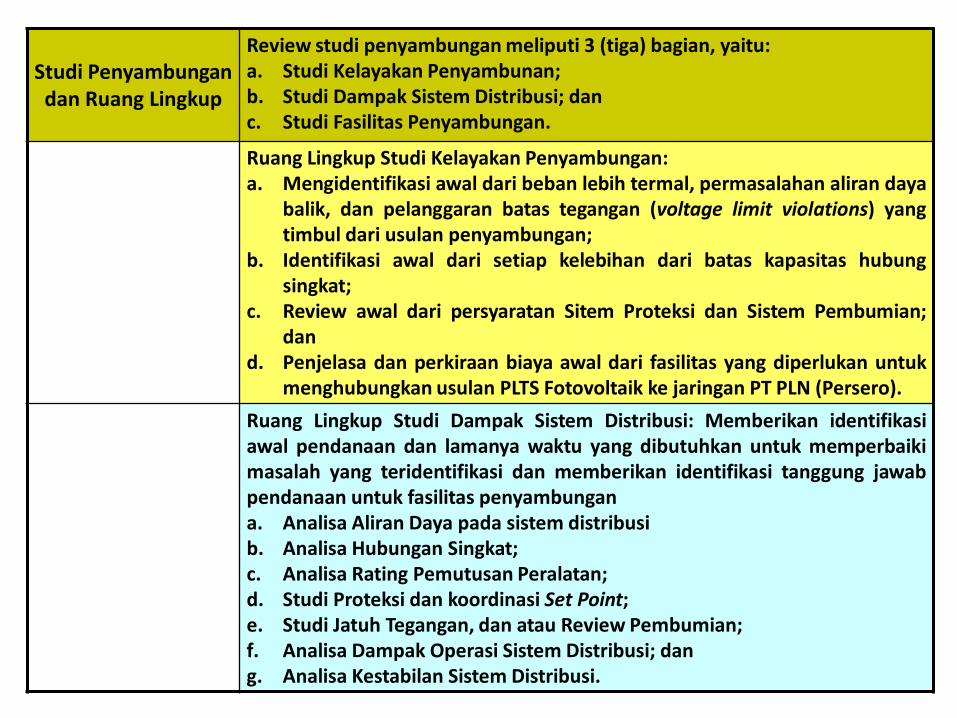
Studi Penyambungandan Ruang Lingkup
Review studi penyambungan meliputi 3 (tiga) bagian, yaitu:a. Studi Kelayakan Penyambunan;b. Studi Dampak Sistem Distribusi; danc. Studi Fasilitas Penyambungan.
Ruang Lingkup Studi Kelayakan Penyambungan:a. Mengidentifikasi awal dari beban lebih termal, permasalahan aliran daya
balik, dan pelanggaran batas tegangan (voltage limit violations) yangtimbul dari usulan penyambungan;
b. Identifikasi awal dari setiap kelebihan dari batas kapasitas hubungsingkat;
c. Review awal dari persyaratan Sitem Proteksi dan Sistem Pembumian;dan
d. Penjelasa dan perkiraan biaya awal dari fasilitas yang diperlukan untukmenghubungkan usulan PLTS Fotovoltaik ke jaringan PT PLN (Persero).
Ruang Lingkup Studi Dampak Sistem Distribusi: Memberikan identifikasiawal pendanaan dan lamanya waktu yang dibutuhkan untuk memperbaikimasalah yang teridentifikasi dan memberikan identifikasi tanggung jawabpendanaan untuk fasilitas penyambungana. Analisa Aliran Daya pada sistem distribusib. Analisa Hubungan Singkat;c. Analisa Rating Pemutusan Peralatan;d. Studi Proteksi dan koordinasi Set Point;e. Studi Jatuh Tegangan, dan atau Review Pembumian;f. Analisa Dampak Operasi Sistem Distribusi; dang. Analisa Kestabilan Sistem Distribusi.
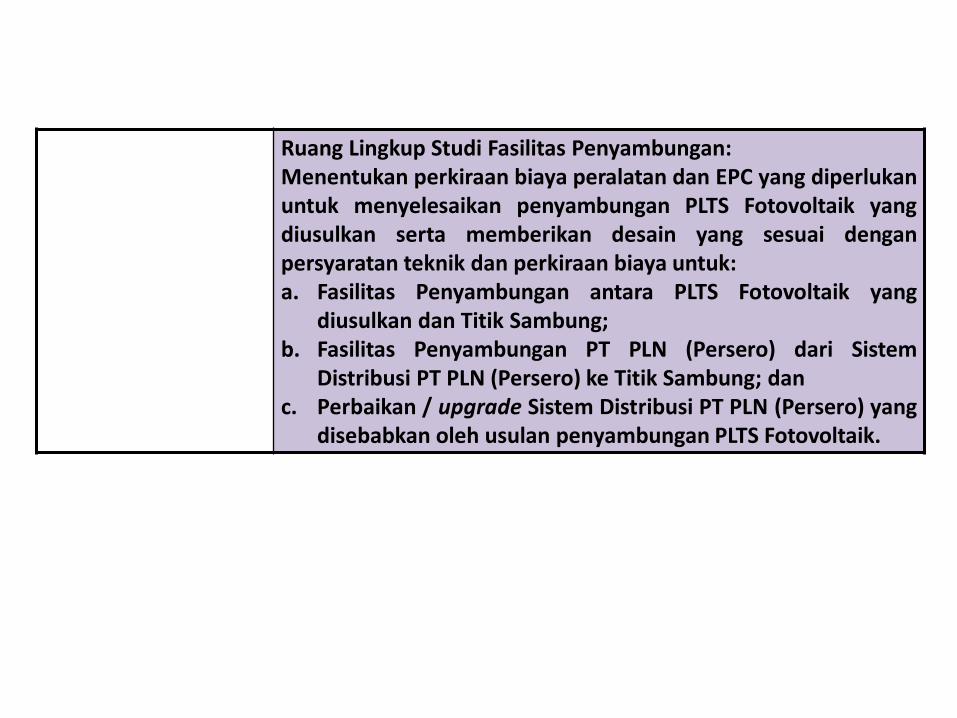
Ruang Lingkup Studi Fasilitas Penyambungan:Menentukan perkiraan biaya peralatan dan EPC yang diperlukanuntuk menyelesaikan penyambungan PLTS Fotovoltaik yangdiusulkan serta memberikan desain yang sesuai denganpersyaratan teknik dan perkiraan biaya untuk:a. Fasilitas Penyambungan antara PLTS Fotovoltaik yang
diusulkan dan Titik Sambung;b. Fasilitas Penyambungan PT PLN (Persero) dari Sistem
Distribusi PT PLN (Persero) ke Titik Sambung; danc. Perbaikan / upgrade Sistem Distribusi PT PLN (Persero) yang
disebabkan oleh usulan penyambungan PLTS Fotovoltaik.
Harga Pembelian Tenaga Listrik – FIT
Harga Jual Tenaga Listrik (HJTL) vs Biaya Pokok
Penyediaan (BPP), PT PLN (Persero), June 2015
44
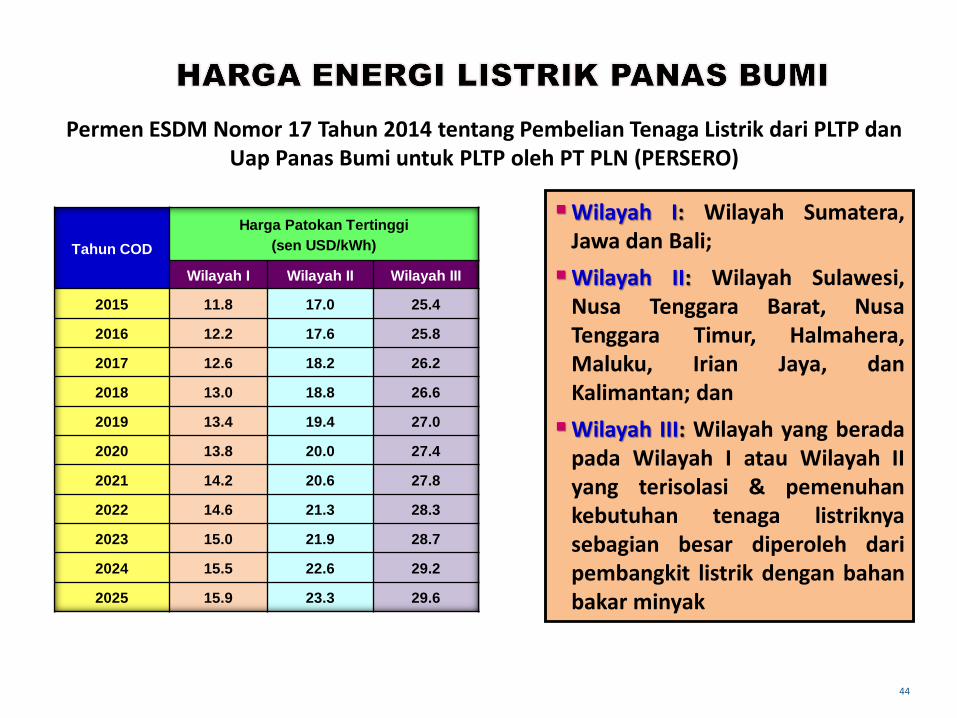
Permen ESDM Nomor 17 Tahun 2014 tentang Pembelian Tenaga Listrik dari PLTP danUap Panas Bumi untuk PLTP oleh PT PLN (PERSERO)
Tahun COD
Harga Patokan Tertinggi
(sen USD/kWh)
Wilayah I Wilayah II Wilayah III
2015 11.8 17.0 25.4
2016 12.2 17.6 25.8
2017 12.6 18.2 26.2
2018 13.0 18.8 26.6
2019 13.4 19.4 27.0
2020 13.8 20.0 27.4
2021 14.2 20.6 27.8
2022 14.6 21.3 28.3
2023 15.0 21.9 28.7
2024 15.5 22.6 29.2
2025 15.9 23.3 29.6
Wilayah I: Wilayah Sumatera,Jawa dan Bali;
Wilayah II: Wilayah Sulawesi,Nusa Tenggara Barat, NusaTenggara Timur, Halmahera,Maluku, Irian Jaya, danKalimantan; dan
Wilayah III: Wilayah yang beradapada Wilayah I atau Wilayah IIyang terisolasi & pemenuhankebutuhan tenaga listriknyasebagian besar diperoleh daripembangkit listrik dengan bahanbakar minyak

(PERATURAN MENTERI ESDM NO. 19 TAHUN 2013 dan NO. 27 TAHUN 2014)
No EnergI Kapasitas Tarif Listrik Catatan
Tegangan Menengah
1. Biomass *) s.d 10 MW Rp. 1.150,- / kWh X F
2. Biogas *) s.d 10 MW Rp. 1.050,- / kWh X F Non PLTSa
3. Sampah Kota **) s.d 10 MW Rp. 1.450,- / kWh Zero waste
4. Sampah Kota **) s.d 10 MW Rp. 1.250,- / kWh Landfill
Tegangan Rendah
1. Biomass *) s.d 10 MW Rp. 1.500,- / kWh X F
2 Biogas *) s.d 10 MW Rp. 1.400,- / kWh X F Non PLTSa
3 Sampah Kota **) s.d 10 MW Rp. 1.798,- / kWh Zero waste
4 Sampah Kota **) s.d 10 MW Rp. 1.598,- / kWh Landfill
Keterangan:
*) sesuai Permen ESDM No.27 Tahun 2014
F adalah faktor insentif berdasarkan wilayah instalasi pembangkit
• Pulau Jawa : F = 1
• Pulau Sumatera : F = 1,15
• Pulau Sulawesi : F = 1,25
• Pulau Kalimantan : F = 1,3
• Bali, Bangka Belitung, Lombok : F = 1,5
• Kep. Riau, Papua dan pulau lainnya : F = 1,6
**) sesuai Permen ESDM No.19 Tahun 201345
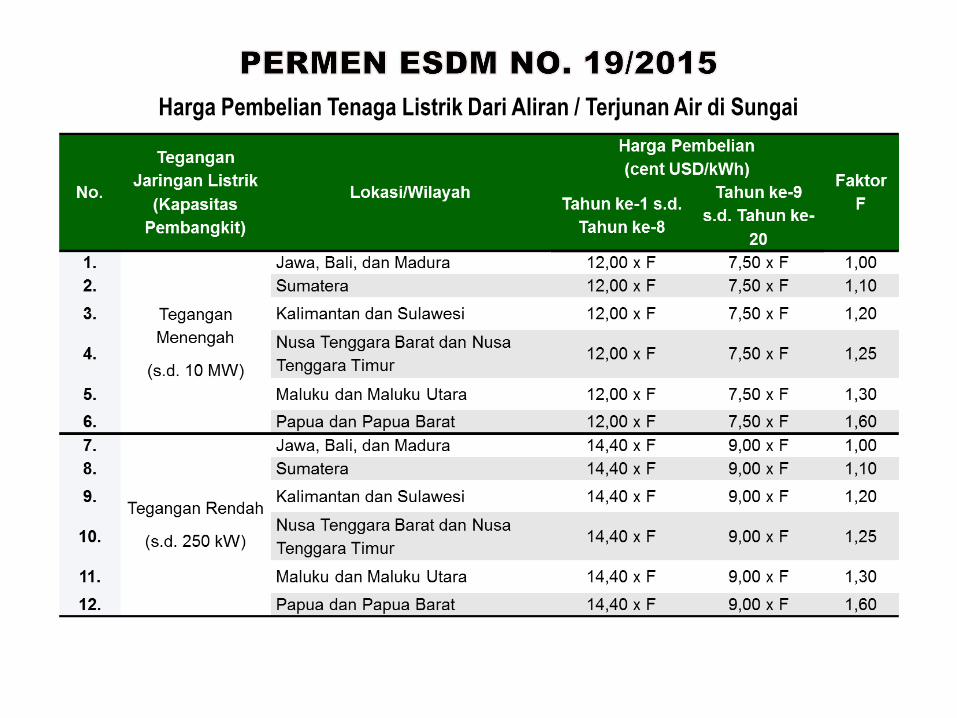
Harga Pembelian Tenaga Listrik Dari Aliran / Terjunan Air di Sungai

Harga Pembelian Tenaga Listrik Dengan Menggunakan Dam /Waduk

Harga Penyesuaian Pembelian Tenaga Listrik PLTM/H (PLTM/H yang sudah beroperasi)
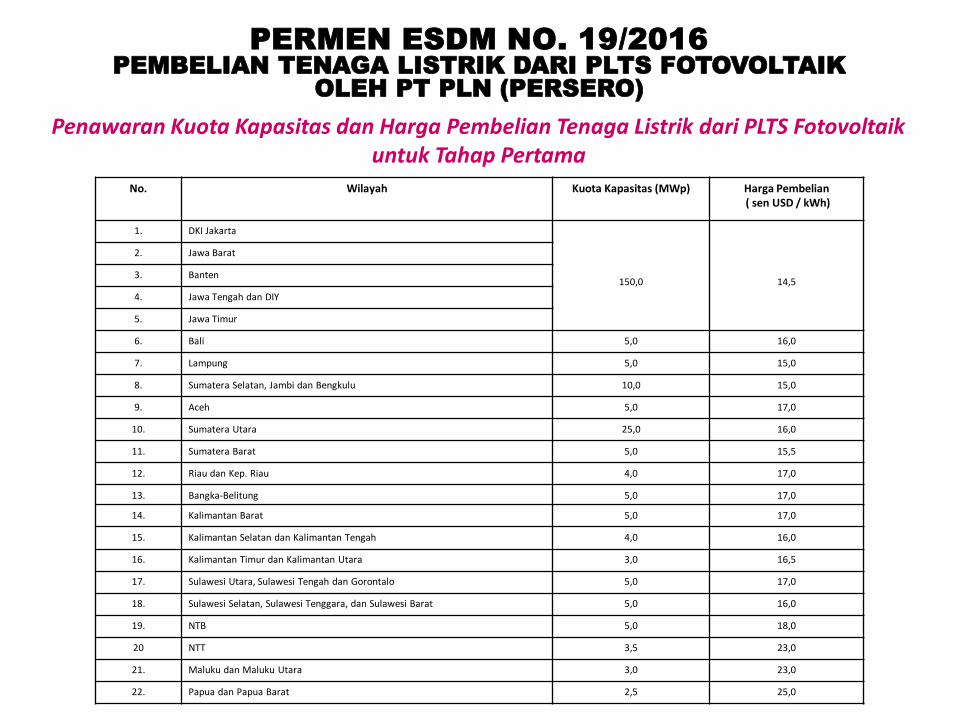
Penawaran Kuota Kapasitas dan Harga Pembelian Tenaga Listrik dari PLTS Fotovoltaikuntuk Tahap Pertama
No. Wilayah Kuota Kapasitas (MWp) Harga Pembelian( sen USD / kWh)
1. DKI Jakarta
150,0 14,5
2. Jawa Barat
3. Banten
4. Jawa Tengah dan DIY
5. Jawa Timur
6. Bali 5,0 16,0
7. Lampung 5,0 15,0
8. Sumatera Selatan, Jambi dan Bengkulu 10,0 15,0
9. Aceh 5,0 17,0
10. Sumatera Utara 25,0 16,0
11. Sumatera Barat 5,0 15,5
12. Riau dan Kep. Riau 4,0 17,0
13. Bangka-Belitung 5,0 17,0
14. Kalimantan Barat 5,0 17,0
15. Kalimantan Selatan dan Kalimantan Tengah 4,0 16,0
16. Kalimantan Timur dan Kalimantan Utara 3,0 16,5
17. Sulawesi Utara, Sulawesi Tengah dan Gorontalo 5,0 17,0
18. Sulawesi Selatan, Sulawesi Tenggara, dan Sulawesi Barat 5,0 16,0
19. NTB 5,0 18,0
20 NTT 3,5 23,0
21. Maluku dan Maluku Utara 3,0 23,0
22. Papua dan Papua Barat 2,5 25,0
PERMEN ESDM NO. 19/2016
PEMBELIAN TENAGA LISTRIK DARI PLTS FOTOVOLTAIK
OLEH PT PLN (PERSERO)

Technical Expert Meetings: RE Supply
ADP 2-9, 3 June 2015, Bonn.
Distributed Generation. Policies and Financial Incentives, including Feed-in-Tariffs.

(1) System integration; Investment cost and how to finance?; (2) Associated policy &framework for integration; (3) As a part of power sector/energy sector, there is a need ofa specific technology to maintain supply and demand balanced, including a completestudy regarding its penetration into power system/energy sector based on evolvingexperiences. Since intermittent, how about storage system? and more information onviability of this technology is strongly required; (4) The need more multiple scenarios tomaintain supply and demand balance; (5) The need of a global learning of RE, and acomplete description of investment cost with taking into account site characteristic; (6)How to mobilize the fulfillment of financial needs that to be supported by stable legal andregulatory framework at national level through balance engagement legally, commerciallyand financially; (7) Mapping of risk perception; (8) The need to help the energy sector tohave a comprehensive actions at national level and also at global level to be integrated atinternational market; (9) The availability of enabling environment to support and tofacilitate the RE market at national level and linkage with international market withinvolvement of non-state actors from national and international, such as long-term policy,regulation & framework and its implementing rules, and financing instruments to supportrenewable energy development & deployment; (10) The need of power purchaseagreement based on balance engagement legally, commercially, financially andoperationally; (11) The predictive carbon price at appropriate level to support financinginstruments; (12) Improvement RE technology and sustainable innovation to reduceinvestment costs; (13) Development of financing tools to enable the transition fordecarbonization to take place as quickly as possible;
Associated Key Issues – Raised at the Discussion

Electricity Markets and RES Integration – Key
Challenges and Possible Solutions
Arthur Henriot, Andres Delgadillo, Jean-Michel Glachant; European University Institute,“Electricity markets and RES integration – Key challenges and possible solutions”, Dialoque on aRES policy framework for 2030, towards2030, March 2015.
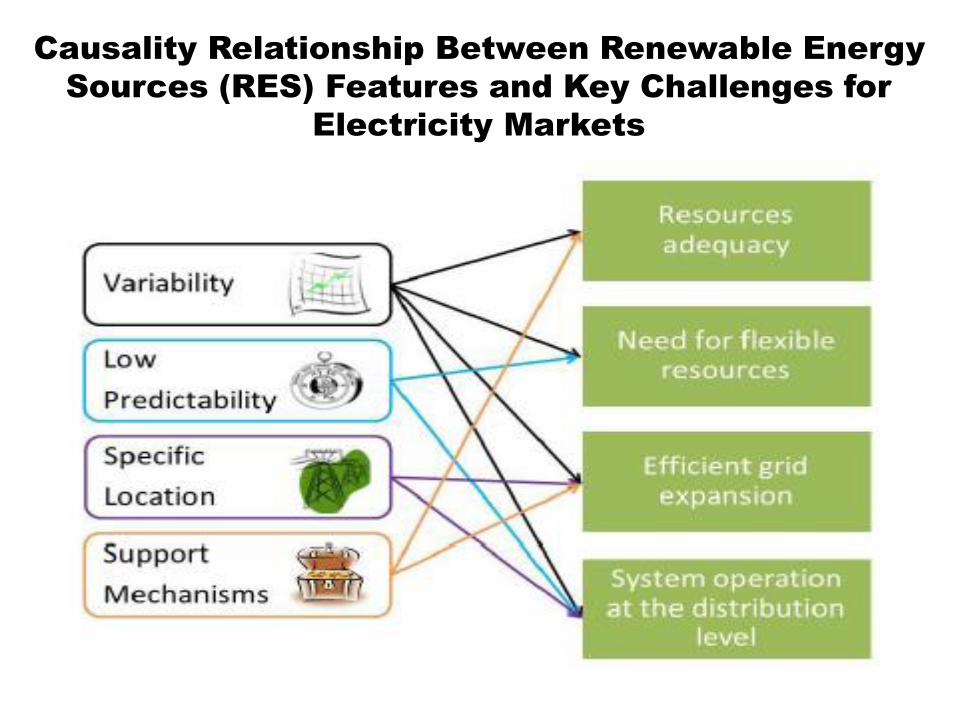
Causality Relationship Between Renewable Energy
Sources (RES) Features and Key Challenges for
Electricity Markets
ChallengesContribution of
Wholesale Market Evolutions
Contributionof Coordination Tools
Contribution of Distributed Solutions
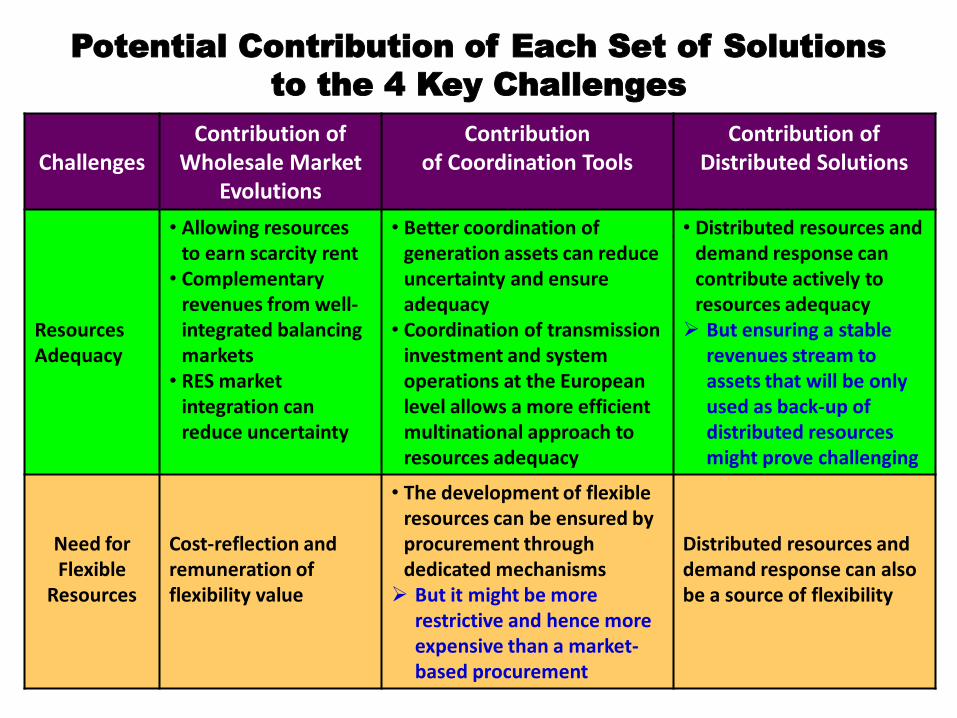
Resources Adequacy
• Allowing resources to earn scarcity rent
• Complementary revenues from well-integrated balancing markets
• RES market integration can reduce uncertainty
• Better coordination of generation assets can reduce uncertainty and ensure adequacy
• Coordination of transmission investment and system operations at the European level allows a more efficient multinational approach to resources adequacy
• Distributed resources and demand response can contribute actively to resources adequacy But ensuring a stable
revenues stream to assets that will be only used as back-up of distributed resources might prove challenging
Need for Flexible
Resources
Cost-reflection and remuneration of flexibility value
• The development of flexible resources can be ensured by procurement through dedicated mechanisms But it might be more
restrictive and hence more expensive than a market-based procurement
Distributed resources and demand response can also be a source of flexibility
Potential Contribution of Each Set of Solutions
to the 4 Key Challenges

ChallengesContribution of
Wholesale Market Evolutions
Contributionof Coordination Tools
Contribution of Distributed Solutions
Efficient Grid Expansion
Stronger locational signals in the wholesale market might reduce the need for grid expansion
Coordination tools between generation and transmission assets as well as between the different transmission operators allow more efficient grid expansion
• The development of distributed resources might reduce the need for grid expansion But it creates higher
risks of stranded transmission assets as consumers “leave the grid”
System Operation at
the Distribution
Level
Cost-reflection and transparency in the system costs might induce the development of efficient distributed solutions
Coordination tools between transmission and distribution network operators will be needed to handle local issues efficiently
The development of distributed resources will give many options to system operators at the distribution level
Potential Contribution of Each Set of Solutions
to the 4 Key Challenges

Electricity Market Design and Options for
Promoting Low carbon Technologies
Rupert Hartel (KIT), Wolf Fichner & Dogan Keles (KIT), “Electricity Market Design and Options forPromoting Low carbon Technologies”, INSIGHT_E, Rapid Response Energy Brief, April 2015.

Change the Pricing System to Pay-as-Bid
The change of the current pricing system to a pay-as-bid pricing is one proposalanalysed. Auction winners would get paid their bid price instead of the most expensivebid price that is accepted. It is to assume that market participants would bid with theirfixed operation costs and variable costs to assure cost recovery. This is not necessarilythe case, since plant operators need to dispatch more often to at least partly recovercosts. In particular, plants with high capital costs and low marginal costs will try todispatch as often as possible.
Dispatch Based on Marginal Costs and Pricing on LCOE
Another way of changing the pricing in the electricity spot market is by allowing morecomplex bids. The system operator would be informed of the marginal as well as theaverage production costs of the market participants. The dispatch of the plants wouldbe organized according to rising marginal costs, whereas payments would be based onthe average production costs. This approach could lead to different problems. Thiscomplex bidding system could also lead to inefficient plant dispatch and adisproportional increase of technologies with low marginal costs.
Develop a Market for a Completely Renewable
Electricity System
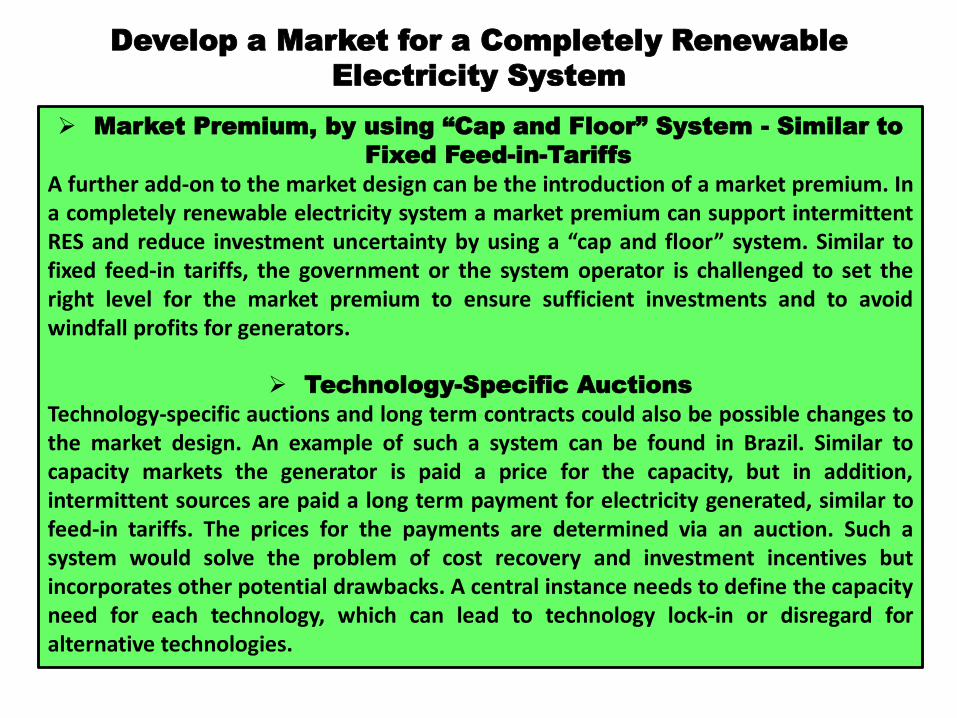
Market Premium, by using “Cap and Floor” System - Similar to
Fixed Feed-in-Tariffs
A further add-on to the market design can be the introduction of a market premium. Ina completely renewable electricity system a market premium can support intermittentRES and reduce investment uncertainty by using a “cap and floor” system. Similar tofixed feed-in tariffs, the government or the system operator is challenged to set theright level for the market premium to ensure sufficient investments and to avoidwindfall profits for generators.
Technology-Specific Auctions
Technology-specific auctions and long term contracts could also be possible changes tothe market design. An example of such a system can be found in Brazil. Similar tocapacity markets the generator is paid a price for the capacity, but in addition,intermittent sources are paid a long term payment for electricity generated, similar tofeed-in tariffs. The prices for the payments are determined via an auction. Such asystem would solve the problem of cost recovery and investment incentives butincorporates other potential drawbacks. A central instance needs to define the capacityneed for each technology, which can lead to technology lock-in or disregard foralternative technologies.
Develop a Market for a Completely Renewable
Electricity System
Electricity System Development: A Focus on Smart
Grids
Overview of Activities and Players in Smart Grids
UNITED NATIONS ECONOMIC COMMISSION FOR EUROPE (UNECE)
Selection of Smart Grid Definitions
Smart Grid Deployment Drivers
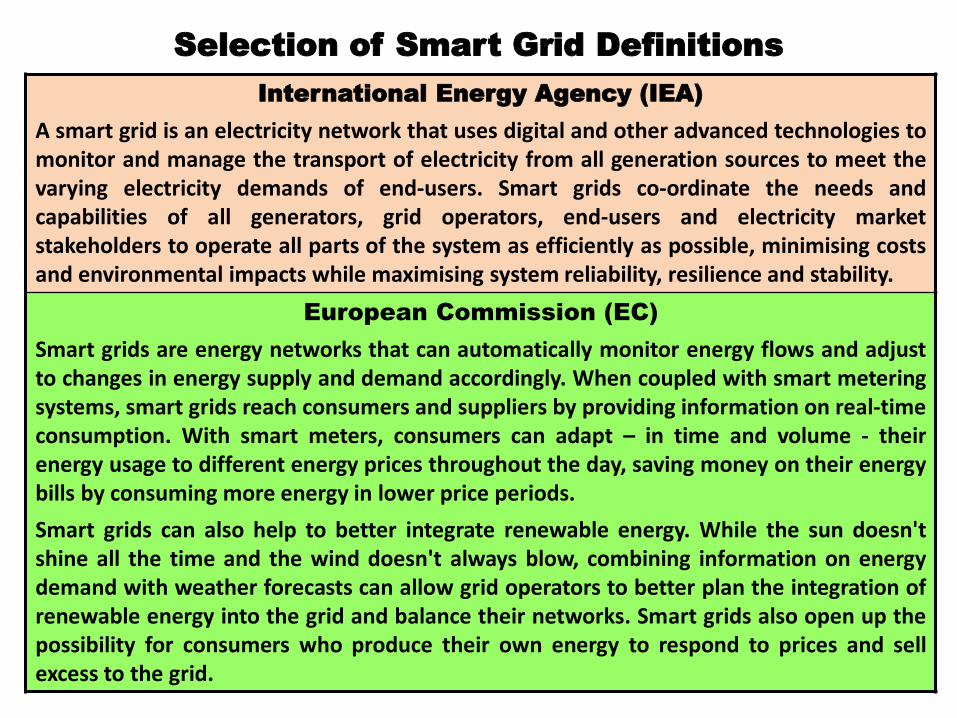
International Energy Agency (IEA)
A smart grid is an electricity network that uses digital and other advanced technologies tomonitor and manage the transport of electricity from all generation sources to meet thevarying electricity demands of end-users. Smart grids co-ordinate the needs andcapabilities of all generators, grid operators, end-users and electricity marketstakeholders to operate all parts of the system as efficiently as possible, minimising costsand environmental impacts while maximising system reliability, resilience and stability.
European Commission (EC)
Smart grids are energy networks that can automatically monitor energy flows and adjustto changes in energy supply and demand accordingly. When coupled with smart meteringsystems, smart grids reach consumers and suppliers by providing information on real-timeconsumption. With smart meters, consumers can adapt – in time and volume - theirenergy usage to different energy prices throughout the day, saving money on their energybills by consuming more energy in lower price periods.
Smart grids can also help to better integrate renewable energy. While the sun doesn'tshine all the time and the wind doesn't always blow, combining information on energydemand with weather forecasts can allow grid operators to better plan the integration ofrenewable energy into the grid and balance their networks. Smart grids also open up thepossibility for consumers who produce their own energy to respond to prices and sellexcess to the grid.
Selection of Smart Grid Definitions

United States Office of Electricity Delivery & Energy Reliability
“Smart grid” generally refers to a class of technology that people are usingto bring utility electricity delivery systems into the 21st century, usingcomputer-based remote control and automation. These systems are madepossible by two-way communication technology and computer processingthat has been used for decades in other industries. They are beginning to beused on electricity networks, from the power plants and wind farms all theway to the consumers of electricity in homes and businesses. They offermany benefits to utilities and consumers -- mostly seen in big improvementsin energy efficiency on the electricity grid and in the energy users’ homesand offices.
Japan Smart Community Alliance (JSCA)
In the context of Smart Communities, smart grids promote the greater useof renewable and unused energy and local generation of heat energy forlocal consumption and contribute to the improvement of energy self-sufficiency rates and reduction of CO2 emissions. Smart grids provide stablepower supply and optimize overall grid operations from power generationto the end user.
Selection of Smart Grid Definitions

International Electrotechnical Commission (IEC)
The general understanding is that the Smart Grid is the concept ofmodernizing the electric grid. The Smart Grid comprises everything related tothe electric system in between any point of generation and any point ofconsumption. Through the addition of Smart Grid technologies the gridbecomes more flexible, interactive and is able to provide real time feedback.A smart grid is an electricity network that can intelligently integrate theactions of all users connected to it – generators, consumers and those that doboth – in order to efficiently deliver sustainable, economic and secureelectricity supplies. A smart grid employs innovative products and servicestogether with intelligent monitoring, control, communication, and self-healingtechnologies to: facilitate the connection and operation of generators of allsizes and technologies; allow consumers to play a part in optimizing theoperation of the system; provide consumers with greater information andchoice of supply; significantly reduce the environmental impact of the wholeelectricity supply system; deliver enhanced levels of reliability and security ofsupply.
Selection of Smart Grid Definitions

Ranked Smart Grid Technology Motivating Drivers
Based on Country Surveys
Developed Economies Developing Economies
Common in the top six of each economy type are: 1) system efficiency improvements,2) reliability improvements and 3) RE standards or targets, but each are placed at differentlevels of priority.Differences between the two economy types include: 1) For developed countries: i) customerchoice and participation; ii) new products/services/markets) and optimizing asset utilization;2) For developing countries: i) economic advantages; ii) revenue collection; and iii) the role ofsmart grids to support generation adequacy.

SMART GRID CONCEPTUAL MODEL
The National Institute of Standards and Technology (NIST)

Smart Grid Conceptual Model [9]

The Smart Grid as defined here is based upon the descriptions found
in the Energy Independence and Security Act of 2007.
The term “Smart Grid” refers to a modernization of the electricity
delivery system so it monitors, protects and automatically optimizes
the operation of its interconnected elements – from the central and
distributed generator through the high-voltage network and
distribution system, to industrial users and building automation
systems, to energy storage installations and to end-use consumers
and their thermostats, electric vehicles, appliances and other
household devices.
The Smart Grid will be characterized by a two-way flow of electricity
and information to create an automated, widely distributed energy
delivery network. It incorporates into the grid the benefits of
distributed computing and communications to deliver real-time
information and enable the near-instantaneous balance of supply and
demand at the device level.
What is the Smart Grid?

7 (Seven) Important Domains
The National Institute of Standards and Technology (NIST) Smart Grid
Conceptual Model provides a high-level framework for the smart grid that
defines seven important domains: Bulk Generation, Transmission,
Distribution, Customers, Operations, Markets and Service Providers.
It shows all the communications and energy/electricity flows connecting
each domain and how they are interrelated. Each individual domain is
itself comprised of important smart grid elements that are connected to
each other through two-way communications and energy/electricity paths.
These connections are the basis of the future, intelligent and dynamic
power electricity grid.
The NIST Smart Grid Conceptual Model helps stakeholders understand
the building blocks of an end-to-end smart grid system, from Generation
to (and from) Customers, and explores the interrelation between these
smart grid segments.
At IEEE, the smart grid is seen as a large "System of Systems," where
each NIST smart grid domain is expanded into three smart grid
foundational layers: (i) the Power and Energy Layer, (ii) the
Communication Layer and (iii) the IT/Computer Layer. Layers (ii) and (iii)
are enabling infrastructure platforms of the Power and Energy Layer that
makes the grid "smarter."

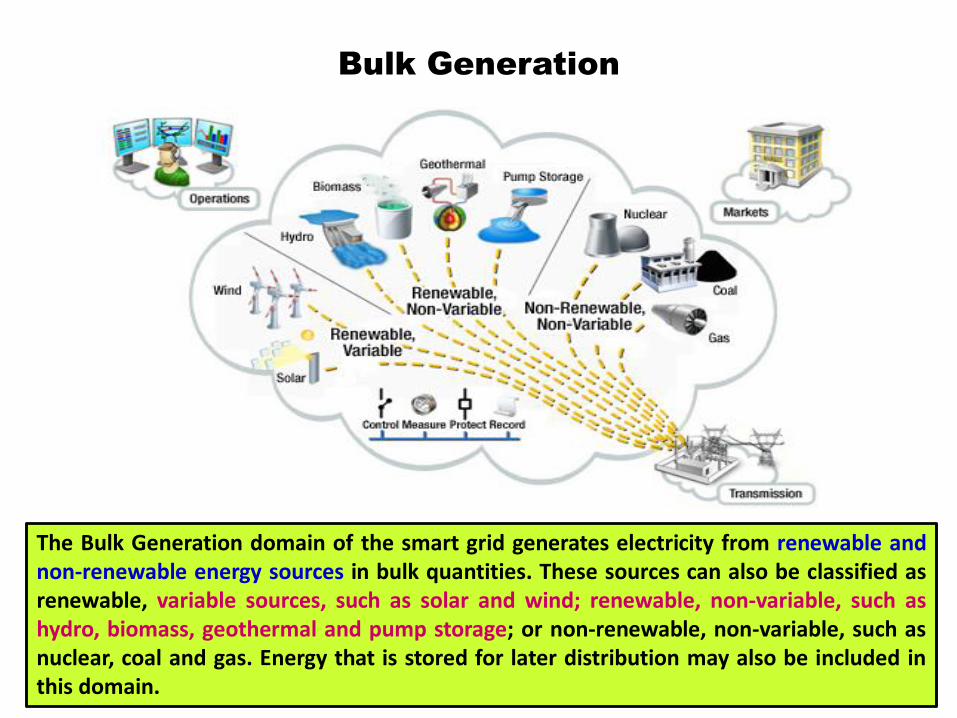
Bulk Generation
The Bulk Generation domain of the smart grid generates electricity from renewable andnon-renewable energy sources in bulk quantities. These sources can also be classified asrenewable, variable sources, such as solar and wind; renewable, non-variable, such ashydro, biomass, geothermal and pump storage; or non-renewable, non-variable, such asnuclear, coal and gas. Energy that is stored for later distribution may also be included inthis domain.

Transmission
(1)
Transmission is the bulk transfer of electrical power from generation sources todistribution through multiple substations. A transmission network is typically operated bya Regional Transmission Operator or Independent System Operator (RTO/ISO) whoseprimary responsibility is to maintain stability on the electric grid by balancing generation(supply) with load (demand) across the transmission network.
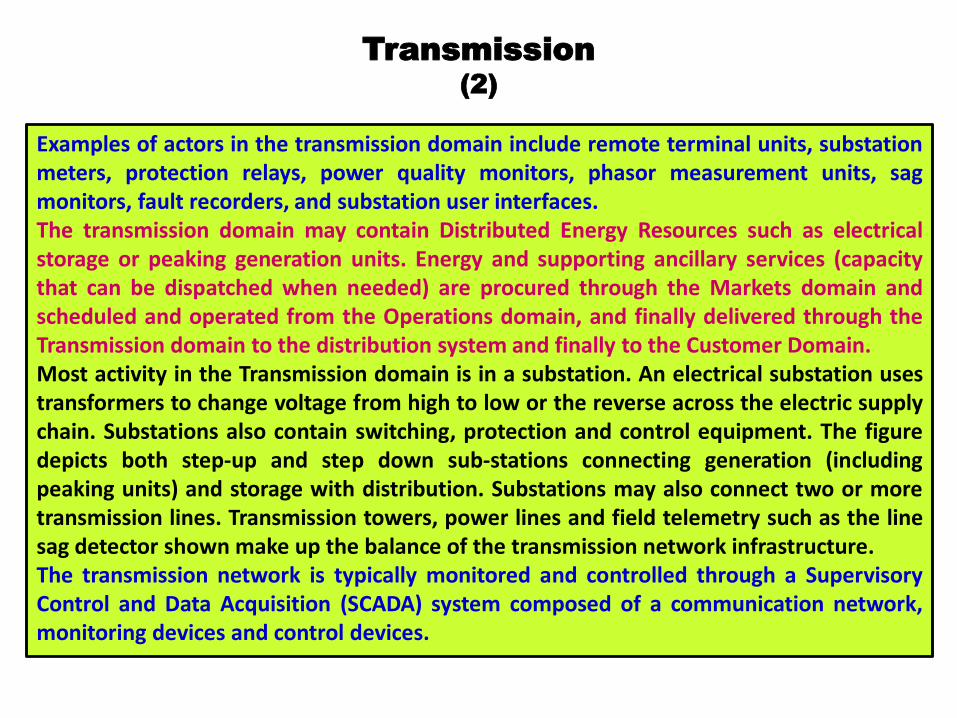
Transmission
(2)
Examples of actors in the transmission domain include remote terminal units, substationmeters, protection relays, power quality monitors, phasor measurement units, sagmonitors, fault recorders, and substation user interfaces.The transmission domain may contain Distributed Energy Resources such as electricalstorage or peaking generation units. Energy and supporting ancillary services (capacitythat can be dispatched when needed) are procured through the Markets domain andscheduled and operated from the Operations domain, and finally delivered through theTransmission domain to the distribution system and finally to the Customer Domain.Most activity in the Transmission domain is in a substation. An electrical substation usestransformers to change voltage from high to low or the reverse across the electric supplychain. Substations also contain switching, protection and control equipment. The figuredepicts both step-up and step down sub-stations connecting generation (includingpeaking units) and storage with distribution. Substations may also connect two or moretransmission lines. Transmission towers, power lines and field telemetry such as the linesag detector shown make up the balance of the transmission network infrastructure.The transmission network is typically monitored and controlled through a SupervisoryControl and Data Acquisition (SCADA) system composed of a communication network,monitoring devices and control devices.
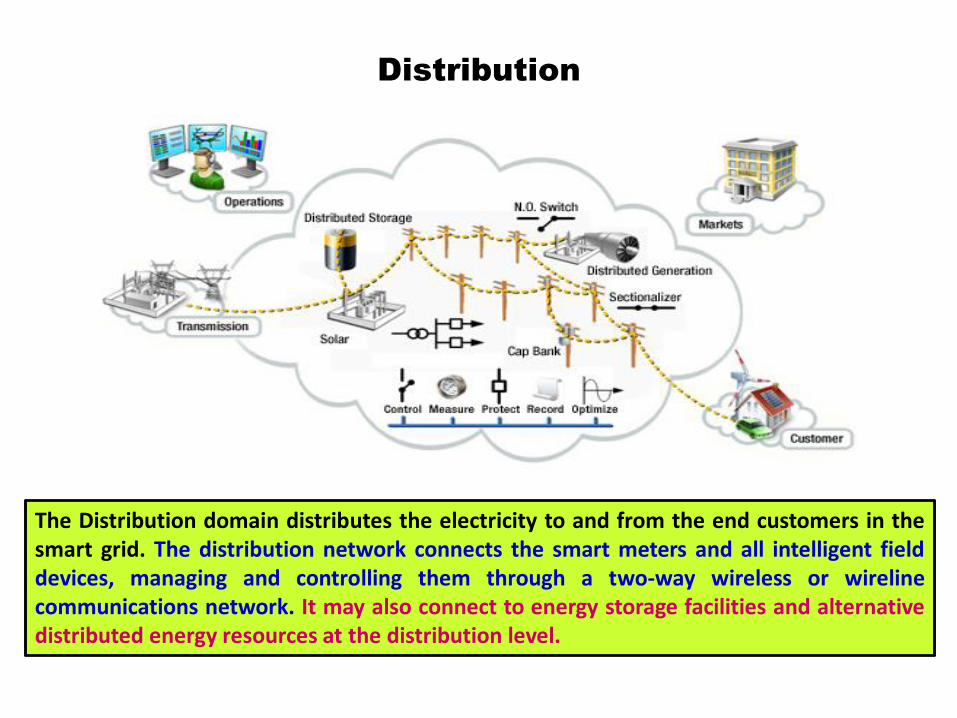
Distribution
The Distribution domain distributes the electricity to and from the end customers in thesmart grid. The distribution network connects the smart meters and all intelligent fielddevices, managing and controlling them through a two-way wireless or wirelinecommunications network. It may also connect to energy storage facilities and alternativedistributed energy resources at the distribution level.

Customer
The Customer domain of the smart grid is where the end-users of electricity (home,commercial/building and industrial) are connected to the electric distribution network throughthe smart meters. The smart meters control and manage the flow of electricity to and from thecustomers and provide energy information about energy usage and patterns. Each customerhas a discrete domain comprised of electricity premise and two-way communicationsnetworks. A customer domain may also generate, store and manage the use of energy, as wellas the connectivity with plug-in vehicles.

Operations
The Operations domain manages and controls the electricity flow of all other domains inthe smart grid. It uses a two-way communications network to connect to substations,customer premises networks and other intelligent field devices. It provides monitoring,reporting, controlling and supervision status and important process information anddecisions. Business intelligence processes gather data from the customer and network,and provide intelligence to support the decision-making.

Markets
The Markets domain operates and coordinates all the participants in electricity marketswithin the smart grid. It provides the market management, wholesaling, retailing andtrading of energy services. The Markets domain interfaces with all other domains andmakes sure they are coordinated in a competitive market environment. It also handlesenergy information clearinghouse operations and information exchange with third-partyservice providers. For example, roaming billing information for inter-utility plug-in-vehicles falls under this domain.

Service Provider
The Service Provider domain of the smart grid handles all third-party operations amongthe domains. These might include web portals that provide energy efficiencymanagement services to end-customers, data exchange between the customer and theutilities regarding energy management, and regarding the electricity supplied to homesand buildings. It may also manage other processes for the utilities, such as demandresponse programs, outage management and field services.

Smart Grid benefits can be categorized into 5 types:
1. Power reliability and power quality. The Smart Grid provides a reliable
power supply with fewer and briefer outages, “cleaner” power, and self-
healing power systems, through the use of digital information, automated
control, and autonomous systems.
2. Safety and cyber security benefits. The Smart Grid continuously monitors
itself to detect unsafe or insecure situations that could detract from its
high reliability and safe operation. Higher cyber security is built in to all
systems and operations including physical plant monitoring, cyber
security, and privacy protection of all users and customers.
3. Energy efficiency benefits. The Smart Grid is more efficient, providing
reduced total energy use, reduced peak demand, reduced energy losses,
and the ability to induce end-user use reduction instead of new
generation in power system operations.
4. Environmental and conservation benefits. The Smart Grid is “green”. It
helps reduce greenhouse gases (GHG) and other pollutants by reducing
generation from inefficient gasoline-powered vehicles with plug-in
electric vehicles.
5. Direct financial benefits. The Smart Grid offers direct economic benefits.
Operations costs are reduced or avoided. Customers have pricing choices
and access to energy information. Entrepreneurs accelerate technology
introduction into the generation, distribution, storage, and coordination
of energy.
Smart Grid Benefits
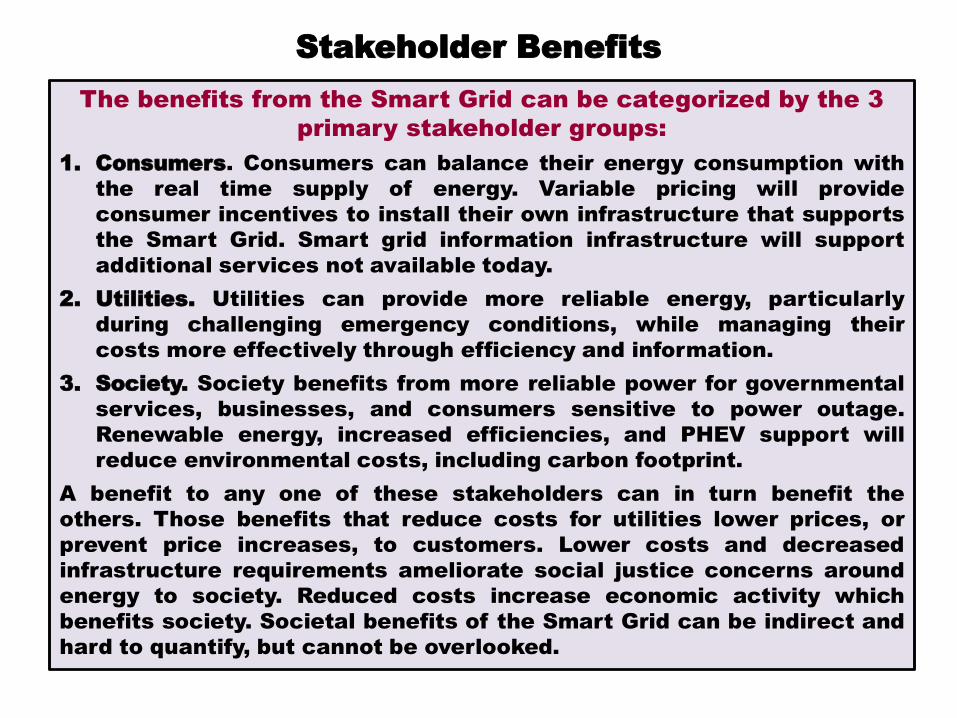
The benefits from the Smart Grid can be categorized by the 3
primary stakeholder groups:
1. Consumers. Consumers can balance their energy consumption with
the real time supply of energy. Variable pricing will provide
consumer incentives to install their own infrastructure that supports
the Smart Grid. Smart grid information infrastructure will support
additional services not available today.
2. Utilities. Utilities can provide more reliable energy, particularly
during challenging emergency conditions, while managing their
costs more effectively through efficiency and information.
3. Society. Society benefits from more reliable power for governmental
services, businesses, and consumers sensitive to power outage.
Renewable energy, increased efficiencies, and PHEV support will
reduce environmental costs, including carbon footprint.
A benefit to any one of these stakeholders can in turn benefit the
others. Those benefits that reduce costs for utilities lower prices, or
prevent price increases, to customers. Lower costs and decreased
infrastructure requirements ameliorate social justice concerns around
energy to society. Reduced costs increase economic activity which
benefits society. Societal benefits of the Smart Grid can be indirect and
hard to quantify, but cannot be overlooked.
Stakeholder Benefits
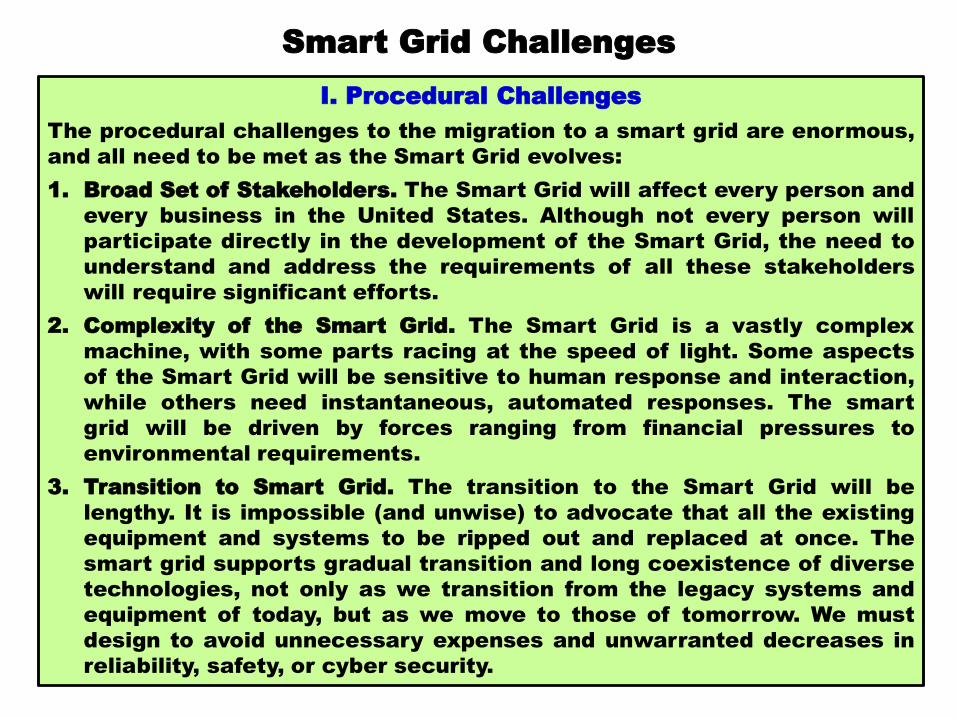
I. Procedural Challenges
The procedural challenges to the migration to a smart grid are enormous,
and all need to be met as the Smart Grid evolves:
1. Broad Set of Stakeholders. The Smart Grid will affect every person and
every business in the United States. Although not every person will
participate directly in the development of the Smart Grid, the need to
understand and address the requirements of all these stakeholders
will require significant efforts.
2. Complexity of the Smart Grid. The Smart Grid is a vastly complex
machine, with some parts racing at the speed of light. Some aspects
of the Smart Grid will be sensitive to human response and interaction,
while others need instantaneous, automated responses. The smart
grid will be driven by forces ranging from financial pressures to
environmental requirements.
3. Transition to Smart Grid. The transition to the Smart Grid will be
lengthy. It is impossible (and unwise) to advocate that all the existing
equipment and systems to be ripped out and replaced at once. The
smart grid supports gradual transition and long coexistence of diverse
technologies, not only as we transition from the legacy systems and
equipment of today, but as we move to those of tomorrow. We must
design to avoid unnecessary expenses and unwarranted decreases in
reliability, safety, or cyber security.
Smart Grid Challenges

4. Ensuring Cyber Security of Systems. Every aspect of the Smart Grid
must be secure. Cyber security technologies are not enough to achieve
secure operations without policies, on-going risk assessment, and
training. The development of these human-focused procedures takes
time—and needs to take time—to ensure that they are done correctly.
5. Consensus on Standards. Standards are built on the consensus of
many stakeholders over time; mandating technologies can appear to be
an adequate short cut. Consensus-based standards deliver better
results over.
6. Development and Support of Standards. The open process of
developing a standard benefits from the expertise and insights of a
broad constituency. The work is challenging and time consuming but
yields results more reflective of a broad group of stakeholders, rather
than the narrow interests of a particular stakeholder group. Ongoing
engagement by user groups and other organizations enables standards
to meet broader evolving needs beyond those of industry stakeholders.
Both activities are essential to the development of strong standards.
7. Research and Development. The smart grid is an evolving goal; we
cannot know all that the Smart Grid is or can do. The smart grid will
demand continuing R&D to assess the evolving benefits and costs, and
to anticipate the evolving requirements.

II. Technical Challenges to Achieving the Smart Grid
1. Smart equipment. Smart equipment refers to all field equipment which
is computer-based or microprocessor-based, including controllers,
remote terminal units (RTUs), intelligent electronic devices (IEDs). It
includes the actual power equipment, such as switches, capacitor
banks, or breakers. It also refers to the equipment inside homes,
buildings and industrial facilities. This embedded computing
equipment must be robust to handle future applications for many years
without being replaced.
2. Communication systems. Communication systems refer to the media
and to the developing communication protocols. These technologies
are in various stages of maturity. The smart grid must be robust
enough to accommodate new media as they emerge from the
communications industries and while preserving interoperable,
secured systems.
3. Data management. Data management refers to all aspects of
collecting, analyzing, storing, and providing data to users and
applications, including the issues of data identification, validation,
accuracy, updating, time-tagging, consistency across databases, etc.
Data management methods which work well for small amounts of data
often fail or become too burdensome for large amounts of data—and
distribution automation and customer information generate lots of
data. Data management is among the most time-consuming and
difficult task in many of the functions and must be addressed in a way
that will scale to immense size.

1. Cyber Security. Cyber security addresses the prevention of damage to,
unauthorized use of, exploitation of, and, if needed, the restoration of
electronic information and communications systems and services (and
the information contained therein) to ensure confidentiality, integrity,
and availability.
2. Information/data privacy. The protection and stewardship of privacy is
a significant concern in a widely interconnected system of systems
that is represented by the Smart Grid. Additionally, care must be taken
to ensure that access to information is not an all or nothing at all
choice since various stakeholders will have differing rights to
information from the Smart Grid.
3. Software applications. Software applications refer to programs,
algorithms, calculations, and data analysis. Applications range from
low level control algorithms to massive transaction processing.
Application requirements are becoming more sophisticated to solve
increasingly complex problems, are demanding ever more accurate
and timely data, and must deliver results more quickly and accurately.
Software engineering at this scale and rigor is still emerging as a
discipline. Software applications are at the core of every function and
node of the Smart Grid.
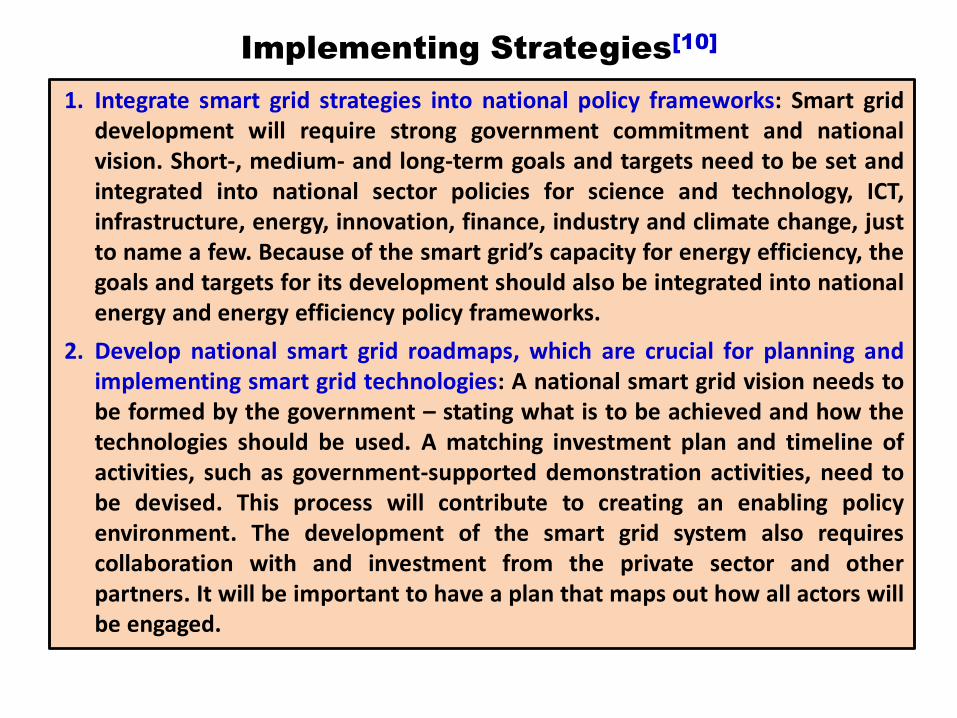
Implementing Strategies[10]
1. Integrate smart grid strategies into national policy frameworks: Smart griddevelopment will require strong government commitment and nationalvision. Short-, medium- and long-term goals and targets need to be set andintegrated into national sector policies for science and technology, ICT,infrastructure, energy, innovation, finance, industry and climate change, justto name a few. Because of the smart grid’s capacity for energy efficiency, thegoals and targets for its development should also be integrated into nationalenergy and energy efficiency policy frameworks.
2. Develop national smart grid roadmaps, which are crucial for planning andimplementing smart grid technologies: A national smart grid vision needs tobe formed by the government – stating what is to be achieved and how thetechnologies should be used. A matching investment plan and timeline ofactivities, such as government-supported demonstration activities, need tobe devised. This process will contribute to creating an enabling policyenvironment. The development of the smart grid system also requirescollaboration with and investment from the private sector and otherpartners. It will be important to have a plan that maps out how all actors willbe engaged.
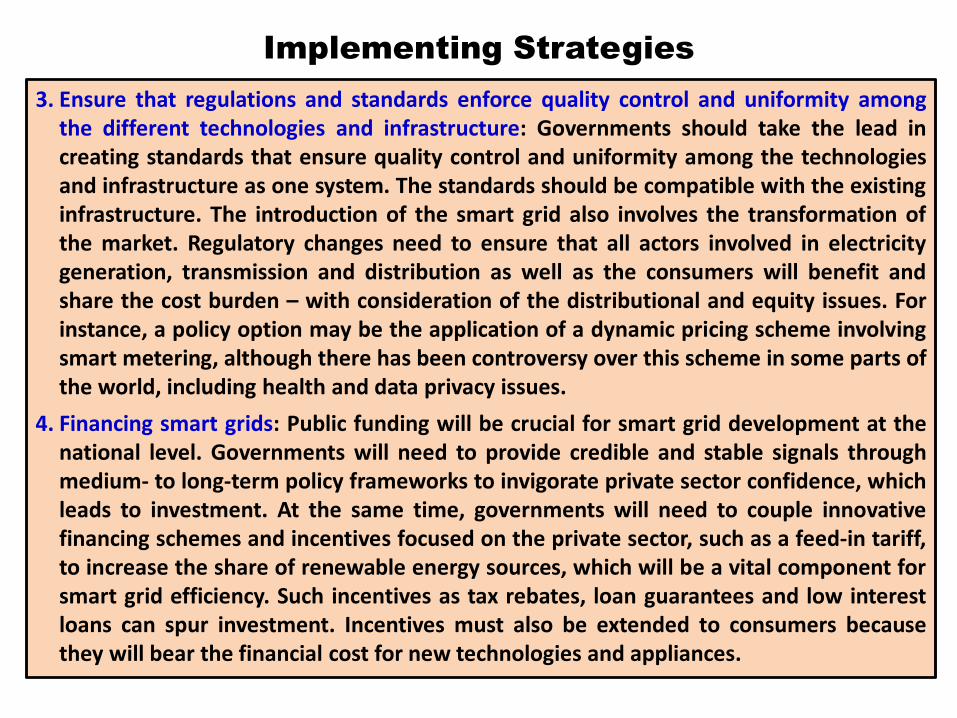
Implementing Strategies
3. Ensure that regulations and standards enforce quality control and uniformity amongthe different technologies and infrastructure: Governments should take the lead increating standards that ensure quality control and uniformity among the technologiesand infrastructure as one system. The standards should be compatible with the existinginfrastructure. The introduction of the smart grid also involves the transformation ofthe market. Regulatory changes need to ensure that all actors involved in electricitygeneration, transmission and distribution as well as the consumers will benefit andshare the cost burden – with consideration of the distributional and equity issues. Forinstance, a policy option may be the application of a dynamic pricing scheme involvingsmart metering, although there has been controversy over this scheme in some parts ofthe world, including health and data privacy issues.
4. Financing smart grids: Public funding will be crucial for smart grid development at thenational level. Governments will need to provide credible and stable signals throughmedium- to long-term policy frameworks to invigorate private sector confidence, whichleads to investment. At the same time, governments will need to couple innovativefinancing schemes and incentives focused on the private sector, such as a feed-in tariff,to increase the share of renewable energy sources, which will be a vital component forsmart grid efficiency. Such incentives as tax rebates, loan guarantees and low interestloans can spur investment. Incentives must also be extended to consumers becausethey will bear the financial cost for new technologies and appliances.
1. Sally Hunt and Graham Shuttleworth, Competition and Choice in Electricity, John Wiley &Sons, Inc, 1996.
2. Sally Hunt, Making Competition Work in electricity, John Wiley & Sons, Inc, 2002.3. Loi Lei Lai, City University, London, UK, Power System Restructuring and Deregulation –
Trading, Performance and Information Technology, John Wiley & Sons, Inc, 2001.4. T. E. Dy Liacco, “The Adaptive Reliability Control System,” IEEE Trans. On Power App. And
System, Vol. PAS-86, pp. 517-532, May 1987.5. Mark G. Lauby, Mark Ahlstrom, Daniel L. Brooks, et al., “Balancing Act. NERC’s Integration of
Variable Generation Task Force Plans for a Less Predictable Future”, IEEE Power & EnergyMagazine, Volume 9, Number 6, November/December 2011.
6. Mark Mc Granaghan, “Making Connection – Asset Management and the Smart Grid”, IEEEPower & Energy Magazine, Vol. 8, No. 6, November/December 2010.
7. Stanley H. Horowits, Arun G. Phadke, and Bruce A. Renz, “The Future of Power Transmissions– Technological Advances for Improved Performance”, IEEE Power & Energy Magazine, Vol. 8,No. 2, March/April 2010.
8. ASEAN RESP Phase II - Collaboration ACE AND HAPUA: a Joint Study ACE and HAPUA WorkingGroup No. 1.
9. EPRI, “Report to NIST on the Smart Grid Interoperability Standards Roadmap”, Contract No.SB1341-09-CN-0031—Deliverable 7, June 17, 2009.
10. Low Carbon Green Growth Roadmap for Asia and the Pacific, “Fact Sheet – Smart Grid”, 2014.11. Hardiv Harris Situmeang, Sekuriti Sistem Tenaga Listrik – Pengendalian Darurat, Seminar
Nasional Peran Teknik Kendali dalam Dunia Industri, Masyarakat Sistem Kendali Indonesia, 19Juli 1997.
References

Terima Kasih
To promote the sustainable supply and use of energy for the greatest
benefit of all people.
KOMITE NASIONAL INDONESIA