DISH Network Corporation - Kerrisdale Capital€¦ · Meanwhile, DISH’s core pay-TV business is...
33
In our previous reports on Globalstar and Straight Path, we challenged the market’s complacent belief that spectrum prices can only go up and that wireless carriers have a desperate, boundless need for ever more megahertz. The most influential promoter of this bogus notion – with tens of billions of dollars riding on its veracity – is DISH Network. Since 2008, DISH has accumulated a massive portfolio of spectrum licenses and convinced investors that, any day now, it would unveil a brilliant strategy to extract value from these assets, even as evidence mounted that no major counterparty was interested in paying DISH’s price. Now, with an imminent new spectrum auction promising to drastically reduce benchmark price expectations, DISH is in the weakest position it’s been in for years: sitting on a warehouse full of overpriced inventory, devoid of interested customers, and – with regulatory deadlines looming – running out of time. Meanwhile, DISH’s core pay-TV business is likewise entering dire straits, with declining subscribers, strengthened competitors, and obvious secular problems only beginning to manifest. Overall, we believe that the fair value of DISH’s equity is 58% lower than the current stock price – and, in a reasonable downside scenario, more than 80% lower. Scrappy and entrepreneurial, DISH has always prided itself on its willingness to take outsized risks; as its founder, chairman, and CEO Charlie Ergen – a former professional gambler – said in 2005, “I like to bet a few hands and bet them big.” After achieving great success building the second-largest satellite-TV operator in the US, DISH has watched its earnings flatline for a decade, a victim of consumers’ growing array of entertainment choices and the rising importance of broadband internet connections, which cable and phone companies can offer but DISH largely cannot. Casting about for a way out of this strategic morass, DISH hit upon wireless spectrum. Initially focused on the concept of a mobile TV service, DISH’s spectrum ambitions have become grander yet vaguer over time, with empty talk of “multiple options” taking the place of a concrete plan. But as DISH has continued to bet big on this single hand – culminating in its widely criticized hijacking of the previous AWS-3 spectrum auction, which earned it the ire of the FCC, Congress, and the wireless industry – it hasn’t noticed that the other players have stepped away from the game. Already armed with large reserves of un- and under-utilized spectrum, combined with better options for cheap capacity enhancement in congested areas, major carriers like AT&T and Verizon now gain less and less from incremental bandwidth – a simple case of diminishing marginal returns. DISH may put on a show of confidence, but carriers are calling its bluff, and DISH shareholders will learn that sometimes, when you bet big, you lose. May 2016 DISH Network Corporation (DISH) Calling Charlie’s Bluff Disclaimer: As of the publication date of this report, Kerrisdale Capital Management, LLC and its affiliates (collectively, “Kerrisdale”), have short positions in and own option interests on the stock of DISH Network Corporation (the “Company”). Other research contributors, and others with whom we have shared our research (collectively with Kerrisdale, the “Authors”) likewise have short positions in, and/or own option interests on, the stock of the Company. The Authors stand to realize gains in the event that the price of the stock decreases. Following publication, the Authors may transact in the securities of the Company. The Authors have obtained all information herein from sources they believe to be accurate and reliable. However, such information is presented “as is,” without warranty of any kind – whether express or implied – and without any representation as to the results obtained from its use. All expressions of opinion are subject to change without notice, and the Authors do not undertake to update this report or any information contained herein. Please read our full legal disclaimer at the end of this report.
Transcript of DISH Network Corporation - Kerrisdale Capital€¦ · Meanwhile, DISH’s core pay-TV business is...

In our previous reports on Globalstar and Straight Path, we challenged the market’s complacent
belief that spectrum prices can only go up and that wireless carriers have a desperate,
boundless need for ever more megahertz. The most influential promoter of this bogus notion –
with tens of billions of dollars riding on its veracity – is DISH Network. Since 2008, DISH has
accumulated a massive portfolio of spectrum licenses and convinced investors that, any day
now, it would unveil a brilliant strategy to extract value from these assets, even as evidence
mounted that no major counterparty was interested in paying DISH’s price.
Now, with an imminent new spectrum auction promising to drastically reduce benchmark price
expectations, DISH is in the weakest position it’s been in for years: sitting on a warehouse full of
overpriced inventory, devoid of interested customers, and – with regulatory deadlines looming –
running out of time. Meanwhile, DISH’s core pay-TV business is likewise entering dire straits,
with declining subscribers, strengthened competitors, and obvious secular problems only
beginning to manifest. Overall, we believe that the fair value of DISH’s equity is 58% lower than
the current stock price – and, in a reasonable downside scenario, more than 80% lower.
Scrappy and entrepreneurial, DISH has always prided itself on its willingness to take outsized
risks; as its founder, chairman, and CEO Charlie Ergen – a former professional gambler – said
in 2005, “I like to bet a few hands and bet them big.” After achieving great success building the
second-largest satellite-TV operator in the US, DISH has watched its earnings flatline for a
decade, a victim of consumers’ growing array of entertainment choices and the rising
importance of broadband internet connections, which cable and phone companies can offer but
DISH largely cannot. Casting about for a way out of this strategic morass, DISH hit upon
wireless spectrum.
Initially focused on the concept of a mobile TV service, DISH’s spectrum ambitions have
become grander yet vaguer over time, with empty talk of “multiple options” taking the place of a
concrete plan. But as DISH has continued to bet big on this single hand – culminating in its
widely criticized hijacking of the previous AWS-3 spectrum auction, which earned it the ire of the
FCC, Congress, and the wireless industry – it hasn’t noticed that the other players have stepped
away from the game. Already armed with large reserves of un- and under-utilized spectrum,
combined with better options for cheap capacity enhancement in congested areas, major
carriers like AT&T and Verizon now gain less and less from incremental bandwidth – a simple
case of diminishing marginal returns. DISH may put on a show of confidence, but carriers are
calling its bluff, and DISH shareholders will learn that sometimes, when you bet big, you lose.
May 2016
DISH Network Corporation (DISH) Calling Charlie’s Bluff
Disclaimer: As of the publication date of this report, Kerrisdale Capital Management, LLC and its affiliates (collectively, “Kerrisdale”), have short positions in and own option interests on the stock of DISH Network Corporation (the “Company”). Other research contributors, and others with whom we have shared our research (collectively with Kerrisdale, the “Authors”) likewise have short positions in, and/or own option interests on, the stock of the Company. The Authors stand to realize gains in the event that the price of the stock decreases. Following publication, the Authors may transact in the securities of the Company. The Authors have obtained all information herein from sources they believe to be accurate and reliable. However, such information is presented “as is,” without warranty of any kind – whether express or implied – and without any representation as to the results obtained from its use. All expressions of opinion are subject to change without notice, and the Authors do not undertake to update this report or any information contained herein. Please read our full legal disclaimer at the end of this report.

Kerrisdale Capital Management, LLC | 1212 Avenue of the Americas, 3rd Floor | New York, NY 10036 | Tel: 212.792.7999 | Fax: 212.531.6153 2
Table of Contents
I. INVESTMENT HIGHLIGHTS ........................................................................................................ 3
II. COMPANY OVERVIEW ................................................................................................................... 8
III. CARRIERS ALREADY HAVE PLENTY OF SPECTRUM ........................................................... 12
IV. SPECTRUM PRICES FACE A MAJOR RESET DOWNWARD – ESPECIALLY FOR DISH ..... 19
V. TIME IS NOT ON DISH’S SIDE .................................................................................................... 26
VI. DISH’S CORE TV BUSINESS IS WEAK ........................................................................................ 28
VII. CONCLUSION ................................................................................................................................ 31
FULL LEGAL DISCLAIMER ................................................................................................................... 32

Kerrisdale Capital Management, LLC | 1212 Avenue of the Americas, 3rd Floor | New York, NY 10036 | Tel: 212.792.7999 | Fax: 212.531.6153 3
I. Investment Highlights
DISH Network: Consensus Valuation vs. Kerrisdale View
Source: company filings, sell-side reports, Kerrisdale analysis
*Long-term debt and capital lease obligations net of cash and marketable investment
securities.
†Incorporates (1) cost of AWS-3 auction penalty based on difference between DISH's
original bids and our estimate of the fair value of the spectrum in question, (2)
estimated minimum cost of meeting the AWS-4 performance requirements by March
7, 2020, and (3) present value of designated-entity put price.
Carriers have plenty of spectrum already. DISH bulls generally buy into the notion that
spectrum is extraordinarily scarce and cellular data consumption is relentlessly skyrocketing.
However, even if these beliefs were true, it would not necessarily imply that spectrum prices
should be high and rising. After all, the revenue generated by using that spectrum to provide
wireless service grew relatively slowly for years, declined in 2014 for the first time ever,1 and
declined again in 2015.2 Fierce competition has kept a lid on what users pay, while better
devices have increased the scope of the demands they place on networks. Thus it might take
twice as much spectrum to satisfy a $60-per-month customer today as it did a few years ago –
implying that that the profitability of a fixed unit of spectrum is falling, not rising. It takes more
input to produce the same economic output, so the input is worth less.
Moreover, the scarcity of spectrum is vastly overstated. Consider, for instance, Verizon – the
largest carrier in the US and the most frequently rumored counterparty for DISH. As of the first
quarter of 2016, the vast majority of Verizon’s data traffic (92%3) ran over its LTE network. But
though Verizon holds, on average, 114 MHz of spectrum nationwide, its LTE network uses only
1 Source: CTIA 2014 Annual Wireless Industry Survey, FierceWireless. 2 Source: Kerrisdale analysis of Verizon, AT&T, T-Mobile, and Sprint wireless-segment service revenues. 3 Source: Verizon 2016 Q1 earnings release.
Kerrisdale
Market
consensus Base Adverse
Pay-TV enterprise value 15,000$ 15,000$ 15,000$
Less: net debt* 11,381 11,381 11,381
Pay-TV equity value 3,619$ 3,619$ 3,619$
Spectrum value† 18,497 5,646 118
Total equity fair value 22,117$ 9,266$ 3,737$
Equity FV per share 48$ 20$ 8$
Equity downside (58)% (83)%

Kerrisdale Capital Management, LLC | 1212 Avenue of the Americas, 3rd Floor | New York, NY 10036 | Tel: 212.792.7999 | Fax: 212.531.6153 4
half that.4 The rest of the spectrum is either totally unused (newly purchased AWS-3 spectrum)
or still largely devoted to inefficient legacy technologies like CDMA. Over time – indeed, more
quickly than previously expected given the rapid uptake of LTE-capable devices – this under-
utilized spectrum will be deployed for LTE, effectively doubling the amount of traffic Verizon can
handle. A similar story is unfolding for the other carriers as well. As T-Mobile’s chief technology
officer put it,5
But probably, the biggest thing to think about is – [let me] do rough math for you. Half
our network – just over half our network today is LTE, in terms of the spectrum that we
own. So half our spectrum is on the LTE technology. And that covers almost 90% of our
data.…So when you look at the other half of the spectrum and what it's doing, it's not
doing that much.
Meanwhile, AT&T, for its part, is beginning to roll out 40 MHz of virgin LTE spectrum nationwide
– approximately doubling its capacity even before taking into account its large reserve of under-
utilized spectrum, which it’s also gradually shifting to LTE (a process sometimes called
“refarming”).
Verizon & AT&T’s Spectrum Holdings: Large Stores of Untapped Potential
Source: FCC 18th Mobile Wireless Competition
Report, Kerrisdale analysis
But more spectrum is certainly not the only way for mobile operators to increase capacity. New
generations of technology are also more spectrally efficient – that is, they can transmit greater
4 See e.g. Verizon’s comments at the UBS Annual Global Media and Communication Conference,
December 7, 2015: “And if you look at it today, we only use 40% of our spectrum for LTE.” 5 Source: Capital IQ transcript of T-Mobile 2016 Q1 earnings call, April 26, 2016.
Verizon AT&T
(Pop.-weighted average bandwidth in MHz )
Major LTE bands in use:
700 MHz 22 22
AWS-1 35 15
Subtotal 57 37
Un/under-utilized bands:
700 MHz (D/E blocks) - 7
Cellular 25 23
PCS 21 38
WCS - 20
AWS-3 11 20
Subtotal 57 109
As % of LTE bands 101% 296%
Kerrisdale Capital Management, LLC | 1212 Avenue of the Americas, 3rd Floor | New York, NY 10036 | Tel: 212.792.7999 | Fax: 212.531.6153 5
quantities of data using the same exact bandwidth. (One approach, called higher-order MIMO,
is to increase the number of coordinated antennas serving a given cell.) In a report prepared for
Ofcom, the British equivalent of the FCC, the telecom consultancy Analysys Mason estimated
that, thanks to better technology, LTE spectral efficiency would approximately double over the
next five years, thereby doubling network capacity without requiring any new spectrum.
All this fails to even consider the most important way that networks have added capacity in the
past: more cell sites. Indeed, American Tower, one of the nation’s largest tower companies, has
estimated that, over the last few years, only 20-30% of the gains in cellular capacity have come
from more spectrum and higher spectral efficiency, while all the rest has come from new cell
sites and more radio equipment.6 While putting up new, full-fledged towers is difficult in some
locations, carriers today can be surgical, deploying sites only where needed to relieve local
congestion and making greater use of cheap small cells. Free and low-cost spectrum in the
5GHz and 3.5GHz bands will also play a role in addressing traffic hot spots – without requiring
conventional, exclusively licensed frequencies.
Spectrum bulls might contend that even quintupling effective capacity won’t satisfy consumer
demand, but they overestimate just how close today’s networks are to their limits. According to
the market-research firm NPD Group, the average smartphone user consumes about 3
gigabytes per month (though the distribution is highly skewed – median usage is only ~1
gigabyte). Three gigabytes per month equates to just 0.009 megabits per second – or,
assuming that 10% of a day’s usage occurs during the peak hour, just 0.02 megabits per
second at peak. By contrast, average LTE throughput in the US is approximately 10 megabits
per second, highlighting the large gap – on average – between what users actually do with their
devices and what their networks are truly capable of. To be sure, data consumption has grown
over time, but some evidence suggests that this growth is already plateauing: Verizon, for
example, has seen traffic growth decelerate sharply over the past several quarters (from 75% to
40%), while NDP Group’s detailed analysis (based on tracking individual users’ behavior
patterns) suggests that average consumption has been flat in recent months – a far cry from the
facile assumption of an endless hockey stick.
Against this backdrop of underutilized spectrum, growing efficiency, improving infrastructure,
and potentially plateauing demand, it’s no wonder that wireless-industry insiders regard
sensationalistic claims that carriers are on the verge of “running out of spectrum” as utter
nonsense. But this dynamic puts DISH in a far worse bargaining position than its supporters
appreciate. While they believe that DISH’s spectrum portfolio is a near-term must-have for
bandwidth-starved carriers, the reality is that carriers are well-equipped to simply wait DISH out
and let it squirm.
Spectrum prices should reset dramatically lower. Much has been written about DISH’s
cunning, disruptive bidding in the AWS-3 spectrum auction that ended in 2015; FCC Chairman
Tom Wheeler reportedly said from the beginning that the company’s actions “didn’t smell right.”
6 Source: American Tower Q3 2015 earnings call.

Kerrisdale Capital Management, LLC | 1212 Avenue of the Americas, 3rd Floor | New York, NY 10036 | Tel: 212.792.7999 | Fax: 212.531.6153 6
Bidding against itself by way of three separate legal entities, DISH successfully drove prices far
above expectations, and investors dutifully applied those distorted prices to the rest of DISH’s
portfolio.
However, as the 600MHz auction, beginning at the end of the month, approaches, DISH faces a
very different situation. Already highly levered, it lacks the financial firepower to have a large
impact on prices, and, after getting into hot water for its complex bidding by proxy, it’s unlikely to
try a similar approach again. Meanwhile, carriers’ balance sheets also show the strain of the
previous auction, and Sprint – the fourth-largest carrier and arguably the one most in need of
low-band spectrum like the 600MHz band – is not even participating. As a result, the 30 MHz of
spectrum reserved exclusively for bidding by carriers with modest low-band holdings will likely
go in large part to T-Mobile, leaving the rest of the auctioned-off spectrum for AT&T and
Verizon. While the total amount of available spectrum is uncertain (subject to participation by TV
broadcasters opting to cash out), AT&T has expressed interest in only 20 MHz. If Verizon seeks
a similar quantity, then that amounts to around 60 MHz of baseline spectrum demand among
the three major carriers – compared to expected supply of 100 MHz from the broadcasters.
Thus competition is likely to be subdued, with enough wiggle room to accommodate new
entrants as well. No one has a good reason to bid aggressively.7 Therefore we expect the
average auction clearing price to end up close to the reserve level of $1.25 per MHz-pop. Here
we assume $1.50 – a 45% decline from the inflated AWS-3 results.8
This type of outcome has rapidly become the consensus expectation. Recently Bloomberg
reported that the 600MHz auction “may yield a lot less than anticipated,” summarizing analysts’
views that carriers “simply don’t have the war chests to bid up” for bandwidth. Wireless Week
echoed these comments. But few have fully considered the ugly consequences for DISH. Not
only is the 600MHz auction going to reset all spectrum prices downward; the fallout is also likely
to cost DISH billions of dollars in regulatory penalties.
Why? If 600MHz spectrum goes for ~$1.50/MHz-pop, then DISH’s most commercially viable
holdings – the AWS-3 licenses purchased in the previous auction – must be worth far less,
given their ~3x higher frequency and attendant weaker propagation. While the superior
coverage provided by low-band spectrum has become less important over time, especially for
carriers like Verizon and AT&T who have already achieved strong coverage, the fact remains
that low-band is still more valuable, and recent precedent transactions point to 2-3x higher
prices for low-band relative to mid-band (like AWS). But, after partially defaulting on auction-
related payments and walking away from many spectrum licenses for which it was the winning
bidder, DISH is now on the hook to the FCC for the difference between the pumped-up prices it
bid and the proceeds of a future repeat auction. If average prices step down from an inflated
~$2.70 to a more reasonable ~$0.75, DISH’s make-whole liability will balloon.
7 Of course, DISH might choose to bid irrationally, perhaps hoping to drop out at the last minute and thus
conserve its cash, but in so doing it would just be digging itself a deeper hole. 8 Based on paired spectrum.
Kerrisdale Capital Management, LLC | 1212 Avenue of the Americas, 3rd Floor | New York, NY 10036 | Tel: 212.792.7999 | Fax: 212.531.6153 7
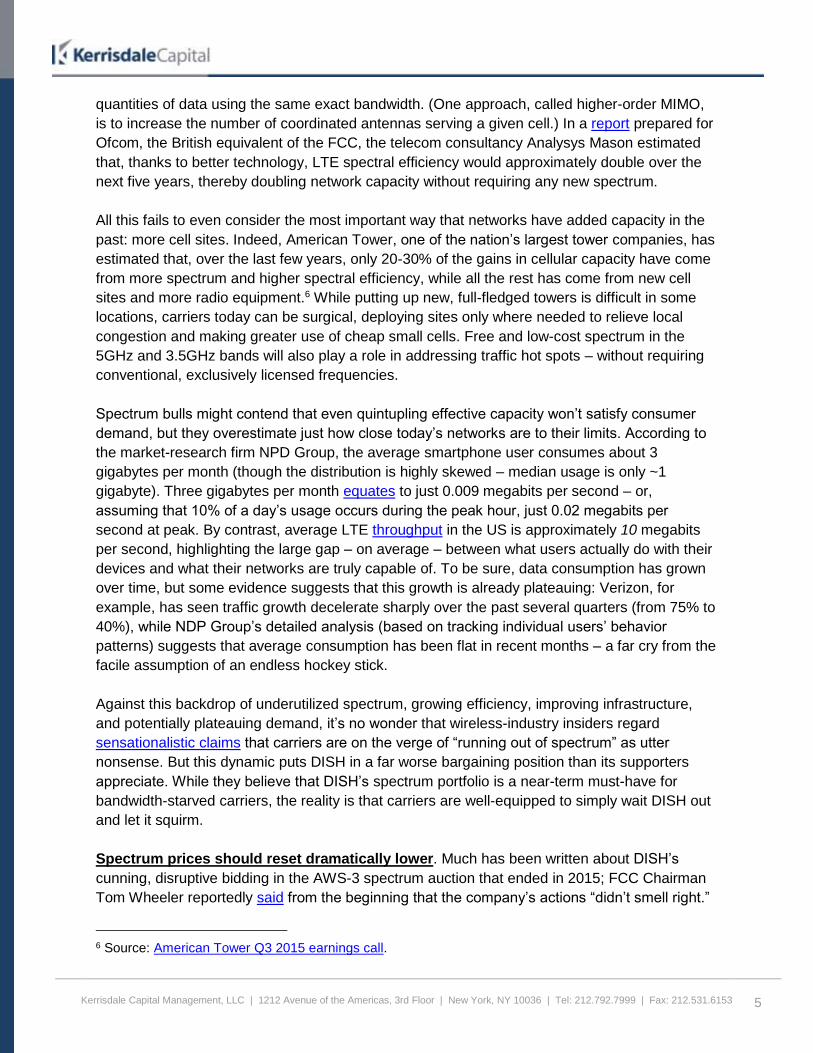
Meanwhile, DISH’s more “boutique” spectrum holdings have their own problems. Not used by
any carrier, they lack an ecosystem of handsets and equipment to give them value – something
that likely only Verizon or AT&T have the clout to provide. But when the carrier holds the cards,
the carrier extracts most of the value, resulting in very low prices for unusual bands (like the
~$0.30/MHz-pop that AT&T paid for NextWave’s WCS spectrum and Sprint paid for Clearwire’s
EBS/BRS spectrum). To varying degrees, DISH’s AWS-4, AWS-3 unpaired uplink, H Block, and
700MHz E Block holdings all suffer from this crucial problem. Even if DISH can ultimately entice
a carrier or carriers to buy or lease all of its spectrum, we estimate that its intrinsic value is a
small fraction of what the market currently believes it is.
Breakdown of DISH’s Spectrum Portfolio by Band and Kerrisdale-Estimated Value
Source: company filings, Kerrisdale analysis
Time is not on DISH’s side. Making matters worse, DISH can’t simply wait around for carriers
to some day exhaust their existing spectral resources; it faces strict build-out deadlines imposed
by the FCC. For instance, within four years DISH needs to demonstrate AWS-4 signal coverage
and service for 70% of the US population; otherwise, it automatically loses its licenses.9 With no
network of cell sites to provide such service, and with the major carriers busy for the
foreseeable future deploying the spectrum they already have (and will win in the 600MHz
auction), DISH does not have the luxury of playing “hard to get.” It needs a partner as soon as
possible – a fact that every plausible partner is well aware of and won’t hesitate to use against
DISH.
Indeed, while we do expect a deal to ultimately materialize, investors must take seriously the
risk that DISH can’t find a partner in time and simply loses its non-standard spectrum. After all,
while all the carriers will be deploying AWS-3, no one but DISH has any stake in the success of,
say, the H Block, and altering existing plans to incorporate such a band takes time, money, and
9 See AWS-4 Report & Order, p. 72 (“Where a licensee fails to meet the
AWS-4 Final Build-out Requirement in any EA [economic area], its authorization for each EA in which it
fails to meet the requirement shall terminate automatically without Commission action”).
MHz-
pops (B)
Price
($/MHz-
pop)
Total
value
($B)
AWS-3 paired 2.6 0.83$ 2.2$
Upper AWS-4 6.3 0.64 4.0
AWS-3 unpaired, lower
AWS-4, lower H Block11.8 0.40 4.7
Upper H Block 1.6 - -
700MHz E Block 1.4 0.40 0.6
Total 23.7 0.48$ 11.5$
Less: AWS-3 penalty/put 2.5
Less: AWS-4 build cost 3.2
Net spectrum value 5.8$

Kerrisdale Capital Management, LLC | 1212 Avenue of the Americas, 3rd Floor | New York, NY 10036 | Tel: 212.792.7999 | Fax: 212.531.6153 8
effort. Why not just wait for DISH to lose the spectrum, then pick it up as needed down the road
when the FCC puts it back on the market?
DISH’s core TV business also faces grave threats. For years, satellite TV has been a
reliable, if stagnant, source of cash for DISH, funding its great spectrum adventure. But with
over-the-top entertainment ascendant and satellite-market leader DirecTV gaining strength from
its merger with AT&T, DISH is beginning to shed core subscribers. As content costs continue to
rise and DISH’s already lean structure makes it difficult to cut expenses, we estimate that a
further 10% subscriber loss could reduce EBITDA by 26%, potentially jeopardizing the solvency
of DISH’s satellite subsidiary. While some pin their hopes on DISH’s own over-the-top offering,
Sling TV, early indications suggest that the product is riddled with bugs and already losing
steam, leading to recent headlines like “Is Sling TV a Failure?” In short, DISH’s weak TV
business can’t make up for its disastrous spectrum gamble.
II. Company Overview
DISH Network: Capitalization and Financial Results
Source: Capital IQ, company filings, Kerrisdale analysis
1. Consensus estimates per Capital IQ.
2. EBITDA as defined by Capital IQ.
2. Cellular spectrum only (excludes DBS and MVDDS).
In business school they tell you not to put all your eggs in one basket. But I say put every damn
egg you’ve got into it.
—Charlie Ergen10
Founded in 1980, DISH Network is the second-largest satellite-TV operator in the US, with 13.9
million subscribers paying ~$88 a month. Unlike Comcast, Verizon, or AT&T, which can offer
10 Quoted in Stephen Keating, Cutthroat: High Stakes and Killer Moves on the Electronic Frontier
(Boulder: Johnson Books, 1999).
(in millions except per-share data and ratios )
Share price 47.54$
Diluted shares 465 2013 2014 2015 20161
Market cap 22,117$ Revenue 13,905$ 14,643$ 15,069$ 15,250$
Net debt: EBITDA2
2,851 2,908 2,980 3,061
Long-term debt 12,091$ Diluted EPS 1.76$ 2.04$ 1.61$ 2.84$
Capital leases 160
Total debt 12,251$ Spectrum at cost3
2,661$ 4,332$ 14,223$
Cash & cash equiv's (709) Net debt 3,892 5,228 12,145
Marketable investments (162) To EBITDA 1.4x 1.8x 4.1x
Net debt 11,381$
Total enterprise value 33,497$ TV subscribers 14.1 14.0 13.9
Capitalization Financial results
Kerrisdale Capital Management, LLC | 1212 Avenue of the Americas, 3rd Floor | New York, NY 10036 | Tel: 212.792.7999 | Fax: 212.531.6153 9
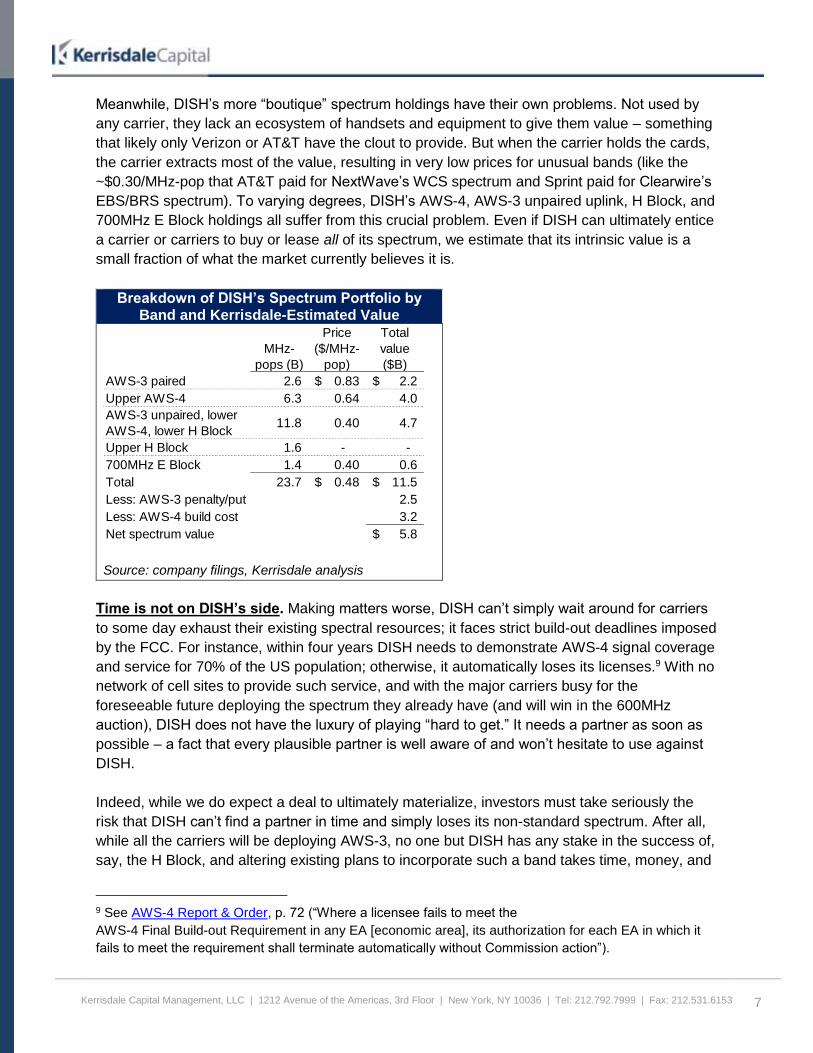
integrated bundles of TV and other higher-margin services like broadband internet access,
DISH is largely limited to TV. (Its expensive satellite-delivered broadband service is a niche
business aimed at those with no better alternatives; as the company itself says, “If you live in an
area where cable or fiber Internet is already available, then satellite Internet service may not be
your best option.”) In recent years, it has become clear that satellite TV is a mature business,
with no meaningful growth in subscribers or earnings power; the modest revenue growth that
DISH has achieved via price hikes has been overwhelmed by margin contraction.
DISH Network: A Long History of Financial Stagnation
Source: company filings, Kerrisdale analysis
Note: EBITDA as defined by Capital IQ. (DISH-defined EBITDA includes non-operating items.)
In light of this performance – and the ongoing competitive pressures discussed further below –
it’s no wonder that even bullish sell-side firms (including Deutsche Bank and Jefferies) value
DISH’s pay-TV business at modest EV/EBITDA multiples of 4-5x. The fixed-income market has
also become more pessimistic about the health of the business (which DISH has heavily
borrowed against to fund its spectrum purchases): in recent months, the CDS spreads for
DISH’s satellite subsidiary have blown out, signaling deteriorating credit.
(in millions except ARPU)
2007 2008 2009 2010 2011 2012 2013 2014 2015
CAGR,
2007-15
Pay-TV ARPU 65.83$ 69.27$ 70.04$ 73.32$ 76.43$ 76.98$ 80.37$ 83.77$ 86.79$ 4%
Pay-TV subs 13.8 13.7 14.1 14.1 14.0 14.1 14.1 14.0 13.9 0%
EBITDA 2,959$ 3,056$ 2,688$ 3,150$ 3,532$ 2,971$ 2,851$ 2,908$ 2,980$ 0%
Free cash flow 1,172 1,058 1,157 924 1,859 1,058 1,056 1,192 1,322 2%

Kerrisdale Capital Management, LLC | 1212 Avenue of the Americas, 3rd Floor | New York, NY 10036 | Tel: 212.792.7999 | Fax: 212.531.6153 10
DISH DBS Corp.: 3-Yr CDS Spread (in Basis Points), 2014 to Present
Source: Bloomberg
DISH management, well aware that the days of rapid satellite-TV growth were over, made its
first major terrestrial spectrum purchase in 2008, spending $712 million at auction on 700MHz E
Block licenses across much of the country. Qualcomm used similar spectrum to offer a mobile
TV service called MediaFLO (a flop that it abandoned in 2010), and DISH originally indicated
that its own “mobile video product” was on its way.11 Instead, the spectrum has lain fallow for
years. In 2012 DISH went on to purchase the assets of the bankrupt satellite firms TerreStar
and DBSD and gained FCC approval to convert their nationwide spectrum from satellite to
terrestrial usage; this spectrum is now known as the AWS-4 band. In 2013, DISH tried to
purchase both Sprint and Clearwire but failed – perhaps a lucky break, since Sprint, having itself
absorbed Clearwire, now trades for 50% less than what DISH was willing to pay three years
ago. In 2014, DISH bought up a chunk of mid-band spectrum called the H Block in an FCC
auction (at exactly the minimum price it guaranteed it would pay in exchange for certain
regulatory favors – thus implying that the undistorted intrinsic value was less than it paid).
DISH’s first three cellular spectrum purchases – 700MHz E Block, AWS-4, and H Block – had at
least the appearance of value investments: non-standard “fixer-upper” bands purchased at
optically low prices. For all DISH’s posturing about possibly entering the wireless market itself
as a fifth major carrier, its far more attractive option has long been to sell or lease its spectrum
to the incumbents – cashing in, or so the theory went, on the difference between its “bargain”
purchase prices and the prevailing market level. In 2014, however, according to the Financial
Times, DISH discovered that it didn’t see eye to eye with its would-be counterparties:
11 Source: Bloomberg transcript of DISH 2Q 2009 earnings call.

Kerrisdale Capital Management, LLC | 1212 Avenue of the Americas, 3rd Floor | New York, NY 10036 | Tel: 212.792.7999 | Fax: 212.531.6153 11
Bankers say Verizon tried to buy spectrum from Mr Ergen last year, but balked at the
$1.50 per MHz/pop he was asking for. “They thought it was ridiculously expensive and
let it get away from them…” says a person familiar with the deal. Nor is there any
certainty that the regulator [the FCC] would let Dish sell to Verizon.12
Having already sunk more than $4 billion into spectrum, only to be told that its price
expectations were “ridiculously” excessive, DISH shifted its investment style from value to
momentum. In the AWS-3 auction, it chased rising spectrum prices to unprecedented new
heights, ultimately spending another $10 billion while straining the carriers’ capital budgets.
DISH’s approach mirrored the strategy it used some 20 years earlier in the auction of a
broadcast-satellite orbital slot, for which DISH, MCI, and TCI (John Malone’s cable company)
were the only bidders. There, too, the price rapidly rose to seemingly irrational levels, but Ergen
kept bidding higher. He later explained:
If we got the slot, we had a satellite under construction that we could have used it for. If
we didn’t, we raised the price of poker for somebody else and made our spectrum that
much more valuable.13
In the AWS-3 auction, like the earlier slot auction, DISH’s bidding did indeed “raise the price of
poker” for its rivals, but the other elements of the analogy didn’t apply. DISH lacks the
equivalent of “a satellite under construction”: it has no wireless network to actually allow it to use
all the spectrum it has accumulated and thus has no choice but to partner. Moreover, while the
AWS-3 auction generated a lot of analyst notes slapping higher prices on DISH’s previous
spectrum holdings, it didn’t actually make them more valuable. If anything, it made them less
valuable: post-auction, the carriers had more spectrum and less money, reducing their need for
incremental bandwidth as well as their ability to pay. (When you stretch your finances to buy an
expensive house, it doesn’t make you more likely to pay a higher price for another one; for one
thing, you already have a house, and, for another, you’re out of cash.)
Now, highly levered and sitting on a mountain of unused spectrum, DISH still has no clear plan
for monetizing its investments. Rumors of an imminent transaction have come and gone, but the
carriers have continued to prove unwilling to meet the company’s terms. For those who have
bought into the narrative of an ongoing spectrum crunch, this deadlock ought to inspire
confusion. With spectrum values endlessly rising, with bandwidth in such short supply, why will
no one cut a deal? In reality, though, the absence of a deal is just one of a number of data
points demonstrating that the much vaunted spectrum crunch is far less than advertised –
deeply undermining the foundations of DISH’s all-in bet.
12 The same “person familiar with the deal” also contended that Verizon would come to regret its balking,
though whether that is true remains to be seen. 13 From Keating, Cutthroat (1999).

Kerrisdale Capital Management, LLC | 1212 Avenue of the Americas, 3rd Floor | New York, NY 10036 | Tel: 212.792.7999 | Fax: 212.531.6153 12
III. Carriers Already Have Plenty of Spectrum
What’s so great about spectrum? Licensed spectrum, along with towers, antennas, and
specialized computers, are key components of cellular networks. But what’s so great about
cellular networks? From a financial perspective, network operators have historically achieved
only modest returns on all the capital they need to meet user demands. In 2015, for instance,
carriers achieved a weighted-average return on invested capital of just 9%, with especially
anemic results from T-Mobile and Sprint.
US Wireless Carriers: Returns on Capital, 2015
Source: Capital IQ, Kerrisdale analysis
The industry’s mediocre profitability not only makes it foolhardy for a new player to aggressively
enter the market; it also calls into question the rationality of paying ever higher prices for
spectrum. When an entire network can only generate a single-digit return on capital, there is a
limit to how valuable a single input to that network can be, especially at the margin. Verizon’s
existing spectrum portfolio is indeed very valuable because it enables Verizon to support its
massive customer base, but incremental spectrum is naturally far less valuable, especially when
the network is already in good working order.
In the wake of the AWS-3 auction, all the carriers stated repeatedly that their existing spectrum
portfolios, combined with improving technology and the deployment of additional infrastructure,
were well-equipped to handle growing data traffic for years to come. That would imply relatively
little interest in investing even more in additional spectrum – bad news for a spectrum
speculator like DISH, especially given the practical difficulties of using its non-standard bands.
Spectrum bulls, of course, discount the notion that existing spectrum supply is adequate as self-
serving deception: the carriers don’t want the world to know how badly they need more
spectrum and how much they’d be willing to pay for DISH’s, so they need to insist that all is well.
It’s just an act – or so the bulls have argued.
But this conspiracy theory doesn’t hold up to scrutiny. In a world where carriers were rapidly
exhausting their spectrum resources, there would be clear evidence of mounting trouble on
many fronts:
Return
on
capital
Verizon 16%
AT&T 8%
T-Mobile 3%
Sprint 1%
Weighted avg 9%

Kerrisdale Capital Management, LLC | 1212 Avenue of the Americas, 3rd Floor | New York, NY 10036 | Tel: 212.792.7999 | Fax: 212.531.6153 13
Network performance would rapidly deteriorate as traffic overwhelmed the available
capacity. Dissatisfied users would leave in droves.
Not only would carriers buy all the spectrum they could; they’d also ramp up spending on
new cell sites and network equipment to increase capacity.
To tamp down demand, carriers would discourage data-intensive use cases like
streaming video.
But this is not the world we live in:
On average, network performance is getting better. According to OpenSignal, every
major carrier has improved its LTE download speeds over the past year, in some cases
substantially. (Ookla, the maker of Speedtest.net, reports average overall speeds that
are ~50-75% higher, suggesting that OpenSignal’s figure might be conservative.)
LTE Download Speeds (Mbps)
Source: OpenSignal State of LTE reports
(March 2015, June 2015, September 2015,
February 2016), Kerrisdale analysis
Despite their intense competition, carriers boast low and fairly stable churn rates. If
anything, churn is trending down, not up. There is no sign of any mass exodus driven by
a shortage of spectrum.
Monthly Churn Rates (Postpaid Users)
Source: company filings, Kerrisdale analysis
Note: values reflect Verizon Wireless retail postpaid, AT&T Consumer Mobility postpaid, T-Mobile
branded postpaid phone, and Sprint platform postpaid.
Carriers have not chosen to buy all the spectrum they can.
Sprint, for one, isn’t even participating in the upcoming 600MHz auction.
2014
Q4
2015
Q1
2015
Q2
2015
Q3
2015
Q4
Verizon 6.5 8.6 11 12 12
AT&T 6.5 7.6 8 8 8
T-Mobile 10.0 10.1 11 12 12
Sprint 4.0 4.8 5 6 7
3/31/14 6/30/14 9/30/14 12/31/14 3/31/15 6/30/15 9/30/15 12/31/15 3/31/16
Verizon 1.1% 0.9% 1.0% 1.1% 1.0% 0.9% 0.9% 1.0% 1.0%
AT&T 1.3% 1.0% 1.2% 1.4% 1.2% 1.2% 1.3% 1.3% 1.2%
T-Mobile 1.5% 1.5% 1.6% 1.7% 1.3% 1.3% 1.5% 1.5% 1.3%
Sprint 2.1% 2.1% 2.2% 2.3% 1.8% 1.6% 1.5% 1.6% 1.7%
Average 1.5% 1.4% 1.5% 1.7% 1.3% 1.2% 1.3% 1.3% 1.3%
Kerrisdale Capital Management, LLC | 1212 Avenue of the Americas, 3rd Floor | New York, NY 10036 | Tel: 212.792.7999 | Fax: 212.531.6153 14
Meanwhile, according to our estimates, Verizon, from 2012 to the time of the AWS-3
auction in 2015, was actually a net seller of spectrum.14
The H Block auction, which DISH easily won, attracted no interest from the carriers.
In the AWS-3 auction, the very fact that DISH was able to outbid the carriers for so many
licenses points to real price sensitivity: Verizon and AT&T could have paid as much as
DISH but opted not to.
Even DISH chose to forfeit a host of AWS-3 licenses rather than pay full price once it
learned that its “very small business” bidding credits were being revoked. Evidently it
does not believe there is much margin of safety in spectrum at auction prices.
Spending on new cell sites and equipment is not exploding; it’s business as usual.
For instance, Crown Castle, essentially tied for largest tower operator in the country, has
seen its tower count go from 39,697 at the end of 2014 to 39,749 at 3/31/16, and the
average number of tenants per tower has actually dipped slightly from 2.3 to 2.2.
American Tower, Crown Castle’s major competitor, has increased its tower count
recently, but almost entirely through acquisition; its organic rate of new builds is only
~0.3%, and its average number of tenants per tower has been flat.15 There is no frenzied
race to build more sites, contrary to the predictions of the “spectrum crunch” theory.
Major telecom vendors like Ericsson and Nokia are actually suffering from sluggish
revenues in the US, as carriers “focus on cash flow optimization”16 after the completion
of major LTE roll-outs. Spending is restrained, not booming.
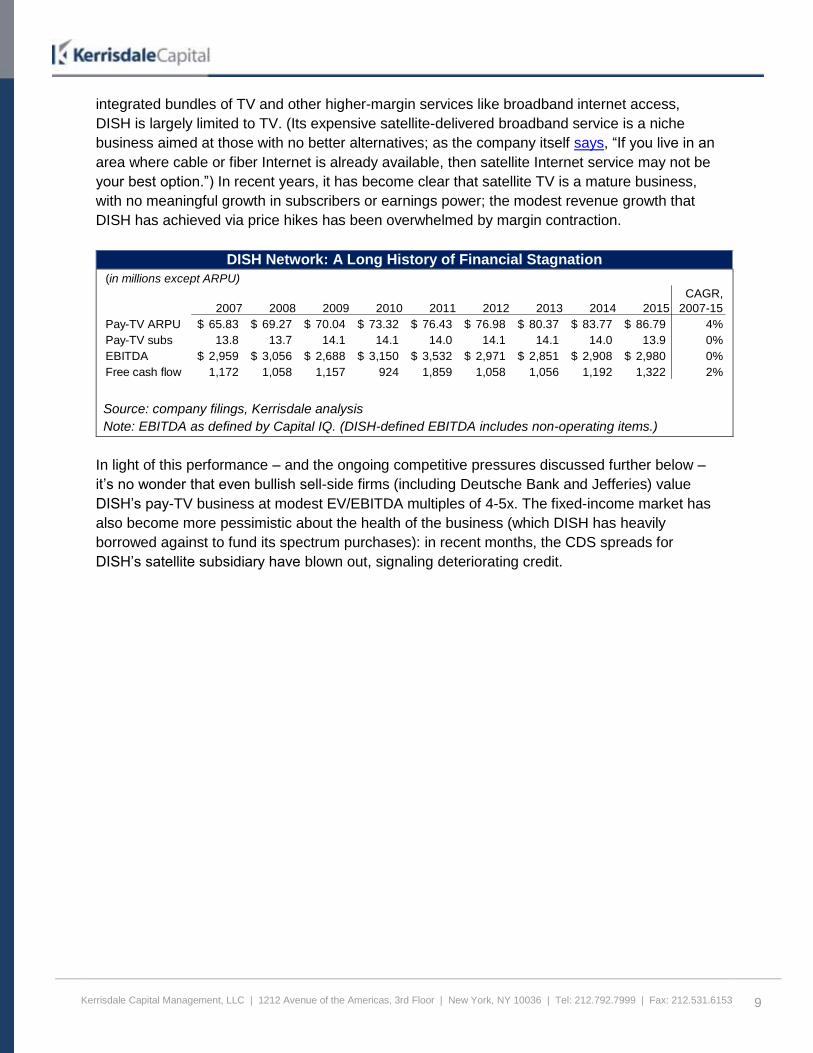
Similarly, carrier capital expenditures, though large in absolute terms, are only growing
modestly, not rapidly:
Carrier Capital Expenditures ($mm)
Source: Capital IQ, Kerrisdale analysis17
14 We estimate that Verizon sold 0.5B MHz-pops to AT&T in 2013 and 1.3B MHz-pops (net) to T-Mobile in
2014, partially offset by the purchase of 0.2B MHz-pops from Cincinnati Bell in 2014. See Moelis’s 2/3/15
expert report in the LightSquared bankruptcy (Appendix A, slide 17) and T-Mobile’s January 2014
investor presentation (appendix, slide 25). 15 See American Tower 2016 Q1 supplemental financial and operating data. 2015 US new builds totaled
85, as compared to a starting tower count of 28,566. For tenancy data, see American Tower’s 12/15
regional metrics. In the US, average tenancy was depressed by the Verizon tower purchase. Before,
tenancy averaged 2.5 for four consecutive quarters; after, it averaged 2.2 for three consecutive quarters. 16 Source: Ericsson 2015 Q3 earnings report, p. 5. 17 These figures reflect firm-level capex. AT&T does not disclose wireless-specific capex, making a clean
wireless-only analysis across the industry impossible. However, if we assume, consistent with
2013 2014 2015
2013-15
CAGR
AT&T 21,228$ 21,433$ 20,015$ -3%
Verizon 16,604 17,191 17,775 3%
T-Mobile 4,025 4,317 4,724 8%
Sprint 6,987 4,303 7,729 5%
Total 48,844$ 47,244$ 50,243$ 1%

Kerrisdale Capital Management, LLC | 1212 Avenue of the Americas, 3rd Floor | New York, NY 10036 | Tel: 212.792.7999 | Fax: 212.531.6153 15
Far from discouraging data-intensive video consumption, several major carriers have
recently begun to promote it. T-Mobile’s “Binge On” feature allows subscribers to stream
unlimited amounts of video (at 480p+ quality) without touching their data allocations.
Verizon has rolled out its own over-the-top streaming video service, Go90. AT&T has
reintroduced unlimited data plans for mobile users who also subscribe to DirecTV and
has hinted at a future OTT product. If these carriers were running out of spectrum and
network capacity, why would they possibly roll out these sorts of offers? It would be
suicide. Yet there they are.
In sum, the notion of an impending spectrum crunch that would put carriers urgently in need of
DISH’s spectrum is belied by the evidence. Network performance is improving, customers are
satisfied, infrastructure deployment is slow and steady, and carriers have not been shy about
encouraging increased user traffic – a signal of confidence in their networks. Because there is
no crisis, carriers can easily afford to let DISH twist in the wind – as indeed they have done for
years.
Spectrum bulls, however, tend to ignore all these indications that networks are doing a good job
accommodating growing traffic; instead, they focus on the sheer magnitude of that traffic growth
and assume it must ultimately overwhelm the carriers’ spectrum supplies. To be sure, cellular
data consumption has increased tremendously as smartphones, LTE, and streaming video have
become almost universal. But most observers fail to appreciate just how little the average user
consumes relative to available throughput. Different sources provide different figures, but the
NPD Group, based on a panel of smartphone users with specialized metering software installed
on their devices, estimates median and average cellular data consumption of ~1 and ~3
gigabytes per month, respectively. (The large difference between the median and average
highlights the outsized impact of a small group of heavy users.) Those monthly consumption
numbers translate to just 0.003 and 0.009 megabits per second – a tiny fraction of the >10
megabits per second that many users achieve in speed tests. Consumption has grown, but
existing networks are capable of much more.
One important factor in allowing for all this spare capacity is the relatively low population density
of most parts of the countries. As American Tower has pointed out, 84% of the US population
lives in suburban and rural areas with typical population densities in the hundreds per square
kilometer. Consider a stylized example. Business Insider has ranked New Albany, Ohio, as the
best suburb in America; its population density is 258 per square kilometer. (The average for the
contiguous United States is 40.) Assuming a typical tower coverage radius of 2.5km, a single
cell tower could cover ~20 km² containing ~5,000 people; further assuming that a single carrier
has 35% market share in the area (similar to what Verizon and AT&T boast nationwide), it would
management comments from AT&T’s 2015 Q4 earnings calls, that wireless capex accounts for about half
of AT&T’s total, then wireless-specific capex for the four carriers totaled ~$30.4 billion, ~$30.2 billion, and
~$31.5 billion in 2013, 2014, and 2015, respectively, for a 2013-15 CAGR of 2%.

Kerrisdale Capital Management, LLC | 1212 Avenue of the Americas, 3rd Floor | New York, NY 10036 | Tel: 212.792.7999 | Fax: 212.531.6153 16
have to handle only ~1,800 users.18 At a usage rage of 3 GB/month/user, the tower would see
177 GB of average daily traffic.
How does that stack up against the site’s capacity? Assuming only 10 MHz of downlink
bandwidth, three sectors, and 1.5 bps/Hz/sector of average spectral efficiency, the site’s
capacity would be 45 Mbps or 486 GB per day. In other words, even with a small amount of
spectrum, the site would use only 36% of its capacity. Traffic could almost triple without
requiring a major overhaul. With 25 MHz of downlink spectrum – more typical of metro-area LTE
networks – traffic could grow almost seven-fold without exhausting existing resources. The table
below summarizes this calculation.
Illustrative Analysis of Cell-Site Capacity Utilization
Source: Kerrisdale analysis
Of course, all of these parameter settings will differ from market to market and carrier to carrier,
but this simplified example helps to explain why carriers are not behaving like their spectrum is
running out any time soon: it’s not. In large swaths of the country in which most customers live,
even small amounts of spectrum can go a long way.
18 At 3/31/16, Verizon had ~90 million retail postpaid smartphones and ~40-60k cell sites (depending in
part on how one counts DAS nodes and small cells), for an average of 1,500 to 2,200 smartphones per
site, roughly consistent with the calculation above. Other carriers serve fewer devices but operate a
similar number of sites.
Value Symbol Notes
Aggregate traffic
Population per km2 258.0 d New Albany, Ohio
Tower coverage radius (km) 2.5 r
Tower coverage area (km2) 19.6 A A = π r2
Tower-covered pops 5,066 P = A x d
Carrier market share 35% s
Tower-covered subscribers 1,773 S = P x s
Per-subscriber traffic (MB/mo) 3,000 t
Per-subscriber traffic (MB/day) 100 t / 30
Aggregate traffic at tower (MB/day) 177,304 T = S x t
Aggregate capacity
Low High
Downlink spectrum (MHz) 10 25 b
Sectors per site 3 3 n
Spectral efficiency (bps/Hz/sector) 1.5 1.5 e
Capacity per site (Mbps) 45 113 c = b x n x e
Capacity per site (MB/day) 486,000 1,215,000 C = c x 60 x 60 x 24 / 8 bits/sec → bytes/day
Capacity utilization 36% 15% T / C
Kerrisdale Capital Management, LLC | 1212 Avenue of the Americas, 3rd Floor | New York, NY 10036 | Tel: 212.792.7999 | Fax: 212.531.6153 17
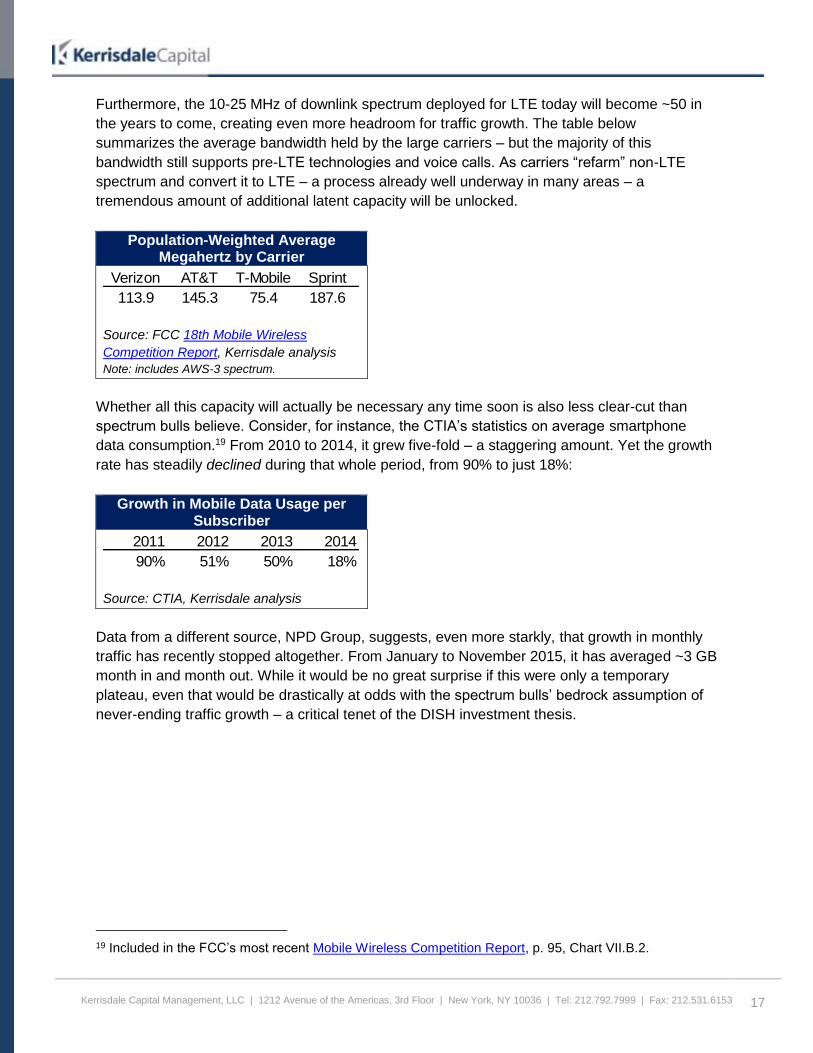
Furthermore, the 10-25 MHz of downlink spectrum deployed for LTE today will become ~50 in
the years to come, creating even more headroom for traffic growth. The table below
summarizes the average bandwidth held by the large carriers – but the majority of this
bandwidth still supports pre-LTE technologies and voice calls. As carriers “refarm” non-LTE
spectrum and convert it to LTE – a process already well underway in many areas – a
tremendous amount of additional latent capacity will be unlocked.
Population-Weighted Average Megahertz by Carrier
Source: FCC 18th Mobile Wireless
Competition Report, Kerrisdale analysis
Note: includes AWS-3 spectrum.
Whether all this capacity will actually be necessary any time soon is also less clear-cut than
spectrum bulls believe. Consider, for instance, the CTIA’s statistics on average smartphone
data consumption.19 From 2010 to 2014, it grew five-fold – a staggering amount. Yet the growth
rate has steadily declined during that whole period, from 90% to just 18%:
Growth in Mobile Data Usage per Subscriber
Source: CTIA, Kerrisdale analysis
Data from a different source, NPD Group, suggests, even more starkly, that growth in monthly
traffic has recently stopped altogether. From January to November 2015, it has averaged ~3 GB
month in and month out. While it would be no great surprise if this were only a temporary
plateau, even that would be drastically at odds with the spectrum bulls’ bedrock assumption of
never-ending traffic growth – a critical tenet of the DISH investment thesis.
19 Included in the FCC’s most recent Mobile Wireless Competition Report, p. 95, Chart VII.B.2.
Verizon AT&T T-Mobile Sprint
113.9 145.3 75.4 187.6
2011 2012 2013 2014
90% 51% 50% 18%

Kerrisdale Capital Management, LLC | 1212 Avenue of the Americas, 3rd Floor | New York, NY 10036 | Tel: 212.792.7999 | Fax: 212.531.6153 18
Average Smartphone Data Consumption, Oct. 2013 to Nov. 2015
Source: NPD Group, Kerrisdale analysis
Note: figures reflect average values for the top four carriers across both iOS and Android.
To be sure, in certain urban markets, where population density can be orders of magnitude
higher than it is in the country’s “best suburb,” capacity is harder to come by. Power levels need
to be lower, cells need to shrink, and congested “hot spots” can certainly arise. But more
spectrum is not necessarily the most economically effective solution. Additional infrastructure in
the form of small cells and DAS nodes (installed, for instance, on lampposts or utility poles
outdoors or in the ceiling in large office buildings) can enhance spectral efficiency by putting
radios closer to users, thereby increasing signal-to-noise ratios and enabling more data to flow
over the same amount of spectrum. That’s the strategy Verizon is now aggressively pursuing in
lieu of bidding up spectrum to irrational levels. As Verizon CFO Fran Shammo said in November
at an investor conference:
[W]e went into the AWS-3 auction; we spent $10.4 billion. If I wanted more spectrum, I
would have bought it in the auction. What we did was, we walked away from Chicago
and New York, because we said the price got way too high. And if you look at just the
math at a very simple level, in order to buy New York and Chicago and a couple other
markets, it was $6 billion additional cost for spectrum. I can build the same capacity for
$1.5 billion. The spectrum won't be launched until three years from now, so 2018. My
build will be done by 2018. I'll have the exact amount of capacity I would have had if I
bought that spectrum. So from our perspective, $1.5 billion versus $6 billion, it's a pretty
simple equation.
So, why would I go out and buy spectrum and be held hostage by a third party? I mean,
it makes no logical sense to do that. So, at this point, yeah, Charlie has great spectrum,
but not at the price that he paid for it, because we walked away in the auction. So,
0.0
0.5
1.0
1.5
2.0
2.5
3.0
3.5
Oct-13 Apr-14 Oct-14 Apr-15 Oct-15
GB
s/m
onth
plateau?

Kerrisdale Capital Management, LLC | 1212 Avenue of the Americas, 3rd Floor | New York, NY 10036 | Tel: 212.792.7999 | Fax: 212.531.6153 19
there's no reason to have this discussion, and we've talked about this before. I'm not
interested in DISH.20
Predictably, DISH bulls dismissed this straightforward rejection as pure hot air. But the evidence
reviewed above is consistent with Shammo’s argument. Today, all the carriers have large
amounts of under-utilized and virgin spectrum, typical traffic demands are putting little strain on
network capacity in most places, and traffic growth is decelerating. More spectrum never hurts,
but carriers don’t earn outsized economic returns, and spectrum, like most resources, suffers
from diminishing marginal returns, so carriers have neither the ability nor the willingness to pay
ever higher prices. While the skewed results of the AWS-3 auction temporarily obscured these
realities, we believe that the upcoming 600MHz auction will put them on display, casting
additional doubt on the sustainability of DISH’s inflated valuation.
IV. Spectrum Prices Face a Major Reset Downward –
Especially for DISH
The 600MHz incentive auction, already underway, will serve to put low-frequency spectrum
currently used by traditional TV broadcasters into the hands of carriers. First, in the “reverse”
auction, TV stations will be able to accept cash payments in exchange for going off the air and
freeing up spectrum, while holdouts will be “repacked” into new frequencies. In the “forward”
auction, carriers (along with would-be new entrants and speculators like DISH) will bid for
cellular licenses carved out of the freed-up spectrum. Many aspects of the auction are complex,
uncertain, and inter-dependent; for example, the amount of spectrum available to carriers is a
function of broadcaster participation (and will vary somewhat from market to market). For our
purposes, however, the most important point about the auction is the imbalance between likely
supply and likely demand.
Though TV broadcasters located in major markets with major network affiliations (like CBS or
ABC) may have viable business models, there are well over a thousand broadcasters in the
country, many of which lack those attributes, have no clear future, and are likely to cash out.
While the auction could release anywhere from 20 to 100 MHz of spectrum (in multiples of 10)
for cellular use, FCC simulations suggest that, even with minimal participation from major-
network and other high-value stations, 70 to 100 MHz of paired spectrum represents a likely
range of outcomes; indeed, the FCC’s initial clearing target is 100 MHz, the highest possible. By
contrast, the AWS-3 auction offered only 50 MHz of paired spectrum. In short, given the large
number of weak broadcasters for whom going off the air is financially superior to the status quo,
the auction should generate a very large supply of spectrum.
20 Source: Bloomberg transcript of Wells Fargo Securities Technology, Media & Telecom Conference,
11/10/15.

Kerrisdale Capital Management, LLC | 1212 Avenue of the Americas, 3rd Floor | New York, NY 10036 | Tel: 212.792.7999 | Fax: 212.531.6153 20
Meanwhile, there are only four large carriers, and the one with perhaps the worst position in
low-band spectrum, Sprint, announced last year that it wouldn’t even be bidding, noting, among
other things, that “Sprint has the spectrum it needs.” T-Mobile, notwithstanding its recent
accumulation of 700MHz A Block licenses, still suffers from a coverage and building-penetration
disadvantage relative to AT&T and Verizon, and the company has been vocal about its interest
in buying 600MHz spectrum. But the auction will include a spectrum reserve of 30 MHz for
carriers without a strong pre-existing portfolio of low-band spectrum in a given market. In some
areas, AT&T and Verizon lack the threshold level of low-band spectrum and will be able to bid
against T-Mobile, but in large regions T-Mobile will essentially have the reserve to itself. Since
the auction reserve price is $1.25/MHz-pop,21 T-Mobile won’t be able to get away with an
incredible bargain, and it has stated that it’s “certainly not going to buy 30 MHz of spectrum at
the auction.” But it’s plausible that it will be able to pick up ~20 MHz nationwide at ~$1.50/MHz-
pop, for total spending of approximately $9 billion – consistent with management’s remarks that
it could spend “up to” $10 billion.
If T-Mobile only buys 20 MHz, though, that leaves 50 to 80 MHz for AT&T and Verizon – large
quantities relative to their current holdings. But both already have strong 700MHz portfolios,
giving them good coverage; at the margin, 600MHz spectrum is less valuable to them than it is
to T-Mobile. Still, 600MHz base stations operating at reduced power can, in principle, provide
the same sort of capacity and cell size that mid-band spectrum can, while not foregoing the
option of broader coverage where needed. Thus, even with the rising importance of mid-band
spectrum, low-band spectrum is still more valuable. Yet AT&T has said that it’s only looking for
a 20MHz slice. If Verizon seeks the same, that would amount to just 40 MHz of demand outside
the protected spectrum reserve, as compared to 50 to 80 MHz of supply. The carriers simply
have no good reason to bid aggressively. Bidding near the reserve price is likely to get them
what they want and still leave room for any dark-horse participants that show up. Meanwhile,
even at $1.25/MHz-pop – drastically lower than the AWS-3 paired-spectrum price of $2.71 – the
forward auction will take in some $30+ billion. DISH, having gone all-in on the last auction, now
holds just $0.9 billion in cash and marketable investments, likely too little to significantly disrupt
the bidding. With high supply flowing from the reverse auction and low demand entering the
forward auction, and with DISH weakened, the final clearing price should approach the reserve
price. Here we assume it winds up at $1.50/MHz-pop – essentially in line with the recently
emerging consensus view.22
What does this mean for DISH? With a more rational, less distorted benchmark price in focus,
DISH will have a much harder time arguing for aggregate spectrum valuations in the many tens
of billions. While management will no doubt argue that its largely mid-band portfolio is better
suited to providing capacity than the 600MHz band and that it is therefore worth proportionally
more, the fact remains that the self-interference that hurts low-frequency capacity can be
21 In the top 40 “partial economic areas.” Furthermore, the $1.25 figure is binding only for spectrum
clearing levels at or below 70 MHz; above that level, the auction price is allowed to be lower as long as
the aggregate proceeds exceed what a $1.25 reserve price would have guaranteed if only 70 MHz had
been cleared. For example, the reserve price could effectively step down to $0.875 in a 100MHz auction. 22 $1.50/MHz-pops x 70 MHz x 320mm pops = $33.6 billion.

Kerrisdale Capital Management, LLC | 1212 Avenue of the Americas, 3rd Floor | New York, NY 10036 | Tel: 212.792.7999 | Fax: 212.531.6153 21
reduced by simply operating at lower power. Whatever 600MHz is worth, DISH’s AWS-3
spectrum must be worth less.
How much less? At their original FCC auctions, “clean” 700MHz licenses sold for 6.7x the price
per MHz-pop of comparable AWS-1 licenses.23 On this basis, if 600MHz spectrum now sells for
$1.50, then DISH’s AWS-3 spectrum is only worth $0.22. But we adopt a less extreme view.24
The declining value of incremental coverage has in fact caused the difference in value between
low- and high-band spectrum to compress. Triangulating across a number of relatively recent
spectrum trades, however, we estimate that the ratio is still 2-3x:
When T-Mobile purchased 700MHz A Block spectrum from Verizon in January 2014 in
exchange for cash and a mixture of AWS and PCS mid-band spectrum, it valued the
700MHz at $1.85/MHz-pop. However, the licenses purchased were disproportionately in
high-value markets; we estimate that $1.85 in those markets translates to a $1.45
nationwide average. However, the A Block suffers from interference challenges.
Assuming the same ratio of A to B Block values that prevailed in the 700MHz auction, a
$1.45 price for the A Block implies $3.35 for the unimpaired B Block. Meanwhile, T-
Mobile valued the mid-band spectrum it gave to Verizon at $1.72/MHz-pop, but, again,
this spectrum came disproportionately from high-value markets, implying a ~$1.55
nationwide price. $3.35 for 700MHz B / $1.55 for mid-band = 2.2x.
When AT&T purchased 700MHz B Block spectrum from AT&T in September 2013 in
exchange for cash and AWS-1 spectrum, the implied nationwide B Block price, by our
estimates, was $2.78/MHz-pop. Moelis has estimated that the nationwide AWS-1 price
was $0.81.25 The ratio of low- to mid-band was 3.4x.
In two separate transactions in 2013, Grain Management purchased 700MHz B Block
spectrum for an implied national price of $3.20, while T-Mobile purchased AWS-1
spectrum for an implied national price of $1.57. The ratio of low- to mid-band was 2.0x.
Thus a $1.50/MHz-pop nationwide average price for 600MHz spectrum points to, at best, a
$0.75/MHz-pop nationwide average price for standard mid-band spectrum like AWS-3. At
auction, however, driven by DISH’s aggressive bidding, this spectrum sold for $2.71/MHz-pop,
implying a drastic 72% markdown from 2015 to 2016.
23 See Exhibit 1 from former FCC Chairman Kevin Martin’s 4/25/08 statement to Congress regarding the
700MHz auction. We regard the 700MHz B Block as the only “clean” one. (The A Block suffers from
interference from TV Channel 51, the C Block is subject to “open access” requirements initially viewed as
burdensome, and the E Block is unpaired.) Since the B Block is licensed by Cellular Market Area (CMA),
we compare it to the AWS-1 A Block, the only AWS-1 block licensed the same way. $2.67/MHz-pop for
the 700MHz B Block / $0.40/MHz-pop for the AWS-1 A Bock = 6.7x. 24 It’s interesting to note that the 6.7x price ratio is very close to what a simple theoretical model would
predict. Based on propagation, we might expect spectrum value to go as the inverse square of the
frequency (a point discussed in our Globalstar report). Using a 700 B center frequency of 722 MHz and
an AWS-1 A center frequency of 1915 MHz, the ratio is 2.65, the square of which is 7.0 – close to the
6.7x empirical value from the auctions. 25 See Moelis’s 2/3/15 expert report in the LightSquared bankruptcy (Appendix A, slide 17, note 7).

Kerrisdale Capital Management, LLC | 1212 Avenue of the Americas, 3rd Floor | New York, NY 10036 | Tel: 212.792.7999 | Fax: 212.531.6153 22
Is this assumption too draconian? Note that the 72% figure is highly consistent with the
comments from Verizon’s CFO quoted above. He asserted that AWS-3 licenses that sold for $6
billion really had intrinsic value of only $1.5 billion since that level of capex could generate the
same amount of incremental capacity as additional spectrum could. Dropping from a $6 billion
purchase price to $1.5 billion of intrinsic value is a 75% decline.
Moreover, $0.75/MHz-pop is in line with the expectations that T-Mobile laid out (slide 7) to the
FCC prior to the AWS-3 auction in January 2014. It estimated that the H Block auction would
clear at $0.50-$0.75/MHz-pop, while the AWS-3 auction would clear at $0.80-$1.20. However,
DISH was the only serious bidder in the H Block auction – none of the carriers participated –
and it won every license available at an average of exactly $0.50/MHz-pop, the minimum price it
had promised the FCC it would bid. Therefore, in the absence of such a promise, the price
would have been below $0.50 and thus worse than T-Mobile expected. The natural inference
would be that the AWS-3 auction price would likewise fall below T-Mobile’s $0.80/MHz-pop
lower bound – consistent with our $0.75/MHz-pop estimate. (Because DISH’s AWS-3 licenses
are disproportionately drawn from high-value markets, we adjust the nationwide $0.75 up to
$0.83 for DISH, based on the assumption that all AWS-3 licenses drop in price by the same
percentage.)
Whatever its market value, the AWS-3 band is at least standard spectrum.26 Verizon, AT&T, and
T-Mobile are all incorporating it into their networks, guaranteeing that an ecosystem of handsets
and equipment will support it. Because of these economies of scale, standard spectrum used by
multiple carriers is always far more valuable than peculiar one-off bands. Unfortunately for
DISH, the bulk of its spectrum portfolio consists of the latter:
Upper AWS-4 (2180-2200 MHz): While officially included in the industry standards body
3GPP’s Band 66 – the extended AWS band – DISH’s 20 MHz of nationwide upper AWS-
4 spectrum has a unique limitation: only Band 66 devices capable of carrier aggregation
are required to support it.27 Carrier aggregation – an LTE-Advanced feature that allows
two separate units of spectrum to work in concert – is common in high-end phones but
far less common in cheaper ones (which, in the aggregate, account for a high volume of
unit sales). Indeed, the entire motivation behind giving DISH’s upper AWS-4 spectrum
26 Note, however, that DISH’s AWS-3 spectrum, held by the designated entities SNR and Northstar, is
now encumbered: any future buyer of the underlying licenses must assume a pro-rata share of DISH’s
deficiency payment, discussed below. (See e.g. the “special conditions” listed for one of Northstar’s
licenses in Virginia.) Since the amount of the deficiency payment won’t be determined until the unknown
future date when the FCC re-auctions the licenses that DISH’s entities defaulted on, these encumbrances
will likely impede monetization. 27 See 3GPP TSG-RAN Working Group 4 document R4-155921, “Text Proposal for TR 36.869: Section
7.2 Interoperability by Means of CA”: “there may be some concerns that mandating intra-band CA
precludes low cost (i.e. non-CA) UEs and MTC devices from being supported in the band. Therefore, a
compromise solution to address both interoperability and low cost UE concerns in the band is proposed,
which is to mandate intra-band CA to CA-capable UEs only.”

Kerrisdale Capital Management, LLC | 1212 Avenue of the Americas, 3rd Floor | New York, NY 10036 | Tel: 212.792.7999 | Fax: 212.531.6153 23
second-class status within Band 66 was to enable “low cost” user devices to support
Band 66 without supporting DISH’s spectrum.
Today, according to Sprint, only 21% of postpaid phones support carrier aggregation.28
While this figure will likely grow over time – Sprint also disclosed that 76% of new
phones sold support it – it’s unlikely to become 100% any time soon, especially given
the trend toward lower phone turnover. Furthermore, certain carrier-aggregation–
capable devices29 only support a maximum combined downlink bandwidth of 20 MHz.
Such a device, if already enjoying 10 or 20 MHz of downlink bandwidth on its primary
band, would only be able to use 0 to 10 MHz of DISH’s upper AWS-4 – not the full 20
MHz.
Furthermore, while Band 66 is a superset of the widely used AWS-1 band (Band 4),
carriers are unlikely to deploy Band 66 equipment unless they have AWS-3 spectrum in
a given market. But Verizon, for instance, owns no AWS-3 spectrum in New York or
Chicago; T-Mobile owns no AWS-3 spectrum in any of the top nine metro areas. If
Verizon later acquires or leases DISH’s upper AWS-4 spectrum in these areas, it would
likely need to rip out its Band 4 equipment and replace it with Band 66 – a far more
grueling and costly undertaking than DISH bulls seem to appreciate. Meanwhile, Sprint
doesn’t use AWS spectrum, making it incapable of benefiting from DISH’s upper AWS-4
at all,30 further shrinking the pool of interested parties.
In short, though DISH glosses over these inconvenient details, the carrier-aggregation–
related limits on DISH’s upper AWS-4 spectrum make it materially less valuable than the
core AWS-3 portion of Band 66, with permanently lower device support and reduced
usability even for a subset of devices that will support it. As a result, we believe it is
generous to value upper AWS-4 at a 15% haircut to our assumed nationwide paired
AWS-3 price of $0.75/MHz-pop.
AWS-3 unpaired uplink/lower AWS-4/upper H Block (1695-1710 MHz / 1995-2020
MHz): Based on DISH’s recent press release about the 3GPP standardization process,
we believe that this proposed Franken-band represents its current strategy for cobbling
together some value out of wholly non-standard spectrum that, in its original form, no
one else wanted. The AWS-3 unpaired uplink spectrum that DISH purchased did not
attract any serious carrier bids, nor did the earlier H Block auction. But if carriers were
unwilling to pay $0.50/MHz-pop for the H Block before, there’s no reason why’d they pay
DISH anything more for this “mega H Block” now.
28 Capital IQ transcript of Sprint FY2016 Q3 earnings call, January 26, 2016. 29 LTE Cat 4 UEs. 30 At least under current LTE standards. It’s possible that future standards may allow the aggregation of
the upper AWS-4 portion of Band 66 with e.g. Sprint’s 850MHz spectrum, but no such carrier-aggregation
cases are currently defined, let alone supported by devices.

Kerrisdale Capital Management, LLC | 1212 Avenue of the Americas, 3rd Floor | New York, NY 10036 | Tel: 212.792.7999 | Fax: 212.531.6153 24
In addition, with its unusual, asymmetric 15+25 MHz structure, it raises carrier-
aggregation issues similar to those that affect the upper AWS-4 band: under current
draft rules,31 the first iteration of the band would only allow, at most, 15+15 MHz of
bandwidth, wasting a minimum of 10 MHz (40%) of the available downlink – more in
certain locations where other licensees own a portion of the uplink band or where the
need to coordinate with incumbent government users of the spectrum in 27 protection
zones32 restricts operations. Future standards will likely allow intra-band carrier
aggregation, enabling some hypothetical devices to access the full downlink band, but,
again, only if they are high-end enough to support carrier aggregation in the first place.
Setting technical complications aside, the most important problem is that the band
simply has no advocate on the planet besides DISH. While Verizon and AT&T could
likely create an ecosystem around this band if they chose to, they’re well aware of their
own power and wouldn’t leak that value to DISH by overpaying for orphan spectrum.
Thus we value this band at a 20% discount to the H Block auction price: $0.40/MHz-pop.
Lower H Block (1915-1920 MHz): Left out of DISH’s Franken-band is what was
originally the uplink portion of the H Block, which sits adjacent to the PCS uplink band.
We highly doubt that a narrow, isolated, non-standard, unpaired uplink band will garner
any market interest and thus ascribe no value to it.
700MHz E Block (722-728 MHz): Though it does belong to a proper 3GPP band (Band
29), this small piece of downlink-only spectrum is little used in the real world even
though AT&T owns a large piece of it (as well as the entire adjacent band). Because of
technical problems with using carrier aggregation to combine two different low-frequency
bands, the 700MHz E Block can only be aggregated with a higher-frequency band like
AWS or PCS that suffers from inferior propagation – thereby forfeiting the key advantage
of 700MHz. As a result, the E Block, despite being low-band spectrum, should be valued
like mid-band. We estimate that AT&T purchased 700MHz D and E Block spectrum from
Qualcomm in 2010 at a 6% premium to the pricing that prevailed in the 2008 700MHz
auction; applying the same premium to DISH’s original purchase price would generate a
price per MHz-pop of $0.52. However, AT&T likely regrets its former purchase, given its
subsequent inability to exploit the spectrum on a meaningful scale. Thus, we apply a
discount and value this band at $0.40/MHz-pop.
This band-by-band analysis is summarized below. In the aggregate, we value DISH’s cellular
spectrum at $11.5 billion gross.
31 See 3GPP TR 36.749 V0.1.0 (2016-02). 32 These zones include portions of the Miami, Sacramento, Boulder, Kansas City, and Knoxville metro
areas, among others.

Kerrisdale Capital Management, LLC | 1212 Avenue of the Americas, 3rd Floor | New York, NY 10036 | Tel: 212.792.7999 | Fax: 212.531.6153 25
Breakdown of DISH’s Spectrum Portfolio by Band and Kerrisdale-Estimated Value
Source: company filings, Kerrisdale analysis
However, there is one more effect to take into account. After the FCC denied DISH the “small
business” discounts that it thought it had obtained by bidding through its designated entities,
DISH chose to selectively default, paying for only a subset of the licenses it had won. In addition
to assessing a penalty for this behavior, the FCC put DISH on the hook for any shortfall relative
to its original purchase price when the agency ultimately re-auctions the forfeited licenses.
Overall, DISH’s bids for these licenses totaled $3.4 billion; assuming that their value declines
72% from the inflated auction price, DISH will therefore be liable for an additional $2.5 billion – a
pure loss.33 Netting this cost against the $11.5 billion in gross spectrum value, we find that the
overall fair value of DISH’s portfolio is ~$9 billion, or roughly half of what the market implies.
And this estimate doesn’t even consider DISH’s costly and challenging buildout deadlines,
further discussed below.
It’s been easy for investors to buy into the DISH narrative because its underpinnings – more
smartphones, more data traffic, ever rising spectrum prices – seemed so unassailable. As the
spectrum market reverses direction, however, the narrative has stopped lining up with reality.
DISH “put every damn egg” it had into one basket; now the basket is starting to slip.
33 Using our estimates, DISH will be entitled to a partial refund of the $516 million interim payment made
to the FCC in 2015, partially offsetting the larger deficiency payment. However, in five years DISH will
also need to pay a contractually defined “put price” to the controlling minority investors in the designated
entities, SNR and Northstar, that legally hold its AWS-3 licenses; we estimate this price to be $562
million, based on a 20% annually compounded return on the $226 million of capital contributed by those
minority investors. At a 10% discount rate, the present value of this put liability is $349 million, roughly
equal to the $373 million FCC refund that, on our numbers, DISH will eventually receive.
MHz-
pops (B)
Price
($/MHz-
pop)
Total
value
($B)
AWS-3 paired 2.6 0.83$ 2.2$
Upper AWS-4 6.3 0.64 4.0
AWS-3 unpaired, lower
AWS-4, lower H Block11.8 0.40 4.7
Upper H Block 1.6 - -
700MHz E Block 1.4 0.40 0.6
Total 23.7 0.48$ 11.5$

Kerrisdale Capital Management, LLC | 1212 Avenue of the Americas, 3rd Floor | New York, NY 10036 | Tel: 212.792.7999 | Fax: 212.531.6153 26
V. Time Is Not on DISH’s Side
Some observers contend that there’s no need for DISH to rush into a deal now. If Verizon wants
to talk tough, let it; as traffic grows and its network struggles under the burden, it will eventually
come crawling back to the negotiating table. As explained above, we dissent from this view –
but even if we didn’t, time is not on DISH’s side, and the clock is ticking.
As part of its standard operating procedure, the FCC requires licensees to provide specified
minimum levels of coverage in their markets by specific dates; the purpose is to prevent
wasteful spectrum warehousing. While the agency has, in many circumstances, granted
extensions and waivers – including to DISH – licensees aren’t entitled to leniency, and some
fairly large spectrum holders (like FiberTower34) have indeed been stripped of their holdings for
failing to comply with buildout requirements. Because DISH has acquired its spectrum in several
different transactions, it faces a range of deadlines, summarized below:
AWS-4
o 40% coverage (by population) by March 2017
o 70% coverage by March 2021
o If the first deadline is missed, then the second one moves up to March 2020.
700MHz E Block
o Same timeline as AWS-4.
H Block
o 40% coverage by April 2018
o 75% coverage by April 2024
o If the first deadline is missed, then the second moves up to April 2022.
AWS-3
o 40% coverage by October 2021
o 75% coverage by October 2027
o If the first deadline is missed, then the second one moves up to October 2025.
With no sign of any buildout underway, DISH’s March 2017 and April 2018 deadlines for
providing coverage and offering service to 40% of the US population are already as good as
missed. There just isn’t enough time to go from a standing start to covering some 125 million
people – especially without any existing infrastructure. That moves the focus to March 2020,
when DISH must achieve 70% coverage via AWS-4 and the 700MHz E Block, and April 2022,
when it must achieve 75% coverage via the H Block. March 2020 is less than four years away.
All the carriers are currently knee-deep in network engineering to make use of their existing
spectrum – Verizon, for instance, has publicly sketched out its spectrum roadmap through
“2019+.” Since no carrier has any particular need for DISH’s non-standard spectrum, there’s no
compelling reason to alter current plans to accommodate strange new bands. That puts DISH in
34 See e.g. Fletcher, Heald & Hildreth’s summary of the FiberTower situation in FHH Telecom Law, Dec.
2012 (p. 3).

Kerrisdale Capital Management, LLC | 1212 Avenue of the Americas, 3rd Floor | New York, NY 10036 | Tel: 212.792.7999 | Fax: 212.531.6153 27
a weak bargaining position, because it needs to find a deal in the next few years, while the
carriers can comfortably wait. The nearer the deadline looms, the more the carriers can
squeeze DISH.
Indeed, meeting the March 2020 deadline in a manner consistent with the spirit of the build-out
requirements35 is likely already impossible. In May 2012, DISH’s vice president for wireless
development said, in a sworn statement,36 that, “[b]ased on an ambitious buildout schedule,
DISH believes it can deploy its network to 60 million people (‘POPs’) within four years.” But 60
million people is less than 20% of the country’s population; in the next four years, DISH (or any
entity it sells its licenses to) has to cover 3.5x that many people. While DISH once argued that
“[e]ven at four years, a 30 percent POPs coverage requirement is aggressive and likely
unrealistic,”37 it now faces a vastly more stringent requirement over an even shorter timeframe.
Leasing or selling the spectrum doesn’t fix the problem – the same 2020 deadline will apply to
whoever holds the licenses.
DISH can’t demand an extension from the FCC simply on the grounds that it wants to wait
longer to hold out for a bigger check from Verizon or AT&T; it likely needs to claim
(disingenuously, in our view) that circumstances beyond its control prevented a big enough
build-out.38 If it literally makes no attempt to build anything from now until 2020, it will almost
certainly lose its licenses. Thus DISH’s best choice is, as quickly as possible, to create what
some call a “save build” – a wasteful, low-performing network that exists not to serve customers
but to just barely satisfy regulatory requirements and keep licenses in good standing. But DISH
needs to cover 70% of the population in each of 176 “Economic Areas” – a tall order. For
smaller carriers, achieving near-nationwide coverage has cost ~$30 billion.39 Based on our
discussions with industry experts and participants, we believe that, by cutting almost every
corner, DISH might be able to achieve 70% coverage in four years with only 20,000 cell sites
(prioritizing the tallest towers to reach the furthest at the lowest cost) and an average equipment
cost per cell site of ~$160,000, for a total investment of $3.2 billion – a tenth of the cost of an
actually functional network that any consumer would want to use.
Without some Potemkin village of a network, DISH is at extreme risk of seeing its most valuable
assets evaporate overnight. Even with such a ruse, however, the FCC might still have a hard
time concluding that DISH was truly providing “reliable coverage” or meaningful “service”; much
35 In the AWS-4 Report & Order, the FCC said, “As an initial matter, we observe that the incumbent 2 GHz
MSS licensees [owned and controlled by DISH] generally support our seven year end-of-term build-out
benchmark and have committed to ‘aggressively build-out a broadband network’ if they receive
terrestrial authority to operate in the AWS-4 band. We expect this commitment to be met…” (emphasis
added). 36 Exhibit 2 of DISH’s comments in the AWS-4 proceeding. 37 Ibid. 38 The incorporation of the upper AWS-4 band into Band 66 (and earlier into Band 23) actually hurts
DISH’s ability to get an extension since it will be less able to argue that equipment was unavailable. 39 Excluding intangible assets, cash, and wireless licenses, T-Mobile has ~$29 billion of tangible assets;
Sprint has ~$30 billion.

Kerrisdale Capital Management, LLC | 1212 Avenue of the Americas, 3rd Floor | New York, NY 10036 | Tel: 212.792.7999 | Fax: 212.531.6153 28
depends on the Commission’s general attitude toward the firm. If DISH does lose its AWS-4
licenses in 2020, then much of the rest of its spectrum portfolio will fall apart as well. Without the
lower AWS-4 band, DISH’s would-be Franken-band would revert to 15 MHz of unpaired uplink,
which no carriers want, and the 5+5 MHz H Block, which might at best add a small amount of
value to Sprint’s PCS G Block – but Sprint, of course, is already long on spectrum and short on
cash. With these holdings losing all realistic hopes of generating value, DISH would be left with
its paired AWS-3 and 700MHz E Block spectrum, for a gross value of $2.7 billion, largely wiped
out by $2.5 billion in AWS-3 re-auction penalties. In this scenario, DISH’s equity would lose
almost all of its value and decline to ~$8 per share.
In fact, the outcome could be even worse. While we assume in our base case that DISH does
manage to monetize almost all of its spectrum (with the minor exception of the stranded lower H
Block), there’s a serious risk that DISH eventually loses many of its licenses in the face of
overwhelming indifference from the carriers. After all, if DISH loses its licenses, the spectrum
doesn’t go away; the FCC would likely re-auction it, complete with new, extended buildout
deadlines. To the extent a carrier actually was interested in DISH’s spectrum at some point in
the future, it’s not at all obvious that buying it from DISH is a better option than simply waiting for
the FCC to take it back and then buying it at auction.
While some DISH bulls continue to dismiss the FCC’s deadlines as toothless, DISH’s envelope-
pushing tactics have earned it no friends in Washington; whatever goodwill it once enjoyed as a
potential disruptor of the perceived carrier oligopoly has now evaporated. The FCC has no
reason to give DISH special treatment. And this suits the oligopoly just fine. With no impending
spectrum crisis to further jack up prices, and with even more spectrum coming to market in the
600MHz auction and beyond, the carriers have the upper hand against DISH, and they know it.
VI. DISH’s Core TV Business Is Weak
Borrowing from the sell-side consensus and valuing DISH’s pay-TV business at ~5x annual
EBITDA of ~$3 billion, we find that almost all the value of that business flows to debt holders; as
a result, the vast majority of DISH’s equity value (84%) stems from spectrum. A keen focus on
spectrum is thus appropriate. However, it’s worth remembering all the difficulties that DISH’s
satellite operations face.
The challenges posed by the rise of “cord cutters” and “cord nevers” are widely discussed with
respect to cable operators, but cable can at least supply internet connectivity to retain
customers (at a higher profit margin). DISH can’t. This problem has existed for years, but, as
low-cost alternatives to conventional pay TV like Netflix and Hulu continue to improve and grow,
DISH is particularly at risk because, based on our discussions with industry participants, its
customer base is skewed heavily toward low-income and price-sensitive households. DirecTV
has long boasted higher ARPU, for instance (driven in part by its expensive but exclusive and
very sticky NFL Sunday Ticket product), and DISH has tended to offer steeper promotional
discounts. Today, DISH is increasingly squeezed between, on the one hand, cable operators
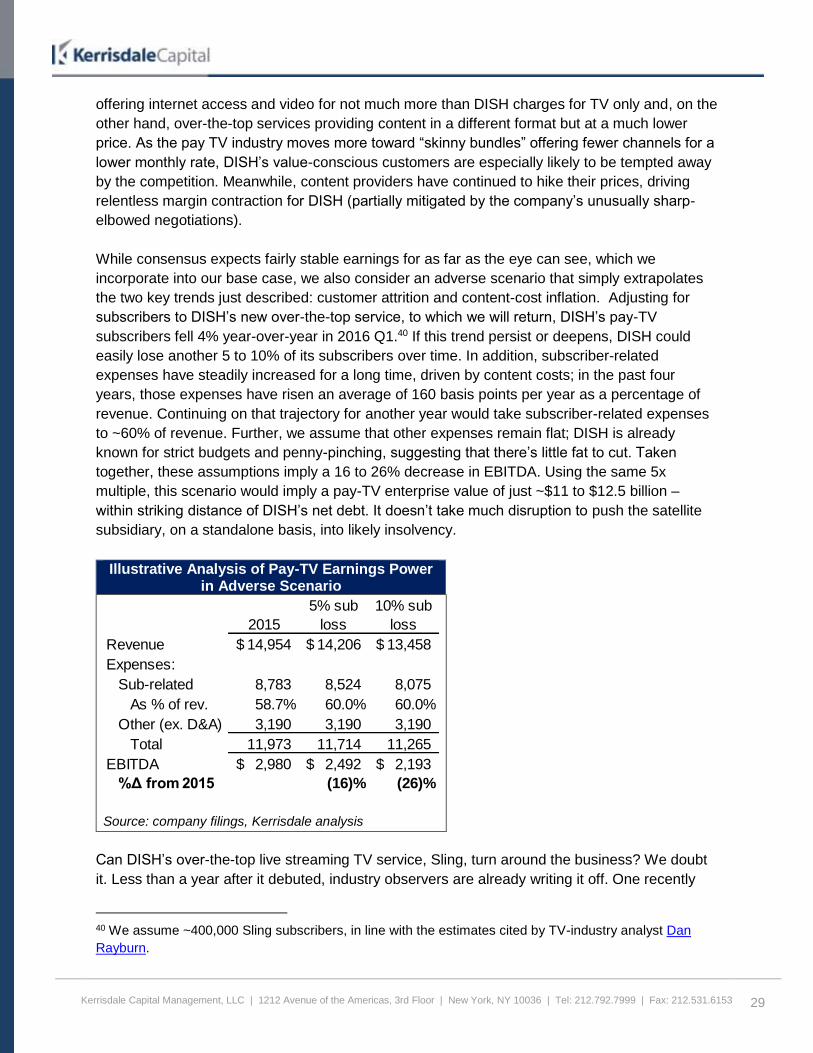
Kerrisdale Capital Management, LLC | 1212 Avenue of the Americas, 3rd Floor | New York, NY 10036 | Tel: 212.792.7999 | Fax: 212.531.6153 29
offering internet access and video for not much more than DISH charges for TV only and, on the
other hand, over-the-top services providing content in a different format but at a much lower
price. As the pay TV industry moves more toward “skinny bundles” offering fewer channels for a
lower monthly rate, DISH’s value-conscious customers are especially likely to be tempted away
by the competition. Meanwhile, content providers have continued to hike their prices, driving
relentless margin contraction for DISH (partially mitigated by the company’s unusually sharp-
elbowed negotiations).
While consensus expects fairly stable earnings for as far as the eye can see, which we
incorporate into our base case, we also consider an adverse scenario that simply extrapolates
the two key trends just described: customer attrition and content-cost inflation. Adjusting for
subscribers to DISH’s new over-the-top service, to which we will return, DISH’s pay-TV
subscribers fell 4% year-over-year in 2016 Q1.40 If this trend persist or deepens, DISH could
easily lose another 5 to 10% of its subscribers over time. In addition, subscriber-related
expenses have steadily increased for a long time, driven by content costs; in the past four
years, those expenses have risen an average of 160 basis points per year as a percentage of
revenue. Continuing on that trajectory for another year would take subscriber-related expenses
to ~60% of revenue. Further, we assume that other expenses remain flat; DISH is already
known for strict budgets and penny-pinching, suggesting that there’s little fat to cut. Taken
together, these assumptions imply a 16 to 26% decrease in EBITDA. Using the same 5x
multiple, this scenario would imply a pay-TV enterprise value of just ~$11 to $12.5 billion –
within striking distance of DISH’s net debt. It doesn’t take much disruption to push the satellite
subsidiary, on a standalone basis, into likely insolvency.
Illustrative Analysis of Pay-TV Earnings Power in Adverse Scenario
Source: company filings, Kerrisdale analysis
Can DISH’s over-the-top live streaming TV service, Sling, turn around the business? We doubt
it. Less than a year after it debuted, industry observers are already writing it off. One recently
40 We assume ~400,000 Sling subscribers, in line with the estimates cited by TV-industry analyst Dan
Rayburn.
2015
5% sub
loss
10% sub
loss
Revenue 14,954$ 14,206$ 13,458$
Expenses:
Sub-related 8,783 8,524 8,075
As % of rev. 58.7% 60.0% 60.0%
Other (ex. D&A) 3,190 3,190 3,190
Total 11,973 11,714 11,265
EBITDA 2,980$ 2,492$ 2,193$
%Δ from 2015 (16)% (26)%
Kerrisdale Capital Management, LLC | 1212 Avenue of the Americas, 3rd Floor | New York, NY 10036 | Tel: 212.792.7999 | Fax: 212.531.6153 30
reported that Sling “has seen decelerating signups since they launched in the market. There
was a rush of sign ups when the service came out, but now, the growth has not been that
impressive,” due in part to issues with video quality and user frustrations with the inability of
multiple members of a household to stream different content simultaneously. Another pundit
even provocatively predicted that Sling TV would be dead by the end of 2016:
The streaming service…is buggy. Since its introduction last January, it has suffered
major technical failures during several highly-watched shows, such as college
basketball’s Final Four, episodes of Game of Thrones and The Walking Dead, and even
the mid-season finale of Pretty Little Liars. Numerous Sling TV users report the picture
either freezes or goes black during such high-profile programs, or they have difficulty
logging in.
It’s become undeniably clear that Sling TV is not equipped to guarantee a reliable
stream when a large number of people tune in.
The technical snafus have created negative word-of-mouth for the service, which has
kept subscriber totals under 500,000 according to several analysts.
…So I can't see Sling TV's service improving much over the next year, which will
significantly hurt its subscription efforts. Consequently, at some point, I predict that Dish
will pull the plug because it will be more trouble than it's worth.
While we expect DISH to give Sling more time to prove itself, the product’s mediocrity is a
reminder that competing against the likes of Netflix is easier said than done. Moreover, even if
the product did take off, it would likely be a Pyrrhic victory: given the relatively low price of Sling
but the high cost of some of its content, particularly ESPN, Sling is doomed to low margins, and,
given its potential appeal to DISH’s price-sensitive satellite subscribers, it runs the risk of
cannibalizing the more lucrative core product. Even if Sling sticks around, there’s no easy way
for DISH to overcome the weakness of the pay TV sector and its own particularly weak position
within it.

Kerrisdale Capital Management, LLC | 1212 Avenue of the Americas, 3rd Floor | New York, NY 10036 | Tel: 212.792.7999 | Fax: 212.531.6153 31
VII. Conclusion
DISH Network: Consensus Valuation vs. Kerrisdale View
Source: company filings, sell-side reports, Kerrisdale analysis
*Long-term debt and capital lease obligations net of cash and marketable investment
securities.
†Incorporates (1) cost of AWS-3 auction penalty based on difference between DISH's
original bids and our estimate of the fair value of the spectrum in question, (2)
estimated minimum cost of meeting the AWS-4 performance requirements by March
7, 2020, and (3) present value of designated-entity put price
Combining the consensus view of the value of DISH’s TV business with our band-by-band
analysis of the value of its spectrum portfolio, we arrive at an equity fair value of $20 per share,
58% below the current stock price. In a less probable but still quite plausible adverse scenario,
in which DISH loses its AWS-4 spectrum as a result of missed buildout deadlines, fair value
drops down to just $8 per share. From there, even modest additional impairment to the satellite-
TV business would threaten to wipe out the equity entirely.
Such price targets may seem hard to swallow; DISH’s swagger alone has convinced many that,
no matter how much it seems like there’s no real plan, everything will somehow work out
anyway. But, considered dispassionately, DISH’s current strategic direction was always a
dangerous longshot: levering up a slowly decaying business to double and triple down on an
illiquid, highly specialized, highly regulated, limited-life, non-cash-flowing asset with only two to
three plausible buyers. DISH has outlived many skeptics over the years, but, in investing as in
gambling, there’s such a thing as pressing your luck.
Kerrisdale
Market
consensus Base Adverse
Pay-TV enterprise value 15,000$ 15,000$ 15,000$
Less: net debt* 11,381 11,381 11,381
Pay-TV equity value 3,619$ 3,619$ 3,619$
Spectrum value† 18,497 5,646 118
Total equity fair value 22,117$ 9,266$ 3,737$
Equity FV per share 48$ 20$ 8$
Equity downside (58)% (83)%

Kerrisdale Capital Management, LLC | 1212 Avenue of the Americas, 3rd Floor | New York, NY 10036 | Tel: 212.792.7999 | Fax: 212.531.6153 32
Full Legal Disclaimer
As of the publication date of this report, Kerrisdale Capital Management LLC and its affiliates
(collectively "Kerrisdale") have short positions in and own options on the stock of DISH Network
Corporation (“DISH”). In addition, others that contributed research to this report and others that
we have shared our research with (collectively with Kerrisdale, the “Authors”) likewise have
short positions in, and/or own options on, the stock of DISH. The Authors stand to realize gains
in the event that the price of the stock decreases. Following publication of the report, the
Authors may transact in the securities of the company covered herein. All content in this report
represent the opinions of Kerrisdale. The Authors have obtained all information herein from
sources they believe to be accurate and reliable. However, such information is presented “as
is,” without warranty of any kind – whether express or implied. The Authors make no
representation, express or implied, as to the accuracy, timeliness, or completeness of any such
information or with regard to the results obtained from its use. All expressions of opinion are
subject to change without notice, and the Authors do not undertake to update or supplement this
report or any information contained herein.
This document is for informational purposes only and it is not intended as an official
confirmation of any transaction. All market prices, data and other information are not warranted
as to completeness or accuracy and are subject to change without notice. The information
included in this document is based upon selected public market data and reflects prevailing
conditions and the Authors’ views as of this date, all of which are accordingly subject to change.
The Authors’ opinions and estimates constitute a best efforts judgment and should be regarded
as indicative, preliminary and for illustrative purposes only.
Any investment involves substantial risks, including, but not limited to, pricing volatility,
inadequate liquidity, and the potential complete loss of principal. This report’s estimated
fundamental value only represents a best efforts estimate of the potential fundamental valuation
of a specific security, and is not expressed as, or implied as, assessments of the quality of a
security, a summary of past performance, or an actionable investment strategy for an investor.
This document does not in any way constitute an offer or solicitation of an offer to buy or sell
any investment, security, or commodity discussed herein or of any of the affiliates of the
Authors. Also, this document does not in any way constitute an offer or solicitation of an offer to
buy or sell any security in any jurisdiction in which such an offer would be unlawful under the
securities laws of such jurisdiction. To the best of the Authors’ abilities and beliefs, all
information contained herein is accurate and reliable. The Authors reserve the rights for their
affiliates, officers, and employees to hold cash or derivative positions in any company discussed
in this document at any time. As of the original publication date of this document, investors
should assume that the Authors are short shares of DISH and have positions in financial
derivatives that reference this security and stand to potentially realize gains in the event that the
market valuation of the company’s common equity is lower than prior to the original publication
date. These affiliates, officers, and individuals shall have no obligation to inform any investor or
viewer of this report about their historical, current, and future trading activities. In addition, the
Kerrisdale Capital Management, LLC | 1212 Avenue of the Americas, 3rd Floor | New York, NY 10036 | Tel: 212.792.7999 | Fax: 212.531.6153 33
Authors may benefit from any change in the valuation of any other companies, securities, or
commodities discussed in this document. Analysts who prepared this report are compensated
based upon (among other factors) the overall profitability of the Authors’ operations and their
affiliates. The compensation structure for the Authors’ analysts is generally a derivative of their
effectiveness in generating and communicating new investment ideas and the performance of
recommended strategies for the Authors. This could represent a potential conflict of interest in
the statements and opinions in the Authors’ documents.
The information contained in this document may include, or incorporate by reference, forward-
looking statements, which would include any statements that are not statements of historical
fact. Any or all of the Authors’ forward-looking assumptions, expectations, projections, intentions
or beliefs about future events may turn out to be wrong. These forward-looking statements can
be affected by inaccurate assumptions or by known or unknown risks, uncertainties and other
factors, most of which are beyond the Authors’ control. Investors should conduct independent
due diligence, with assistance from professional financial, legal and tax experts, on all
securities, companies, and commodities discussed in this document and develop a stand-alone
judgment of the relevant markets prior to making any investment decision.