DISENTANGLING THE EFFECTS OF DEFORESTATION AND...
95
1 DISENTANGLING THE EFFECTS OF DEFORESTATION AND INDIGENOUS HUNTING ON WILDLIFE IN THE AMAZON By PEDRO DE ARAUJO LIMA CONSTANTINO A THESIS PRESENTED TO THE GRADUATE SCHOOL OF THE UNIVERSITY OF FLORIDA IN PARTIAL FULFILLMENT OF THE REQUIREMENTS FOR THE DEGREE OF MASTER OF SCIENCE UNIVERSITY OF FLORIDA 2010
Transcript of DISENTANGLING THE EFFECTS OF DEFORESTATION AND...
1
DISENTANGLING THE EFFECTS OF DEFORESTATION AND INDIGENOUS HUNTING ON WILDLIFE IN THE AMAZON
By
PEDRO DE ARAUJO LIMA CONSTANTINO
A THESIS PRESENTED TO THE GRADUATE SCHOOL OF THE UNIVERSITY OF FLORIDA IN PARTIAL FULFILLMENT
OF THE REQUIREMENTS FOR THE DEGREE OF MASTER OF SCIENCE
UNIVERSITY OF FLORIDA
2010

2
© 2010 Pedro de Araujo Lima Constantino

3
To my father

4
ACKNOWLEDGMENTS
My family gave me the support needed to start working with indigenous people,
even not understanding what I was doing “no meio do mato”. The support continued
during my graduate education. Ana, thanks for courageously accepting the challenge of
spending two years in Florida, despite all the fears and difficulties we knew we would
face, and still keep staying by my side, my “companheira”. Ana, my sister, you was
especially important to me, challenging me to look into myself. Mãe, I admire you. Pai,
thanks for your courage and perseverance. The influence you have in my life and
decisions are impressive, stronger than I even realize. Dulce, thanks for all the love you
have to my father. Vô, vó, you are the persistence and kindness. Thanks Livia and
Hector for helping us whenever we needed! Thanks to our family of friends we
discovered in Gainesville.
All the Kaxinawá and Katukina people involved in the monitoring program are co-
authors of this research since they are collecting and analyzing hunting data in their
own village. However, a large scale analysis made it impossible to include all
participants as authors. I would like to give thanks for the support provided by Brian
Child, Marianne Schmink, and Robert Fletcher, and valuable comments of E.H.M.
Vieria-Neto, J. Lucchetti, and C. Pizano during early drafts. Comissão Pró-Índio do Acre
(CPI-AC) and Associação do Movimento dos Agentes Agroflorestais Indígenas do Acre
(AMAAI-AC) provided part of the data and logistic support for field work. The School of
Natural Resources and Environment, the Tropical Conservation and Development
Program and the Amazon Conservation Leadership Initiative at the University of Florida,
and the Wildlife Conservation Society financially supported the first author’s
assistantship and field research and community workshops. The Nature Conservancy

5
and Gordon and Betty Moore Foundation supported CPI-AC in the Transfrontier
Conservation Project Sierra/Serra del Divisor.

6
TABLE OF CONTENTS page
ACKNOWLEDGMENTS ...................................................................................................... 4
LIST OF TABLES ................................................................................................................ 8
LIST OF FIGURES .............................................................................................................. 9
LIST OF ABBREVIATIONS .............................................................................................. 10
ABSTRACT........................................................................................................................ 11
CHAPTER
1 INTRODUCTION ........................................................................................................ 13
The Bushmeat Crisis in the Amazon.......................................................................... 13 Wildlife Conservation in Amazonian Protected Areas ............................................... 14 Pano People and Wildlife in Acre ............................................................................... 15 Assessing Wildlife Abundance Using Hunting Data .................................................. 15 Objectives ................................................................................................................... 18 Research Questions ................................................................................................... 18
2 METHODOLOGY ....................................................................................................... 19
Study Area .................................................................................................................. 19 Acre Ecological-Economic Zoning ............................................................................. 20 Pano Hunting .............................................................................................................. 20 Data Collection and Sources ...................................................................................... 21
Hunting Data ........................................................................................................ 21 Socio-economic Data ........................................................................................... 22 Spatial Data .......................................................................................................... 22
Wildlife Status Indicators ............................................................................................ 23 Statistical analysis ...................................................................................................... 25
Selecting Appropriate Indicator of Distance of Preferred Hunted Animals to the Village ......................................................................................................... 25
Drivers of Wildlife Depletion across Pano Communities .................................... 25 Linear multiple regression ............................................................................. 25 Spatial dependency ....................................................................................... 26 Capacity of indigenous lands to protect wildlife against external threats .... 27
3 RESULTS.................................................................................................................... 30
Pano Hunter’s Prey Profiles ....................................................................................... 30 Information Provided by Indicators of Wildlife Status ................................................ 30 Drivers of Wildlife Depletion across Pano Communities ........................................... 31

7
Spatial Dependence ................................................................................................... 34 Capacity of Indigenous Lands to Protect Wildlife against External Threats ............. 34
4 DISCUSSION .............................................................................................................. 51
Wildlife Status nearby Pano Communities................................................................. 51 Drivers of Wildlife Depletion ....................................................................................... 52
Effects of Indigenous Hunting Pressure on Game.............................................. 53 Effects of Deforestation around Villages on Game ............................................. 54 Effects of Surrounding Disturbance: the Acre State Zoning ............................... 56 Effects of Roads on Wildlife and Hunters............................................................ 58
Source-sink Dynamics of Game Populations ............................................................ 60 Indigenous Lands as Protected Areas for Wildlife..................................................... 61 Management Implications and State Conservation Policy ........................................ 62 Considerations on Scale and the Absence of Hunting Effect ................................... 64
5 CONCLUSIONS.......................................................................................................... 70
APPENDIX
A KERNEL DENSITY ESTIMATES OF DISTANCE OF PREFERRED ANIMALS HUNTED FROM THE VILLAGE ................................................................................ 71
B WILDLIFE STATUS INDICATORS AND ITS RELATED ECOLOGICAL MODELS AND THEORIES ........................................................................................ 73
C PEARSON’S CORRELATION MATRIX OF VARIABLES POSSIBLY INFLUENCING HUNTING IN INDIGENOUS VILLAGES, CONSIDERING 29 VILLAGES ................................................................................................................... 75
LIST OF REFERENCES ................................................................................................... 78
BIOGRAPHICAL SKETCH................................................................................................ 95

8
LIST OF TABLES
Table page 2-1 Defensibility of Pano Indigenous Lands against external threats ......................... 29
3-1 Wildlife species hunted by Pano communities in Acre, Brazilian Amazon, during this study ..................................................................................................... 37
3-2 Relative importance of prey taxa to Pano communities........................................ 39
3-3 Characteristics of Pano villages in the State of Acre, Brazilian Amazon, and absent species........................................................................................................ 39
3-4 Pearson correlation matrix between simple indicator variables of wildlife depletion in Pano villages ...................................................................................... 41
3-5 Principal Component Analysis axis of wildlife abundance simple indicators ....... 41
3-6 Backward stepwise regression models for all response variables at the village level ............................................................................................................. 42
3-7 Explanatory variables included in the final regression models after stepwise and supervised selection ....................................................................................... 43
3-8 Spatial dependence of response variables and residuals of final regression models .................................................................................................................... 43
3-9 Student's t tests on wildlife indicators between villages protected and vulnerable to external threat .................................................................................. 44
3-10 Pearson's correlations between indicators of wildlife status that were driven by deforestation and the total deforestation within 5km radius area .................... 44
3-11 Pano Indigenous Lands with total area that would support the average local people harvesting of preferred species in the Amazon......................................... 45
9
LIST OF FIGURES
Figure page 2-1 Kaxinawá and Katukina Indigenous Lands studied in Acre State, Brazilian
Amazon ................................................................................................................... 28
3-1 Relative contribution of wildlife species to Pano diet ............................................ 46
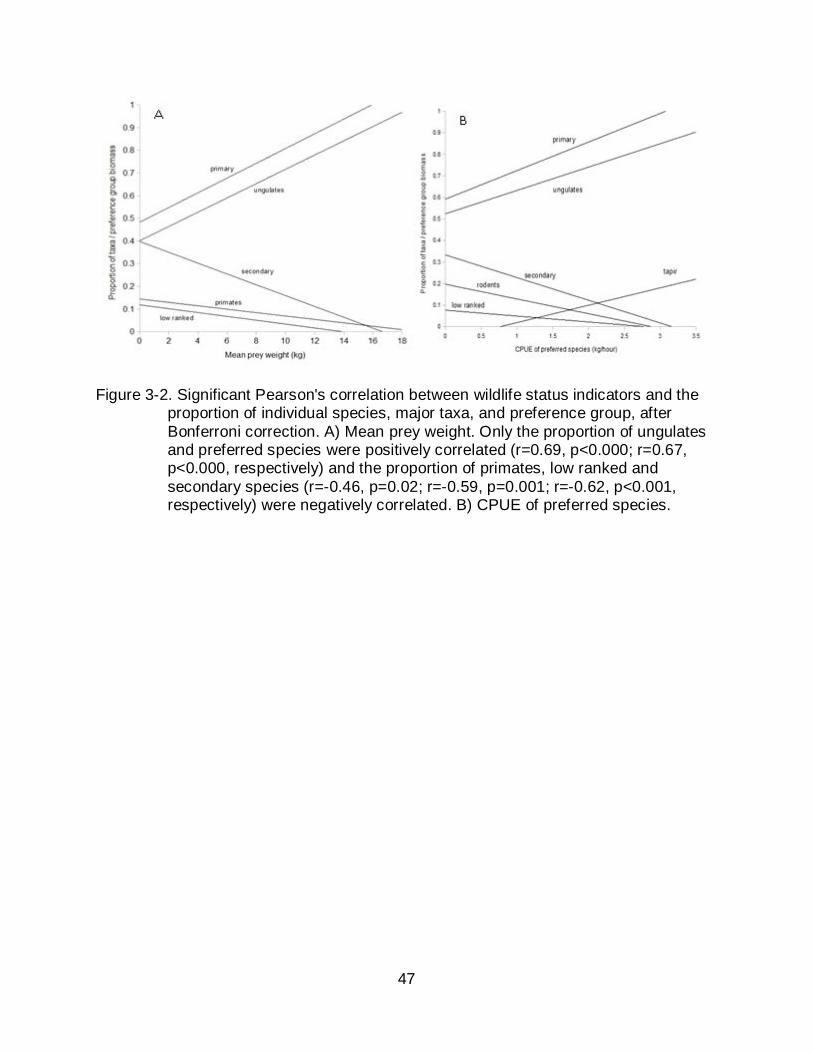
3-2 Significant Pearson's correlation between wildlife status indicators and the proportion of individual species, major taxa, and preference group, after Bonferroni correction .............................................................................................. 47
3-3 Minimal linear regression models after backward stepwise selection .................. 48
3-4 Examples of non significant Pearson's correlation between hunting pressure, deforestation and indicators of wildlife status........................................................ 49
3-5 Box-plot of wildlife indicators among Indigenous Lands of different levels of defensibility against external threats to wildlife ..................................................... 50
10
LIST OF ABBREVIATIONS
AMAAI-AC Associação do Movimento dos Agentes Agroflorestais Indígenas do Acre
CPI-AC Comissão Pró-Índio do Acre
CPUE Capture-per-unit-effort
IAA Indigenous Agroforestry Agents
IL Indigenous Land
PRODES Projeto Prodes - Monitoramento da Floresta Amazônica Brasileira por Satélite

11
Abstract of Thesis Presented to the Graduate School of the University of Florida in Partial Fulfillment of the Requirements for the Degree of Master of Science
DISENTANGLING THE EFFECTS OF DEFORESTATION AND INDIGENOUS
HUNTING ON WILDLIFE IN THE AMAZON
By
Pedro de Araujo Lima Constantino
May 2010
Chair: Brian Child Major: Interdisciplinary Ecology
The decline in wildlife populations in the Amazon threatens game species and
forest dwellers subsisting from hunting. Deforestation and overhunting are the most
commonly reported causes of depletion. Few studies assessed game drivers at regional
scale, or they did not consider the effects of hunting and habitat loss. Indigenous people
in the Brazilian State of Acre largely rely on wildmeat, although many villages
experience game depletion. I worked with the Pano people of Acre to understand the
drivers of game depletion across villages and Indigenous Lands. I derived four simple
indicators and two multivariate indicators of wildlife status from ecological models to
analyze 9109 hunting records from 35 Pano indigenous villages of eight Indigenous
Lands between 2005 and 2009 in the Alto Juruá and Purus valleys. I conducted multiple
regression analyses to identify the drivers of variation in animal dispersion, game
populations, richness of sensitive species, and hunting success across villages. I
supplemented these regressions with ANOVA of wildlife status in relation to village
vulnerability and Indigenous Lands defensibility to external threats. Indigenous hunting
pressure was not associated to forest loss in Pano hunting territory. Deforestation
explained between 30% and 56% of variation in mean prey weight, richness of sensitive
12
species and capture-per-unit-effort. Indigenous density and road presence explained
30% of variation in the distance of animals from villages. Deforestation and hunting may
have affected game species at two different spatial scales, the former at a large scale
whereas the latter at a local scale. Deforestation and its related disturbances were the
probable drivers of game depletion, possibly leading to the extirpation of sensitive
species. Pano hunting pressure might only affect wildlife close to villages by changing
population dispersion, although, not necessarily depleting them. Vulnerable villages and
Indigenous Lands with low defensibility against external threats had more depleted
wildlife than protected ones. Non-indigenous hunting and deforestation outside
Indigenous Lands probably negatively affected wildlife hunted by Pano people. Other
studies indicate hunting pressure as the main cause of depletion. The regional scale of
a heterogeneous landscape intensively hunted for decades might help to explain the
difference found in the drivers of game depletion across Pano villages. Deforestation
can determine game conservation even in a little altered Amazon region. Indigenous
Lands may be able to inhibit forest loss but not game depletion. The future scenario of
reduced deforestation foreseen by the Acre State Government, depending on the
execution of recent state policies, man avoid the current trend of regional wildlife
depletion as a result of habitat loss.
13
CHAPTER 1 INTRODUCTION
The Bushmeat Crisis in the Amazon
The recent decline in populations of large-bodied game species in tropical forests
worldwide led to the recognition of a global “bushmeat crisis", which threatens forest
ecosystems and its people (Milner-Gulland et al. 2003; Nasi et al. 2008). Large bodied
mammals provide most of the wildmeat consumed in the tropics (Jerozolimski and
Peres 2003; Fa et al. 2005) and their survival is threatened mainly by habitat loss
occurring at unprecedented rates (Brook et al. 2008; Davidson et al. 2009) and
overhunting to supply rural and urban populations (Isaac and Cowlishaw 2004;
Robinson and Bennett 2004; Cardillo et al. 2005; Peres and Palacios 2007). In terms of
conservation policy, however, the important debate over the relative threats posed by
deforestation and hunting pressure remains open, even though these factors may
interact (Brook et al. 2008; Laurance and Useche 2009). Hunters in unaltered forests
represent the single anthropogenic disturbance to game populations. Even indigenous
people hunting for subsistence can locally deplete wildlife (Souza-Mazurek et al. 2000;
Peres and Nascimento 2006). It is controversial, though, if their impact alone depletes
game species at regional scales, given their centenary widespread use of wildlife
(Robinson and Bodmer 1999; Smith 2005; Milner-Gulland and Rowcliffe 2007; Adeney
et al. 2009; Levi et al. 2009; Rist et al. 2009).
Several Neotropical indigenous groups increasingly hunt in regions that
encompass both undisturbed and anthropogenically altered habitats (Smith 2005, 2008;
Gavin 2007), and are potentially subject to multiple drivers of wildlife depletion. Yet,
many studies did not properly differentiate between these factors (Peres 2001; Daily et

14
al. 2003; Smith 2005; Fa 2007; Fa and Brown 2009) or were conducted at scales
inappropriate to policy formulation, given that the effects of these drivers change
depending on the scale of study (Palmer and White 1994; Fragoso 1999; Ferrier 2002;
Fisher and Owens 2004; Pautasso 2007; Cardillo et al. 2008; Fritz et al. 2009).
Wildlife Conservation in Amazonian Protected Areas
Protected Areas in the Amazon are mostly established to prevent and combat
threats to biodiversity (Margules and Presley 2000; Brooks et al. 2009). Although titled
for different purposes, Indigenous Lands are fundamental for conservation
(Schwartzman and Zimmerman 2005; Malhi et al. 2008) because they cover
approximately 21% of the Brazilian Amazon (Carneiro Filho and Souza 2009). They
figure among the most effective Amazonian Protected Areas in maintaining biodiversity,
and inhibiting deforestation and forest degradation (Asner et al. 2005; Oliveira et al.
2007; Adeney et al. 2009) possibly better than other Conservation Units in Brazil
(Nepstad et al. 2006). Nonetheless, the consequences of indigenous subsistence
hunting have been used to argue against the sustainable use policy inside Protected
Areas (Redford and Sanderson 2000; Schwartzman et al. 2000; Peres and Zimmerman
2001; Schwartzman and Zimmerman 2005; Sunderland et al. 2008) in a debate that
questions the conservation outcome of Protected Areas of sustainable use (Peres and
Zimmerman 2001; Terborgh 2004; Brockington et al. 2006; Sirén 2006; Buck et al.
2007; Hames 2007). The degree to which Indigenous Lands are able to conserve
wildlife remains unclear because of the absence of available data at regional scale
(Barreto et al. 2006; Nepstad et al. 2006; Adeney et al. 2009).

15
Pano People and Wildlife in Acre
The debate and issues presented above is exemplified by the Pano Indigenous
Lands in the Brazilian State of Acre, southwestern Amazon, a region characterized by
increasing deforestation (yet low in comparison to other Brazilian states; Acre 2009;
Hayashi et al. 2009), elevated hunting pressure (Peres and Palacios 2007) but where
most large game species are still hunted (Calouro 2005; Ramos 2005; Constantino et
al. 2008). Indigenous Lands are an important component of Acre environmental policy
and conservation strategy, covering 14% of the state (Iglesias and Aquino 2006; Acre
2008). The Kaxinawá and Katukina are peoples of the Pano linguistic family, the most
populous group in the region, for whom large game species are the preferred source of
meat (Kensinger 1975, 1983; Deshayes 1986; Aquino and Iglesias 1994; Cunha and
Almeida 2002; Amaral 2005). The reduced abundance of preferred game species in
some Indigenous Lands, however, shifts reliance to alternative meats, purchased in city
markets or raised in villages (Lima 2001; Calouro 2007). It has been suggested that the
Kaxinawá hunting pressure had extirpated several species (Peres and Zimmerman
2001), and these data were used to understand hunting impacts on wildlife in the
Amazon basin (Peres 2000; Peres and Palacios 2007). Other evidence suggests,
however, that some Kaxinawá Indigenous Lands have allowed recovery of several
depleted game species (Constantino et al. 2008).
Assessing Wildlife Abundance Using Hunting Data
Human-mediated disturbances can induce three main negative responses of game
assemblages: 1) reduction in population abundance, 2) species extirpation, and 3)
dispersion of individuals and populations. However, this is not exhaustive (e.g. some
16
species can increase abundance, or animals can differ in stress levels, body conditions,
etc.).
Surveying vertebrates by direct observation is hard and expensive in tropical
forests (Naughton-Treves et al. 2003; Fa et al. 2005; Norris et al. 2008), especially in
harvested areas where animals are wary of people (Fitzgibbon 1998), imposing
limitations on this method (Carrillo et al. 2000). Consequently, research on hunter
societies and wildlife conservation, often uses hunting data and a variety of indicators to
assess population abundance as well as identify its drivers (Appendix A; Juste et al.
1995; Souza-Mazurek et al. 2000; Nagaoka 2002; Rowcliffe et al. 2003; Fa et al. 2004;
Crookes et al. 2005; Franzen 2006; Albrechtsen et al. 2007; Ohl-Schacherer et al. 2007;
Norris et al. 2008; Levi et al. 2009).
The central place foraging model links resource depletion to local harvesting
intensity. This model assumes that hunting pressure within a limited territory departing
from a fixed settlement first depletes wildlife close to the settlement, subsequently
increasing the distance where species sensitive to hunting are caught from the
settlement (Sirén et a. 2004; Levy et al. 2009). Therefore, the distance that desirable
species are hunted from settlements indicates the wildlife status in response specifically
to central place hunting pressure (Alvard et al. 1997; Hill et al. 1997; Cannon 2003; Ohl-
Schacherer et al. 2007; Smith 2008; Levi et al. 2009).
The status of wildlife population can also be assessed by indicators derived from
Optimal Foraging Theory. Crudely, this theory predicts that hunters hunt more animals
of lower ranked species, as the relative cost of hunting them declines compared to
higher ranked species (Hames and Vickers, 1982; Smith 1983; Winterhalder and Lu

17
1997; Rowcliffe et al. 2003). The addition of new species to, and increasing frequencies
of less preferred species in hunter’s prey profile, is a response to the decline in
abundance of preferred species (Smith 1983; Rowcliffe et al. 2005; Parry et al. 2009a).
This framework has been applied to assess the effects of indigenous and non-
indigenous Amazonian hunting (Alvard 1993, 1995; Hames and Vickers 1982,
Jerozolimski and Peres 2003). The premises of Optimal Foraging Theory applied to
hunters that prefer large-bodied animals allowed researchers to use the mean weight of
hunted animals to assess the variation of wildlife status (Jerozolimski and Peres 2003;
Fa et al. 2005; Franzen 2006; Ohl-Schacherer et al. 2007; Constantino et al. 2008;
Parry et al. 2009a).
The capture-per-unit-effort (CPUE) of game species is often used to evaluate
variation in populations' abundance, given that hunters have to spend more time hunting
in depleted sites to have similar return rates compared to non depleted sites (Souza-
Mazurek et al. 2000; Hill et al. 2003; Sirén et al. 2004; Puertas and Bodmer 2005).
While mean prey weight indicates the status of a group of high ranked species, CPUE
allows the assessment of the abundance of individual species (Sirén et al. 2004; Parry
et al. 2009a, b). Nevertheless, CPUE is a measurement of effort and should be carefully
analyzed in order to provide estimates of wildlife status (Rist et al. 2008).
In the extreme cases of extirpation or drastic reduction in density, the species is no
longer present in the hunter’s prey assemblage. Certain large primates, birds and
ungulates in the Amazon are less resilient to habitat disturbance and hunting pressure,
and thus, more prone to extirpation (Robinson 1996; Peres 2000; Peres et al. 2003;
Peres and Nascimento 2006; Michalski and Peres 2007; Barlow et al. 2007; Peres and

18
Palacios 2007; Boyle 2008; Takahashi 2008; Parry et al. 2009b). These species are
often used as indicators of wildlife community status in the Neotropics (Daily et al. 2003;
Parry et al. 2007). Given that these species are ranked high among Amazonian hunters,
their absence in prey profiles may be a proxy of wildlife depletion close to hunter
settlements instead of a consequence of narrowing diet breadth expected by Optimum
Foraging Theory, in cases of high abundances of preferred prey (Smith 1983).
Objectives
In this study I analyzed the regional scale effects of deforestation and hunting on
wildlife consumed in Indigenous Lands based on hunting data from Pano villages in
Acre. I also related wildlife status to the level of defensibility of Indigenous Lands
against non-indigenous disturbances. I developed indicators based on ecological
models to assess different perspectives on wildlife responses to disturbances, and used
multivariate indicators to combine these responses. Findings are discussed regarding
the recent environmental and development political agenda of Acre State.
Research Questions
1. What are the drivers of variation of wildlife hunted by Pano people at the village level?
2. Are Pano Indigenous Lands able to conserve wildlife against surrounding threats?
19
CHAPTER 2 METHODOLOGY
Study Area
The eight Pano Indigenous Lands studied in the Brazilian State of Acre,
southwestern Amazon, were titled between the 1980s and 2002. They are located in the
Alto Juruá and Alto Purus valleys in Acre State, specifically in two tributaries of the
Juruá river, the Breu and Tarauacá, and two tributaries of the Tarauacá river, the
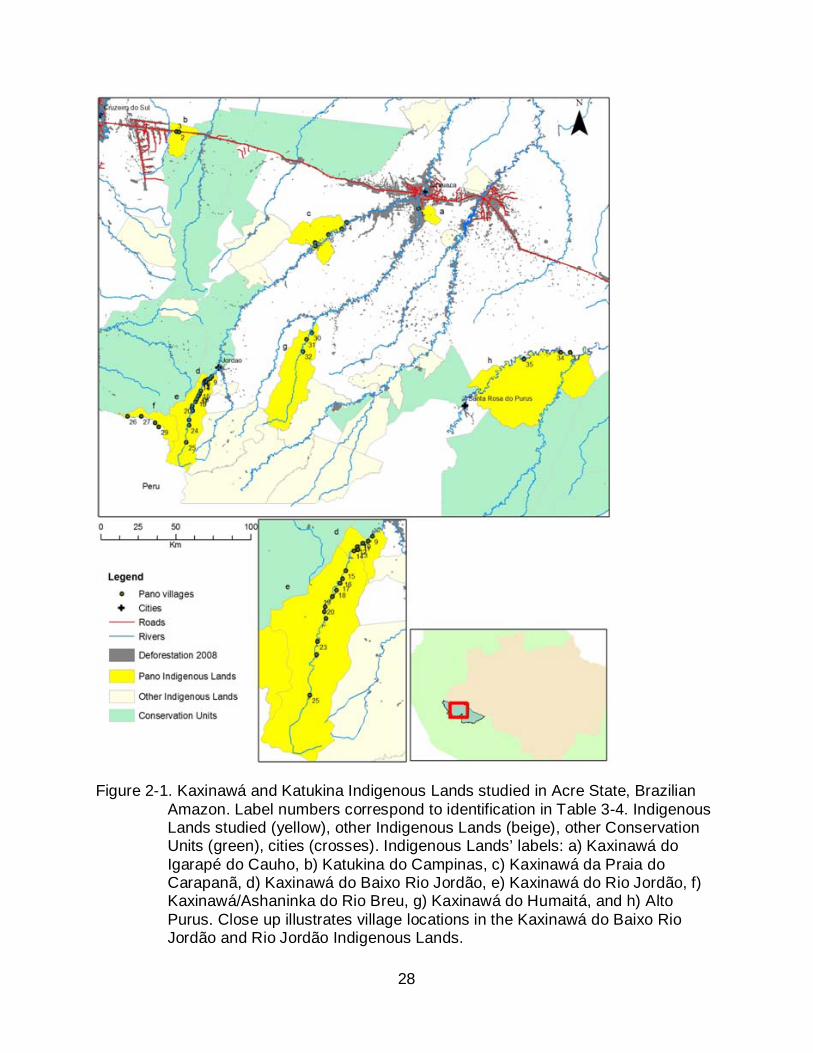
Jordão and Humaitá rivers, as well as along the Purus river (Figure 2-1). Approximately
4500 people live in these Indigenous Lands, comprising about 50% of titled areas for
Pano people in Acre. Villages vary in their degree of linkage to markets in the most
populous cities of Cruzeiro do Sul, Tarauacá and Feijó. The small urban centers of
Jordão, Santa Rosa do Purus and Marechal Thaumaturgo have some of the lowest HDI
in Brazil (PNUD 2003). Villages in Campinas and Igarapé do Caucho Indigenous Lands
have road access to cities, whilst other villages access market by boat (Figure 2-1).
The region is embedded in the Southwestern Amazon Moist Forest ecoregion
(TNC 2009), one of the priority ecoregions for Neotropical terrestrial vertebrate
conservation, in particular for endemic species (Loyola et al. 2009). Predominant
vegetation can be characterized as typical Terra Firme forest, dominated by open
canopy with palm trees and natural patches of bamboo in clay soils (Silveira et al. 2002;
Acre 2006). The exception is the Alto Purus Indigenous Land that has portions of the
Iquitos Várzea ecoregion. Precipitation ranges from 1600 to 2000 mm/year (Sombroek
2001), causing little variation in ungulate abundances (Robinson and Bennett 2004;
Mandujano and Naranjo 2010).
20
Acre Ecological-Economic Zoning
The Pano Indigenous Lands are under low threat compared to other Indigenous
Lands in the Amazon (Carneiro Filho and Souza 2009). Within the state of Acre,
however, Indigenous Lands are located in zones of different land use and development
planning. The State Ecological-Economic Zoning indicated four major zones of
planning, three of which are relevant to this study. The area surrounding the highways
composes Zone 1, characterized as the development frontier of the state. Zone 2
encompasses all Protected Areas, including Indigenous Lands. Zone 4 comprises urban
areas and its surroundings, sometimes including Indigenous Lands (Acre 2000).
Beyond this zoning, the studied region can be spatialized as: 1) the development
frontier alongside the BR-364, comprising the largest cities and the Campinas, Igarapé
do Caucho and Praia do Carapanã Indigenous Lands, and 2) the international frontier
with Peru, comprising most Protected Areas and the other Pano Indigenous Lands
(Figure 2-1). The mosaic of Protected Areas along the border with Peru composes the
Western Amazon Ecological Corridor (Brackelaire 2005).
Pano Hunting
The Kaxinawá and Katukina share cultural similarities, general to most Pano
people. Hunting is a prestigious male activity, and wildlife is fundamental to structure
communities through meat sharing, providing meat, and is strongly present in medicine
and cosmology (Kensinger 1975, 1995; Almeida et al. 2002; Lima 2002; Aquino and
Iglesias 1994; Lagrou 2004). Hunters prefer larger animals (Table 2-1) such as
ungulates, large primates, reptiles, and understory birds, with few exceptions, that are
hunted whenever encountered. Smaller species of secondary preference are hunted
incidentally when hunters do not succeed in hunting preferred animals. The most
21
common hunting strategy is the single man one-day search for animals following
defined tracks and its surroundings (Deshayes 1986; Navarro 2004; Constantino et al.
2008). The shotgun has substituted traditional bow-and-arrows for hunting. The ideal
hunting territory of an isolated Pano village has a circular shape smaller than 6km from
the center of the village, which is exclusively used by village members (Kensinger 1975;
Navarro 2004). Although the actual Pano hunting territory is modified by the presence of
nearby villages or Indigenous Land’s boundary limits to reduce overlap between
adjacent villages, the maximum distance of one-day hunts does not go beyond 6km
(Bant and Pessoa 2008). One way Pano hunters evaluate wildlife abundance is
estimating the straight distance, in minutes walking, to where the highest number of
preferred animals is hunted (Kensinger 1975; Constantino et al. 2008).
Data Collection and Sources
Hunting Data
Kaxinawá and Katukina representatives participate in a long-term capacity-building
program for environmental management led by the local NGO Comissão Pró-Índio do
Acre (CPI-AC). These representatives are paid by the State Government to provide
extension work as Indigenous Agroforestry Agents (IAAs) in their communities. The
wildlife monitoring program was added to the capacity-building program in 2004 and is
facilitated by the IAA, who engages other community members (Constantino et al.
2008). In Acre, 45 IAAs collect hunting data in spreadsheets containing hunting effort
(date, number of hunters, and time spent hunting) and success (species, weight, sex,
approximate age, and straight distance where caught from the village). Between 2004
and 2009 the total number of hunted animals recorded by these villages was 13,540.
Out of this population, I selected 35 villages (33 Kaxinawá and two Katukina) from eight

22
Indigenous Lands, corresponding to approximately 33% of all Kaxinawá and 28% of all
Katukina villages in Acre excluding villages according to the following criteria: 1) hunting
records only to the first year of monitoring training, 2) less than six months of hunting
records and less than 50 hunted animals recorded, 3) only records on preferred species
hunted. The 35 selected villages recorded hunting 9109 animals between 2005 and
2009. I surveyed the georreferenced locations and recorded the IAA distance estimation
in minutes of 65 hunted animals and landscape features that orient the indigenous
hunts in 2006 and 2009 using GPS Garmin Csx60, and used the relationship to convert
the distance of hunted animals from the village from minutes to meters.
Socio-economic Data
I used socio-economic data (e.g. population, number of hunters and employees,
permanent goods, livestock etc.) collected from villages in Acre by CPI-AC since 2004.
In addition, I updated the information for 17 communities during workshops held in
villages between April and July 2009.
Spatial Data
Deforestation maps were obtained from the Program for Monitoring Deforestation
in the Brazilian Amazon (PRODES; http://www.dpi.inpe.br/prodesdigital/prodes.php).
PRODES information estimates a cumulative increase in deforested area, and hence,
does not account for forest regrowth (INPE 2005). Nevertheless, PRODES provides the
best dataset available in a regional scale for the area (DeFries et al. 2005) and has
been widely used in land use research (Asner et al. 2005; Morton et al. 2006; Aragão et
al. 2008; Broadbent et al. 2008; Broich et al. 2009) and planning (Acre 2009). The
analyses of wildlife status are, thus, related to original forest cover loss in the period
compatible to hunting data, and not necessarily to the current non-forest area. I
23
estimated zero deforestation in the Peruvian border near the four villages located in the
Breu Indigenous Land (Figure 2-1), because no geographic data on deforestation was
available. This is reasonable since this is one of the most remote and unchanged forest
in Peru (CDC-UNALM 2006; Oliveira et al. 2007; Constantino P.A.L, personal
observation). Spatial analyses were performed using ArcMap 9.3.
I used a 5km radius buffer to calculate the deforestation and density of indigenous
people near each Pano village. This area corresponds to the current ideal Pano hunting
territory (Constantino P.A.L, unpublished data). All villages hunt most of their preys
within these limits (Appendix A). Other studies estimate the same hunting area for one-
day hunts of indigenous and non-indigenous Amazonian groups (Stearman 1990;
Bonaudo et al. 2005).
Wildlife Status Indicators
I assessed wildlife status in response to anthropogenic disturbance across the 35
villages using three simple indicators supported by ecological theories presented above:
1) mean prey weight of hunted animals, 2) richness of human-sensitive species, and 3)
mode of straight distance at which preferred animals were caught from the village. In
addition, I used the capture-per-unit-effort (CPUE) of hunted animals of preferred
species, in terms of biomass, as another indication of overall abundance variation for 21
villages (Appendix B). The distance of hunted animals to the village is the only indicator
assuming that hunting pressure is the main driver of wildlife variation (Levi et al. 2009).
Although the other indicators attempt to reflect variation in wildlife status through
species availability to hunters, they do not assume a priori the underlying cause of
wildlife variation (Rist et al. 2009). Hence, the four indicators would reflect the same
trend if hunting pressure was the main factor driving wildlife population variation. All
24
indicators were normally distributed. I conducted pairwise Pearson’s correlations
between the four indicators of wildlife status to assess the difference in information
provided. None of these indicators were correlated with monitoring effort (all -0.1<r<0.2,
p>0.1), except for the number of sensitive species. This correlation was significant
because of two villages located in an exceptionally conserved forested that recorded
more than 30 months of data (Japinim and Vida Nova). There was no significant
correlation if those villages are excluded from correlations (r=0.3, p=0.09). Other
villages in the same Indigenous Land (i.e. Breu) had lower effort but the same number
of species. Therefore, I assume no effect of sampling on observed variation.
Furthermore, excluding these villages did not change multiple regression results.
Likewise, monitoring effort had no effect if included in multiple regression models.
The ecological models from which these indicators derive have the following
main assumptions: 1) equally random distribution of animals throughout landscape, both
at the hunting territory and across the region, 2) hunters always seek large animals,
although Amazonian hunters sometimes search small animals in their gardens for a
single meal, 3) the return from other types of hunting (i.e. sit-and-wait) is minimal. In
addition, there are some possible problems with hunting data in estimating wildlife
status: 1) this study do not include animals killed after escaping from hunters, usually
larger animals and primates, underestimating the effect of hunting on these populations,
2) hunters did not record effort time of unsuccessful hunts overestimating values of
CPUE, 3) other researches indicate that hunting data can be biased due to unrecorded
small animals, however, this bias should be the same to all villages (Jerozolimski and
25
Peres 2003). Nonetheless, indicators of wildlife status based on ecological models
using hunting data are widely reported in the literature.
In addition to the simple indicators, I created multivariate indicators that capture
the joint response of wildlife assemblage. These indicators resulted from a Principal
Component Analysis that considered the mean prey weight, number of sensitive
species and the mode distance of animals of the 35 villages. Principal components with
eigenvectors corresponding to more than 80% cumulative variation in the data were
selected. CPUE was not included because of missing data.
Statistical analysis
Selecting Appropriate Indicator of Distance of Preferred Hunted Animals to the Village
The estimation of wildlife distance to the village has been assessed elsewhere
using the mean distance of hunted animals (Ohl-Schacherer et al. 2007). Instead, I
selected the mode of the distance where animals of preferred species were hunted from
the village), because data were not normally distributed (Appendix A). This distribution
is likely to be a result of hunting pressure that is higher close to the village center (Levi
et al. 2009). I estimated mode distance of hunted animals using the Gaussian kernel
density estimator, a statistical technique often applied to study animals' use of space
(Seaman and Powell 1996; Gitzen et al. 2006).
Drivers of Wildlife Depletion across Pano Communities
Linear multiple regression
I used multiple linear regressions to identify the drivers of wildlife status across
Pano villages. I regressed the six wildlife status indicators (i.e. four simple indicators
and two multiple indicators) against explanatory variables related to hunting pressure,
26
land use change and socio-economic condition of Pano communities (Appendix C). The
explanatory variables were transformed (i.e. log10 or square root) when needed to
achieve normal distribution. In order to avoid multicolinearity, I conducted pairwise
Pearson's correlations between the 12 continuous explanatory variables before running
the regression models, selecting for variables with fewer correlations and more
accurately measured. The remaining variables used to build the full models were: the
density of indigenous people in a 5km radius; village age; actual indigenous population
in the village (hunting pressure); animal unit (socio-economic condition); and log10
deforested area (land use). The nominal variable “presence of the road” was also used
in model building. The former three variables were used as proxy to hunting pressure
and suggested to drive wildlife to decline elsewhere (Jerozolimski and Peres 2003;
Brashares et al. 2001).
I selected the minimal model for each wildlife indicator excluding unrelated
explanatory variables from the full model (p>0.1) through backward stepwise
elimination. I supplemented the backward selection with the analysis of all-possible-
subset models (Neter et al. 1985) checking for AICc (considering a variation in 2.0 as
significant), the consistency in variables entrance in models, and the signals of
estimates. I selected all the possible final models for each response variables. This
additional procedure reduces the selection of spurious patterns that can be present in
multiple regressions with low ratio of response/explanatory variables.
Spatial dependency
The home range of some important game species (e.g. white-lipped peccary) can
be as large as the 5km radius area used to estimate deforestation and density of
indigenous people (Fragoso 1998; Reina-Hurtado et al. 2009). As a consequence, the

27
spatial distribution of villages could give rise to spatial dependence of wildlife status
indicators and induce erroneous conclusions regarding drivers of wildlife variation. I
used the Moran’s I test for spatial dependence to analyze of wildlife indicators and
residuals of minimal regression models using ArcMap 9.3.
Capacity of indigenous lands to protect wildlife against external threats
I analyzed the effects of surrounding disturbances on wildlife hunted in Pano
villages in two levels: the village level and the Indigenous Land level. At the village level,
those villages with a portion of the 5km radius outside of Protected Areas were
considered vulnerable to external threats, whilst others were considered protected.
Student t-tests were conducted to evaluate differences of wildlife indicators between
these two groups.
Nonetheless, village vulnerability to external threats may be a result of the poor
design and location of Indigenous Lands. Therefore, at the Indigenous Land level, I
followed Peres and Terborgh’s (1995) categorization of reserve defensibility to label
Indigenous Lands according to their design and location in the state (Table 2-1). I
grouped villages pertaining to Indigenous Lands as low, medium, or high defensibility
against external threats. I tested the differences of wildlife status between these groups
using ANOVA and Tukey-Kramer HSD tests. All statistical analyses were performed in
the software JMP8. In addition, I compared the size of Pano Indigenous Lands to the
minimum area required to maintain sustainable harvest (Peres 2001) of eight preferred
species, considering the annual per capita harvest rates of local people throughout the
Amazon.
28
Figure 2-1. Kaxinawá and Katukina Indigenous Lands studied in Acre State, Brazilian Amazon. Label numbers correspond to identification in Table 3-4. Indigenous Lands studied (yellow), other Indigenous Lands (beige), other Conservation Units (green), cities (crosses). Indigenous Lands’ labels: a) Kaxinawá do Igarapé do Cauho, b) Katukina do Campinas, c) Kaxinawá da Praia do Carapanã, d) Kaxinawá do Baixo Rio Jordão, e) Kaxinawá do Rio Jordão, f) Kaxinawá/Ashaninka do Rio Breu, g) Kaxinawá do Humaitá, and h) Alto Purus. Close up illustrates village locations in the Kaxinawá do Baixo Rio Jordão and Rio Jordão Indigenous Lands.

29
Table 2-1. Defensibility of Pano Indigenous Lands against external threats.
Indigenous Land Size (km2) Defensibility Design features to
include in the category Location in
State
Igarapé do Caucho 123.18 Low
small size, road presence, unprotected surround,
near major city
development frontier
Campinas 326.24 Low
small size, road presence, two access points,
partially unprotected surround, near major city
development frontier
Praia do Carapanã 606.98 Low
two access point, intense river traffic, unprotected
surround
development frontier
Baixo Jordão 87.26 Medium small size, partially protected surround
western Amazon ecological corridor
Humaitá 1273.83 Medium large size, unprotected surround, watershed
headwaters
western Amazon ecological corridor
Alto Purus 2631.3 Medium
large size, partially protected surround, two access points, intense
river traffic
western Amazon ecological corridor
Jordão 872.93 High medium size, totally protected surround,
watershed headwaters
western Amazon ecological corridor
Breu 312.77 High totally protected
surround, watershed headwaters, remoteness
western Amazon
ecological corridor
30
CHAPTER 3 RESULTS
Pano Hunter’s Prey Profiles
The Kaxinawá and Katukina communities hunted 54 wildlife species or taxa (e.g.
Dasypodidae). Large bodied preferred vertebrates were the most hunted and provided
the largest amount of meat (Table 3-1). The 3375 hunted ungulates provided more meat
than other taxa to the whole Pano population (Table 3-2). Ungulates were most hunted
in almost all villages, with white-lipped peccary being the most hunted among them, and
provided up to 60% of wildmeat in some villages (Figure 3-1). Rodents and primates
were second in terms of animals hunted and meat contribution (Table 3-2), especially
because of the presence of large-bodied species. Large birds were frequently hunted
but less important in providing meat (Table 3-2). Species of secondary preference that
were frequently hunted include paca, agouti, armadillos, capuchin monkey, squirrels
and coati (Table 3-1) but only provided 13% of total consumed meat. Human-sensitive
species were absent in hunter’s prey profiles of several villages, particularly in those
located in the development frontier (Table 3-3). Villages alongside roads did not hunt
large monkeys or birds. On the other hand, white-lipped peccary and howler monkey
were hunted in almost all villages.
Information Provided by Indicators of Wildlife Status
Three indicators of wildlife status (i.e. mean prey weight, richness of sensitive
species, and CPUE of preferred species) were significantly correlated among each
other, representing a pattern in which the average weight of preys decreased
associated to the loss of sensitive species, reflecting in the decreased CPUE of
preferred animals. In turn, the mode distance of preferred animals to the village was not

31
correlated with other indicators, suggesting a different process causing its variation
(Table 3-4).
As suggested by the Optimal Foraging Theory, the variation in mean prey weight
represented the positive variation in the proportion of preferred species, specifically
ungulates, simultaneously to the negative variation in the proportion of species of
intermediate preference and low ranked species, specially primates (Figure 3-2a).
Furthermore, the variation in CPUE of preferred species was positively associated to
the proportion of hunted animals, in particular the tapir and all ungulate species, and
negatively to intermediate and low ranked species, specially rodents (Figure 3-2b).
Piping guan, razor-billed curassow, woolly and spider monkey, and tapir were frequently
absent from Pano catchments. Villages that hunted four or less sensitive species never
hunted the piping guan, razor-billed curassow, and tapir, whilst only one hunted the
spider monkey and four the wooly monkey.
The two Principal Components (PCs), created from the multivariate analysis,
correspond to 86.55% of the variation present in simple indicators. PC1 reflects the
simultaneous variation in mean prey weight and sensitive species richness, with little
contribution of mode distance. PC2 reflects the simultaneous variation of mode distance
in opposition to sensitive species richness, where villages that have hunted animals
farther away and hunted a small number of sensitive species (Table 3-5).
Drivers of Wildlife Depletion across Pano Communities
Only hunting pressure, represented by the density of indigenous people, and road
presence composed the single significant minimal regression model, explaining 30% of
variation in mode distance of preferred animals hunted away from villages (Table 3-6;
Table 3-7). According to this model, an addition of 100 Pano people in 5km represented
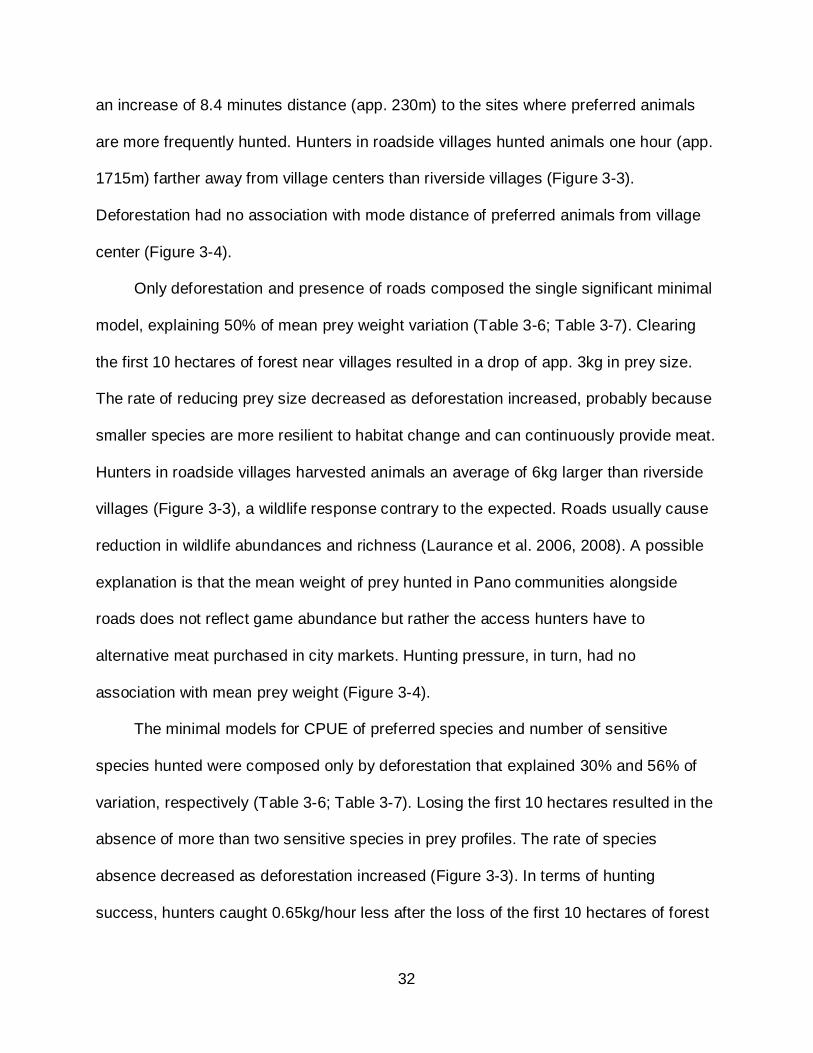
32
an increase of 8.4 minutes distance (app. 230m) to the sites where preferred animals
are more frequently hunted. Hunters in roadside villages hunted animals one hour (app.
1715m) farther away from village centers than riverside villages (Figure 3-3).
Deforestation had no association with mode distance of preferred animals from village
center (Figure 3-4).
Only deforestation and presence of roads composed the single significant minimal
model, explaining 50% of mean prey weight variation (Table 3-6; Table 3-7). Clearing
the first 10 hectares of forest near villages resulted in a drop of app. 3kg in prey size.
The rate of reducing prey size decreased as deforestation increased, probably because
smaller species are more resilient to habitat change and can continuously provide meat.
Hunters in roadside villages harvested animals an average of 6kg larger than riverside
villages (Figure 3-3), a wildlife response contrary to the expected. Roads usually cause
reduction in wildlife abundances and richness (Laurance et al. 2006, 2008). A possible
explanation is that the mean weight of prey hunted in Pano communities alongside
roads does not reflect game abundance but rather the access hunters have to
alternative meat purchased in city markets. Hunting pressure, in turn, had no
association with mean prey weight (Figure 3-4).
The minimal models for CPUE of preferred species and number of sensitive
species hunted were composed only by deforestation that explained 30% and 56% of
variation, respectively (Table 3-6; Table 3-7). Losing the first 10 hectares resulted in the
absence of more than two sensitive species in prey profiles. The rate of species
absence decreased as deforestation increased (Figure 3-3). In terms of hunting
success, hunters caught 0.65kg/hour less after the loss of the first 10 hectares of forest

33
near villages, a rate that decreased as deforestation increased (Figure 3-3). Hunting
pressure had no relationship with CPUE or sensitive species richness (Figure 3-4).
The minimal model explaining 55% of variation in PC1 (Table 3-6) was composed
by deforestation, presence of road, and the density of indigenous people although the
latter was not significant at α<0.05 (Table 3-7). According to this model, indigenous
hunting and deforestation around villages have additive effects on wildlife, that
responded by decreasing the abundance of large animals and richness of sensitive
species, while increasing the distance of preferred animals from the village.
Nevertheless, indigenous hunting seems to have less effect on this multiple response.
In turn, PC2 was driven by road presence and indigenous density in a model explaining
50% of variation. Thus, indigenous hunting is negatively related to the dispersion of
animals far away from villages and, to a smaller extent, the reduction of sensitive
species richness, a process exacerbated by the presence of roads (Figure 3-3).
Nevertheless, PC2 represents a smaller portion of wildlife multiple response.
Because the variables describing the two primary drivers of game depletion,
deforestation and hunting pressure (i.e. village age, density of indigenous people, and
actual village population) were not correlated, it was possible to assess the importance
of the effect of each factor on wildlife status. The regression results suggested that
deforestation and indigenous hunting induced different responses of wildlife species,
and the road had a significant impact exacerbating effects of both drivers. Hunting
pressure affected populations of preferred game species by displacing them away from
village. Deforestation is the only factor that significantly led to an increase in the effort
needed to obtain meat of preferred species, induced shifts in large prey abundances,

34
and was the main factor responsible for the decline in the richness of human-sensitive
species.
Spatial Dependence
The actual values of mean prey weight, sensitive species richness and PC1 were
autocorrelated, but not the residuals of the minimal regression models (Table 3-8).
Hence, neighbor villages have wildlife statuses more similar than those farther apart.
Deforestation across villages explained spatial dependency because this was the only
variable included in regression models, which residuals were not autocorrelated. Given
that the actual values and the residuals of regression model of mode distance of hunted
animals were not spatially dependent, indigenous hunting that affects wildlife distribution
is apparently a localized process within 5km around villages. It was not possible to test
spatial dependence of CPUE due to the reduced data points.
Capacity of Indigenous Lands to Protect Wildlife against External Threats
The results from regression models clearly showed a difference of wildlife status
between protected villages and those vulnerable to threats from outside Indigenous
Lands (Figure 3-3). Hunters in vulnerable villages hunted animals on average 2kg
smaller, one sensitive species less, and had three times less hunting success than
those in protected villages. The distance where most of the animals were hunted was
not significantly different between the two groups (Table 3-9). Deforestation was the
only explanatory variable used in regression models significantly higher in vulnerable
villages than in protected (Table 3-9), suggesting that deforestation is possibly the factor
creating differences of wildlife status between protected villages and those vulnerable to
external threats. The absence of difference in mode distance between the groups of
villages provides additional evidence that indigenous hunting pressure has only

35
localized consequences to wildlife. Part of the deforested area affecting game hunted in
vulnerable villages is outside the boundaries of Indigenous Lands. Across these
villages, deforestation inside Indigenous Lands was not correlated to the variation of
any wildlife status indicator, whereas total deforestation and deforestation near villages
but outside Indigenous Lands were (Table 3-10).
Another clear pattern is the spatial distribution of vulnerable and protected villages
within Indigenous Lands of different levels of defensibility against external threats.
Vulnerable villages were all located in Indigenous Lands with low or medium
defensibility whereas protected villages were located in reserves with high defensibility,
except for one protected village in a reserve with medium defensibility (Table 2-1; Table
3-3). Hunters in Indigenous Lands of low defensibility hunted prey twice as small
(F=3.47, p<0.05), and twice as many less sensitive species (F=15.59, p<0.01), than
hunters in reserves of medium or high defensibility. Those hunters also had almost four
times lower hunting success than hunters in Indigenous Lands of high defensibility
(F=5.68, p<0.05; Figure 3-5). Hence, Indigenous Lands better protected against
external threats have wildlife in a better status. The distance where animals are caught
was not different among Indigenous Lands of different levels of defensibility (F=0.22,
p>0.1; Figure 3-5), suggesting again that the process driving this wildlife response
occurs at a smaller spatial scale.
In addition, the size of the reserve seems to be of less importance to Indigenous
Lands, at least, with partially protected surroundings and located out of the development
frontier. According to Peres (2001), hunting sustainability is associated to the size of
protected areas because these should be able to maintain viable populations of game
36
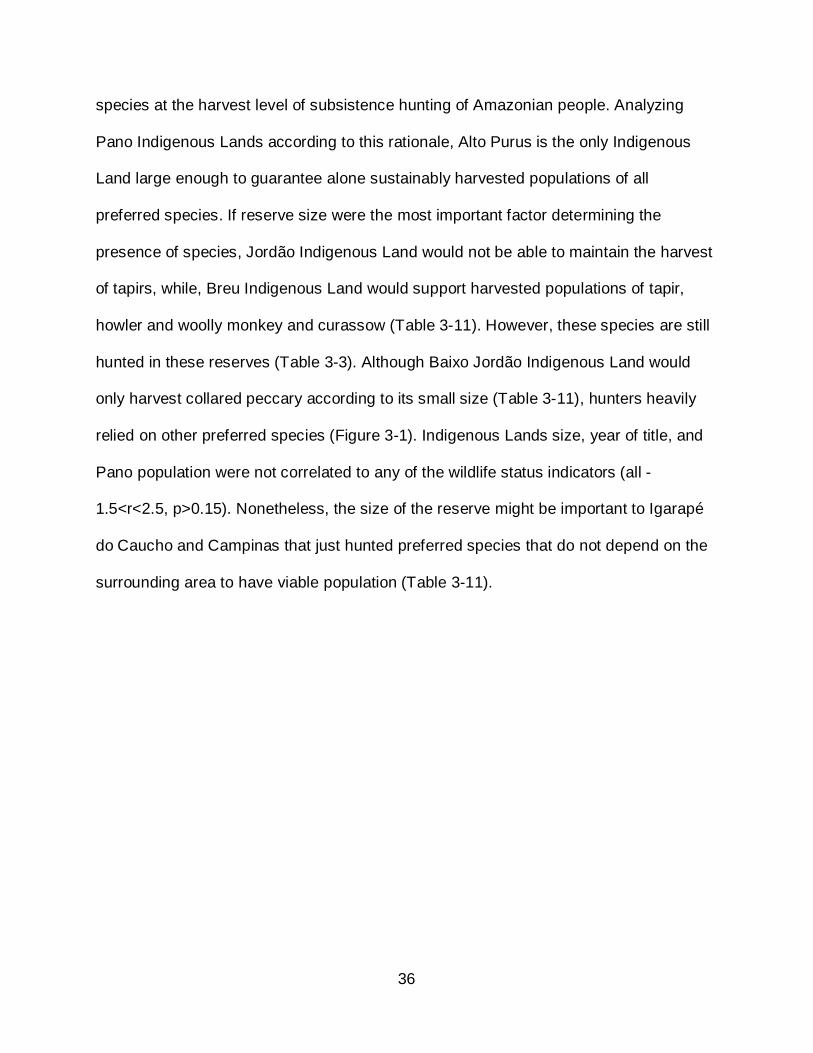
species at the harvest level of subsistence hunting of Amazonian people. Analyzing
Pano Indigenous Lands according to this rationale, Alto Purus is the only Indigenous
Land large enough to guarantee alone sustainably harvested populations of all
preferred species. If reserve size were the most important factor determining the
presence of species, Jordão Indigenous Land would not be able to maintain the harvest
of tapirs, while, Breu Indigenous Land would support harvested populations of tapir,
howler and woolly monkey and curassow (Table 3-11). However, these species are still
hunted in these reserves (Table 3-3). Although Baixo Jordão Indigenous Land would
only harvest collared peccary according to its small size (Table 3-11), hunters heavily
relied on other preferred species (Figure 3-1). Indigenous Lands size, year of title, and
Pano population were not correlated to any of the wildlife status indicators (all -
1.5<r<2.5, p>0.15). Nonetheless, the size of the reserve might be important to Igarapé
do Caucho and Campinas that just hunted preferred species that do not depend on the
surrounding area to have viable population (Table 3-11).

37
Table 3-1. Wildlife species hunted by Pano communities in Acre, Brazilian Amazon, during this study. Preferred species (1), secondary species (2), low ranked species (3) indicated according to Cunha and Almeida (2002) and Constantino et al. (2008). For some analysis in this study we collapsed groups 2 and 3 in the group of species of secondary preference. Taxa referenced with superscript letters were not always recorded at the species level or identification was not certain.
Scientific name Common name # of animals
Weight of animals Preference
Sensitive species
ref.
Tayassu pecari white-lipped peccary 1335 24455.6 1 1
Pecari tajacu collared peccary 1267 16049.0 1
Mazama americana red brocket deer 695 15381.8 1
Tapirus terrestris lowland tapir 68 6786.0 1 2 Alouatta seniculus howler monkey 539 3343.5 1 3 Geochelonia denticulata tortoise 536 3161.3 1 4
Ateles chamek spider monkey 258 1937.5 1 5 Caiman sp. cayman 177 1614.5 1 Lagotrix lagotricha woolly monkey 72 536.2 1 6
Mitu tuberosum razor-billed currasow 96 457.1 1 7
Mazama gouazabira gray brocket deer 10 136.0 1
Pipile cujubi piping guan 18 37.5 1 8 Agouti paca paca 524 3933.1 2 Dasypodidaea armadillo 427 2368.5 2 Dasiprocta fuliginosa agouti 411 1812.2 2 Nasua nasua coati 313 1450.8 2 Cebus apela brown capuchin 266 1031.1 2 Sciurus sp.b squirrel 636 657.5 2 Penelope jacquacu Spix's guan 228 421.7 2 Tinamus guttatus large tinamous 200 326.1 2 Hydrochaeris hydrochaeris capybara 13 291.0 3
Psophia leucoptera pale-winged trumpeter 132 251.3 2
Dinomys branickii pacarana 31 236.0 3 Pithecia sp.c saki monkey 68 203.0 3 Myoprocta pratii acouchi 162 183.8 3
Cebus albifrons white-fronted capuchin 45 162.5 3
Aotus nigriceps night monkey 88 119.8 3

38
Table 3-1. Continued
Scientific name Common name # of animals
Weight of animals Preference
Sensitive species
ref. Priodontes maximus giant armadillo 4 95.0 3 Myrmecophaga tridactyla giant anteater 4 87.0 3
Ara sp.e macaw 53 74.9 3 Saimiri sciureus squirrel monkey 53 60.7 3 Tinamus tao grey tinamous 24 55.8 2 Callicebus moloch titi monkey 44 53.1 3 Saguinus sp.d tamarin 53 44.2 3 Amazona sp.e parrot 34 31.8 3 Crypturellus cinereus small tinamous 30 21.6 3 Ramphastos sp.e toucan 26 20.5 3 Ortalis guttata Speckled chachalaca 23 16.8 3 Crypturellus soui little tinamous 25 16.3 3 Rallidae rail 23 15.0 3 Coendou sp. quandu 3 15.0 3 Tinamous major small tinamous 15 12.5 2 Crypturellus sp.3 small tinamous 15 11.9 3 Crypturellus sp.2 small tinamous 18 11.6 3 Odontophorus sp.e wood quail 11 6.9 3 Jabiru mycteria jabiru 1 6.0 3 Harpia harpyja harpy eagle 1 5.0 3 Columbidae dove 14 4.3 3 Anatidae duck 3 4.0 3 Accipitridae kite 3 2.5 3 Tupinambis teguixin common tegu 2 2.0 3 Psarocolius sp. oropendola 5 1.9 3 Psittacidae macaw 5 1.9 3 Pteroglossus sp. aracari 2 0.9 3 Total 9109 88023.3 aDasypus novemcinctus, Dasypus kapplery, Cabassous unicinctus bS. ignitus and S. spadiceus. cP. irrorata or P. monachus. dS. imperator, S. fusicolor, S. melanoleucus, and possibly S. mystax. etaxa containing more than one species but with uncertain identification.
39
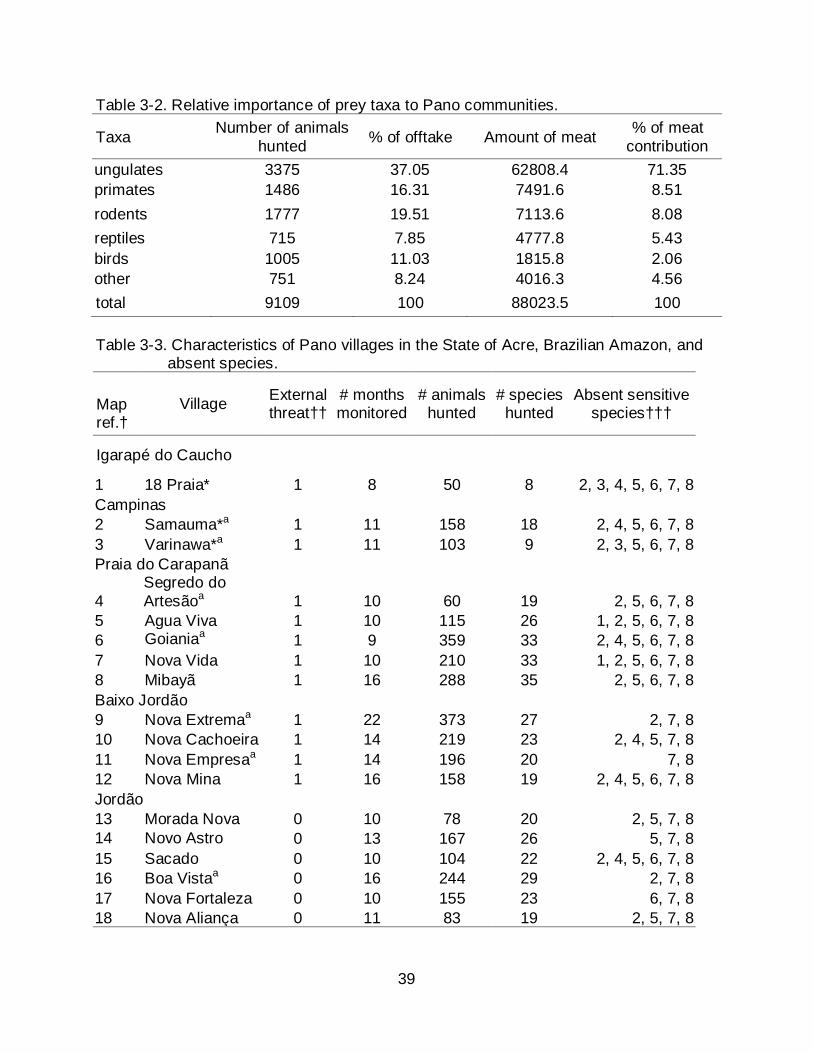
Table 3-2. Relative importance of prey taxa to Pano communities.
Taxa Number of animals hunted % of offtake Amount of meat % of meat
contribution ungulates 3375 37.05 62808.4 71.35 primates 1486 16.31 7491.6 8.51 rodents 1777 19.51 7113.6 8.08 reptiles 715 7.85 4777.8 5.43 birds 1005 11.03 1815.8 2.06 other 751 8.24 4016.3 4.56 total 9109 100 88023.5 100 Table 3-3. Characteristics of Pano villages in the State of Acre, Brazilian Amazon, and
absent species.
Map ref.†
Village External threat††
# months monitored
# animals hunted
# species hunted
Absent sensitive species†††
Igarapé do Caucho
1 18 Praia* 1 8 50 8 2, 3, 4, 5, 6, 7, 8 Campinas 2 Samauma*a 1 11 158 18 2, 4, 5, 6, 7, 8 3 Varinawa*a 1 11 103 9 2, 3, 5, 6, 7, 8 Praia do Carapanã
4 Segredo do Artesãoa 1 10 60 19 2, 5, 6, 7, 8
5 Agua Viva 1 10 115 26 1, 2, 5, 6, 7, 8 6 Goianiaa 1 9 359 33 2, 4, 5, 6, 7, 8 7 Nova Vida 1 10 210 33 1, 2, 5, 6, 7, 8 8 Mibayã 1 16 288 35 2, 5, 6, 7, 8 Baixo Jordão 9 Nova Extremaa 1 22 373 27 2, 7, 8 10 Nova Cachoeira 1 14 219 23 2, 4, 5, 7, 8 11 Nova Empresaa 1 14 196 20 7, 8 12 Nova Mina 1 16 158 19 2, 4, 5, 6, 7, 8 Jordão 13 Morada Nova 0 10 78 20 2, 5, 7, 8 14 Novo Astro 0 13 167 26 5, 7, 8 15 Sacado 0 10 104 22 2, 4, 5, 6, 7, 8 16 Boa Vistaa 0 16 244 29 2, 7, 8 17 Nova Fortaleza 0 10 155 23 6, 7, 8 18 Nova Aliança 0 11 83 19 2, 5, 7, 8

40
Table 3-3. Continued. Map ref.†
Village External threat††
# months monitored
# animals hunted
# species hunted
Absent sensitive species†††
19 Novo Natal 0 7 56 18 2, 7, 8 20 Chico Curumim 0 17 279 28 2, 7, 8 21 Bom Jesus 0 21 307 28 8 22 Verde Florestaa 0 22 278 17 6, 8 23 Belo Monte 0 28 529 30 6, 8 24 Paz do Senhor 0 8 126 26 2, 7, 8 25 Novo segredo 0 8 125 21 6 Breu 26 Vida Nova 0 30 927 41 none 27 Cruzeirinho 0 18 321 29 none 28 Japinim 0 45 1423 38 none 29 Jacobina 0 8 492 28 none Humaitá 30 Boa Sortea 1 10 99 18 2, 6, 8 31 Boa Vistaa 1 9 133 12 2, 6 32 Porto Brasila 0 16 126 17 6, 7 Alto Purus 33 Nova Fronteiraa 1 18 373 35 6, 7, 8 34 Dois Irmãosa 1 9 149 25 6, 8 35 Porto Ricoa 1 9 124 20 6 †Numbers refer to village location in Figure 2-1. ††Villages subject to external threat are †††Numbers refer to species numbers in column “Sensitive species” of Table 2-1. *villages accessing city market by roads. avillages excluded from CPUE analysis.

41
Table 3-4. Pearson correlation matrix between simple indicator variables of wildlife depletion in Pano villages (upper) and excluding roadside villages (bottom) in Acre, Brazilian Amazon.
Simple indicators Mean prey weight (kg)
CPUE preferred species
(kg/hour)
Number of sensitive species
Mean prey weight (kg) n=35
1
CPUE of preferred species (kg/hour) n=21
0.83** 0.82**
1
Number of sensitive species n=35
0.44* 0.73**
0.62* 0.59*
1
Mode distance of preferred species hunted from the village (min.) n=35
0.33 0.19
0.00 0.14
-0.09 0.18
*p<0.01;**p<0.001 Table 3-5. Principal Component Analysis axis of wildlife abundance simple indicators.
PC1 PC2 PC3
Axis Percent (%) 50.45 36.01 13.46
Components
Mean prey weight 0.73 0.05 -0.68
Richness of sensitive species 0.57 -0.59 0.57
Mode distance 0.37 0.81 0.46

42
Table 3-6. Backward stepwise regression models for all response variables at the village level.
Response variable R2adj DF
F ratio p
SSE final
AICc full
model
AICc minimal model n
Simple indicators
Mean prey weight (kg) 0.50 2 18.26 <0.001 119.17 51.79 48.88 35
CPUE preferred species (kg/hour) 0.30 1 9.67 0.006 7.63 -11.99 -17.27 21
Richness of sensitive species 0.56 1 44.8 <0.001 60.3 25.53 23.04 35
Mode distance of preferred species hunted from the village (min.)
0.30 2 8.42 0.001 39135.16 251.09 251.68 35
Multivariate indicators PC1 0.55 3 14.64 <0.001 21.29 -6.67 -9.39 35
PC2 0.50 2 18.08 <0.001 17.28 -15.19 -18.7 35

43
Table 3-7. Explanatory variables included in the final regression models after stepwise
and supervised selection. Response variable Parameters Estimate SE t Ratio Prob>t
Mean prey weight Intercept 18.93 1.68 11.29 <0.001 Log deforested area -3.36 0.64 14.67 <0.001 Road presence 3.00 0.62 5.44 <0.001 CPUE of preferred species Intercept 2.84 0.46 6.13 <0.001 Log deforested area -0.65 0.21 -3.11 0.006 Richness of sensitive species Intercept 10.36 0.89 11.69 <0.001 Log deforested area -2.63 0.39 -6.69 <0.001 Mode distance of preferred species to village center Intercept 72.76 16.71 4.35 <0.001 Road presence 31.50 10.71 2.94 <0.01 Density of indigenous people 6.60 2.83 2.33 0.03 PC1 Intercept 4.18 0.73 5.72 <0.001 Road presence 0.97 0.28 3.53 0.001 Density of indigenous people 0.14 0.07 2.00 0.055 Log deforested area -1.80 0.28 -6.53 <0.001 PC2 Intercept 0.21 0.35 0.60 0.55 Road presence 1.07 0.22 4.78 <0.001 Density of indigenous people 0.17 0.06 2.81 0.008 Table 3-8. Spatial dependence of response variables and residuals of final regression
models. Moran’s I index reported and its significance given by Z-scores in parenthesis.
Wildlife indicators Actual values Residuals of minimal models n
Mean prey weight 0.23 (2.57)* 0.04 (0.66) 35 Number of sensitive species 0.2 (2.3)* -0.04 (-0.1) 35
Mode distance of preferred species to village center 0.06 (0.85) 0.08 (1.11) 35
PC1 0.24 (2.7)** -0.06 (-0.35) 35 PC2 0.08 (1.07) -0.02 (0.11) 35 *significant at α<0.05

44
Table 3-9. Student's t tests on wildlife indicators between villages protected and vulnerable to external threat.
Variables Vulnerable Protected
mean (SD) n mean (SD) n t p response variable
mean prey weight (kg) 8.11 (3.18) 17 10.05 (1.88) 18 2.17 <0.05
mean prey weight (kg)* 7.30 (2.46) 14 10.05 (1.88) 19 3.46 <0.001
richness of sensitive species 3.53 (1.80) 17 5.67 (1.71) 18 3.58 <0.001
CPUE of preferred species (kg/hour) 0.83 (0.63) 6 1.72 (0.66) 18 2.89 <0.01
mode distance of animals hunted from village center (min.)
80.12 (44.51) 17 67.13 (39.51) 18 -0.91 n.s.
PC1 -0.51 (1.32) 17 0.48 (0.94) 18 2.57 <0.005
PC1* -0.73 (1.25) 14 0.48 (0.94) 18 3.03 <0.005
PC2 0.43 (1.04) 17 -0.40 (0.89) 18 -2.53 n.s.
mean (SD) n mean (SD) n t p explanatory variables
Deforested area (ha) 2.57 (0.49) 17 1.81 (0.41) 18 -4.87 <0.001
Density of indigenous people (in 5km radius) 4.18 (2.30) 17 3.94 (2.06) 18 -0.31 n.s.
Village age (year) 11.47 (8.31) 17 14.61 (8.50) 18 1.10 n.s.
Village population 83.53 (54.71) 17 79.17 (29.14) 18 -0.29 n.s. *comparisons excluding the roadside villages of indicators subjected to road effects on access to alternative meat. Values of mean prey weight in these villages do not reflect wildlife abundance. Table 3-10. Pearson's correlations between indicators of wildlife status that were driven
by deforestation and the total deforestation within 5km radius area, then inside and outside Indigenous Lands (IL) for the group of villages vulnerable to external threats. Roadside villages were excluded.
Deforestation Total Inside IL Outside IL N Mean prey weight -0.63 (0.02)* -0.48 (0.09) -0.60 (0.04)* 13 Sensitive species richness 0.38 (0.19) -0.4 (0.20) -0.12 (0.70) 13 PC1 -0.58 (0.04)* -0.58 (0.05) -0.43 (0.16) 13
*significant at α<0.05
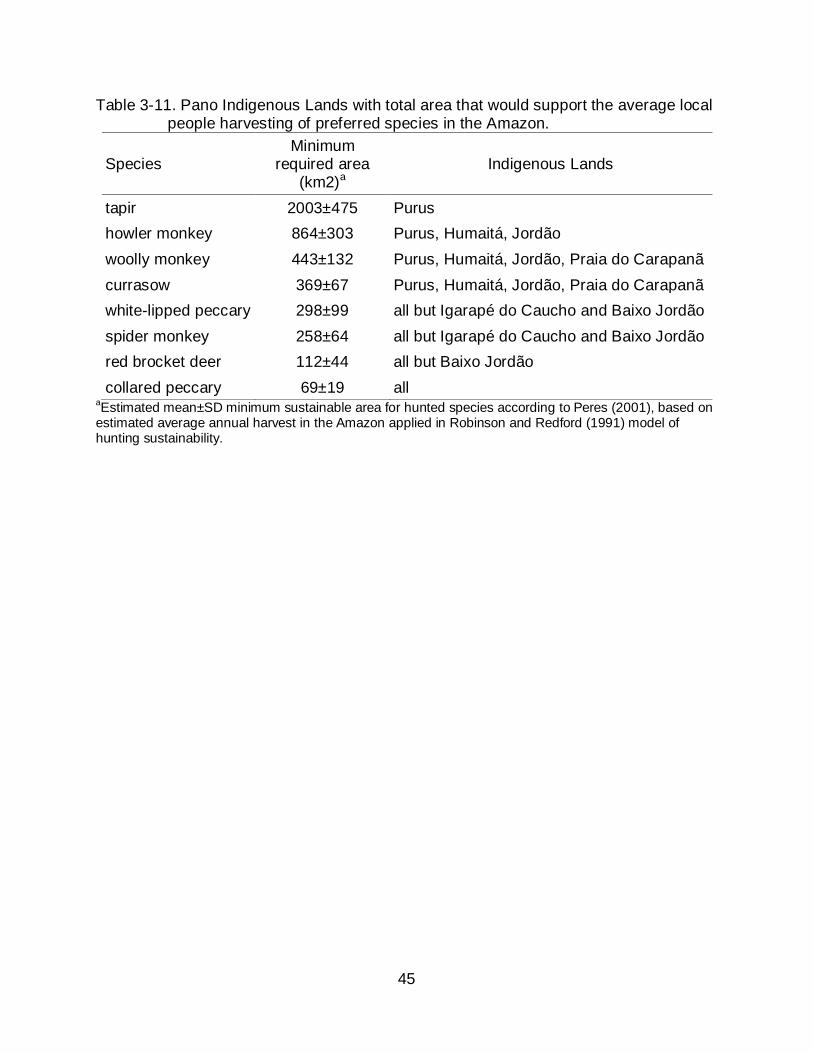
45
Table 3-11. Pano Indigenous Lands with total area that would support the average local people harvesting of preferred species in the Amazon.
Species Minimum
required area (km2)a
Indigenous Lands
tapir 2003±475 Purus howler monkey 864±303 Purus, Humaitá, Jordão woolly monkey 443±132 Purus, Humaitá, Jordão, Praia do Carapanã currasow 369±67 Purus, Humaitá, Jordão, Praia do Carapanã white-lipped peccary 298±99 all but Igarapé do Caucho and Baixo Jordão spider monkey 258±64 all but Igarapé do Caucho and Baixo Jordão red brocket deer 112±44 all but Baixo Jordão collared peccary 69±19 all
aEstimated mean±SD minimum sustainable area for hunted species according to Peres (2001), based on estimated average annual harvest in the Amazon applied in Robinson and Redford (1991) model of hunting sustainability.

46
Figure 3-1. Relative contribution of wildlife species to Pano diet. Black: white-lipped peccary; dark grey: brocket deer; medium grey: collared peccary; light grey: tapir; white: agouti. Column numbers refer to village numbers in Figure 2-1.
47
Figure 3-2. Significant Pearson's correlation between wildlife status indicators and the proportion of individual species, major taxa, and preference group, after Bonferroni correction. A) Mean prey weight. Only the proportion of ungulates and preferred species were positively correlated (r=0.69, p<0.000; r=0.67, p<0.000, respectively) and the proportion of primates, low ranked and secondary species (r=-0.46, p=0.02; r=-0.59, p=0.001; r=-0.62, p<0.001, respectively) were negatively correlated. B) CPUE of preferred species.

48
0
0.5
1
1.5
2
2.5
3
3.5
CPU
E (k
g/ho
ur)
1 1.5 2 2.5 3 3.5 4Log10 Deforested Area (ha)
0
0.5
1
1.5
2
2.5
3
3.5
CPU
E (k
g/ho
ur)
1 1.5 2 2.5 3 3.5 4Log10 Deforested Area (ha)
0
1
2
3
4
5
6
7
8
9
Sen
sitiv
e sp
ecie
s ric
hnes
s
1 1.5 2 2.5 3 3.5 4Log10 Deforested Area (ha)
0
1
2
3
4
5
6
7
8
9
Sen
sitiv
e sp
ecie
s ric
hnes
s
1 1.5 2 2.5 3 3.5 4Log10 Deforested Area (ha)
0
50
100
150
Mod
e di
stan
ce (m
in.)
0 1 2 3 4 5 6 7 8Indigenous density (people/km2)
0
50
100
150
Mod
e di
stan
ce (m
in.)
0 1 2 3 4 5 6 7 8Indigenous density (people/km2)
-1.5
-1
-0.5
0
0.5
1
1.5
2
2.5
3
PC
2
1 2 3 4 5 6 7 8
Indigenous density (people/km2)
-1.5
-1
-0.5
0
0.5
1
1.5
2
2.5
3
PC
2
1 2 3 4 5 6 7 8
Indigenous density (people/km2)
2.5
5
7.5
10
12.5
15
17.5M
ean
prey
wei
ght (
kg)
1 1.5 2 2.5 3 3.5 4Log10 Deforested Area (ha)
2.5
5
7.5
10
12.5
15
17.5M
ean
prey
wei
ght
(kg)
1 1 .5 2 2.5 3 3.5 4Log10 Deforested Area (ha)
Figure 3-3. Best linear regression models after backward stepwise selection (based on
AICc). Protected villages (solid dots), vulnerable villages (open dots), roadside villages regression line (bottom line), riverside villages regression line (upper line). PC1 could not be represented in two-dimensional graph.

49
0
50
100
150
Mod
e di
stan
ce (m
in.)
1 1.5 2 2.5 3 3.5 4Deforested area (Log10 ha)
0
50
100
150
Mod
e di
stan
ce (m
in.)
1 1.5 2 2.5 3 3.5 4Deforested area (Log10 ha)
0
0.5
1
1.5
2
2.5
3
3.5
CPUE
(kg/
hour
)
0 5 10 15 20 25 30Village age (years)
0
0.5
1
1.5
2
2.5
3
3.5
CPUE
(kg/
hour
)
0 5 10 15 20 25 30Village age (years)
0
1
2
3
4
5
6
7
8
9
Sens
itive
spec
ies ri
chne
ss
0 5 10 15 20 25 30Village age (years)
0
1
2
3
4
5
6
7
8
9
Sens
itive
spec
ies ri
chne
ss
0 5 10 15 20 25 30Village age (years)
2.5
5
7.5
10
12.5
15
17.5
Mea
n pr
ey w
eight
(kg)
0 5 10 15 20 25 30Village age (years)
2.5
5
7.5
10
12.5
15
17.5
Mea
n pr
ey w
eight
(kg)
0 5 10 15 20 25 30Village age (years)
0
1
2
3
4
5
6
7
8
9
Sens
itive
spec
ies ri
chne
ss
0 1 2 3 4 5 6 7 8Indigenous density (people/km)
0
1
2
3
4
5
6
7
8
9
Sens
itive
spec
ies ri
chne
ss
0 1 2 3 4 5 6 7 8Indigenous density (people/km)
0
0.5
1
1.5
2
2.5
3
3.5
CPUE
(kg/
hour
)
0 1 2 3 4 5 6 7 8Indigenous density (people/km)
0
0.5
1
1.5
2
2.5
3
3.5
CPUE
(kg/
hour
)
0 1 2 3 4 5 6 7 8Indigenous density (people/km)
2.5
5
7.5
10
12.5
15
17.5M
ean
prey
wei
ght (
kg)
0 1 2 3 4 5 6 7 8Indigneous density (people/km)
2.5
5
7.5
10
12.5
15
17.5M
ean
prey
wei
ght (
kg)
0 1 2 3 4 5 6 7 8Indigneous density (people/km)
Figure 3-4. Examples of non significant Pearson's correlation between hunting pressure,
deforestation and indicators of wildlife status. Vulnerable villages (open dots) and protected villages (solid dots). Mean prey weight and hunting pressure (rvillage age=0.14, p=0.42; rindigenous density=0.04, p=0.83), CPUE and hunting pressure (rvillage age=-0.15, p=0.53, rindigenous density=-0.31, p=0.18), sensitive species richness and hunting pressure (rvillage age=-0.05, p=0.79, rindigenous density=-0.22, p=0.21), and mode distance and deforestation (r=0.09, p=0.89).

50
Figure 3-5. Box-plot of wildlife indicators among Indigenous Lands of different levels of defensibility against external threats to wildlife: low (n=8 villages), medium (n=10 villages), and high (n=17). Roadside villages were excluded from mean prey weight analysis. Vulnerable villages (open dots) and protected villages (dark dots). Letters indicate significantly different means (p<0.05). Indigenous Lands within each category are listed in Table 2-1.
51
CHAPTER 4 DISCUSSION
Wildlife Status nearby Pano Communities
Most Pano communities still relied on preferential animals as a meat source, even
after many decades of intense wildlife harvesting and high current hunting pressure in
the state of Acre. The pattern of game use by Pano communities was similar to those
observed in tropical forests at smaller and larger spatial scales. In the Alto Purus region
of Peru, where wildlife is less depleted, ungulates predominate in the diet of Kaxinawá
communities (Navarro 2004). Ungulates predominance is observed in other indigenous
and non-indigenous unaltered forest settlements in the Amazon (Alvard 1993; Robinson
and Bodmer 1999; Mena et al. 2000), as well as commonly at the large scale of the
Amazon basin (Jerozolimski and Peres 2003) and other tropical forests (Fa et a. 2005).
The transition from hunting principally ungulates to smaller and less preferred species
observed across Pano villages agrees with the pattern found in single Amazonian
settlements that had wildlife depleted by persistent hunting (Stearman 1990) or by
factors other than hunting (Escamilla et al. 2000). The same gradual shift is also
observed in the spatial variation of wildlife status across multiple sites in a single
Extractive Reserve in the Amazon (Ramos 2005) as well as larger tropical spatial scales
(Jerozolimski and Peres 2003; Fa and Brown 2009). Pano hunters' return rate of meat
declined in response to decline in abundance of preferred game, particularly ungulates,
as observed in local communities in the Peruvian Amazonian where peccaries and tapir
declined over 10 years reflecting in hunters return rate (Bodmer et al. 1997). The
depleted Pano villages disproportionately hunted smaller resilient species, while
sensitive species like razor-billed curassow, piping guan, spider and woolly monkeys,

52
and tapir were usually absent from their prey profiles. In the Neotropics these species
are the most sensitive to anthropogenic disturbances and likely to be the first ones to be
extirpated locally (Daily et al. 2003; Parry et al. 2007) and across sites in the Amazon
basin (Peres 2000). Hence, wildlife responses in Pano hunting territory refer to change
in assemblage structure by reducing abundances of preferred species, particularly
ungulates, and composition by extirpation of some specific sensitive species, which
resulted in the decline of capture-per-unit-of-effort according to Optimum Foraging
Theory.
The increase in the distance of animals from village is related to the reduction of
abundance of tropical game (Hill et al. 1997; Ohl-Schacherer et al. 2007) and meat
return rate in other indigenous groups in the Amazon (Alvard et al, 1997; Sirén et al.
2004). In these sites, hunting was indicated the driver of game variation. The pattern of
animal distance to the village across Pano communities, in turn, differed from these
Amazonian. Pano communities hunting preferred animals farther away were not those
with their wildlife assemblage considerably depleted, but were those with higher hunting
pressure, conforming to the premises of the central-place forager model. Therefore, this
indicator might represent a different process driving wildlife response across Pano
villages than the others.
Drivers of Wildlife Depletion
In this study it was possible to disentangle the effects of indigenous hunting and
deforestation influencing game hunted by Pano people. Even in one of the less
deforested regions in the Amazon, indicators of game depletion across Pano villages
was mostly explained by increasing nearby deforestation. Indigenous hunting, in turn,
was only associated to the dispersion of animals from the village. However, non-

53
indigenous hunting may be responsible for part of game depletion since hunting outside
villages and Indigenous Lands was not estimated, and is possibly related to external
deforestation. The most disturbed villages, in terms of wildlife and forest loss, are those
more vulnerable to non-indigenous threats because of their location close to Indigenous
Lands’ boundaries. Moreover, these vulnerable villages are located in Indigenous Lands
of low and medium defensibility against external threats, which suggests that factors
operating at this level can affect wildlife close to villages. In fact, wildlife is more
depleted in villages of Indigenous Lands poorly designed and located in the state
development frontier.
Effects of Indigenous Hunting Pressure on Game
The dispersion of large game species was the only wildlife response possibly
related to indigenous hunting pressure across Pano communities, represented by the
density of indigenous people in neighbor villages. Hunting is responsible for game
depletion at local scales (Robinson and Bodmer 1999) and across sites in the Amazon
(Peres and Palacios 2007). High concentration of villages exacerbates the effects of
hunting because the source of disturbance has many close origins (Levi et al. 2009).
Given that the distance of animals hunted by Pano was not associated to other wildlife
responses, I suggest two possible non-exclusive hypotheses. One is indigenous hunting
caused game depletion only very close to the villages, which is supported by the
absence of spatial dependence of distance values, the lack of difference between
villages of different protection to external threat, and lack of difference among
Indigenous Lands of varying levels of defensibility. In a similar scale to my study, game
depletion was related only to local effects of human density (grain of 3.1km2) across
forest fragment of Mexican tropical forests (Urquiza-Hass et al. 2009). Or, indigenous

54
hunting just displaced animal populations and did not reduce their abundances. Game
species in hunted areas are more wary of people (Hill et al. 1997; Fitzgibbon 1998) and,
given the mobile nature of this resource, may flee and avoid disturbance in the village
area (Kensinger 1975; Urquiza-Hass et al. 2009). A previous study in a single Kaxinawá
Indigenous Land suggested that the history of land use, not indigenous hunting,
explained wildlife status (Constantino et al. 2008). The population of local people was
not associated to depletion across settlements in Central/West Africa forests (Fa et al.
2005) and in the Amazon (Jerozolimski and Peres 2003). Although Jerozolimski and
Peres (2003) found that the persistence of local hunting over time explained wildlife
depletion in the Amazon, the age of Pano villages was not related to game variation.
Therefore, there is no clear evidence in this study to support the idea that contemporary
and past indigenous hunting severely depletes game species at the regional scale.
Effects of Deforestation around Villages on Game
Deforestation was the only factor significantly affecting wildlife across villages with
drastic consequences for Pano hunters, who responded by spending more time hunting
to supply their meat needs. At large spatial scales, deforestation is the most important
factor depleting wildlife in the tropics, and has been used to project the reduction of
populations' range and species extinction (Cuarón 2000; Grelle 2005; Kinnaird et al.
2003; Soares-Filho et al. 2006; Vale et al. 2008). At local scales, higher deforestation in
hunting territory near a highway caused Amazonian hunters to catch smaller prey
(Bonaudo et al. 2005). At regional scales, hunters caught more ungulates in areas of
primary forests of heterogeneous landscape in eastern Amazon (Parry et al. 2009b). In
the Alto Juruá Extractive Reserve, adjacent to the Pano Indigenous Lands of Jordão
and Breu Indigenous Lands (Figure 2-1), ungulates hunted by local people declined in
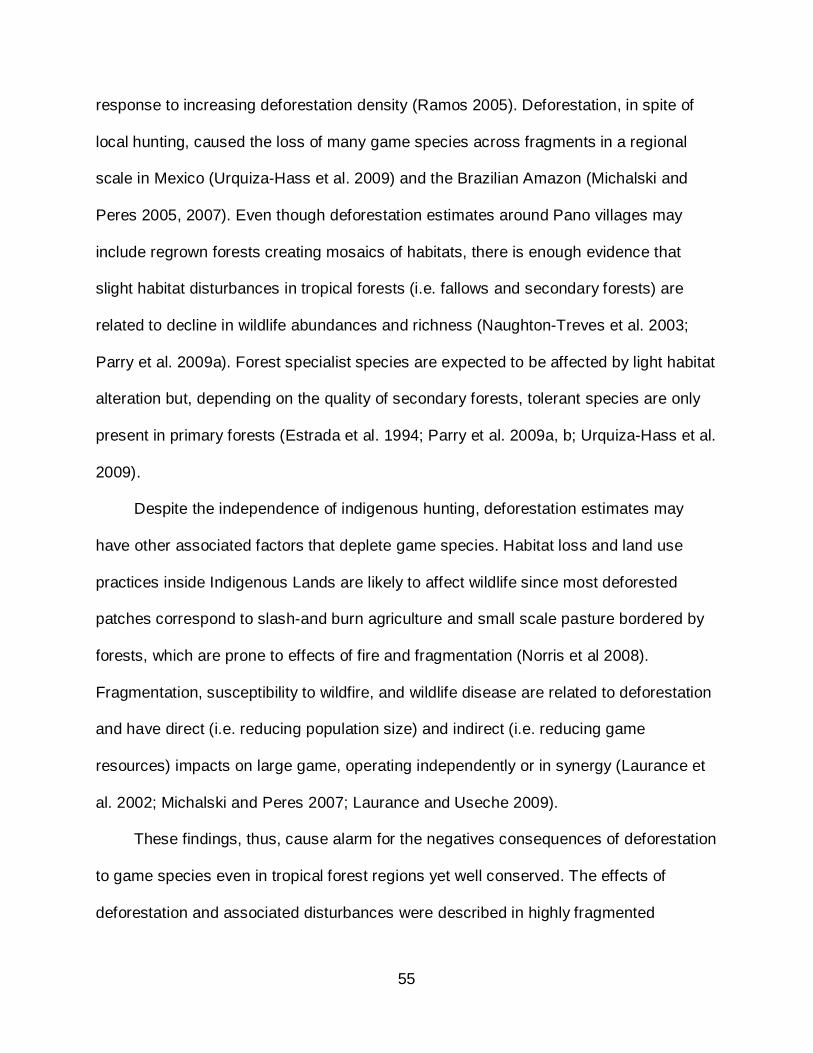
55
response to increasing deforestation density (Ramos 2005). Deforestation, in spite of
local hunting, caused the loss of many game species across fragments in a regional
scale in Mexico (Urquiza-Hass et al. 2009) and the Brazilian Amazon (Michalski and
Peres 2005, 2007). Even though deforestation estimates around Pano villages may
include regrown forests creating mosaics of habitats, there is enough evidence that
slight habitat disturbances in tropical forests (i.e. fallows and secondary forests) are
related to decline in wildlife abundances and richness (Naughton-Treves et al. 2003;
Parry et al. 2009a). Forest specialist species are expected to be affected by light habitat
alteration but, depending on the quality of secondary forests, tolerant species are only
present in primary forests (Estrada et al. 1994; Parry et al. 2009a, b; Urquiza-Hass et al.
2009).
Despite the independence of indigenous hunting, deforestation estimates may
have other associated factors that deplete game species. Habitat loss and land use
practices inside Indigenous Lands are likely to affect wildlife since most deforested
patches correspond to slash-and burn agriculture and small scale pasture bordered by
forests, which are prone to effects of fire and fragmentation (Norris et al 2008).
Fragmentation, susceptibility to wildfire, and wildlife disease are related to deforestation
and have direct (i.e. reducing population size) and indirect (i.e. reducing game
resources) impacts on large game, operating independently or in synergy (Laurance et
al. 2002; Michalski and Peres 2007; Laurance and Useche 2009).
These findings, thus, cause alarm for the negatives consequences of deforestation
to game species even in tropical forest regions yet well conserved. The effects of
deforestation and associated disturbances were described in highly fragmented
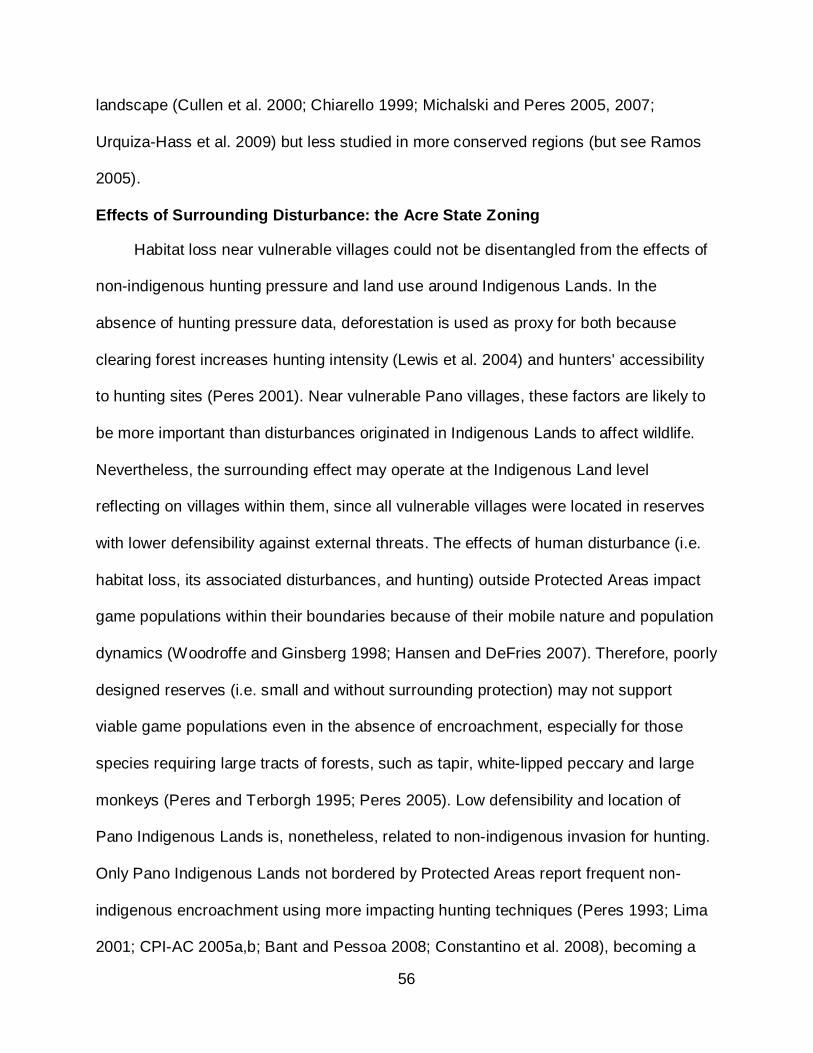
56
landscape (Cullen et al. 2000; Chiarello 1999; Michalski and Peres 2005, 2007;
Urquiza-Hass et al. 2009) but less studied in more conserved regions (but see Ramos
2005).
Effects of Surrounding Disturbance: the Acre State Zoning
Habitat loss near vulnerable villages could not be disentangled from the effects of
non-indigenous hunting pressure and land use around Indigenous Lands. In the
absence of hunting pressure data, deforestation is used as proxy for both because
clearing forest increases hunting intensity (Lewis et al. 2004) and hunters' accessibility
to hunting sites (Peres 2001). Near vulnerable Pano villages, these factors are likely to
be more important than disturbances originated in Indigenous Lands to affect wildlife.
Nevertheless, the surrounding effect may operate at the Indigenous Land level
reflecting on villages within them, since all vulnerable villages were located in reserves
with lower defensibility against external threats. The effects of human disturbance (i.e.
habitat loss, its associated disturbances, and hunting) outside Protected Areas impact
game populations within their boundaries because of their mobile nature and population
dynamics (Woodroffe and Ginsberg 1998; Hansen and DeFries 2007). Therefore, poorly
designed reserves (i.e. small and without surrounding protection) may not support
viable game populations even in the absence of encroachment, especially for those
species requiring large tracts of forests, such as tapir, white-lipped peccary and large
monkeys (Peres and Terborgh 1995; Peres 2005). Low defensibility and location of
Pano Indigenous Lands is, nonetheless, related to non-indigenous invasion for hunting.
Only Pano Indigenous Lands not bordered by Protected Areas report frequent non-
indigenous encroachment using more impacting hunting techniques (Peres 1993; Lima
2001; CPI-AC 2005a,b; Bant and Pessoa 2008; Constantino et al. 2008), becoming a

57
major problem in those areas located in the development frontier (i.e. Praia do
Carapanã (Bant and Pessoa 2008) and Campinas (Lima 2001; Calouro 2007)). Private
lands around Indigenous Lands have a more intensive land use pattern than do Pano
people (IBGE 2009), supporting the notion of external threats associated to land cover
conversion affecting wildlife hunted in vulnerable villages.
Thus, the historical spatial occupancy of western Amazon and the current State
Ecological-Economic Zoning create a heterogeneous regional landscape with polarized
differences, including land tenure, infrastructure, urban development and incentives for
deforestation, that have considerable influence on wildlife and indigenous societies
using them. Highly defensible Indigenous Lands strategically compose the Western
Amazon Ecological Corridor, protected by adjacent Conservation Units and covering the
watershed's headwaters along the international frontier with Peru, hosting less modified
wildlife assemblages. There also lie the Conservation Units of restricted use in the state.
Development and forest exploitation in this region threaten little the Indigenous Lands
(Carneiro Filho and Souza 2009), given their remoteness, tenure, and the fact that
considerable deforestation started only after 1995, remaining limited (Franke 2008; Acre
2009). Hunting with shotguns, conversely, occurs since before 1920s everywhere in the
state and is likely to have been more intensive along the international frontier in the past
because of meat and pelt trade routes to Peru until the 1970s (Doughty and Myers
1971). Low defensible Indigenous Lands, in turn, have unprotected perimeters and
small relative size and are scattered in the development frontier zone planned by the
state government, which hosts the largest cities alongside the BR-364 (Acre 2000),
probably resulting in depleted wildlife. People in these Indigenous Lands have received

58
compensation to mitigate social and environmental road impacts (Iglesias and Aquino
2006). Deforestation there was limited until the exponential growth in cattle production
during the 1980s and intensification during the 1990s (Valentin et al. 2002; Arima et al.
2005, Oliveira and Bardales 2006; Franke 2008). In addition, commercial logging,
regulated or not, takes place in this region including inside some Protected Areas (Acre
2009). In surroundings of the Antimary State Forest, located in the development frontier
in Acre State, game species hunted by local people are likely to have been affected by
encroachment and deforestation (Calouro 1995, 2005). In that Protected Area, the
density of local people decreased 13% in the last 10 years, reducing their hunting
pressure; however, the region went through a rapid development process and forest
loss, leading to deforestation in the surroundings. Landscape transformation and
encroachment, rather than local hunting, could explain the disappearance of some
sensitive species even in the less intensive hunted areas. At a regional scale, Urquiza-
Hass et al. (2009) associate non-local people’s hunting to the loss of many species in
fragments of Mexican forest.
Effects of Roads on Wildlife and Hunters
Roads had a dual effect on the indigenous hunting system. On the one hand they
exacerbated the negative effect of indigenous hunting on animal distance from roadside
villages, which is expected given the disturbances associated to roads that deplete
wildlife in their surroundings (Laurance et al. 2006, 2008). Road effects are expected to
negatively affect large mammals and birds in particular because of their biological traits
(i.e. large movement range, low reproductive rates, and low natural densities; Fahrig
and Rytwinski 2009). Furthermore, roads diminish defensibility of Pano Indigenous
Lands since these are often used by poacher to access forest areas inside and close to
59
Campinas Indigenous Land (Lima 2001; Iglesias and Aquino 2006; Calouro 2007), a
typical consequence of roads in tropical forests (Peres and Lake 2003; Laurance et al.
2008). On the other hand, it seems that, due to their easy access to cities, roadside
Pano communities had different hunting behavior in comparison to communities
alongside rivers, by excluding secondary species from prey profiles. Pano roadside
communities shifted into a market dependent diet that includes farmed fish, livestock
and industrialized meat (Lima E.C., Pessoa, M. and Tavares, R.A. Personal
communication). Because of elevated ammunition prices and low return rates for small
species hunting, hunters substitute them for easily accessed alternative meat sold in
markets, and restrict their hunting to large bodied mammals, mainly ungulates, even in
situations of depleted wildlife (Kensinger 1975; Redford 1993; Jerozolimski and Peres
2003). Independent of my study, a contemporary wildlife census and hunting survey in
the Campinas Indigenous Land indicates that most sensitive species are absent, and
ungulates occur in very low densities, although these contribute most to wildmeat
consumed, while smaller species occur at higher densities but yet are little hunted
(Calouro 2007). This substitution pattern was observed in communities that have
livestock as an alternative meat source, and therefore avoided hunting certain
previously acceptable species (Jerozolimski and Peres 2003) or after an upgrade in
hunting weapons and transportation to market (Winterhalder 1981; Hill and Hawkes
1983). Increasing the profits of hunting (i.e. shifting from subsistence to commercial
harvest) changes the composition of off-take assemblages by focusing on more
profitable species (Damania et al. 2005). Other indigenous people intensified their game
harvest in certain species with increased access to market as a consequence of the

60
shift from subsistence to commercial hunting systems (Sierra et al. 1999). Although this
could explain the pattern in these Indigenous Lands, if Pano engage in illegal
commercial hunting it is to a much lesser extent than subsistence hunting, even though
illegal wildlife commercialization in the region is high. All other Pano communities that
had restricted access to markets, because of reduced size of nearby cities (i.e. Jordão
and Santa Rosa do Purus) or their distance to them (i.e. Tarauacá and Cruzeiro do Sul
to Praia do Carapanã and Breu Indigenous Lands), relied on a much more diversified
fauna, shifting to smaller animals when large game is deplete.
Hence, resulting off-takes and mean prey weight in these villages reflect human
processes more than prey abundances (Ling and Miner-Gulland 2006) and should not
be used to infer wildlife status. Nonetheless, these results are important to understand
the effects of roads in indigenous communities’ behavior and societies.
Source-sink Dynamics of Game Populations
The Western Amazon Ecological Corridor has very low deforestation and human
density, concentrated around small settlements, being one of the few residences of
isolated indigenous groups in the Amazon (Castillo 2002). In such a landscape, game
populations in the large tracts of forests may source populations to the disturbed areas
(Novaro et al. 2000). Source-sink systems might be responsible for the persistence of
healthy populations of sensitive species hunted for decades at unsustainable rates by
indigenous people in a nearby region of Peruvian Amazon (Ohl-Schacherer et al. 2007).
Peres (2001) suggests that hunting persistence (age of village) does not deplete most
of the targeted species near villages because of the constant animal immigration from
adjacent large underharvested forested areas, that include source populations. This
dynamic might also be important to continually provide animals from a same source

61
area for Kaxinawá villages in the Jordão Indigenous Land (Constantino et al. 2008) and
extractivist settlements in the Alto Juruá Extractive Reserve (Ramos 2005). At a larger
scale, source-sink dynamics may be important to maintain the high proportion of
ungulates and the presence of tapirs and large monkeys in villages located in the
headwaters even after many decades of intense hunting. Conversely, source-sink
dynamics in Indigenous Lands of the development frontier, containing more forest and
less hunting pressure than outside, would not function due to reduced habitat or
connectivity (Peres 2001; Hansen and DeFries 2007) or, paradoxically, would invert the
flow, sourcing game to surrounding disturbed sites (Woodroffe and Ginsberg 1998;
Naranjo and Bodmer 2007; Hansen, in preparation). In this zone, this process would
exacerbate the negative effect of surrounding disturbances on wildlife hunted by Pano
communities. Therefore, even if all Pano villages overharvest game species, depletion
would be hidden behind the differential effects of source-sink dynamics.
Indigenous Lands as Protected Areas for Wildlife
Indigenous Lands avoid forest impoverishment by deforestation, logging, and fire
(Nepstad et al. 2006; Adeney et al. 2009; Asner et al. 2009). The same pattern is
observed across Indigenous Lands at the regional scale in Acre, where these are
responsible for only 1% of State deforestation (Acre 2009). The capacity of Indigenous
Lands to avoid depletion of other natural resources, however, has not been assessed at
large scales using empirical data (Nepstad et al. 2006; Adeney et al. 2009). Azevedo-
Ramos and colleagues (2006) even suggest that Indigenous Lands are key to mammal
conservation in the Brazilian Amazon, because they overlap the geographic range of
more species than other Protected Area categories and their large size and low human

62
population density would effectively protect mammal species that easily recover from
hunting loss.
Pano people’s land use and forest conversion, but not hunting, affected wildlife,
principally large mammals. More important, disturbances associated to deforestation
outside Indigenous Lands depleted wildlife in vulnerable villages and low defensible
reserves whereas their size alone was not associated to wildlife conservation. For
instance, most of these areas were smaller than the minimum required to support the
average Amazonian sustainable harvest of most preferred mammals and birds (Peres
2001). The mobility of wildlife also makes it more likely to respond to disturbances from
surrounding areas (Hansen and DeFries 2007). The high performance of Indigenous
Lands in protecting Amazon forests, related to their capacity to inhibit disturbance in
regions of high anthropogenic impact (Nepstad et al. 2006; Azevedo-Ramos et al.
2006), may not function for wildlife protection, as evidenced by the fact that the most
affected Pano villages are located in Indigenous Lands in the Acre development frontier,
thus subject to extreme external influence. Therefore, unlike other sources of forest
degradation (e.g. fire and deforestation) Pano Indigenous Lands alone are not able to
guarantee game conservation and maintenance of indigenous culture.
Management Implications and State Conservation Policy
The findings of this study, although concerning the Kaxinawá and Katukina people,
could be extended to other central place hunter indigenous peoples targeting large
vertebrates with the same hunting techniques in similar heterogeneous environments.
This includes most of the non-isolated indigenous people in Acre State. The majority of
governmental economic and environmental policies related to Indigenous Lands in Acre
are designed and implemented by the State government, which understands them as

63
strategically important for conservation (Acre 2008, 2009). Hunting restrictions have
been adopted as management norms (i.e. quotas, sex and age selection) by many
indigenous and local people to guarantee local sustainable wildlife use, including in
Acre (Gavazzi 2007; Zapata-Ríos et al. 2009). Yet if these norms are to succeed,
decision-making and compliance has to occur in groups of neighboring villages, not only
within single villages, although the efficacy of these restrictions may just influence
wildlife conservation at very local scales. At regional scale, nevertheless, these
management regulations probably do not ensure wildlife conservation. Yet, landscape-
scale is the most appropriate to natural resource management policies that involve local
people and government interaction in the tropics (Frost et al. 2006). In this sense, state
policies that attempt to maintain indigenous culture and wildlife conservation should
target the deforestation within and in the surroundings of Indigenous Lands, their land
use associated disturbances, and non-indigenous hunting in the vicinity of Indigenous
Lands. Regarding Pano people, there is a recent increase in deforestation inside some
Indigenous Lands (SIPAM 2008), and my data indicate that it is positively associated
with village linkage to market but negatively associated with monthly income per family
(Appendix C), explaining together 63% of deforestation. Although the mechanisms for
these associations are not explicit, the government could explore them, given that most
of Pano income comes from retirement and salaries paid by the government to control
deforestation. Indigenous Lands surroundings, in turn, are projected to be severely
deforested in the near future, principally in the development frontier, if the current forest
loss persists (IPAM and Consórcio MABE 2009). In response, the Acre government
recently released a new policy to prevent and control deforestation in the state including

64
within Indigenous Lands (Acre 2008, 2009). Indigenous hunting and game could be
considerably protected as a consequence of deforestation reduction and reforestation
increase according to the government plan (Acre 2009). There is, however, no link
between Indigenous Lands and their vicinity, as well as no mention concerning
integrated wildlife management. Moreover, the government recognizes that these goals
will only be achieved in a scenario of high governance, which depends upon several
factors, including fund raising not yet guaranteed, to strengthen environmental
management capacity and economic sustainability of environmental policies (Acre
2009). At a local scale, the Ethnozoning and Territorial Management Plan of Indigenous
Lands currently supported by the State government (Acre 2008) can be the instruments
through which indigenous people negotiate the landscape approach for wildlife
management.
Considerations on Scale and the Absence of Hunting Effect
The findings in this study differed from most of the others studying the drivers of
game depletion, since Pano hunting had minor effects (Peres 2000; Peres and Palacios
2007). Here I briefly explore some possible explanations. Using hunting data, instead of
direct observation, to infer wildlife status can be biased due to non random sampling
and a possible inability to capture light variation in game populations, since hunters
persist in harvesting rare preferred species as by-catch hunting products (Rowcliffe et
al. 2003). However, this is less likely to be the reason for dissimilar results, since Pano
hunting off-take followed the widespread pattern observed in the Amazon that can be
modeled according to the ecological theories used to derive the indicators. Moreover, I
restricted my analyses to more than 9000 records from 35 communities of Pano people
in a regional scale with small natural environmental variation, with similar hunting
65
preferences and strategies, that had reported hunting on more 50 animals and over a
period of more than six months between 2005 and 2009. By contrast, other large extent
studies analyzing drivers of game variation using hunter-kill profile in multiple tropical
forest sites (>20) were based on meta-analysis of studies with decades of difference,
conducted at continental scale or at intercontinental scale (Robinson and Bennett 2004;
Fa and Peres 2001). These studies used lower cutting values to include sites of hunters
of different cultures in the sample (i.e. undetermined number of animals in Peres (2001);
>30 animals in Jerozolimski and Peres (2003); >40 animals in Fa et al. (2005)). These
differences of culture and hunting technology, ecosystem productivity and spatial and
temporal variation on wildlife abundances may introduce noise in these results
(Emmons 1984; Redford and Robinson 1987; Lupo and Schmitt 2005; Peres and
Palacios 2007; Nasi et al. 2008). Nevertheless, I acknowledge that the ecological
theories supporting the indicators are not expected to explain all the variation in hunters
subsistence systems (Hawkes et al. 2008) and that neglected environmental differences
(i.e. soil fertility and hydrological regime) within the scale of this study (i.e. grain and
extent) may influence game populations non randomly.
Many other studies do not clearly define hunting pressure (Rist et al. 2008), since
it is frequently hard to determine the actual number of hunters using a territory and the
intensity of hunting pressure (Nasi et al. 2008). For example, the common use of
number of people in a settlement to represent hunting pressure (Jerozolimski and Peres
2003; Fa et al. 2005) might not be appropriate, as many indigenous communities
fraction in response to depleted wildlife, becoming a settlement with a small number of
people in a depleted site (Ferguson 1989). Also, a local community hunting territory is

66
often used by neighbors or poachers or is adjacent to areas more intensively harvested,
affecting wildlife hunted by locals (Ferguson 1989; Stearman 1990). Therefore,
attributing the responsibility of game depletion to local people living within Protected
Areas might underestimate the effect of encroachment, animal population dynamics,
spread of wildfire, and edge effects: some of the most common external threats to
biodiversity within Brazilian Conservation Units (Peres and Terborgh 1995; Carrillo et al.
2000; Bruner et al. 2001; Laurance et al. 2000; Nepstad et al. 2006). I was able to
isolate indigenous hunting pressure from other factors due to extensive field surveys as
well as identify the Pano territories exclusively used by them. Nonetheless, hunting from
outside may still have some effect on wildlife since I could not disentangle the effects of
deforestation from non-indigenous hunting on game hunted by the Pano. These factors
may influence wildlife in synergy, which make it more difficult to distinguish between
their effects (Nasi et al. 2008; Fa and Brown 2009; Parry et al. 2009b). In addition, many
tropical forest species that are sensitive to hunting are also sensitive to habitat loss
(Michalski and Peres 2007; Rist et al. 2009) and fire effects (Peres et al. 2003; Barlow
and Peres 2006). Therefore, fluctuations in their populations, frequently assumed to be
a consequence of hunting pressure may be related erroneously to one of the processes
if the others are not properly acknowledged. Satellite based information only recently
became available, yet for restricted regions, allowing the regular use of habitat
disturbance variables in scales appropriate to game species, mostly neglected in
previous studies (Redford and Robinson 1987; Peres 2001; Jerozolimski and Peres
2003; Fa et al. 2005).

67
The scale of this study is a plausible explanation for the marked difference in
results. Most wildlife and hunting research is conducted either at local or global scales
in the Amazon, mainly restricted by methodological issues (Nepstad et al. 2006). Spatial
scale alone can explain much of the variation in the response of wildlife to habitat loss
(Hill and Hamer 2004; Dumbrell et al. 2008) and to human occupancy (Pautasso 2007).
Robinson and Bodmer (1999) claim that indigenous hunting has been sustainable at the
landscape level whereas, locally, many species must have been extirpated, since
hunting effects operate only around settlements (Lewis et al. 2004). Pano hunting had
only local effects on wildlife, which might have been suppressed by the landscape
differences in deforestation. Likewise, most local studies report the hunting-induced
depletion trend, although confounded by source-sink dynamics (Ohl-Schacherer et al.
2007), whilst recent studies at similar regional scale to mine have assessed the effects
of hunting and habitat disturbance on game animals (Ramos 2005; Peres and Michalski
2005, 2007; Urquiza-Hass et al. 2009), with impressive indications of the importance of
deforestation over local hunting. In this intermediate spatial scale (grains circa 10km
diameter and extent circa 70,000km2), species richness is expected to have no
relationship with human presence (Pautasso 2007). Although local and global studies
are relevant they might not be appropriate to orient policies that are usually
implemented at regional levels (Ferrier 2002; Fisher and Owens 2004; Frost et al. 2006;
Fritz et al. 2009), the scale of decisions regarding Indigenous Lands in Acre, and
particular by appropriate to study large mammals in the Amazon due to their
metapopulation dynamics.
68
In addition, major drops in mammals densities due to hunting are more likely to
occur in previously unhunted sites than those already exploited (Nasi et al. 2008; Fa
and Brown 2009). Many studies suggest that hunting depletes wildlife, based on
comparisons between unhunted and hunted sites (Carrillo et al. 2000; Peres 2000) or
following game population changes in the first years after settlements establishment
(Vickers 1980; Ayres et al. 1991). This is certainly not the case in Pano villages as the
region is subject to centenary intense hunting but only recently has been affected by
major land conversion, more prominent in the development frontier. A selective filter
may operate after initial hunting pressure, where tolerant species and population
abundances remain stable in sites (Balmford 1996; Cowlishaw et al. 2005) until other
processes start adding to the negative effect of hunting (Cullen et al. 2000). Frontiers
are more prone to witness extirpation of large bodied species (Davis et al. 2008; Fritz et
al. 2009) since sensitive species are still present but unprotected from anthropogenic
threats (Balmford 1996).
The temporal dimension of this study may also have implications in my findings. In
2005, the southwestern Amazon experienced an abnormally severe drought with
widespread and intense associated fire (Aragão et al. 2007). Although villages all over
the state were affected by uncontrolled fire, those located in the development frontier
were more affected by external disturbance than those protected in the headwaters,
with several recurrent burns (Carneiro Filho and Souza 2009). Hence, burning patterns
overlaps deforestation distribution, making the effects of these threats hard to
distinguish. Despite our vague understanding of long term responses of wildlife to forest
fire, certain species seems to be absent from recurrent burned sites or have abundance

69
reduced (Barlow and Peres 2006). However, if game species in Acre are somehow
responding to the extended wildfire that occurred in 2005, climate change must be a
major threat to those species because the southwestern Amazon region is particularly
affected in cases of North Atlantic warming, becoming more prone to forest fires,
principally alongside roads (Aragão et al. 2007).

70
CHAPTER 5 CONCLUSIONS
Pano people’s hunting does not cause major impacts in the game they hunt. Even
in an Amazon region relatively conserved, deforestation is the main driver of gradual
game depletion. Forest loss and probably other associated disturbances (i.e.
fragmentation and fire) reduce game populations and extirpate most sensitive species
inside Indigenous Lands. Indigenous Lands may avoid forest loss but do not alone
guarantee wildlife conservation in Acre. Land use and hunting by non-indigenous
neighbors, and the Indigenous Land’s location and design, may contribute considerably
to game depletion in Pano villages. Although hypothesized for regional scales, the null
indigenous hunting effect as opposed to habitat loss impact on game had not been
reported in the literature, due to the difficulty of disentangling factors, and data and
scale restrictions. Roads impacted wildlife negatively by exacerbating hunting effects,
while restricting hunters' dependence on large game, independence of its abundance,
by allowing easier access to alternative meat. It is possible that the anticipated disaster
of near future deforestation will not affect game species and Pano people, if the recent
Acre State policy for deforestation and fire control and prevention is effectively
implemented. However, policies that integrate Indigenous Lands and its vicinity are still
required.

71
APPENDIX A KERNEL DENSITY ESTIMATES OF DISTANCE OF PREFERRED ANIMALS HUNTED
FROM THE VILLAGE
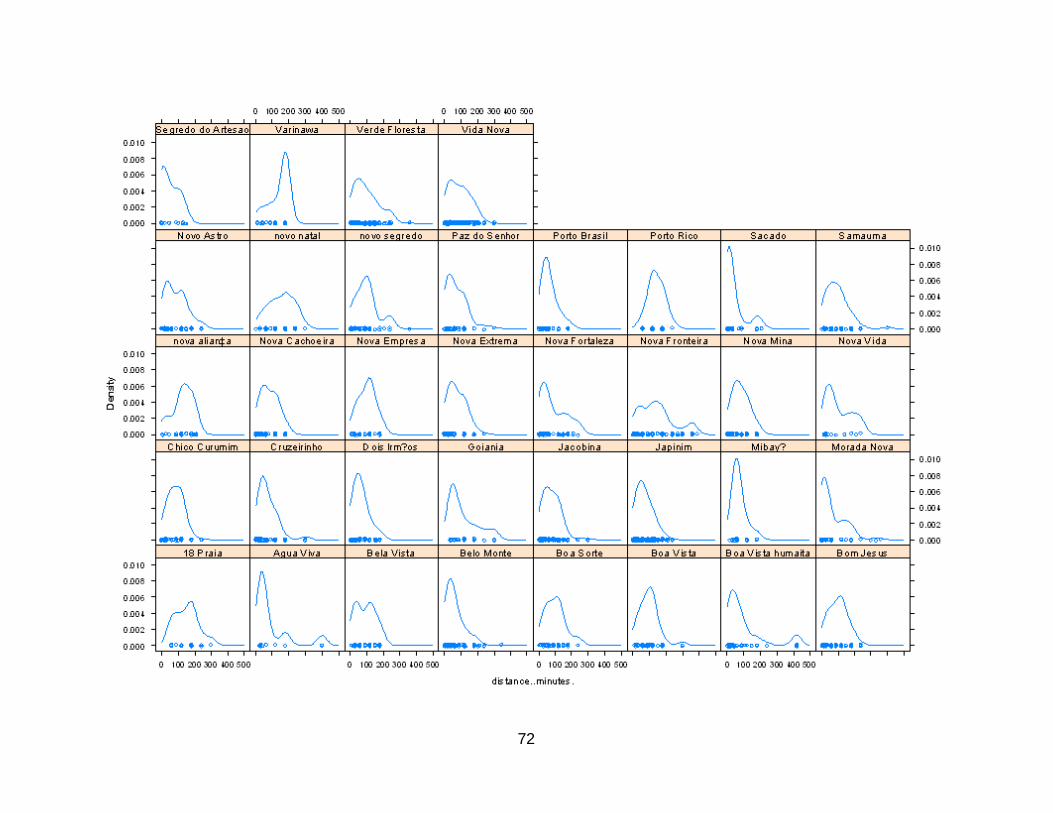
72

73
APPENDIX B WILDLIFE STATUS INDICATORS AND ITS RELATED ECOLOGICAL MODELS AND
THEORIES

74
Indicator Model/Theory Expected outcome Comments
Mean prey weight Optimum Foraging Theory
Average weight of hunted animals decline in depleted sites in response to decline in large bodied vertebrates
Provide a proxy for the assemblage of game animals regardless of species, likely to be related to variation in population abundances
Capture per Unit of Effort (CPUE) of preferred species
Optimum Foraging Theory/ Ecological Economics
Hunters spend more time to pursue meat of preferred animals in depleted sites in response to decline in large game abundance
Restricted to preferred species since return rates of secondary animals may not reflect abundance; Allows for indication of hunting success on single species or taxa
Sensitive species richness Indicator Species
Species sensitive to human disturbance of different natures decline to level that are no longer hunted, ultimately becoming extirpated, with increasing wildlife depletion
Given non random extinction process certain species reflect overall status of wildlife assemblage status
Mode distance of preferred species from the village
Central Place Forager Model
Hunters catch preferred animals farther away from villages where central place hunting depletes game populations
Restricted to preferred animals since the distance of secondary animals might not reflect species abundances; given a non parametric distribution of distance values, mode was more appropriate to describe the most common distance

75
APPENDIX C PEARSON’S CORRELATION MATRIX OF VARIABLES POSSIBLY INFLUENCING
HUNTING IN INDIGENOUS VILLAGES, CONSIDERING 29 VILLAGES

76
Hunting pressure Land use Socio-economy
Explanatory variables
Population size
Village age
(years)
Square Root of number
of hunters
Density of Indigenous
people (people/5km
radius buffer)
Log10 deforested
area in 5km radius buffer (ha)
Square root of
distance to entrance of Indigenous Land (km)
Log10 deforested
area in 5km buffer but inside
Indigenous Land (ha)
Log10 deforested
area in 5km buffer but outside Indigenous Land (ha)
Log10 number of employees
Income per family
($/family)
Distance to market
(km)
Log10 Animal Unita
Population sizea 1 0.189
(0.33) 0.672
(0.00)*** 0.181 (0.35) -0.187 (0.33)
0.030 (0.88)
-0.14 (0.40) 0.04 (0.88) 0.733
(0.00)*** -0.143 (0.46)
-0.70 (0.72)
0.02 (0.9)
Village agea 1 0.132 (0.49) -0.07 (0.7) -0.076
(0.69) 0.156 (042) 0.03 (0.84) -0.06 (0.81)
0.294 (0.12)
0.209 (0.28)
0.025 (0.90)
0.04 (0.83)
Square Root # Hunters 1 -0.127
(0.51) -0.576 (0.00)**
0.353 (0.06)
-0.50 (0.00)** 0.37 (0.20) 0.598
(0.00)** 0.119 (0.54)
0.353 (0.06)
0.06 (0.76)
Density of Indigenous peoplea
1 0.348 (0.06) -0.22 (0.25) 0.37 (0.3)* -0.29
(0.27) 0.107 (0.58)
-0.029(0.88)
-0.258 (0.18)
0.31 (0.1)
Log10 Deforested area (ha)a
1 -0.719 (0.00)***
0.94 (0.00)***
0.73 (0,00)***
-0.243 (0.20)
-0.568 (0.00)**
-0.748 (0.00)***
0.46 (0.07)*
Square Root of distance to entrance of Indigenous Land
1 -0.63 (0.00)***
-0.74 (0.00)**
-0.071 (0.71)
0.433 (0.02)*
0.887 (0.00)***
-0.37 (0.05)*
Log10 deforested area in 5km buffer but inside Indigenous Land (ha)
1 0.26 (0.32) -0.27 (0.15)
-0.54 (0.00)**
-0.74 (0.00)***
0.30 (0.11)
Log10 deforested area in 5km buffer but outside Indigenous Land (ha)
1 0.00 (0.99) -0.43 (0.12)
-0.20 (0.51)
0.26 (0.40)
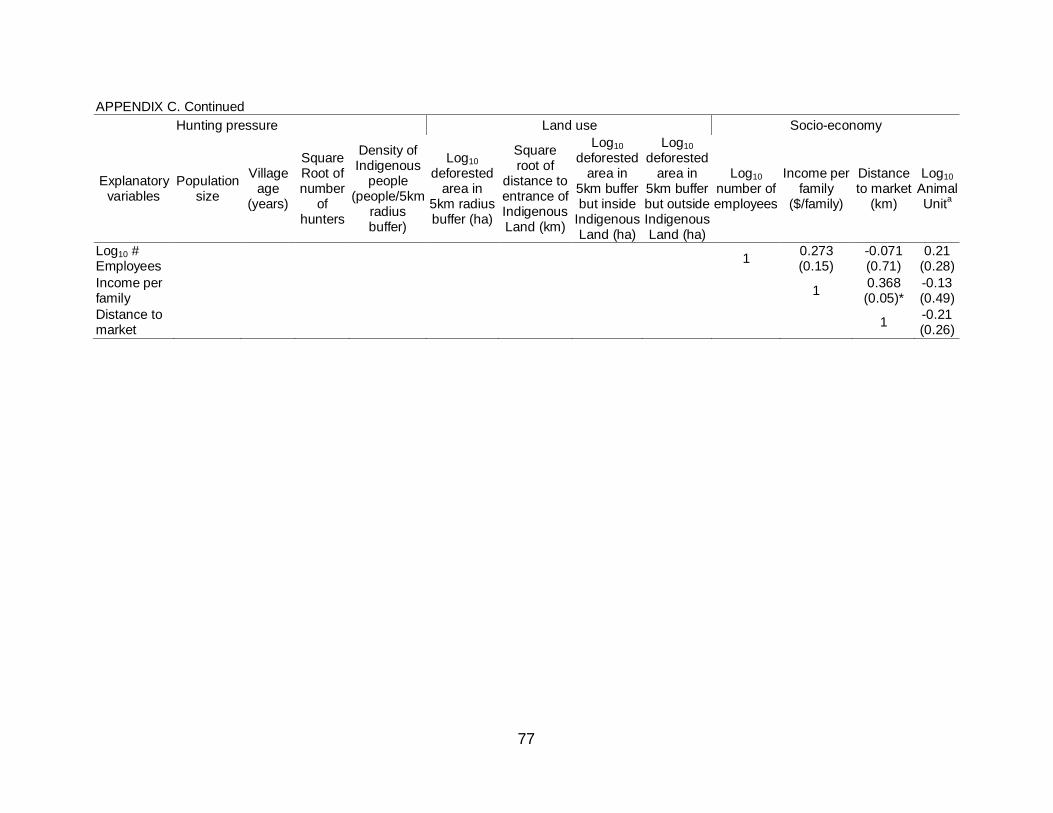
77
APPENDIX C. Continued Hunting pressure Land use Socio-economy
Explanatory variables
Population size
Village age
(years)
Square Root of number
of hunters
Density of Indigenous
people (people/5km
radius buffer)
Log10 deforested
area in 5km radius buffer (ha)
Square root of
distance to entrance of Indigenous Land (km)
Log10 deforested
area in 5km buffer but inside
Indigenous Land (ha)
Log10 deforested
area in 5km buffer but outside Indigenous Land (ha)
Log10 number of employees
Income per family
($/family)
Distance to market
(km)
Log10 Animal Unita
Log10 # Employees 1 0.273
(0.15) -0.071 (0.71)
0.21 (0.28)
Income per family 1 0.368
(0.05)* -0.13 (0.49)
Distance to market 1 -0.21
(0.26)
78
LIST OF REFERENCES
Acre (2000) Programa Estadual de Zoneamento Ecológico-Econômico do Estado do Acre. Zoneamento Ecológico-Econômico: aspectos socioeconômicos e ocupação territorial, vol. 2. SECTMA, Rio Branco.
Acre (2006). Governo do Estado do Acre. Programa Estadual de Zoneamento
Ecológico-Econômico do Estado do Acre. Zoneamento Ecológico-Econômico do Acre Fase II: Documento Síntese – Escala 1:250.000. SECTMA, Rio Branco.
Acre (2008) Brazil: Acre social and economic inclusion project (PROACRE). Executive
summary of the environmental assessment. Draft report. World Bank, Washington. Acre (2009) Plano Estadual de prevenção e controle dos desmatamentos do Acre.
Governo do Estado do Acre, Rio Branco. Adeney, J.M., Christensen, N.L. & Pimm, S.L. (2009) Reserves protect against
deforestation fires in the Amazon. PLOS One, 4, e5014. Albrechtsen, L., MacDonald, D.W., Johnson, P.J., Castelo, R. & Fa, J.E. (2007) Faunal
loss from bushmeat: empirical evidence and policy implications in Bioko Island. Environmental Science and Policy, 10, 654-667.
Almeida, M.B., Lima, E.C., Aquino, T.V. & Iglesias, M.P. (2002) Caçar. Enciclopédia da
Floresta (eds M.C. Cunha & M.B. Almeida), pp. 311-336. Companhia das Letras, São Paulo.
Alvard, M.S. (1993) Testing the “ecologically noble savage” hypothesis: Interspecific
prey choice by Piro hunters of Amazonian Peru. Human Ecology, 21, 355-387. Alvard, M.S. (1995) Intraspecific prey choice by Amazonian hunters. Current
Anthropology, 36, 789-818. Alvard, M.S., Robinson, J.G., Redford, K.H. & Kaplan, H. (1997) The sustainability of
subsistence hunting in the Neotropics. Conservation Biology, 11, 977-982. Amaral, B.D. (2005) Fisheries and fishing effort at the indigenous reserves
Ashaninka/Kaxinawá, river Breu, Brazil/Peru. Acta Amazonica, 35, 133-144. Aquino, T.V. & Iglesias, M.P. (1994) Kaxinawá do Rio Jordão: história, território,
economia e desenvolvimento sustentado. Comissão Pró-Índio do Acre, Rio Branco. Aragão, L.E.OC., Malhi, Y. Roman-Cuesta, R.M., Saatchi, S., Anderson, L.O. &
Shimabukuro, Y.E. (2007) Spatial patterns and fire response of recent Amazonian droughts. Geophysical Research Letters, 34, L07701.

79
Aragão, L.E.O.C., Malhi, Y., Barbier, N., Lima, A., Shimabukuru, Y., Anderson, L. & Saatchi, S. (2008) Interactions between rainfall, deforestation and fires during recent years in Brazilian Amazonia. Philosophical Transactions of the Royal Society B, 363, 1779-1785.
Arima, E., Barreto, P. & Brito, M. (2005) Pecuária na Amazônia: Tendências e
implicações para a conservação ambiental. Instituto do Homen e Meio-Ambiente da Amazônia, Belém.
Asner, G.P., Knapp, D.E., Broadbent, E.B., Oliveira, P.J.C., Keller, M. & Silva, J.N.
(2005) Selective logging in the Brazilian Amazon. Science, 310, 480-482. Asner, G.P., Rudel, T.K., Aide, M., DeFries, R. & Emerson, R. (2009) A contemporary
assessment of change in humid tropical forests. Conservation Biology, 23, 1386-1395.
Ayres, M., Magalhães-Lima, D., De Sousa Martins, E. & Barreiros, J.L. (1991) On the
tract of the road: changes in subsistence hunting in a Brazilian Amazonian village. Neotropical Wildlife Use and Conservation (eds J.G. Robinson & K.H. Redford), pp. 82-92. University of Chicago Press, Chicago.
Azevedo-Ramos, C., Amaral, B.D., Nepstad, D.C., Soares-Filho, B. & Nasi, R. (2006)
Integrating ecosystem management, Protected Areas, and mammal conservation in the Brazilian Amazon. Ecology and Society, 11, art. 17.
Balmford, A. (1996) Extinction filters and current resilience: the significance of past
selection pressures for conservation biology. Trends in Ecology and Evolution, 11, 193-196.
Barlow, J. & Peres, C.A. (2006) Effects of single and recurrent wildfires on fruit
production and large vertebrate abundance in a central Amazonian forest. Biodiversity and Conservation, 15, 985-1012.
Barlow, J., Gardner, T.A., Araujo, I.S., Ávila-Pires, T.C., Bonaldo, A.B., Costa, J.E.,
Esposito, M.C., Ferreira, L.V., Hawes, J., Hernandez, M.I.M., Hoogmoed, M.S., Leite, R.N., Lo-Man-Hung, F.N., Macolm, J.R., Martins, M.B., Mestre, L.A.M., Miranda-Santos, R., Nunes-Gutjahr, A.L., Overal, W.L., Parry, L., Peters, S.L., Ribeiro-Junior, M.A., da Silva, M.N.F., da Silva Motta, C. & Peres, C.A. (2007) Quantifying the biodiversity value of tropical primary, secondary, and plantation forests. Proceedings of the National Academy of Science, 104, 18555-18560.
Bant, A. & Pessoa, M. (2008) Levantamento Etnoecológico das Terras Indígenas do
Complexo Bacia do Rio Juruá: Kaxinawá da Praia do Carapanã, Kampa do Igarapé Primavera e Kulina do Igarapé do Pau. FUNAI/PPTAL/GTZ. Brasilia, DF.

80
Barreto, P., Souza Jr., C., Noguerón, R., Anderson, A., Salomão, R. & Willies, J. (2006) Human pressure on the Brazilian Amazon forests. World Resources Institute Report, Washington.
Bird, D.W., Bird, R.B. 7 Codding, B.F. (2009) In pursuit of mobile prey: Martu strategies
and archaeofauna interpretation. American Antiquity, 74, 3-29. Bodmer, R.E., Aquino, R., Puertas, P., Reyes, R., Fang, T. & Gottbenker, N. (1997)
Manejo y uso sustentable de pecaries en la Amazonia Peruana. International Union for the Conservation of Nature and Natural Resources, Quito.
Bonaudo, T., Le Pendu, Y. Faure, J.F. & Quanz, D. (2005) The effects of deforestation
on wildlife along the transamazon highway. European Journal of Wildlife Research, 51, 199-206.
Boyle, S.A. (2008) The effects of forest fragmentation on primates in the Brazilian
Amazon. PhD thesis, Arizona State University. Brackelaire, V. (2005) Inventário de iniciativas socioambientales en la Amazonia del
Noroeste – Brasil, Colombia, Venezuela. Cooperación y Alianza en el Norte y Oeste Amazónico, Bogotá.
Brashares, J.S., Arcese, P. & Sam, M.K. (2001) Human demography and reserve size
predicts wildlife extinction in West Africa. Proceedings of the Royal Society of London B, 268, 2473-2478.
Broadbent, E.N., Asner, G.P., Keller, M., Knapp, D.E., Oliveira, P.J.C. & Silva, J.N.
(2008) Forest fragmentation and edge effect from deforestation and selective logging in the Brazilian Amazon. Biological Conservation, 141, 1745-1757.
Brockington, D., Igoe, J. & Schmidt -Soltau, K. (2006) Conservation, human rights, and
poverty reduction. Conservation Biology, 20, 250-252. Broich, M., Stehman, S.V., Hansen, M.C., Potapov, P. & Shimabukuru, Y. (2009) A
comparison of sampling designs for estimating deforestation from Landsat imagery: A case study of the Brazilian Legal Amazon. Remote Sensing of Environment, 113, 2448-2454.
Brook, B.W., Sodhi, N.S. & Bradshaw, C.J.A. (2008) Synergies among extinction drivers
under global change. Trends in Ecology and Evolution, 23, 453-460. Brooks, T.M., Wright, S.J. & Sheil, D. (2009) Evaluating the success of conservation
actions in safeguarding tropical forest biodiversity. Conservation Biology, 23, 1448-1457.
81
Bruner, A.G., Gullison, R.E., Rice, R.E. & Fonseca, G.A.B (2001) Effectiveness of parks in protecting Tropical biodiversity. Science, 291, 125-128.
Buck, L.E., Shames, S. & Scherr, S.J. (2007) Reframing the Protected Areas-livelihood
debate: Conserving biodiversity in populated agricultural landscapes. Protected Areas and Human Livelihoods (eds K.H. Redford & E. Fearn), pp. 130-134. Wildlife Conservation Society, New York.
Calouro, A.M. (1995) Caça de subsistência: sustentabilidade e padrões de uso entre
seringueiros ribeirinhos e não-ribeirinhos no Estado do Acre. M.S. thesis, Universidade de Brasilia.
Calouro, A.M. (2005) Análise do manejo florestal de “baixo impacto” e da caça de
subsistência sobre uma comunidade de primatas na Floresta Estadual de Antimary (Acre, Brasil). Ph.D. Thesis, Universidade de São Carlos.
Calouro A.M. (2007) Atividades de monitoramento participativo de fauna na Terra
Indígena Campinas/Katukina (AC). Projeto Segurança alimentar, produção e gestão territorial: Apoio às comunidades indígenas Katukina das Terras Indígenas Campinas e Gregório – Fase II. Governo do Estado do Acre, Rio Branco.
Cannon, M.D. (2003) A model of central place forager prey choice and an application to
faunal remains from the Mimbres Valley, New Mexico. Journal of Anthropological Archaeology, 22, 1-25.
Cardillo, M., Jones, K.E., Mace, G.M., Bielby, J., Bininda-Emmons, O.R.P., Sechrest,
W., Orme, C.D.L. & Purvis, A. (2005) Multiple causes of high extinction risk in large mammal species. Science, 309, 1239-1241.
Cardillo, M., Mace, G.M., Gittleman, J.L., Jones, K.E., Bielby, J. & Purvis, A. (2008) The
predictability of extinction: biological and external correlates of decline in mammals. Proceedings of the Royal Society B, 275, 1441-1448.
Carneiro Filho, A. & Souza, O.B. (2009) Atlas de pressões e Ameaças às Terras
Indígenas na Amazônia Brasileira. Instituto SocioAmbiental, São Paulo. Carrillo, E., Wong, G. & Cuarón, A.D. (2000) Monitoring mammal populations in Costa
Rica Protected Areas under different hunting restrictions. Conservation Biology, 14, 1580-1591.
Castillo, H.B. (2002) Indigenous people in isolation in the Peruvian Amazon: their
struggle for survival and freedom. WIGIA, Copenhagen. CDC-UNALM (2006) Implementación del plan de monitoreo de la salud de la
biodiversidad en la Zona Reservada Sierra del Divisor: Monitoreo de las amenazas vía sensores remotos. Informe final. CDC-UNALM, Lima.

82
Chiarello, A.G. (1999) Effects of fragmentation of the Atlantic forest on mammal
communities in south-eastern Brazil. Biological Conservation, 89, 71-82. Constantino, P.A.L., Fortini, L.B., Kaxinawa, F.R.S., Kaxinawa, A.M., Kaxinawa, E.S.,
Kaxinawa, A.P., Kaxinawa, L.S., Kaxinawa, J.M. & Kaxinawa, J.P. (2008) Indigenous collaborative research for wildlife management in Amazonia: the case of Kaxinawá, Acre, Brazil. Biological Conservation, 141, 2718-2729.
Cowlishaw, G., Mendelson, S. & Rowcliffe, M. (2005) Evidence of post-depletion
sustainability in a mature bushmeat market. Journal of Applied Ecology, 42, 460-468.
Crookes, D.J., Ankudey, N. & Milner-Gulland, E.J. (2005) The value of a long-term
bushmeat market dataset as an indicator of system dynamics. Environmental Conservation, 32, 333-339.
CPI-AC (2005a) I Oficina de etnomapeamento das TIs Kaxinawá do Rio Jordão, Baixo
Jordão e Seringal Independência. Internal report. Comissão Pró-Índio do Acre, Rio Branco.
CPI-AC (2005b) I Oficina de etnomapeamento da TI Kaxinawá do Rio Humaitá. Internal
report. Comissão Pró-Índio do Acre, Rio Branco. Cullen, L., Bodmer, R.E. & Valladares-Pádua, C. (2000) Effects of hunting in habitat
fragments of the Atlantic forests, Brazil. Biological Conservation, 95, 49–56. Cunha, M.C. & Almeida, M.B. (2002) Enciclopédia da Floresta, 1st ed. Companhia das
Letras, São Paulo. Daily, G.C., Ceballos, G., Pacheco, J., Suzán, G. & Sánchez-Azofeifa, A. (2003)
Countryside biogeography of Neotropical mammals: Conservation opportunities in agricultural landscapes of Costa Rica. Conservation Biology, 17, 1814-1826.
Damania, R., Milner-Gulland, E.J. & Crookes, D.J. (2005) A bioeconomic analysis of
bushmeat hunting. Proceedings of the Royal Society B, 272, 259-266. Davidson, A.D., Hamilton, M.J., Boyer, A.G., Brown, J.H. & Ceballos, G. (2009) Multiple
ecological pathways to extinction in mammals. Proceedings of the National Academy of Science, 106, 10702-10705.
Davis, T.J., Frits, S.A., Gryner, R., Orme, C.D.L., Bielby, J., Bininda-Emmons, O.R.P.,
Cardillo, M., Jones, K.E., Gittleman, J.L., Mace, G.M. & Purvis, A. (2008) Phylogenetic trees and the future of mammalian biodiversity. Proceedings of the National Academy of Science, 105, 11556-11563.

83
DeFries, R., Asner, G.P., Achard, F., Justice, C., Laporte, N., Price, K., Small, C. & Townshend, J. (2005) Monitoring tropical deforestation for emerging carbon markets. Reduction of tropical deforestation and climate change mitigation (eds P. Moutinho & S. Schwartzman), pp. 1-27. IPAM, Washington.
Deshayes, P. (1986) La manera de cazar de los Huni Kuin: Una domesticacion
silvestre. Extracta, 5, 7-10. Doughty, R.W. & Myers, N. (1971) Notes on the Amazon wildlife trade. Biological
Conservation, 3, 293-297. Dumbrell, A.J., Clark, E.J., Frost, G.A., Randell, T.E., Pitchford, J.W. & Hill, J.K. (2008)
Changes in species diversity following habitat disturbance are dependent on spatial scale: theoretical and empirical evidence. Journal of Applied Ecology, 45, 1531-1539.
Emmons, L.H. (1984) Geographic variation in densities and diversities of non-flying
mammals in Amazonia. Biotropica, 16, 210-222. Escamilla, A., Sanvicente, M., Sosa, M. & Galindo-Leal, C., (2000) Habitat mosaic,
wildlife availability, and hunting in the tropical forest of Calakmul, Mexico. Conservation Biology, 14, 1592–1601.
Estrada. A., Coates-Estrada, R. & Meritt Jr., D. (1994) Non flying mammals and
landscape changes in the tropical rain forest regions of Los Tuxtlas, Mexico. Ecography, 17, 229-241.
Fa. J.E. (2007) Bushmeat markets – White elephants or red herrings? Bushmeat and
livelihoods: Wildlife management and poverty reduction (eds G. Davies & D. Brown), pp. 47-60. Blackwell Publishing, UK.
Fa, J.E. & Peres, C.A. (2001) Game vertebrates extraction in African and Neotropical
forests: an intercontinental comparison. Conservation of exploited species (J.D Reynolds, G.M. Mace, K.H. Redford, & J.G. Robinson), pp. 203-241. Cambridge Press, UK.
Fa, J.E. & Brown, D. (2009) Impacts of hunting on mammals in African tropical moist
forests: a review and synthesis. Mammal Review, 39, 231-264. Fa, J.E., Johnson, P.J., Dupain, J., Lapuente, J., Köster, P. & MacDonald, D.W. (2004)
Sampling effort and dynamics of bushmeat markets. Animal Conservation, 7, 409-416.
Fa, J.E., Ryan, S.F. & Bell, D.J. (2005) Hunting vulnerability, ecological characteristics
and harvest rates of bushmeat species in afrotropical forests. Biological Conservation, 121, 167-176.

84
Fahrig, L. & Rytwinski, T. (2009) Effects of roads on animal abundance: An empirical
review and synthesis. Ecology and Society, 14, art. 21. Ferguson, R.B. (1989) Game war? Ecology and conflict in Amazonia. Journal of
Anthropological Research, 45, 179-206. Ferrier, S. (2002) Mapping spatial pattern in biodiversity for regional conservation
planning: where to from here? Systematic Biology, 51, 331-363. Fisher, D.O. & Owens, P.F. (2004) The comparative method in conservation biology.
Trends in Ecology and Evolution, 19, 391-398. FitzGibbon, C. (1998) The management of subsistence harvesting: Behavioral ecology
of hunters and their mammalian prey. Behavioral ecology and conservation biology (ed. T.M. Caro), pp. 449-473. Oxford University Press, UF.
Fragoso, J.M.V. (1998) Home range and movement patterns of white-lipped peccary
(Tayassu pecari) herds in the Northern Brazilian Amazon. Biotropica, 30, 458-469. Fragoso, J.M.V. (1999) Perception of scale and resource partitioning by peccaries:
Behavioral causes and ecological implications. Journal of Mammalogy, 80, 993-1003.
Franke, I.L. (2008) Manejo Florestal Madeireiro e Contenção do Desmatamento no
Estado do Acre. Secretaria de Estado de Florestas, Rio Branco. Franzen, M. (2006) Evaluating the sustainability of hunting: a comparison of harvest
profiles across three Huaorani communities. Environmental Conservation, 33, 36-45.
Fritz, S.A., Bininda-Emmons, O.R.P. & Purvis, A. (2009) Geographical variation in
predictors of mammalian extinction risk: big is bad, but only in the tropics. Ecology letters, 12, 583-549.
Frost, P., Campbell, C., Medina, G. & Usongo, L. (2006) Landscape-scale approaches
for integrated natural resource management in tropical forest landscapes. Ecology and Society, 11, art. 30.
Gavazzi, R.A. (2007) Plano de Gestão Ashaninka. APIWTXA/AMAAI-AC/CPI-AC, Rio
Branco. Gavin, M.C. (2007) Foraging in the fallows: Hunting patterns across a successional
continuum in the Peruvian Amazon. Biological Conservation, 134, 64-72.

85
Gitzen, R.A., Millspaugh, J.J. & Kernohan, B.J. (2006) Bandwidth selection for fixed-kernel analysis of animal utilization distributions. Journal of Wildlife Management, 70, 1334-1344.
Grelle, C.E.V. (2005) Predicting extinction of mammals in the Brazilian Amazon. Oryx,
3, 347-350. Hames, R. (2007) The ecologically noble savage debate. Annual Review of
Anthropology, 36, 177-190. Hames, R.B. & Vickers, W.T. (1982) Optimal diet breadth theory as a model to explain
variability in Amazonian hunting. American Ethnologist, 9, 358-378. Hansen, A. (In preparation) Contribution of source-sink theory to Protected Areas
science. Source, sinks, and sustainability across landscapes (eds J. Liu, V. Hull, A. Morizillo, & J. Wiens). H. Ronald Pulliam Symposium Proceedings. 2008 US-IALE conference.
Hansen, A.J. & DeFries, R. (2007) Ecological mechanisms linking protected areas to
surrounding lands. Ecological Applications, 17, 974-988. Hawkes, K., Hill, K. & O'Connell, J.F. (2008) Why hunters gather: Optimal Foraging
Theory and the Aché of Eastern Paraguay. Environmental anthropology: A historical reader (eds M.R. Dove & C. Carpenter), pp 265-283. Blackwell Publishing, MA.
Hill, K. & Hawkes, K. (1983) Neotropical hunting among the Aché of Eastern Paraguay.
Adaptive responses of native Amazonians (eds R.B. Hames, & W.T. Vickers), pp. 139-187. Academic Press, NY.
Hill, J.K. & Hamer, K.C. (2004) Determining impacts of habitat modification on diversity
of tropical forest fauna: the importance of spatial scale. Journal of Applied Ecology, 44, 744-754.
Hill, K., Padwe, J., Bejyvagi, C., Bepurangi, A., Jakugi, F., Tykuarangi, R. & Tykuarangi,
T. (1997) Impact of hunting on large vertebrates in the Mbaracayu Reserve, Paraguay. Conservation Biology, 11, 1339-1353.
Hill, K., McMillan, G. & Farina, R. (2003) Hunting-related changes in game encounter
rates from 1994 t0 2001 in the Mbaracayu Reserve, Paraguay. Conservation Biology, 17, 1312-1323.
Hyrashi, S., Souza Jr., C., Sales, M. & Verissimo, A. (2009) Transparência florestal da
Amazônia Legal (Dezembro 2009 e Janeiro 2010). IMAZON, Pará.

86
IBGE (2009) Levantamento e classificação da cobertura e uso da terra. Coordenação de Recursos Naturais e Estudos Ambientais, Diretoria de Geociências, IBGE, Rio de Janeiro.
Iglesias, M.P. and Aquino, T.V. (2006) Gestão Territorial e Ambiental em Terras
Indígena. Programa Estadual de Zoneamento Ecológico-Econômico do Estado do Acre – Fase II. Governo do Estado do Acre, Secretaria de Estado de Meio Ambiente e Recursos Naturais, Rio Branco.
INPE (2005) Prodes: assessment of deforestation in Brazilian Amazon. Instituto
Nacional de Pesquisas Espaciais (INPE), São Paulo. IPAM & Consórcio MABE (2009) Identificação de áreas críticas ao longo das estradas
BR 364 e 317, estados do Acre, Rondônia e Amazonas. Instituto de Pesquisa Ambiental da Amazônia, Belém.
Isaac, N.B. & Cowlishaw, G. (2004) How species respond to multiple extinction threats.
Proceedings of the Royal Society B, 271, 1135-1141. Jerozolimski, A. & Peres, C.A. (2003) Bringing home the biggest bacon: a cross-site
analysis of the structure of hunter-kill profiles in Neotropical forests. Biological Conservation, 111, 415-425.
Juste, J., Fa, J.E., Perez del Val, J. & Castroviejo, J. (1995) Market dynamics of
bushmeat species in Equatorial Guinea. Journal of Applied Ecology, 32, 454-467. Kensinger, K.M. (1975) Studying the Cashinahua. The Cashinahua of eastern Peru:
Studies in Anthropology and Material Culture, Volume 1 (ed J.P. Dwyer), pp. 9-85. The Haffenreffer Museum of Anthropology, Brown University.
Kensinger, K.M. (1983) On meat and hunting. Current Anthropology, 24, 128-129. Kensinger, K.M. (1995). How real people ought to live: the Cashinahua of Eastern Peru,
1st ed. Waveland Press, Illinois. Kinnaird, M.F., Sanderson, E.W., O'Brien, T.G., Wibisono, H.T. & Woolmer, G. (2003)
Deforestation trends in a tropical landscape and implications for endangered large mammals. Conservation Biology, 17, 245-257.
Lagrou, E. (2004) Sorcery and shamanism in Cashinahua discourse and praxis, Purus
river, Brazil. In darkness and secrecy: the anthropology of assault sorcery and witchcraft in Amazonia (eds N.L. Whitehead and R. Wright), pp. 244-271. Duke University Press
Laurance, W.F & Useche, D.C. (2009) Environmental synergisms and extinctions of
tropical species. Conservation Biology, 23, 1427-1437.

87
Laurance, W.F., Vasconcelos, H.L. & Lovejoy, T.E. (2000) Forest loss and
fragmentation in the Amazon: implications for wildlife conservation. Oryx, 34, 39-45. Laurance, W.F., Lovejoy, T.E., Vasconcelos, H.L., Bruna, E.M., Didham, R.K., Stouffer,
P.C., Gascon, C., Bierregaard, R.O., Laurance, S.G. & Sampaio, E. (2002) Ecosystem decay of Amazonian forest fragment: a 22-year investigation. Conservation Biology, 16, 605-618.
Laurance, W.F., Croes, B.M., Tchignoumba, L., Lahm, S.A., Alonso, A., Lee, M.E.,
Campbell, P. & Ondzeano, C. (2006) Impact of roads and hunting on Central African rainforest mammals. Conservation Biology, 20, 1251-1261.
Laurance, W.F., Croes, B.M., Guissouegou, N., Buij, R., Dethier, M. & Alonso, A. (2008)
Impact of roads, hunting, and habitat alteration on nocturnal mammals in African rainforest. Conservation Biology, 22, 721-732.
Levi, T., Shepard Jr., G.H., Ohl-Schacherer, J., Peres, C.A. & Yu, D.W. (2009) Modeling
the long term sustainability of indigenous hunting in Manu National Park, Peru: landscape-scale management implications for Amazonia. Journal of Applied Ecology, 46, 804-814.
Lewis, S.L., Malhi, Y. & Phillips, O.L. (2004) Fingerprinting the impacts of global change
on tropical forests. Philosophical Transactions of the Royal Society B, 359, 437-462.
Lima, E.C. (2001) Erros repetidos: A pavimentação da BR-364 e os Katukina. Campos
– Revista de Antropologia Social, 1, 203-214 Lima, E.C. (2002) Katukina. Enciclopédia da Floresta (eds M.C. Cunha & M.A.
Barbosa), pp. 169-176. Companhia das Letras, São Paulo. Ling, S. & Milner-Gulland, E.J. (2006) Assessment of the sustainability of bushmeat
hunting based on dynamic bioeconomic models. Conservation Biology, 20, 1294-1299.
Loyola, R.D., Kubota, U., Fonseca, G.A.B & Lewinsohn, T.M. (2009) Key Neotropical
ecoregions for conservation of terrestrial vertebrates. Biodiversity and Conservation, 18, 2017-2031.
Lupo, K.D. & Schmitt, D.N. (2005) Small prey hunting technology and zooarchaeological
of taxonomic diversity and abundance: ethnoarchaeological evidence from Central African forest foragers. Journal of Anthropological Archaeology, 24, 335-353.
Malhi, Y., Roberts, J.T., Betts, R.A., Killeen, T.J., Li, W. & Nobre, C. (2008) Climate
change, deforestation and the fate of the Amazon. Science, 319, 169-172.

88
Mandujano, S. & Naranjo, E.J. (2010) Ungulate biomass across a rainfall gradient: a
comparison of data from Neotropical and palaeotropical forests and local analyses in Mexico. Journal of Tropical Ecology, 26, 13-23.
Margules, C.R. & Presley, R.L. (2000) Systematic conservation planning. Nature, 405,
243-253. Mena V.P., Stallings, J R., Regaladob, J. & Cueval (2000) The sustainability of current
hunting practices by the Huaorani. Hunting for sustainability in tropical forests (eds J.G. Robinson & E.L. Bennett), 57-78. Columbia University Press, NY.
Michalski, F. & Peres, C.A. (2005) Anthropogenic determinants of primate and carnivore
local extinctions in a fragmented forest landscape of southern Amazonia. Biological Conservation, 124, 383-396.
Michalski, F. & Peres, C.A. (2007) Disturbance-mediated mammal persistence and
abundance-area relationships in Amazonian forest fragments. Conservation Biology, 21, 1626-1640.
Milner-Gulland, E.J. & Rowcliffe, J.M. (2007) Conservation and sustainable use: A
handbook of techniques. Techniques in Ecology and Conservation Series. Oxford University Press, UK.
Milner-Gulland, E.J. Bennett, E.L. & SCB 2002 Annual Meeting Wild Meat Group (2003)
Wild meat: the bigger picture. Trends in Ecology and Evolution, 18, 351-357. Morton, D.C., Defries, R.S., Shimabukuru, Y.E., Anderson, L.O., Arai, E., Espirito-
Santo, F.B., Freitas, R. & Morisette, J. (2006) Cropland extension changes deforestation dynamics in the southern Brazilian Amazon. Proceedings of the National Academy of Science, 103, 14637-14641.
Nagaoka, L. (2002) The effects of resource depression on foraging efficiency, diet
breadth, and patch use in southern New Zealand. Journal of Anthropological Archeology, 21, 419-442.
Naranjo, E.J. & Bodmer, R.E. (2007) Source-sink system and conservation of hunted
ungulates in the Lancadon Forest, Mexico. Biological Conservation, 138, 412-420. Nasi, R., Brown, D., Wilkie, D., Bennett, E., Tutin, C., van Tol, G., & Christophersen, T.
(2008). Conservation and use of wildlife-based resources: the bushmeat crisis. Secretariat of the Convention on Biological Diversity, Montreal, and Center for International Forestry Research (CIFOR), Bogor.

89
Naughton-Treves, L., Mena, J.L., Treves, A., Alvarez, N. & Radeloff, C. (2003) Wildlife survival beyond park boundaries: the impact of slash-and-burn agriculture and hunting on mammals in Tambopata, Peru. Conservation Biology, 17, 1106-1117.
Navarro, J.G.G. (2004) Aprovechamiento de la fauna silvestre en comunidades
cashinaua del río Curanja y Purus. Informe Técnico I. World Wildlife Foundation, Lima.
Nepstad, D., Schwartzman, S., Bamberger, B., Santilli, M., Ray, D., Schlesinger, P.,
Lefebvre, P., Alencar, A., Prinz, E., Fiske, G. & Rolla, A. (2006) Inhibition of Amazon deforestation and fire by parks and Indigenous Lands. Conservation Biology, 20, 65-73.
Neter, J, Wasseman, W. & Kutner, M.H. (1985) Applied linear statistical models:
regression, analysis of variance and experimental designs. IRWIN, Illinois. Norris, D., Peres, C.A., Michalski, F. & Hinchsliffe (2008) Terrestrial mammal responses
to edges in Amazon forest patches: a study based on track stations. Mammalia, 72, 15-23.
Novaro, A.J., Redford, K.H. & Bodmer, R.E. (2000) Effect of hunting in source–sink
systems in the neotropics. Conservation Biology, 14, 713–721. Ohl-Schacherer, J., Shepard Jr., G.H., Kaplan, H., Peres, C.A., Levi, T. & Yu, D.W.
(2007) The sustainability of subsistence hunting by Matsigenka native communities in Manu National Park, Peru. Conservation Biology, 21, 1174-1185.
Oliveira, H. & Bardales, N.G. (2006) Aptidão natural de uso da terra no Estado do Acre.
Zoneamento Ecológico-Econômico: Fase II. SEMA, Rio Branco. Oliveira, P.J.C., Asner, G.P., Knapp, D.E., Almeyda, A., Galván-Gildemeister, R.,
Keene, S., Raybin, R.F. & Smith, R.C. (2007) Land-use allocation protects the Peruvian Amazon. Science, 317, 1233-1236.
Palmer, M. & White, P. (1994) Scale dependence and the species-area relationship.
American Naturalist, 144, 717-740. Parry, L., Barlow, J. & Peres, C.A. (2007) Large-vertebrate assemblage of primary and
secondary forest in the Brazilian Amazon. Journal of Tropical Ecology, 23, 653-662. Parry, L., Barlow, J. & Peres, C.A. (2009a) Allocation of hunting effort by Amazonian
smallholders: Implications for conserving wildlife in mixed-use landscape. Biological Conservation, 142, 1777-1786.
Parry, L., Barlow, J., & Peres, C.A. (2009b) Hunting for sustainability in tropical
secondary forests. Conservation Biology, 23, 1270-1280.
90
Pautasso, M. (2007) Scale dependence of the correlation between human population
presence and vertebrate and plant species richness. Ecology Letters, 10, 16-24. Peres, C.A. (1993) Biodiversity Conservation by Native Amazonians: a Pilot Study in the
Kaxinawá Indigenous Reserve of Rio Jordão, Acre, Brazil. World Wildlife Fund-US, Washington.
Peres, C.A. (2000) Effects of subsistence hunting on vertebrate community structure in
Amazonian Forests. Conservation Biology, 14, 240-253. Peres, C.A. (2001) Synergetic effects of hunting and habitat fragmentation on
Amazonian vertebrates. Conservation Biology, 15, 1490-1505. Peres, C.A. (2005) Why do we need megareserves in Amazonia. Conservation Biology,
19, 728-733. Peres, C.A. & Terborgh, J.W. (1995) Amazonian nature reserves: An analysis of the
defensibility status of existing Conservation Units and design criteria for the future. Conservation Biology, 9, 34-46.
Peres, C.A. & Zimmerman, B. (2001) Perils in parks or parks in perils? Reconciling
conservation in the Amazonian reserves with and without use. Conservation Biology, 15, 793-797.
Peres, C.A. & Lake, I. (2003) Extent of non-timber resource extraction in tropical forests:
Accessibility to game vertebrates by hunters in the Amazon Basin. Conservation Biology, 17, 521-535.
Peres, C.A. & Nascimento, H. (2006) Impact of game hunting by the Kayapó of south-
eastern Amazonia: implications for wildlife conservation in tropical forest indigenous reserves. Biodiversity and Conservation, 15, 2627-2653.
Peres, C.A. & Palacios, E. (2007) Basin-wide effects of game harvest on vertebrate
population densities in Amazonian forests: Implications for animal-mediated seed dispersal. Biotropica, 39, 304-315.
Peres, C.A., Barlow, J. & Haugaasen T. (2003) Vertebrate responses to surface
wildfires in a central Amazonian forest. Oryx, 37, 97-109. PNUD (2003) Atlas de desenvolvimento humano no Brasil. Programa das Nacões
Unidas para o Desenvolvimento. Version 1.0.0. Available from http://www.pnud.org.br/atlas/, accessed in 02/27/2010.
Puertas, P.E. & Bodmer, R.E. (2004) Hunting effort as a tool for community-based
wildlife management in Amazonia. People in nature: Wildlife conservation in South
91
and Central America (eds K. Silvius, R.E. Bodmer & J. Fragoso), pp. 123-135. Columbia University Press, NY.
Ramos, R.M., 2005. Estratégia de caça e uso da fauna na Reserva Extrativista do Alto
Juruá, AC. Master Thesis. Universidade de São Paulo. Redford, K.H. (1993) Hunting in the neotropics: A subsidy from nature. Tropical forests,
people, and food: Biocultural interactions and applications to development (eds C.M. Hladik, A. Hladik, O.F. Linares, H. Pagesy, A. Semple, & M. Hadley), pp. 227-246. UNESCO, Paris.
Redford, K.H. & Robinson, J.G. (1987) The game of choice: patterns of indians and
colonist hunting in the Neotropics. American Anthropologist, 89, 650-667. Redford, K.H. & Sanderson, S.E. (2000) Extracting human from nature. Conservation
Biology, 14, 1362-1364. Reyna-Hurtado, R., Rojas-Flores, E. & Tanner, G.W. (2009) Home range and habitat
preferences of white-lipped peccaries (Tayassu pecari) in Calakmul, Campeche, Mexico. Journal of Mammalogy, 90, 1199-1209.
Rist, J., Rowcliffe, M., Cowlishaw, G. & Milner-Gulland, E.J. (2008) Evaluating
measures of hunting effort in a bushmeat system. Biological Conservation, 141, 2086-2099.
Rist, J. Milner-Gulland, E.J., Cowlishaw, G. & Rowcliffe, M. (2009) The importance of
hunting and habitat in determining the abundance of tropical forest species in Equatorial Guinea. Biotropica, 41, 700-710.
Robinson, J.G. (1996) Hunting wildlife in forest patches: an ephemeral resource. Forest
patches in tropical landscape (eds J. Schelhas & R. Greenberg), pp. 11-130. Island Press, Washington.
Robinson, J.G. & Bodmer, R.E. (1999) Towards wildlife management in Tropical forests.
Journal of Wildlife Management, 63, 1-13. Robinson, J.G. & Bennett, E.L. (2004) Having you wildlife and eating it too: an analysis
of hunting sustainability across tropical ecosystems. Animal Conservation, 7, 397-408.
Robinson, J.G. & Redford, K.H. (1991) Sustainable harvest of Neo-tropical forest
mammals. Neotropical wildlife use and conservation (eds J.G. Robinson & K.H. Redford), pp. 415-429. University of Chicago Press, Chicago.
Rowcliffe, J.M., Cowlishaw, G. & Long, J. (2003) A model of human hunting impacts in
multi-prey communities. Journal of Applied Ecology, 40, 872-889.

92
Rowcliffe, J.M., Milner-Gulland, E.J. & Cowlishaw, G. (2005) Do bushmeat consumers
have other fish to fry? Trends in Ecology and Evolution, 20, 274-276. Schwartzman, S. & Zimmerman, B. (2005) Conservation alliances with indigenous
peoples of the Amazon. Conservation Biology, 19, 721-727. Schwartzman, S., Moreira, A. & Nepstad, D. (2000) Rethinking tropical conservation:
Perils in parks. Conservation Biology, 14, 1351-1357. Seaman, D.E. & Powell, R.A. (1996) An evaluation of the accuracy of kernel density
estimators for home range analysis. Ecology, 77, 2075-2085. Sierra, R., Rodriguez, F. & Losos, E. (1999) Forest resource use change during early
market integration in tropical rain forests: The Huaroani of Upper Amazonia. Ecological Economics, 30, 107-119.
Silveira, M., Torrezan, J.M. & Daly, D.C. (2002) Vegetação e diversidade arbórea na
região do Alto Juruá. Enciclopédia da Floresta. (eds M.C. Cunha & M.B. Almeida.), pp. 65-75. Companhia das Letras, São Paulo.
SIPAM (2008) Notas de Alerta 21, 23, 24, and 26. Programa de Monitoramento de
Áreas Especiais - ProAE. Sistema de Proteção da Amazônia. Available at: http://www.sipam.gov.br/proae/acre/2008/. Accessed in 8/2/2010.
Sirén, A. (2006) Natural resources in indigenous peoples' land in Amazonia: A tragedy
of the commons? International Journal of Sustainable Development and World Ecology, 13, 363-374.
Sirén, A., Hambäck, P. & Machoa, J. (2004) Including spatial heterogeneity and animal
dispersal when evaluating hunting: a model analysis and an empirical assessment in an Amazonian community. Conservation Biology, 18, 1315-1329.
Smith, E.A. (1983) Anthropological applications of optimal foraging theory: A critical
review. Current Anthropology, 24, 625-651 Smith, D.A. (2005) Garden game: shifting cultivation, indigenous hunting and wildlife
ecology in western Panama. Human Ecology, 33, 505-537. Smith, D.A. (2008) The spatial pattern of indigenous wildlife use in western Panama:
implications for conservation management. Biological Conservation, 141, 925-937. Soares-Filho, B., Nepstad, D.C., Curran, L.M., Cerqueira, G.C., Garcia, R.A., Ramos,
C.A., Voll, E., McDonald, A., Lefebvre, P. & Schlesinger, P. (2006) Modeling conservation in Amazon basin. Nature, 440, 520-523.

93
Sombroek, W. (2001) Spatial and temporal patterns of Amazon rainfall: Consequences for the planning of agricultural occupation and the protection of primary forests. Ambio, 7, 388-396.
Souza-Mazurek, R.R.D., Pedrinho, T., Feliciano, X., Hilário, W., Gerôncio, S. & Marcelo,
E. (2000) Subsistence hunting among Waimiri Atroari Indians in Central Amazonia, Brazil. Biodiversity and Conservation, 9, 579-596.
Stearman, A.M. (1990) The effects of settler incursion on fish and game resources of
the Yuqui, a native Amazonian society of eastern Bolivia. Human Organization, 49, 373-385.
Sunderland, T.C.H., Ehringhaus, C. & Campbell, B.M. (2008) Conservation and
development in tropical forest landscape: A time to face the trade-offs? Environmental Conservation, 34, 276-279.
Takahashi, J. (2008) A literature review of the spider monkey, Ateles sp., with species
focus on risk of extinction. PhD thesis, Swedish University of Agricultural Science. Terborgh, J. (2004) Reflections of a scientist on the World Parks Congress.
Conservation Biology, 18, 619-620. TNC (2009) Terrestrial ecoregional boundaries and assessments geodatabase.
Available at: http://conserveonline.org/workspaces/ecoregional.shapefile, accessed in 02/27/2010.
Urquiza-Haas, T., Peres, C.A. & Dolman, P.M. (2009) Regional scale effects of human
density and forest disturbance on large-bodied vertebrates throughout the Yucatán Peninsula, Mexico. Biological Conservation, 142, 134-148.
Valentin, J.F., Sá., C.P., Gomes, F.C.R. & Santos, J.C. (2002) Tendências da pecuária
bovina no Acre entre 1970 e 2000. Embrapa, Rio Branco. Vickers, W.T. (1980) An analysis of Amazonian hunting yields as a function of
settlement age. Studies in hunting and fishing in the Neotropics; Working on South American Indians (eds R.B. Hames & K.M. Kensinger), pp. 7-30. Bennington College, VT.
Winterhalder, B. (1981) Foraging strategies in the boreal environment: An analysis of
Cree hunting and gathering. Hunter-gatherer foraging strategies (eds B. Winterhalder & E.A. Smith), pp. 66-98. University of Chicago Press, Chicago.
Winterhalder, B. & Lu, F. (1997) A forager-resource population ecology model and
implications for indigenous conservation. Conservation Biology, 11, 1354-1364.
94
Woodroffe, R. & Ginsberg, J.R. (1998) Edge effects and the extinction of populations inside protected areas. Science, 280, 2126-2128.
Zapata-Ríos, G. Urgilés, C. & Suárez, E. (2009) Mammal hunting by the Shuar of the
Ecuadorian Amazon: Is it sustainable? Oryx, 43, 375-385.

95
BIOGRAPHICAL SKETCH
Pedro A.L. Constantino was born in Rio de Janeiro, Brazil, and received his
Bachelor of Science degree in biological sciences at the Universidade Federal do Rio
de Janeiro studying insect ecology. His research on gall midge development received
Honor Mention from the Brazilian Botanical Society in 2004. Since then he works in
collaboration with the local NGO Comissão Pró-Índio do Acre and many indigenous
people of Acre. He helped the implementation of the natural resource use monitoring
program in Indigenous Lands of Acre and currently collaborates in the Indigenous
Agroforestry Agents Capacity-Building program of CPI-AC. In 2007, Pedro was an ACLI
visiting scholar at the University of Florida. Meanwhile, he worked for the Rio de Janeiro
Botanical Garden on the conservation of threatened Brazilian orchids.