Disentangling Incomplete Lineage Sorting and Introgression ...
20
Syst. Biol. 66(4):531–550, 2017 © The Author(s) 2016. Published by Oxford University Press, on behalf of the Society of Systematic Biologists. All rights reserved. For Permissions, please email: [email protected] DOI:10.1093/sysbio/syw069 Advance Access publication August 18, 2016 Disentangling Incomplete Lineage Sorting and Introgression to Refine Species-Tree Estimates for Lake Tanganyika Cichlid Fishes BRITTA S. MEYER 1,2 ,MICHAEL MATSCHINER 1,3 , AND WALTER SALZBURGER 1,3,∗ 1 Zoological Institute, University of Basel, Basel, Switzerland; 2 Evolutionary Ecology of Marine Fishes, GEOMAR Helmholtz Centre for Ocean Research Kiel, Kiel, Germany; 3 Centre for Ecological and Evolutionary Synthesis (CEES), Department of Biosciences, University of Oslo, Oslo, Norway; ∗ Correspondence to be sent to: Prof. Dr. Walter Salzburger, Zoological Institute, University of Basel, Vesalgasse 1, 4051 Basel, Switzerland E-mail: [email protected]. Britta S. Meyer and Michael Matschiner contributed equally to this work. Received 10 February 2016; reviews returned 16 June 2016; accepted 27 June 2016 Associate Editor: Laura Kubatko Abstract.—Adaptive radiation is thought to be responsible for the evolution of a great portion of the past and present diversity of life. Instances of adaptive radiation, characterized by the rapid emergence of an array of species as a consequence to their adaptation to distinct ecological niches, are important study systems in evolutionary biology. However, because of the rapid lineage formation in these groups, and occasional gene flow between the participating species, it is often difficult to reconstruct the phylogenetic history of species that underwent an adaptive radiation. In this study, we present a novel approach for species-tree estimation in rapidly diversifying lineages, where introgression is known to occur, and apply it to a multimarker data set containing up to 16 specimens per species for a set of 45 species of East African cichlid fishes (522 individuals in total), with a main focus on the cichlid species flock of Lake Tanganyika. We first identified, using age distributions of most recent common ancestors in individual gene trees, those lineages in our data set that show strong signatures of past introgression. This led us to formulate three hypotheses of introgression between different lineages of Tanganyika cichlids: the ancestor of Boulengerochromini (or of Boulengerochromini and Bathybatini) received genomic material from the derived H-lineage; the common ancestor of Cyprichromini and Perissodini experienced, in turn, introgression from Boulengerochromini and/or Bathybatini; and the Lake Tanganyika Haplochromini and closely related riverine lineages received genetic material from Cyphotilapiini. We then applied the multispecies coalescent model to estimate the species tree of Lake Tanganyika cichlids, but excluded the lineages involved in these introgression events, as the multispecies coalescent model does not incorporate introgression. This resulted in a robust species tree, in which the Lamprologini were placed as sister lineage to the H-lineage (including the Eretmodini), and we identify a series of rapid splitting events at the base of the H-lineage. Divergence ages estimated with the multispecies coalescent model were substantially younger than age estimates based on concatenation, and agree with the geological history of the Great Lakes of East Africa. Finally, we formally tested the three hypotheses of introgression using a likelihood framework, and find strong support for introgression between some of the cichlid tribes of Lake Tanganyika. [Adaptive radiation; Cichlidae; introgression; Lake Tanganyika; species network.] Adaptive radiation, that is, the rapid emergence of new life-forms through the extensive diversification of an organismal lineage into new or available ecological niches, is thought to be responsible for a great deal of the extant and extinct organismal diversity on our planet (Simpson 1953; Schluter 2000; Berner and Salzburger 2015). Rapid evolutionary radiations have long fascinated biologists and serve as model systems to explore mechanisms of lineage diversification (see, e.g., Schluter 2000; Mayr 2001; Coyne and Orr 2004). At the same time—mainly because of the rapidity of lineage formation facilitating incomplete lineage sorting, gene flow between the emerging species, and the frequent occurrence of phenotypic convergence—it has proven notoriously difficult to reconstruct the progression of adaptive radiations by means of morphological analyses (Fryer and Iles 1972) and, more recently, phylogenetic reconstructions based on molecular data (e.g., Rokas and Carroll 2006; Glor 2010; Meyer et al. 2015). The retention of ancestral polymorphisms between species (i.e., incomplete lineage sorting) and gene exchange between taxa (i.e., introgressive hybridization) are commonly observed phenomena in adaptive radiations (see, e.g., The Heliconius Genome Consortium 2012; Brawand et al. 2014; Lamichhaney et al. 2015; reviewed in Berner and Salzburger 2015), and it has been suggested that extensive hybridization between founding lineages producing a so-called hybrid swarm may trigger subsequent adaptive radiation in the first place (Seehausen 2004; Nolte and Tautz 2010; Abbott et al. 2013). There are two major technical challenges for phylogeny reconstruction associated with the occurrence of incomplete lineage sorting and/or introgressive hybridization: First, both processes can generate phylogenetic histories that are discordant with the species tree, and can therefore cause misleading species-tree estimates unless properly accounted for (see, e.g., Maddison and Knowles 2006; Kubatko and Degnan 2007; Yu et al. 2011; Roch and Steel 2014; Edwards et al. 2016). Second, in order to account for incomplete lineage sorting and introgressive hybridization in phylogenetic analyses, it is important to differentiate between these two processes, since models used for phylogenetic inference often incorporate only one of the two processes (e.g., Linz et al. 2007; Heled and Drummond 2010; Mirarab et al. 2014). However, due to the various possible outcomes of both processes, it is often difficult to distinguish whether an observed incongruence between phylogenies is due to incomplete lineage sorting or past hybridization (Holder et al. 2001; Holland et al. 2008; Joly et al. 2009). As these issues are particularly pronounced when rapidly radiating 531 Downloaded from https://academic.oup.com/sysbio/article-abstract/66/4/531/2670093 by WWZ Bibliothek (Oeffentliche Bibliothek der Universität Basel) user on 02 February 2018
Transcript of Disentangling Incomplete Lineage Sorting and Introgression ...
Syst. Biol. 66(4):531–550, 2017© The Author(s) 2016. Published by Oxford University Press, on behalf of the Society of Systematic Biologists. All rights reserved.For Permissions, please email: [email protected]:10.1093/sysbio/syw069Advance Access publication August 18, 2016
Disentangling Incomplete Lineage Sorting and Introgression to Refine Species-TreeEstimates for Lake Tanganyika Cichlid Fishes
BRITTA S. MEYER1,2, MICHAEL MATSCHINER1,3, AND WALTER SALZBURGER1,3,∗1Zoological Institute, University of Basel, Basel, Switzerland; 2Evolutionary Ecology of Marine Fishes, GEOMAR Helmholtz Centre for Ocean Research
Kiel, Kiel, Germany; 3Centre for Ecological and Evolutionary Synthesis (CEES), Department of Biosciences, University of Oslo, Oslo, Norway;∗Correspondence to be sent to: Prof. Dr. Walter Salzburger, Zoological Institute, University of Basel, Vesalgasse 1, 4051 Basel, Switzerland
E-mail: [email protected] S. Meyer and Michael Matschiner contributed equally to this work.
Received 10 February 2016; reviews returned 16 June 2016; accepted 27 June 2016Associate Editor: Laura Kubatko
Abstract.—Adaptive radiation is thought to be responsible for the evolution of a great portion of the past and present diversityof life. Instances of adaptive radiation, characterized by the rapid emergence of an array of species as a consequenceto their adaptation to distinct ecological niches, are important study systems in evolutionary biology. However, becauseof the rapid lineage formation in these groups, and occasional gene flow between the participating species, it is oftendifficult to reconstruct the phylogenetic history of species that underwent an adaptive radiation. In this study, we presenta novel approach for species-tree estimation in rapidly diversifying lineages, where introgression is known to occur, andapply it to a multimarker data set containing up to 16 specimens per species for a set of 45 species of East African cichlidfishes (522 individuals in total), with a main focus on the cichlid species flock of Lake Tanganyika. We first identified,using age distributions of most recent common ancestors in individual gene trees, those lineages in our data set thatshow strong signatures of past introgression. This led us to formulate three hypotheses of introgression between differentlineages of Tanganyika cichlids: the ancestor of Boulengerochromini (or of Boulengerochromini and Bathybatini) receivedgenomic material from the derived H-lineage; the common ancestor of Cyprichromini and Perissodini experienced, inturn, introgression from Boulengerochromini and/or Bathybatini; and the Lake Tanganyika Haplochromini and closelyrelated riverine lineages received genetic material from Cyphotilapiini. We then applied the multispecies coalescent modelto estimate the species tree of Lake Tanganyika cichlids, but excluded the lineages involved in these introgression events,as the multispecies coalescent model does not incorporate introgression. This resulted in a robust species tree, in whichthe Lamprologini were placed as sister lineage to the H-lineage (including the Eretmodini), and we identify a series ofrapid splitting events at the base of the H-lineage. Divergence ages estimated with the multispecies coalescent model weresubstantially younger than age estimates based on concatenation, and agree with the geological history of the Great Lakesof East Africa. Finally, we formally tested the three hypotheses of introgression using a likelihood framework, and findstrong support for introgression between some of the cichlid tribes of Lake Tanganyika. [Adaptive radiation; Cichlidae;introgression; Lake Tanganyika; species network.]
Adaptive radiation, that is, the rapid emergence ofnew life-forms through the extensive diversification ofan organismal lineage into new or available ecologicalniches, is thought to be responsible for a great dealof the extant and extinct organismal diversity onour planet (Simpson 1953; Schluter 2000; Berner andSalzburger 2015). Rapid evolutionary radiations havelong fascinated biologists and serve as model systems toexplore mechanisms of lineage diversification (see, e.g.,Schluter 2000; Mayr 2001; Coyne and Orr 2004). At thesame time—mainly because of the rapidity of lineageformation facilitating incomplete lineage sorting, geneflow between the emerging species, and the frequentoccurrence of phenotypic convergence—it has provennotoriously difficult to reconstruct the progression ofadaptive radiations by means of morphological analyses(Fryer and Iles 1972) and, more recently, phylogeneticreconstructions based on molecular data (e.g., Rokas andCarroll 2006; Glor 2010; Meyer et al. 2015).
The retention of ancestral polymorphisms betweenspecies (i.e., incomplete lineage sorting) and geneexchange between taxa (i.e., introgressive hybridization)are commonly observed phenomena in adaptiveradiations (see, e.g., The Heliconius GenomeConsortium 2012; Brawand et al. 2014; Lamichhaneyet al. 2015; reviewed in Berner and Salzburger 2015),
and it has been suggested that extensive hybridizationbetween founding lineages producing a so-called hybridswarm may trigger subsequent adaptive radiation inthe first place (Seehausen 2004; Nolte and Tautz 2010;Abbott et al. 2013). There are two major technicalchallenges for phylogeny reconstruction associated withthe occurrence of incomplete lineage sorting and/orintrogressive hybridization: First, both processes cangenerate phylogenetic histories that are discordant withthe species tree, and can therefore cause misleadingspecies-tree estimates unless properly accounted for(see, e.g., Maddison and Knowles 2006; Kubatko andDegnan 2007; Yu et al. 2011; Roch and Steel 2014; Edwardset al. 2016). Second, in order to account for incompletelineage sorting and introgressive hybridization inphylogenetic analyses, it is important to differentiatebetween these two processes, since models used forphylogenetic inference often incorporate only one ofthe two processes (e.g., Linz et al. 2007; Heled andDrummond 2010; Mirarab et al. 2014). However, dueto the various possible outcomes of both processes, itis often difficult to distinguish whether an observedincongruence between phylogenies is due to incompletelineage sorting or past hybridization (Holder et al. 2001;Holland et al. 2008; Joly et al. 2009). As these issuesare particularly pronounced when rapidly radiating
531Downloaded from https://academic.oup.com/sysbio/article-abstract/66/4/531/2670093by WWZ Bibliothek (Oeffentliche Bibliothek der Universität Basel) useron 02 February 2018
532 SYSTEMATIC BIOLOGY VOL. 66
clades are involved, a thorough understanding of theevolutionary history of adaptive radiations is oftenhampered by the difficulties involved in phylogeneticanalyses of these groups (Jarvis et al. 2014; Lamichhaneyet al. 2015).
The most well-known examples of adaptive radiationinclude Darwin’s finches on the Galapagos Islands(Grant and Grant 2008), threespine stickleback fish inthe Northern Hemisphere (Bell and Foster 1994), anolelizards on the islands of the Caribbean (Losos 2009), andcichlid fishes in the East African Great Lakes (Fryer andIles 1972). The exceptionally diverse cichlid assemblagesin Lakes Victoria, Malawi, and Tanganyika represent themost species-rich extant adaptive radiations (Salzburgeret al. 2014). Hundreds of closely related cichlid specieshave emerged in each of these lakes in the last fewmillions to several thousands of years (Kocher 2004;Seehausen 2006; Salzburger 2009; Salzburger et al. 2014),rendering the formation of new cichlid species in theselakes unusually rapid (McCune and Lovejoy 1998; Coyneand Orr 2004).
With an age of 9–12 myr, Lake Tanganyika is theoldest and, because of its great depth, also the moststable lake in Africa (Cohen et al. 1993; Salzburger et al.2014). This has strong implications on its cichlid fauna,which is genetically, morphologically, ecologically, andbehaviorally the most diverse of all extant cichlidspecies flocks (Salzburger et al. 2014). Lake Tanganyikais also a reservoir of more ancient lineages and thelikely cradle of more modern cichlid groups (Nishida1991; Salzburger et al. 2002a, 2005), or simply the“melting pot” of East African cichlid diversity (Weisset al. 2015). Knowledge about the evolution of theLake Tanganyika cichlid assemblage is thus key tounderstanding cichlid evolution in the whole of EastAfrica.
The cichlid fauna of Lake Tanganyika, whichcomprises about 200 species, has been divided into 14taxonomic subgroups, so-called ‘tribes’ (i.e., a taxonomicrank between subfamily and genus) (Poll 1986; Dunz andSchliewen 2013; Takahashi and Sota 2016): Bathybatini,Boulengerochromini, Cyphotilapiini, Cyprichromini,Ectodini, Eretmodini, Haplochromini, Lamprologini,Limnochromini, Oreochromini, Perissodini, Tilapiini,Trematocarini, and Tylochromini. Over the past quarterof a century, a number of attempts have been undertakento resolve the phylogenetic relationships between thecichlid tribes in Lake Tanganyika (e.g., Nishida 1991;Kocher et al. 1995; Salzburger et al. 2002a; Clabaut et al.2005; Day et al. 2008; Muschick et al. 2012; Meyer et al.2015; Weiss et al. 2015; McGee et al. 2016; Takahashi andSota 2016), as well as between genera and species withintribes (see, e.g., Koblmüller et al. 2004, 2010; Sturmbaueret al. 2010). Especially with respect to the placementof tribes relative to each other, there is little consensusbetween the different studies (see Supplementary Text S1and Supplementary Fig. S1; available on Dryad athttp://dx.doi.org/10.5061/dryad.62qn5), which can inpart be explained by the different marker sets (andphylogenetic methods) that were used at a given
time. In addition, there is evidence for introgressivehybridization and incomplete lineage sorting in thecourse of the cichlid adaptive radiation in LakeTanganyika (see, e.g., Rüber et al. 2001; Salzburgeret al. 2002b; Koblmüller et al. 2010; Meyer et al. 2015;Weiss et al. 2015), and both of these processes mayhave contributed to the conflicting results of studiesconducted with different markers. Overall, while thegeneral phylogenetic structure of the cichlid assemblageof Lake Tanganyika is well established—with secondarycolonizers of Tylochromini and Oreochromini asthe earliest diverging lineages, and Trematocarini,Bathybatini, and Boulengerochromini as ancestral tribesthat are sister to a clade formed by the Lamprologiniand the H-lineage (Meyer et al. 1990; Nishida 1991;Day et al. 2008; Muschick et al. 2012; Weiss et al.2015; Takahashi and Sota 2016)—several areas ofuncertainty remain (see Meyer et al. 2015; Weiss et al.2015; McGee et al. 2016; Takahashi and Sota 2016).For example, the relative position of Trematocarini,Bathybatini, and Boulengerochromini to one another isstill unclear, as is the relative position of the H-lineagetaxa to one another (in particular, the placement ofEretmodini).
In this study, we take a novel approach to addressthe phylogenetic relationships between the cichlid tribesof East African Lake Tanganyika. We use 40 nuclearmarkers established in Meyer and Salzburger (2012)and Meyer et al. (2015). Yet, instead of using a singlerepresentative per species as in Meyer et al. (2015),we use up to 16 specimens per species, resulting innuclear DNA sequences from 522 specimens. This allowsus to first disentangle the signals of introgression andincomplete lineage sorting among cichlid taxa, usingnew methodology to detect gene flow from population-level and species-level data sets. We then apply themultispecies coalescent model to identify the species treeof Lake Tanganyika cichlid lineages after filtering outsignals of introgression that would represent a violationof this model. Finally, by comparing age estimatesrecovered with the multispecies coalescent modeland with concatenation, we reconcile phylogeneticdivergence-date estimates of cichlids with the geologicalhistory of their environment, to build a coherenttimeline of cichlid diversification in the Great Lakesof East Africa, with a particular focus on LakeTanganyika.
MATERIALS AND METHODS
Data Collection and Sequence AlignmentAll specimens of cichlid fishes from Lake Tanganyika
used in this study were collected in accordance withthe national legislation of the Republic of Zambiaand under the memorandum of understanding (MOU)between the involved institutions (University of Basel,Switzerland, University of Zambia, Lusaka, Zambia,and Department of Fisheries, Lake Tanganyika branch,Mpulungu, Zambia). Fish collections were conducted
Downloaded from https://academic.oup.com/sysbio/article-abstract/66/4/531/2670093by WWZ Bibliothek (Oeffentliche Bibliothek der Universität Basel) useron 02 February 2018
2017 MEYER ET AL.—SPECIES TREE OF LAKE TANGANYIKA CICHLIDS 533
as described in Muschick et al. (2012). We used upto 16 individuals from 45 different cichlid species(a total of 522 individuals). Our sampling designcomprised representatives of all major cichlid lineagesof the Lake Tanganyika radiation (33 species) plus fourrepresentatives each of Lake Victoria and Lake Malawi,and four riverine taxa. The gross of samples originatedfrom field trips to Zambia, that is, to Lake Tanganyikaand the Kafue River in the years 2007, 2008, and 2011.Further samples were aquaria-bred at the Swiss FederalInstitute of Aquatic Science and Technology (EAWAG;these were kindly provided by Ole Seehausen) andat the University of Basel. The number of sampledindividuals per species and their place of origin are listedin Supplementary Tables S1 and S2 available on Dryad.Fin clips were stored at −20 ◦C in 100% ethanol untilfurther processing.
Extraction of DNA from ethanol-preserved finclips was performed with a Qiagen Biosprint 96robot following the manufacturer’s protocol (QIAGEN,Hombrechtikon, Switzerland). For multiplexed PCRamplifications, we used a primer set consisting of 40markers (encompassing exons, introns, and untranslatedregions of nuclear coding genes) as described in Meyerand Salzburger (2012) and Meyer et al. (2015) (see Table 1for further details). PCR amplifications and librarypreparations (including several cleaning and poolingsteps) were carried out as described in Meyer et al. (2015);pyrosequencing was performed on the GS FLX system(454 Sequencing, Roche). The sequencing design in thecurrent study differs from that of Meyer et al. (2015),who included only a single specimen for each species(instead of up to 16 as in the current study) and used aconsensus sequence (instead of the two alleles as in thecurrent study).
The generated sequence reads were demultiplexedand assembled using Roche’s sffinfo tool, PRINSEQ(Schmieder and Edwards 2011), BWA (Li and Durbin2010), and Geneious (Biomatters Ltd, Auckland, NewZealand; available at www.geneious.com) with the sameversions and settings as in Meyer et al. (2015). Due tothe long read length provided by the 454 technology,phased alleles could be determined in all individuals.Thus, we obtained between 376 and 1036 (mean=918.9)sequences per marker (Table 1). Alignments for eachmarker containing all alleles from all individuals wereobtained with the software MAFFT v.7.017 (Katohand Standley 2013), using the “–auto” option toautomatically detect the appropriate alignment strategy.The alignments were inspected visually and locallycorrected where necessary (Supplementary File S1available on Dryad). To test whether different codonpositions and noncoding fractions of the alignmentsare best characterized by different models of sequenceevolution, we analyzed each alignment separatelywith the software PartitionFinder v.1.1.1 (Lanfear et al.2012). However, as the program identified only onepartition for each alignment, a single substitutionmodel per marker was applied in all phylogeneticanalyses.
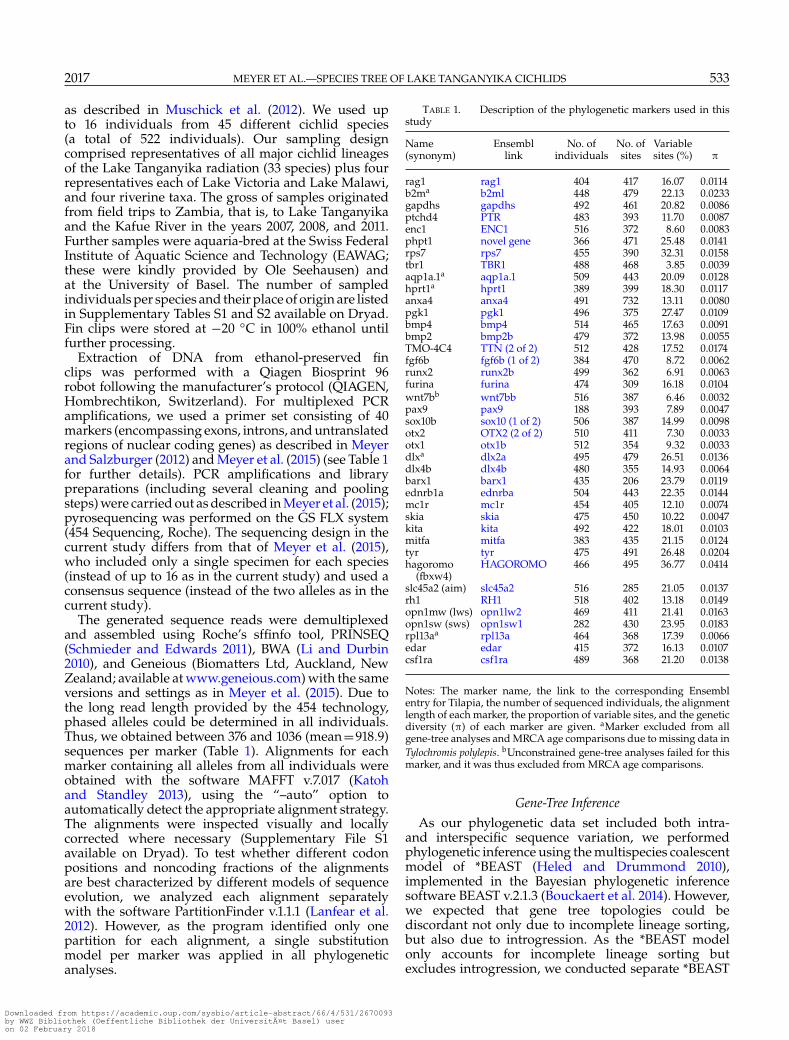
TABLE 1. Description of the phylogenetic markers used in thisstudy
Name Ensembl No. of No. of Variable(synonym) link individuals sites sites (%) �
rag1 rag1 404 417 16.07 0.0114b2ma b2ml 448 479 22.13 0.0233gapdhs gapdhs 492 461 20.82 0.0086ptchd4 PTR 483 393 11.70 0.0087enc1 ENC1 516 372 8.60 0.0083phpt1 novel gene 366 471 25.48 0.0141rps7 rps7 455 390 32.31 0.0158tbr1 TBR1 488 468 3.85 0.0039aqp1a.1a aqp1a.1 509 443 20.09 0.0128hprt1a hprt1 389 399 18.30 0.0117anxa4 anxa4 491 732 13.11 0.0080pgk1 pgk1 496 375 27.47 0.0109bmp4 bmp4 514 465 17.63 0.0091bmp2 bmp2b 479 372 13.98 0.0055TMO-4C4 TTN (2 of 2) 512 428 17.52 0.0174fgf6b fgf6b (1 of 2) 384 470 8.72 0.0062runx2 runx2b 499 362 6.91 0.0063furina furina 474 309 16.18 0.0104wnt7bb wnt7bb 516 387 6.46 0.0032pax9 pax9 188 393 7.89 0.0047sox10b sox10 (1 of 2) 506 387 14.99 0.0098otx2 OTX2 (2 of 2) 510 411 7.30 0.0033otx1 otx1b 512 354 9.32 0.0033dlxa dlx2a 495 479 26.51 0.0136dlx4b dlx4b 480 355 14.93 0.0064barx1 barx1 435 206 23.79 0.0119ednrb1a ednrba 504 443 22.35 0.0144mc1r mc1r 454 405 12.10 0.0074skia skia 475 450 10.22 0.0047kita kita 492 422 18.01 0.0103mitfa mitfa 383 435 21.15 0.0124tyr tyr 475 491 26.48 0.0204hagoromo HAGOROMO 466 495 36.77 0.0414
(fbxw4)slc45a2 (aim) slc45a2 516 285 21.05 0.0137rh1 RH1 518 402 13.18 0.0149opn1mw (lws) opn1lw2 469 411 21.41 0.0163opn1sw (sws) opn1sw1 282 430 23.95 0.0183rpl13aa rpl13a 464 368 17.39 0.0066edar edar 415 372 16.13 0.0107csf1ra csf1ra 489 368 21.20 0.0138
Notes: The marker name, the link to the corresponding Ensemblentry for Tilapia, the number of sequenced individuals, the alignmentlength of each marker, the proportion of variable sites, and the geneticdiversity (�) of each marker are given. aMarker excluded from allgene-tree analyses and MRCA age comparisons due to missing data inTylochromis polylepis. bUnconstrained gene-tree analyses failed for thismarker, and it was thus excluded from MRCA age comparisons.
Gene-Tree InferenceAs our phylogenetic data set included both intra-
and interspecific sequence variation, we performedphylogenetic inference using the multispecies coalescentmodel of *BEAST (Heled and Drummond 2010),implemented in the Bayesian phylogenetic inferencesoftware BEAST v.2.1.3 (Bouckaert et al. 2014). However,we expected that gene tree topologies could bediscordant not only due to incomplete lineage sorting,but also due to introgression. As the *BEAST modelonly accounts for incomplete lineage sorting butexcludes introgression, we conducted separate *BEAST
Downloaded from https://academic.oup.com/sysbio/article-abstract/66/4/531/2670093by WWZ Bibliothek (Oeffentliche Bibliothek der Universität Basel) useron 02 February 2018
534 SYSTEMATIC BIOLOGY VOL. 66
analyses for each marker, assuming that recombinationonly takes place between markers, but not within.Phylogenetic inference was performed using an HKYmodel (Hasegawa et al. 1985) of sequence evolution andthe Yule process (Yule 1925) as the species-tree prior.For computational reasons, we assumed no among-siterate heterogeneity and used empirical base frequencies.We also assumed a strict molecular clock model, tomaximize comparability between divergence times inindividual gene trees and to reduce the run timerequired for convergence. The molecular clock wascalibrated with two fossil-based node-age constraints.Based on the time-calibrated phylogeny of cichlidfishes by McMahan et al. (2013), we constrained thedivergence of Tylochromini and Austrotilapiini between54.8 and 33.0 million years ago (Ma) (95% confidenceinterval; mean=42.1 Ma), and that of Oreochrominiand Austrotilapiini between 31.6 and 17.3 Ma (mean=23.3 Ma). In our data set, Tylochromini were representedby Tylochromis polylepis, Oreochromini were representedby Oreochromis tanganicae, and the 43 remainingspecies were members of Austrotilapiini, which wereassumed to be monophyletic. Both time constraints wereimplemented as lognormal prior distributions, withoffsets 18.2 and 8.2 Ma, means (in real space) 23.894and 15.067 Ma, and standard deviations 0.231 and 0.240Ma, respectively. For consistency between ages estimatedwith different markers, we excluded five out of 40markers due to missing sequence data for T. polylepis (seeTable 1). We conducted five replicate analyses for eachof the 35 markers, with 4 billion Markov chain MonteCarlo (MCMC) generations of which the first 10% werediscarded as burn-in. These analyses were performed onthe Maia cluster of the University of Basel and requiredabout 40 CPU days per replicate. Run convergence wasassessed by comparison of traces within and betweenrun replicates and by effective sample sizes (ESS)greater than 200 for each model parameter. In only fewexceptions, ESS values of single parameters remainedbelow 200, but were still above 100. For each marker,100 time-calibrated gene trees were sampled from thejoint posterior distribution of the five replicate analyses.Each of these gene trees was further pruned to includeonly a single randomly chosen individual per species.This was repeated 10 times per tree to produce posteriorsets of 1000 species-level gene trees for each marker. Aflow chart illustrating our phylogenetic analysis pipelineis provided in Supplementary Fig. S2 available onDryad.
Detection of Putatively Introgressed LineagesComparison of mean MRCA age estimates.—Posteriorsamples of species-level gene tree distributions wereused to calculate mean age estimates of most recentcommon ancestors (MRCA) in all pairwise speciescomparisons. As gene-tree inference for one out of35 markers (wnt7b) failed to converge, we used genetree distributions of 34 markers for these calculations.Following Marcussen et al. (2014), we expected that
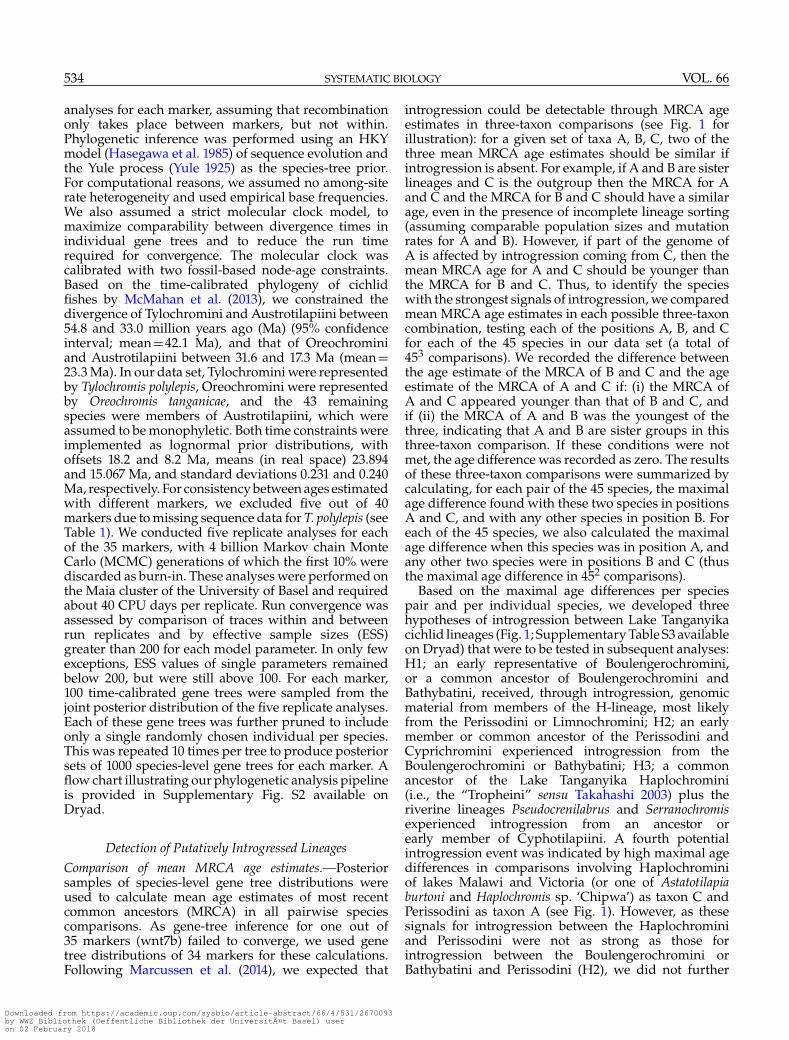
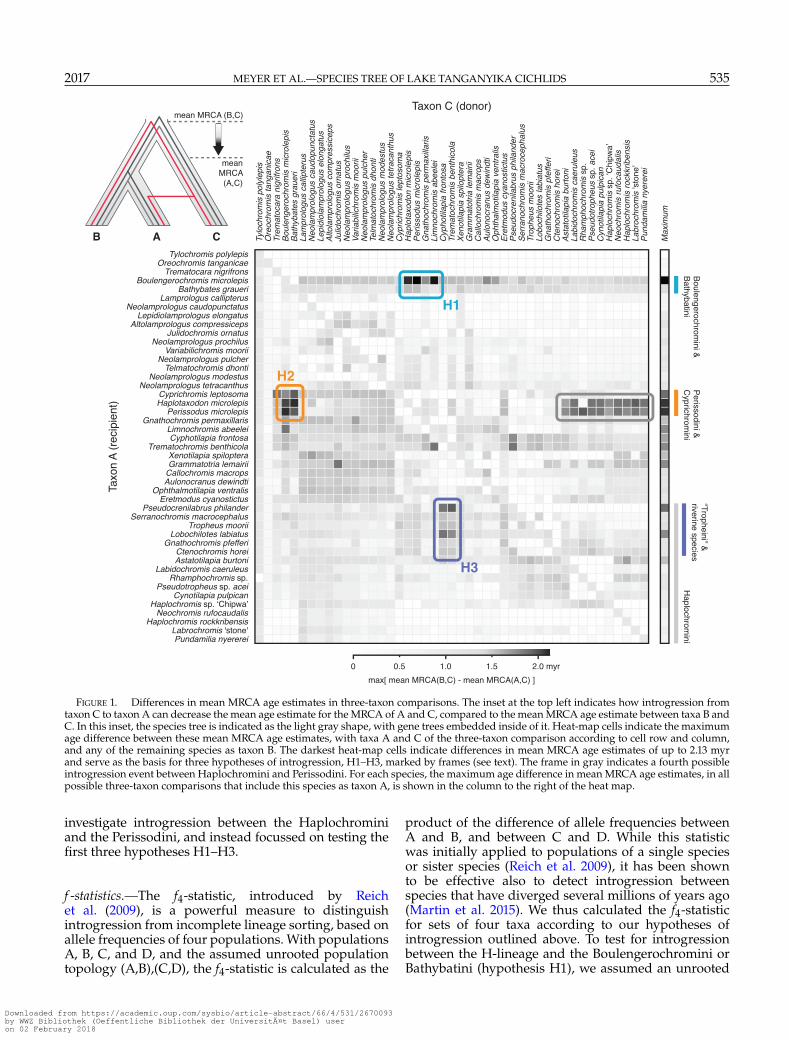
introgression could be detectable through MRCA ageestimates in three-taxon comparisons (see Fig. 1 forillustration): for a given set of taxa A, B, C, two of thethree mean MRCA age estimates should be similar ifintrogression is absent. For example, if A and B are sisterlineages and C is the outgroup then the MRCA for Aand C and the MRCA for B and C should have a similarage, even in the presence of incomplete lineage sorting(assuming comparable population sizes and mutationrates for A and B). However, if part of the genome ofA is affected by introgression coming from C, then themean MRCA age for A and C should be younger thanthe MRCA for B and C. Thus, to identify the specieswith the strongest signals of introgression, we comparedmean MRCA age estimates in each possible three-taxoncombination, testing each of the positions A, B, and Cfor each of the 45 species in our data set (a total of453 comparisons). We recorded the difference betweenthe age estimate of the MRCA of B and C and the ageestimate of the MRCA of A and C if: (i) the MRCA ofA and C appeared younger than that of B and C, andif (ii) the MRCA of A and B was the youngest of thethree, indicating that A and B are sister groups in thisthree-taxon comparison. If these conditions were notmet, the age difference was recorded as zero. The resultsof these three-taxon comparisons were summarized bycalculating, for each pair of the 45 species, the maximalage difference found with these two species in positionsA and C, and with any other species in position B. Foreach of the 45 species, we also calculated the maximalage difference when this species was in position A, andany other two species were in positions B and C (thusthe maximal age difference in 452 comparisons).
Based on the maximal age differences per speciespair and per individual species, we developed threehypotheses of introgression between Lake Tanganyikacichlid lineages (Fig. 1; Supplementary Table S3 availableon Dryad) that were to be tested in subsequent analyses:H1; an early representative of Boulengerochromini,or a common ancestor of Boulengerochromini andBathybatini, received, through introgression, genomicmaterial from members of the H-lineage, most likelyfrom the Perissodini or Limnochromini; H2; an earlymember or common ancestor of the Perissodini andCyprichromini experienced introgression from theBoulengerochromini or Bathybatini; H3; a commonancestor of the Lake Tanganyika Haplochromini(i.e., the “Tropheini” sensu Takahashi 2003) plus theriverine lineages Pseudocrenilabrus and Serranochromisexperienced introgression from an ancestor orearly member of Cyphotilapiini. A fourth potentialintrogression event was indicated by high maximal agedifferences in comparisons involving Haplochrominiof lakes Malawi and Victoria (or one of Astatotilapiaburtoni and Haplochromis sp. ‘Chipwa’) as taxon C andPerissodini as taxon A (see Fig. 1). However, as thesesignals for introgression between the Haplochrominiand Perissodini were not as strong as those forintrogression between the Boulengerochromini orBathybatini and Perissodini (H2), we did not further
Downloaded from https://academic.oup.com/sysbio/article-abstract/66/4/531/2670093by WWZ Bibliothek (Oeffentliche Bibliothek der Universität Basel) useron 02 February 2018
2017 MEYER ET AL.—SPECIES TREE OF LAKE TANGANYIKA CICHLIDS 535
FIGURE 1. Differences in mean MRCA age estimates in three-taxon comparisons. The inset at the top left indicates how introgression fromtaxon C to taxon A can decrease the mean age estimate for the MRCA of A and C, compared to the mean MRCA age estimate between taxa B andC. In this inset, the species tree is indicated as the light gray shape, with gene trees embedded inside of it. Heat-map cells indicate the maximumage difference between these mean MRCA age estimates, with taxa A and C of the three-taxon comparison according to cell row and column,and any of the remaining species as taxon B. The darkest heat-map cells indicate differences in mean MRCA age estimates of up to 2.13 myrand serve as the basis for three hypotheses of introgression, H1–H3, marked by frames (see text). The frame in gray indicates a fourth possibleintrogression event between Haplochromini and Perissodini. For each species, the maximum age difference in mean MRCA age estimates, in allpossible three-taxon comparisons that include this species as taxon A, is shown in the column to the right of the heat map.
investigate introgression between the Haplochrominiand the Perissodini, and instead focussed on testing thefirst three hypotheses H1–H3.
f -statistics.—The f4-statistic, introduced by Reichet al. (2009), is a powerful measure to distinguishintrogression from incomplete lineage sorting, based onallele frequencies of four populations. With populationsA, B, C, and D, and the assumed unrooted populationtopology (A,B),(C,D), the f4-statistic is calculated as the
product of the difference of allele frequencies betweenA and B, and between C and D. While this statisticwas initially applied to populations of a single speciesor sister species (Reich et al. 2009), it has been shownto be effective also to detect introgression betweenspecies that have diverged several millions of years ago(Martin et al. 2015). We thus calculated the f4-statisticfor sets of four taxa according to our hypotheses ofintrogression outlined above. To test for introgressionbetween the H-lineage and the Boulengerochromini orBathybatini (hypothesis H1), we assumed an unrooted
Downloaded from https://academic.oup.com/sysbio/article-abstract/66/4/531/2670093by WWZ Bibliothek (Oeffentliche Bibliothek der Universität Basel) useron 02 February 2018
536 SYSTEMATIC BIOLOGY VOL. 66
topology (A,B),(C,D), where A was one of the twotaxa Oreochromis tanganicae and Trematocara nigrifrons,B was Boulengerochromis microlepis or Bathybates graueri,C was either Perissodus microlepis or Limnochromisabeelei, and D was a member of Lamprologini, eitherLepidiolamprologus elongatus or Neolamprologus prochilus.In these comparisons, the two members of Lamprologiniwere chosen as this tribe, which is not included in the H-lineage, showed no or very weak signals of introgressioninto the Boulengerochromini and Bathybatini based onMRCA age estimates, in contrast to the Limnochrominiand Perissodini. To test for introgression between theBoulengerochromini or Bathybatini and the Perissodiniand Cyprichromini (H2), we repeated this test, againwith either O. tanganicae or T. nigrifrons as taxon A,B. microlepis or B. graueri as taxon B, and now P. microlepisor Cyprichromis leptosoma as taxon C, and Grammatotrialemairii or Ophthalmotilapia ventralis as taxon D. Finally,introgression between Cyphotilapiini and a cladecombining Lake Tanganyika Haplochromini withriverine lineages (H3) was assessed with one of thetwo members of Ectodini as species A, a member ofCyphotilapiini as species B, either Pseudocrenilabrusphilander or Lobochilotes labiatus as species C, andA. burtoni or Haplochromis sp. ‘Chipwa’ as species D.
In the absence of introgression, the f4-statistic isexpected to be zero, regardless of whether incompletelineage sorting is present or not. Thus, introgressionbetween one of the two species A and B and one ofthe species C and D can be inferred if the f4-statisticis significantly different from zero (Reich et al. 2009).Whether or not this is the case is usually assessed onthe basis of standard errors calculated through a blockjackknife procedure. The use of jackknife standard errorsfor confidence interval estimation assumes that theunderlying data is normally distributed, however, thismay often not be the case for the f4-statistic, especiallywith more divergent species-level allele frequency data.This is because with more divergent populations, a largernumbers of single nucleotide polymorphisms (SNPs)will be fixed within populations but different betweenthem. As a result, the f4-statistic will be exactly zero for alarge number of SNPs. If jackknife blocks include a largenumber of linked sites, the per-block f4-statistic may thenalso be close to zero more often than assumed undernormality.
To use the f4-statistic as a test of introgression withour population-level multimarker data set, we thereforeapplied not only a block jackknife procedure butalso developed a new approach to assess significance,which does not assume normality and accounts forlinkage of genetic variation within markers. To this end,we conducted simulations to evaluate how often theobserved f4-statistic can be reproduced in the absence ofintrogression, based on incomplete lineage sorting alone.We used the coalescent software fastsimcoal2 v.2.5.2(Excoffier et al. 2013) to produce sequence data sets forfour populations that are similar to the true data set interms of size and amount of missing data. Simulationswere carried out using a wrapper script for fastsimcoal2,
and simulation parameters for effective population sizesand divergence times were optimized during a burn-in phase. The burn-in phase was stopped as soon asparameter combinations were found with which theresulting simulated sequence variation matched theobserved sequence variation across all markers in theproportion of SNPs that are variable in more thanone species and in the proportion of SNPs that arevariable within both pairs of species. Subsequent toburn-in, 1000 sets of coalescent simulations were carriedout, where in each of these sets sequence data wassimulated separately for all 39–40 markers included ina given four species comparison. For each comparison,we used only sites that were biallelic among the fourspecies included in the comparison. We interpretedthe observed f4-statistic as evidence for introgression ifless than 5% of the 1000 data sets simulated withoutintrogression produced f4 values at least as extreme asthe observed. Our simulation-based test procedure wasimplemented in the new software F4, which is availableat https://github.com/mmatschiner/F4.
Species-Tree Inference with Reduced Taxon SetsAs some of the species showed stronger signals of
introgression than others, we assumed that excludingthe species with the strongest signals would produce alargely introgression-free reduced taxon set, for whichthe multispecies coalescent model of *BEAST should beappropriate in a joint analysis of all markers. Based onsignals of introgression observed with gene tree MRCAage comparisons and the f4-statistic, we excluded thefollowing taxa from species-tree inference with *BEAST:B. microlepis, B. graueri, members of Perissodini andCyprichromini, the riverine lineages Pseudocrenilabrusand Serranochromis, as well as all Lake Tanganyikahaplochromines except A. burtoni and Haplochromissp. ‘Chipwa’ (i.e., only the “Tropheini”; Takahashi2003). After excluding all individuals of these species,our data set contained population-level data for 34remaining species. As we did for gene-tree analyseswith *BEAST, we again used the Yule process as thespecies-tree prior and an HKY model of sequenceevolution without among-site rate variation and basefrequencies as empirically observed. Time calibrationwas again based on a strict molecular clock model withmarker-specific clock rates and on the same two timeconstraints based on McMahan et al. (2013) for theages of Tylochromini and Oreochromini. As alternativesto these time constraints, we also used youngerconstraints for the same divergence events, based onthe timeline of Friedman et al. (2013), in a separate setof analyses. According to the estimates of Friedmanet al. (2013), we constrained both the divergencebetween Tylochromini and Austrotilapiini and thedivergence between Oreochromini and Austrotilapiiniwith lognormal prior distributions, parameterized withmeans (in real space) 24.283 and 13.914 Ma and standarddeviations 0.085 and 0.1 Ma, respectively. Per-brancheffective population sizes were estimated as part of all
Downloaded from https://academic.oup.com/sysbio/article-abstract/66/4/531/2670093by WWZ Bibliothek (Oeffentliche Bibliothek der Universität Basel) useron 02 February 2018
2017 MEYER ET AL.—SPECIES TREE OF LAKE TANGANYIKA CICHLIDS 537
analyses, however, for computational reasons, the dataset was reduced to include maximally four randomlyselected phased sequences per species for each marker.To assess robustness of results, random sequenceselection was performed twice, and the two resultingdata sets were used for independent sets of *BEASTanalyses, in each case with both sets of time constraints.For each data set, we performed four replicate *BEASTruns with 4 billion MCMC steps per replicate, of whichthe first 40% were discarded as burn-in. These analyseswere conducted on the Abel cluster of the University ofOslo and required about 80 CPU days per run replicate.
To test how the application of the multispeciescoalescent model influences the estimated species-treetopology and timeline of cichlid diversification, we alsoperformed BEAST analyses with concatenated markersets for the 34 putatively introgression-free species.It has been argued that concatenation is a specialcase of the multispecies coalescent model in which allgene trees are constrained to be identical in topologyand branch lengths (Edwards et al. 2016). Thus, bycomparing results based on concatenation and themultispecies coalescent model, we effectively assess howthe release of the constraint of identical gene trees for allmarkers affects the species-tree estimate. We performedBayesian analyses of concatenated marker sets usingthe same model of sequence evolution, molecular clock,and speciation as for species-tree inference with themultispecies coalescent model of *BEAST and the timeconstraints of McMahan et al. (2013). For analyses ofconcatenated marker sets, we removed within-speciessequence variation by random selection of a singlesequence per marker and species. This step was repeatedtwice to assess the effect of stochasticity in the randomsequence selection. For the two generated data sets, weconducted five replicate BEAST analyses, each using 500million MCMC generations, of which we discarded thefirst 20% as burn-in.
Run convergence in all BEAST analyses was evaluatedby ESS values above 200 for nearly all model parameters(and above 100 for all parameters), and by visualinspection of parameter traces within and betweenreplicates. Posterior tree samples of run replicates werecombined to produce maximum clade credibility (MCC)species trees with the software TreeAnnotator v.2.1.3(Bouckaert et al. 2014), with node heights set to meanage estimates.
Constrained Gene-Tree Inference Based on the Species TreeWe now used the species tree based on the putatively
introgression-free reduced taxon set to obtain morereliable estimates of gene trees, which were to be used forlikelihood inference of introgression (see below). Thesenew gene-tree analyses were performed separately foreach of 35 markers, again excluding five markers forwhich no sequence data for T. polylepis were available.Constrained gene trees were inferred with a new set of*BEAST analyses, with additional constraints accordingto the previously inferred species tree based on the
timeline of McMahan et al. (2013). These constraints wereplaced on the age and topology of 15 clades that weresupported with Bayesian posterior probabilities (BPP)of at least 0.99 in the species tree. To constrain the age ofthese clades according to the previously inferred speciestree, we used lognormal prior distributions fitted to thedistribution of posterior age estimates from the previousanalysis. However, the topology of these clades couldnot simply be constrained as monophyletic with respectto all other taxa, as the new set of gene-tree analysesincluded additional species (see below) that might fallinto these clades. To allow inclusion of additional taxawithin these clades, we used “CladeConstraint” priorsfrom the Sampled Ancestors (Gavryushkina et al. 2014)package for BEAST. These priors allow specifications ofin-group and outgroup taxa for a clade, and all taxanot listed in either of the two categories are allowedto be included in one or the other. Data sets usedfor these analyses included maximally four sequencesper species, for the same set of 34 species that wereincluded in the inference of the putatively introgression-free reduced species tree, and for one of the threespecies B. microlepis, P. microlepis, and P. philander. Threesets of analyses were conducted so that each includedonly one of these three species, and within-speciessequence data was again selected at random, which wasrepeated twice to produce two equivalent data sets forseparate analyses. Thus, for each of the 35 markers,we used six data sets that differed slightly in speciessets and selected sequences per species. Per marker,three replicate *BEAST analyses were carried out foreach of the six data sets, with the same settings asfor the previous species-tree analyses, except that only500 million MCMC generations were used for eachanalysis replicate. After run convergence was assessed,we merged the posterior tree distributions for each setof three run replicates. For each marker, and for each ofthe data sets used for this marker, we produced summarytrees with only one tip per species by randomly removingall but one individual per species from each tree of theposterior distribution before generating MCC gene trees.Since visual inspection showed that for each markerand species set, the two MCC gene trees resulting fromrepeated random selection of within-species sequencedata were highly congruent, we generated joint MCCgene trees from the combined posterior tree distributionsof the two analyses.
Likelihood-Based Tests for IntrogressionWe used the inferred sets of constrained gene trees
to test the three hypotheses of introgression, H1–H3,in a likelihood framework. For the three sets of taxathat each included one of the three species with strongsignals of introgression (B. microlepis, P. microlepis,and P. philander), the inferred MCC gene trees wereused jointly to assess the phylogenetic position andthe most probable source of introgression into thisspecies. We used function “InferNetwork_ML” (Yuet al. 2014) of the program PhyloNet v.3.5.6 (Than
Downloaded from https://academic.oup.com/sysbio/article-abstract/66/4/531/2670093by WWZ Bibliothek (Oeffentliche Bibliothek der Universität Basel) useron 02 February 2018
538 SYSTEMATIC BIOLOGY VOL. 66
et al. 2008) to compare the likelihoods of the set ofgene trees under incomplete lineage sorting alone,and after adding a single introgression edge to thespecies tree. For computational reasons, and because weexpected introgression into B. microlepis, P. microlepis,and P. philander to originate from basal branches orstem lineages of tribes rather than from their crowns,we reduced all gene trees to single representativesof tribes for these analyses. As representatives oftribes, of which our taxon set included multiplespecies, we chose the lamprologine N. prochilus, theectodine O. ventralis, the limnochromine G, permaxillaris,the cyphotilapiine Trematochromis benthicola, and thehaplochromine Pundamilia nyererei, due to low amountsof missing data for these taxa and their nested positionsin the respective tribes. After further removing 2 of the35 gene trees due to missing data for Trematocarini,all 33 remaining gene trees included a tip for each of10 tribes. To disregard topologically uncertain nodes ingene tree’s, we applied a gene tree’s support thresholdof BPP≥0.9 in all PhyloNet analyses (option “-b”). Tenreplicate analyses were performed for all sets of genetrees (option “-x”) to assess convergence, and branchlengths and inheritance probabilities of introgressionedges were optimized after the topology search (option“-po”).
RESULTS
Detection of Putatively Introgressed LineagesComparison of mean MRCA age estimates.—Ourcomparison of MRCA mean age estimates in 35gene trees showed that divergences in three-taxoncomparisons were the least tree-like when members ofthree groups of Lake Tanganyika cichlids were included.These groups comprised (i) the Boulengerochromini andBathybatini, (ii) the Perissodini and Cyprichromini, and(iii) Lake Tanganyika Haplochromini and the riverinelineages Pseudocrenilabrus and Serranochromis (Fig. 1).When B. microlepis was included in the comparisonas taxon A (see scheme in Fig. 1), the MRCA ageestimates between taxa A and C were up to 2.13 myryounger than those between taxa A and B, whichwas the case in a comparison with T. nigrifrons astaxon B and P. microlepis as taxon C (SupplementaryTable S3 available on Dryad). For the three speciesinvolved in this comparison, B. microlepis was closest toT. nigrifrons in the MCC gene trees of 15 markers, closestto P. microlepis in the MCC gene trees of 12 markers, andancestral to the other two taxa in the MCC gene trees of5 markers (the trees of the remaining markers did notinclude one of these species) (Supplementary File S2available on Dryad). Comparable differences in MRCAage estimates were observed when other members ofthe Perissodini or Limnochromini were included in thecomparison instead of P. microlepis (Fig. 1), or whenB. graueri was used instead of B. microlepis.
When members of Cyprichromini and Perissodiniwere used as taxon A in three-taxon comparisons, the
greatest difference between the mean age estimate forthe MRCA of taxa B and C and the mean age estimatefor the MRCA of taxa A and C was found in the speciestrio P. microlepis (as taxon A), G. pfefferi (as taxon B),and B. microlepis (as taxon C). The mean MRCA ageestimate of P. microlepis and each of the other twospecies was about 2 myr younger than that between them(Supplementary Table S3 available on Dryad). Perissodusmicrolepis was found closer to G. pfefferi in the MCC genetrees of 18 markers, and closer to B. microlepis in the MCCgene trees of 15 markers, and it was the outgroup tothe other two taxa in the remaining 5 MCC gene trees(Supplementary File S2 available on Dryad). Very similarpatterns were found when other members of Perissodiniand Cyprichromini were used instead of P. microlepis, orwhen B. microlepis was replaced by B. graueri (Fig. 1).
We further observed large differences between themean age estimate for the MRCA of taxa B and Cand the mean age estimate for the MRCA of taxaA and C in comparisons involving Lake Tanganyikahaplochromines, Pseudocrenilabrus, or Serranochromisas taxon A, together with a representative of theCyphotilapiini as taxon C (Fig. 1). These differences weremost pronounced in a comparison including P. philanderas taxon A, Neochromis rufocaudalis as taxon B, andT. benthicola as taxon C, where the mean MRCA ageestimate for T. benthicola, and N. rufocaudalis was about1.8 myr older than both mean age estimates for MRCAinvolving P. philander (Supplementary Table S3 availableon Dryad). Among these three species, P. philander wassister to N. rufocaudalis in the MCC gene trees of 15markers and to T. benthicola in the MCC gene trees of12 markers, and N. rufocaudalis and T. benthicola weremost closely related in the remaining 7 MCC gene trees(Supplementary File S2 available on Dryad).
Taken together, these results are consistent with atleast three hypothesized introgression events duringthe early diversification of Lake Tanganyika cichlids:MRCA age differences and gene topology frequencies inthree-taxon comparisons involving B. microlepis mightbe explained by introgression from the H-lineage tothe Boulengerochromini or to a common ancestor ofBoulengerochromini and Bathybatini (hypothesis H1),introgression may further have occurred between amember of the Boulengerochromini and Bathybatini,and an ancestor of Perissodini and Cyprichromini(hypothesis H2), and Pseudocrenilabrus or an earlyrepresentative of Lake Tanganyika haplochromines mayhave experienced introgression from the Cyphotilapiini(hypothesis H3).
f -statistics.—The f4-statistic was calculated for a totalof 46 four-taxon comparisons, with between 390 and745 biallelic SNPs that could be extracted from ourmultimarker data set (Supplementary Table S4 availableon Dryad). Between 2.0 and 5.4% of these SNPs werevariable within both pairs of sister taxa, indicating geneflow between lineages that are separated by millionsof years. Most of the calculated f4 values (39 out of
Downloaded from https://academic.oup.com/sysbio/article-abstract/66/4/531/2670093by WWZ Bibliothek (Oeffentliche Bibliothek der Universität Basel) useron 02 February 2018
2017 MEYER ET AL.—SPECIES TREE OF LAKE TANGANYIKA CICHLIDS 539
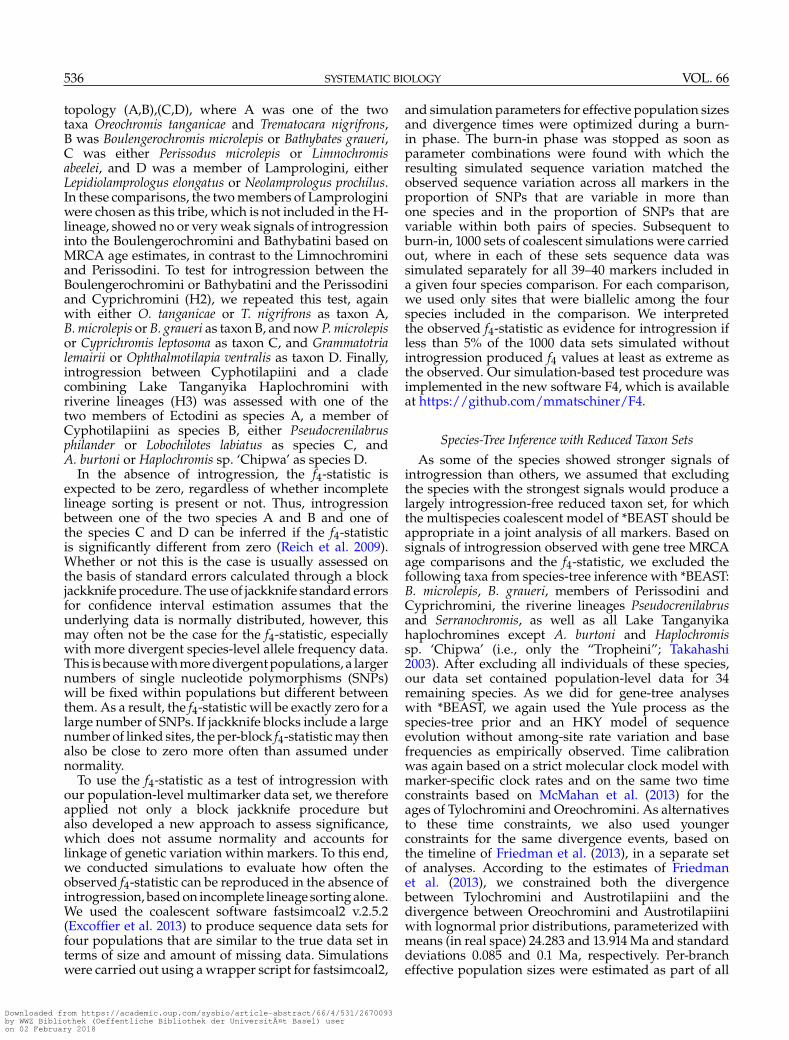
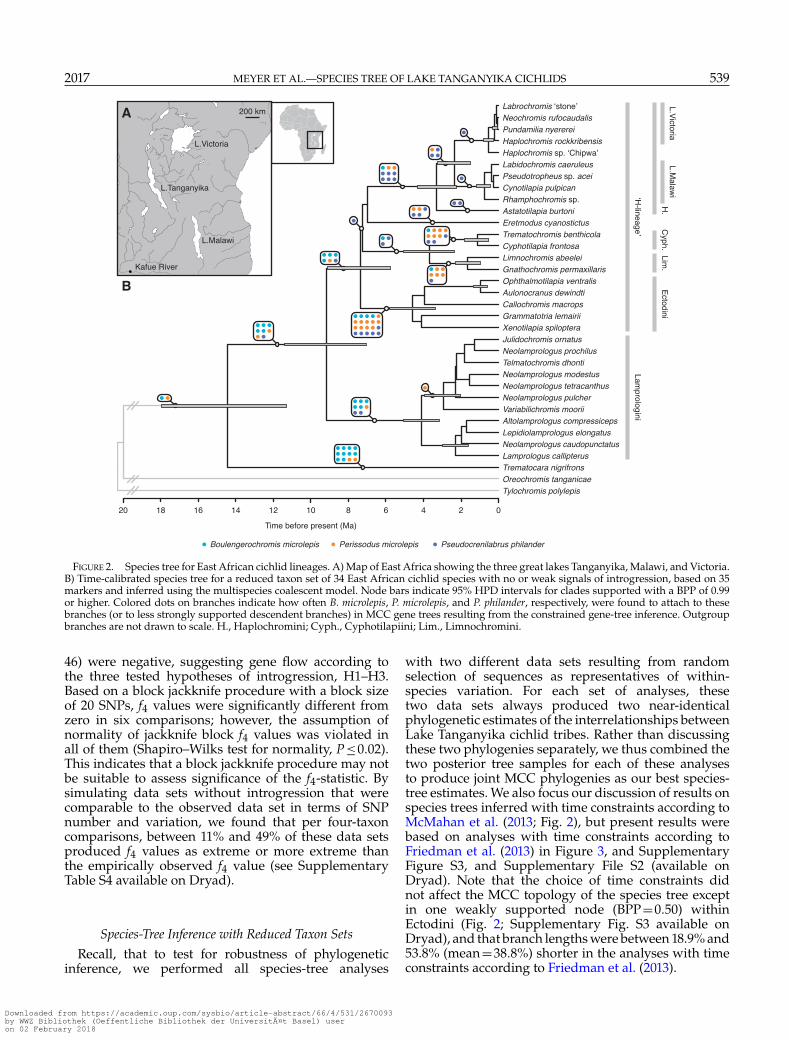
FIGURE 2. Species tree for East African cichlid lineages. A) Map of East Africa showing the three great lakes Tanganyika, Malawi, and Victoria.B) Time-calibrated species tree for a reduced taxon set of 34 East African cichlid species with no or weak signals of introgression, based on 35markers and inferred using the multispecies coalescent model. Node bars indicate 95% HPD intervals for clades supported with a BPP of 0.99or higher. Colored dots on branches indicate how often B. microlepis, P. microlepis, and P. philander, respectively, were found to attach to thesebranches (or to less strongly supported descendent branches) in MCC gene trees resulting from the constrained gene-tree inference. Outgroupbranches are not drawn to scale. H., Haplochromini; Cyph., Cyphotilapiini; Lim., Limnochromini.
46) were negative, suggesting gene flow according tothe three tested hypotheses of introgression, H1–H3.Based on a block jackknife procedure with a block sizeof 20 SNPs, f4 values were significantly different fromzero in six comparisons; however, the assumption ofnormality of jackknife block f4 values was violated inall of them (Shapiro–Wilks test for normality, P≤0.02).This indicates that a block jackknife procedure may notbe suitable to assess significance of the f4-statistic. Bysimulating data sets without introgression that werecomparable to the observed data set in terms of SNPnumber and variation, we found that per four-taxoncomparisons, between 11% and 49% of these data setsproduced f4 values as extreme or more extreme thanthe empirically observed f4 value (see SupplementaryTable S4 available on Dryad).
Species-Tree Inference with Reduced Taxon SetsRecall, that to test for robustness of phylogenetic
inference, we performed all species-tree analyses
with two different data sets resulting from randomselection of sequences as representatives of within-species variation. For each set of analyses, thesetwo data sets always produced two near-identicalphylogenetic estimates of the interrelationships betweenLake Tanganyika cichlid tribes. Rather than discussingthese two phylogenies separately, we thus combined thetwo posterior tree samples for each of these analysesto produce joint MCC phylogenies as our best species-tree estimates. We also focus our discussion of results onspecies trees inferred with time constraints according toMcMahan et al. (2013; Fig. 2), but present results werebased on analyses with time constraints according toFriedman et al. (2013) in Figure 3, and SupplementaryFigure S3, and Supplementary File S2 (available onDryad). Note that the choice of time constraints didnot affect the MCC topology of the species tree exceptin one weakly supported node (BPP=0.50) withinEctodini (Fig. 2; Supplementary Fig. S3 available onDryad), and that branch lengths were between 18.9% and53.8% (mean=38.8%) shorter in the analyses with timeconstraints according to Friedman et al. (2013).
Downloaded from https://academic.oup.com/sysbio/article-abstract/66/4/531/2670093by WWZ Bibliothek (Oeffentliche Bibliothek der Universität Basel) useron 02 February 2018
540 SYSTEMATIC BIOLOGY VOL. 66
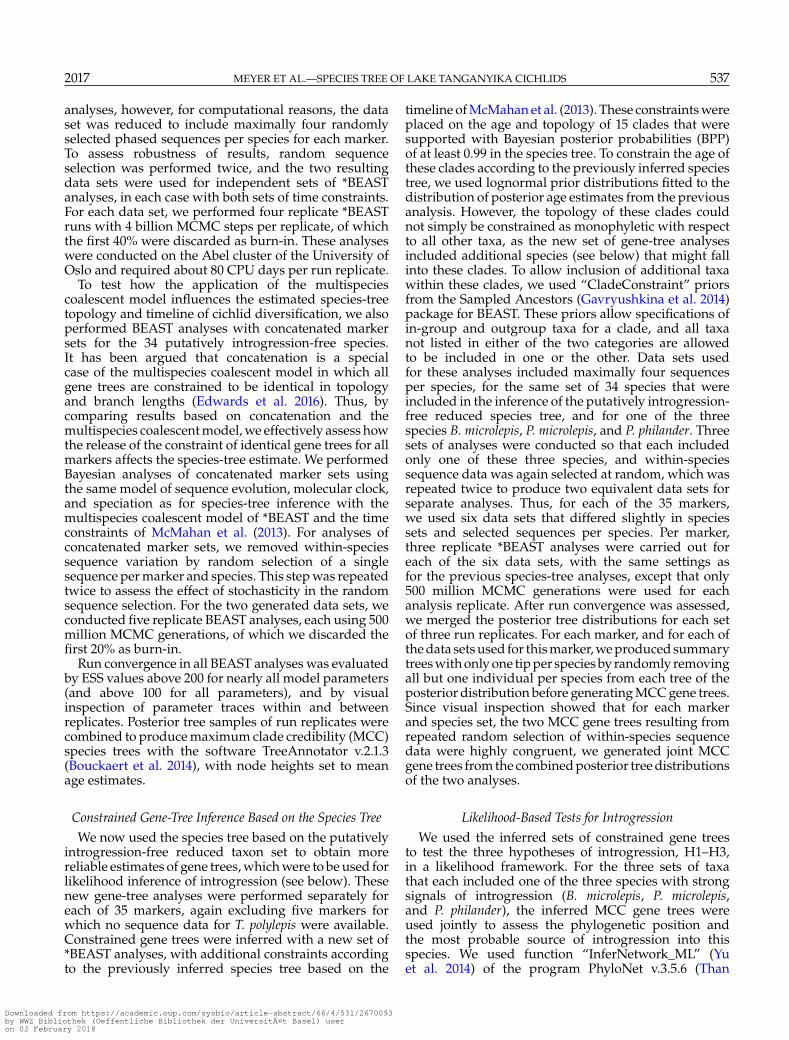
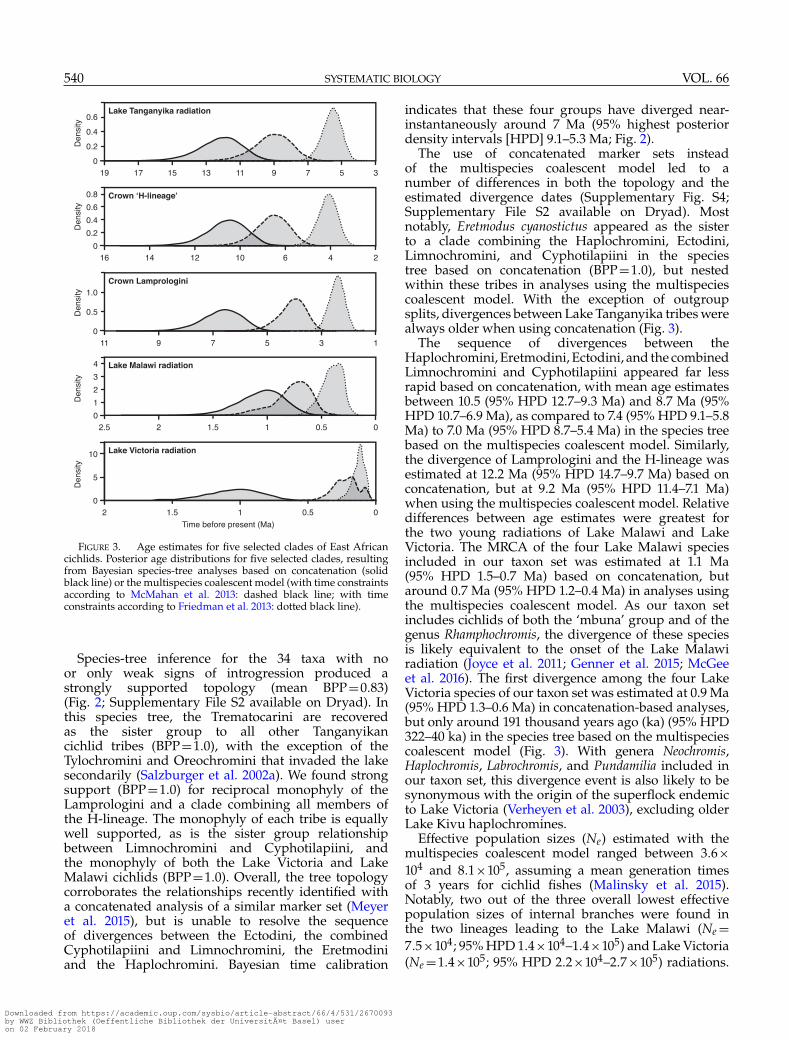
FIGURE 3. Age estimates for five selected clades of East Africancichlids. Posterior age distributions for five selected clades, resultingfrom Bayesian species-tree analyses based on concatenation (solidblack line) or the multispecies coalescent model (with time constraintsaccording to McMahan et al. 2013: dashed black line; with timeconstraints according to Friedman et al. 2013: dotted black line).
Species-tree inference for the 34 taxa with noor only weak signs of introgression produced astrongly supported topology (mean BPP=0.83)(Fig. 2; Supplementary File S2 available on Dryad). Inthis species tree, the Trematocarini are recoveredas the sister group to all other Tanganyikancichlid tribes (BPP=1.0), with the exception of theTylochromini and Oreochromini that invaded the lakesecondarily (Salzburger et al. 2002a). We found strongsupport (BPP=1.0) for reciprocal monophyly of theLamprologini and a clade combining all members ofthe H-lineage. The monophyly of each tribe is equallywell supported, as is the sister group relationshipbetween Limnochromini and Cyphotilapiini, andthe monophyly of both the Lake Victoria and LakeMalawi cichlids (BPP=1.0). Overall, the tree topologycorroborates the relationships recently identified witha concatenated analysis of a similar marker set (Meyeret al. 2015), but is unable to resolve the sequenceof divergences between the Ectodini, the combinedCyphotilapiini and Limnochromini, the Eretmodiniand the Haplochromini. Bayesian time calibration
indicates that these four groups have diverged near-instantaneously around 7 Ma (95% highest posteriordensity intervals [HPD] 9.1–5.3 Ma; Fig. 2).
The use of concatenated marker sets insteadof the multispecies coalescent model led to anumber of differences in both the topology and theestimated divergence dates (Supplementary Fig. S4;Supplementary File S2 available on Dryad). Mostnotably, Eretmodus cyanostictus appeared as the sisterto a clade combining the Haplochromini, Ectodini,Limnochromini, and Cyphotilapiini in the speciestree based on concatenation (BPP=1.0), but nestedwithin these tribes in analyses using the multispeciescoalescent model. With the exception of outgroupsplits, divergences between Lake Tanganyika tribes werealways older when using concatenation (Fig. 3).
The sequence of divergences between theHaplochromini, Eretmodini, Ectodini, and the combinedLimnochromini and Cyphotilapiini appeared far lessrapid based on concatenation, with mean age estimatesbetween 10.5 (95% HPD 12.7–9.3 Ma) and 8.7 Ma (95%HPD 10.7–6.9 Ma), as compared to 7.4 (95% HPD 9.1–5.8Ma) to 7.0 Ma (95% HPD 8.7–5.4 Ma) in the species treebased on the multispecies coalescent model. Similarly,the divergence of Lamprologini and the H-lineage wasestimated at 12.2 Ma (95% HPD 14.7–9.7 Ma) based onconcatenation, but at 9.2 Ma (95% HPD 11.4–7.1 Ma)when using the multispecies coalescent model. Relativedifferences between age estimates were greatest forthe two young radiations of Lake Malawi and LakeVictoria. The MRCA of the four Lake Malawi speciesincluded in our taxon set was estimated at 1.1 Ma(95% HPD 1.5–0.7 Ma) based on concatenation, butaround 0.7 Ma (95% HPD 1.2–0.4 Ma) in analyses usingthe multispecies coalescent model. As our taxon setincludes cichlids of both the ‘mbuna’ group and of thegenus Rhamphochromis, the divergence of these speciesis likely equivalent to the onset of the Lake Malawiradiation (Joyce et al. 2011; Genner et al. 2015; McGeeet al. 2016). The first divergence among the four LakeVictoria species of our taxon set was estimated at 0.9 Ma(95% HPD 1.3–0.6 Ma) in concatenation-based analyses,but only around 191 thousand years ago (ka) (95% HPD322–40 ka) in the species tree based on the multispeciescoalescent model (Fig. 3). With genera Neochromis,Haplochromis, Labrochromis, and Pundamilia included inour taxon set, this divergence event is also likely to besynonymous with the origin of the superflock endemicto Lake Victoria (Verheyen et al. 2003), excluding olderLake Kivu haplochromines.
Effective population sizes (Ne) estimated with themultispecies coalescent model ranged between 3.6×10⁴ and 8.1×10⁵, assuming a mean generation timesof 3 years for cichlid fishes (Malinsky et al. 2015).Notably, two out of the three overall lowest effectivepopulation sizes of internal branches were found inthe two lineages leading to the Lake Malawi (Ne =7.5×10⁴; 95% HPD 1.4×10⁴–1.4×10⁵) and Lake Victoria(Ne =1.4×10⁵; 95% HPD 2.2×10⁴–2.7×10⁵) radiations.
Downloaded from https://academic.oup.com/sysbio/article-abstract/66/4/531/2670093by WWZ Bibliothek (Oeffentliche Bibliothek der Universität Basel) useron 02 February 2018
2017 MEYER ET AL.—SPECIES TREE OF LAKE TANGANYIKA CICHLIDS 541
In contrast, high effective population sizes were inferredfor the basal lineages of the Lake Tanganyika radiation,with estimates of 6.1×10⁵ (95% HPD 2.6–9.8×10⁵) forthe branch leading to the H-lineage, and 3.8×10⁵ (95%HPD 2.4–5.3×10⁵) in the stem lineage of Lamprologini,and 5.1×10⁵ (95% HPD 2.9–7.3×10⁵) in the commonancestor of these two groups.
Constrained Gene-Tree Inference based on the Species TreeAdding species-tree constraints to the inference of
individual gene trees greatly improved the species-level node support of these gene trees (mean BPP=0.64, compared to mean BPP=0.43 in unconstrainedgene-tree analyses). The addition of species putativelyinvolved in introgression to the taxon set resultedin very different attachment points for B. microlepis,P. microlepis, and P. philander in individual constrainedgene trees (Fig. 2; Supplementary File S2 availableon Dryad). Boulengerochromis microlepis was found ina sister-group position to T. nigrifrons in ten genetrees, but also appeared more closely related to theEctodini, the H-lineage, the Lamprologini, or a cladecombining the H-lineage and Lamprologini in a totalof 18 constrained gene trees. In contrast, P. microlepiswas most often recovered as the sister of the Ectodini(in 10 constrained gene trees), but appeared closelyrelated to the Cyphotilapiini (6 constrained gene trees)and Limnochromini (5 constrained gene trees), andalso diverged from basal branches in several of theconstrained gene trees. Attachment points for P. philanderwere mostly found within the Haplochromini (3constrained gene trees), but the species also appearedas the sister of the Ectodini (6 constrained genetrees), the Eretmodini (3 constrained gene trees), orthe Cyphotilapiini (three constrained gene trees). Allattachment points of these three species are shown inFigure 2.
Likelihood-Based Tests for IntrogressionMaximum likelihood network topologies were
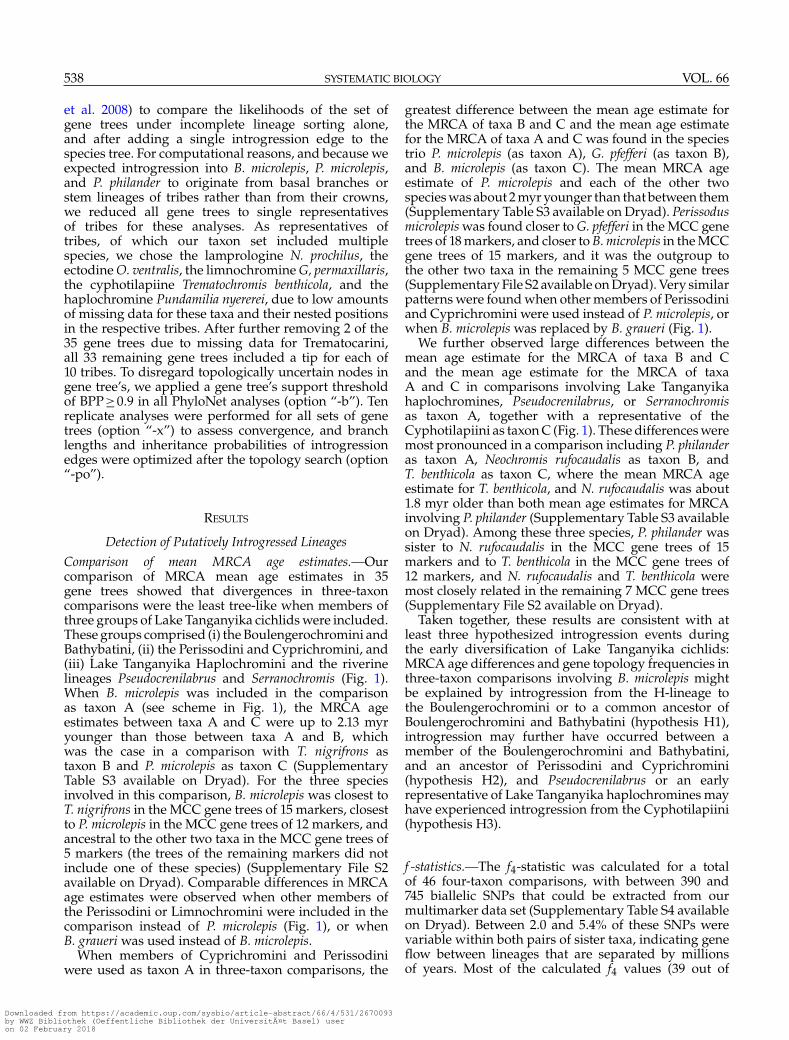
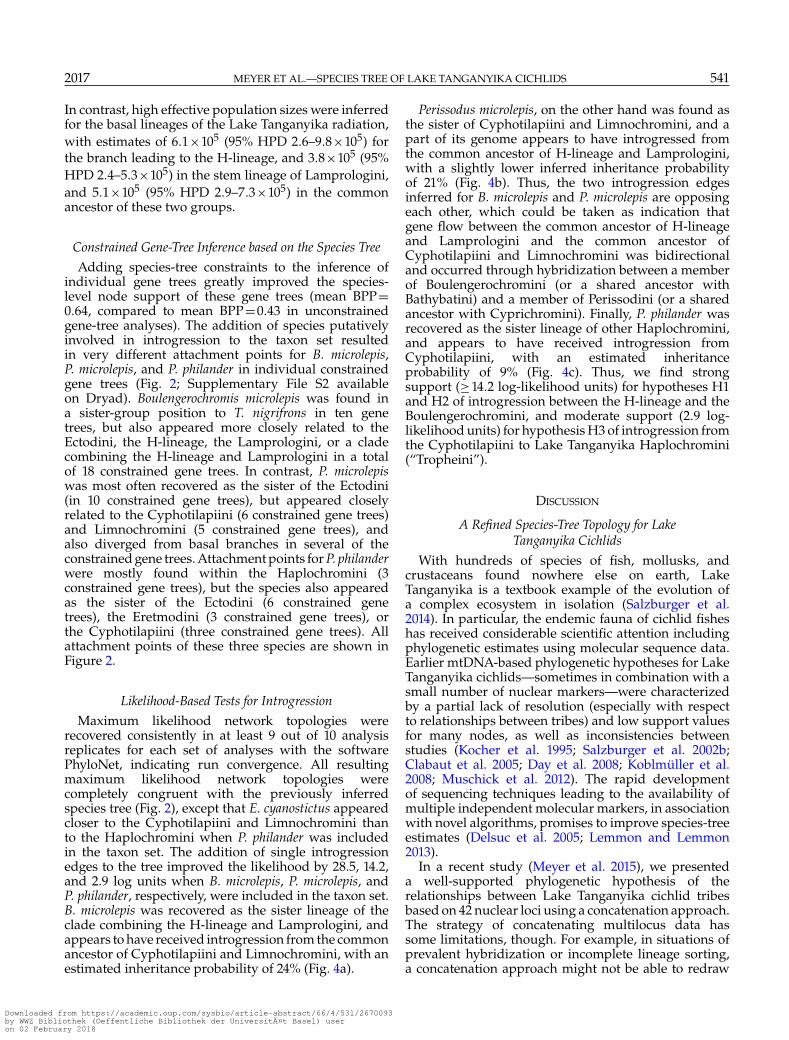
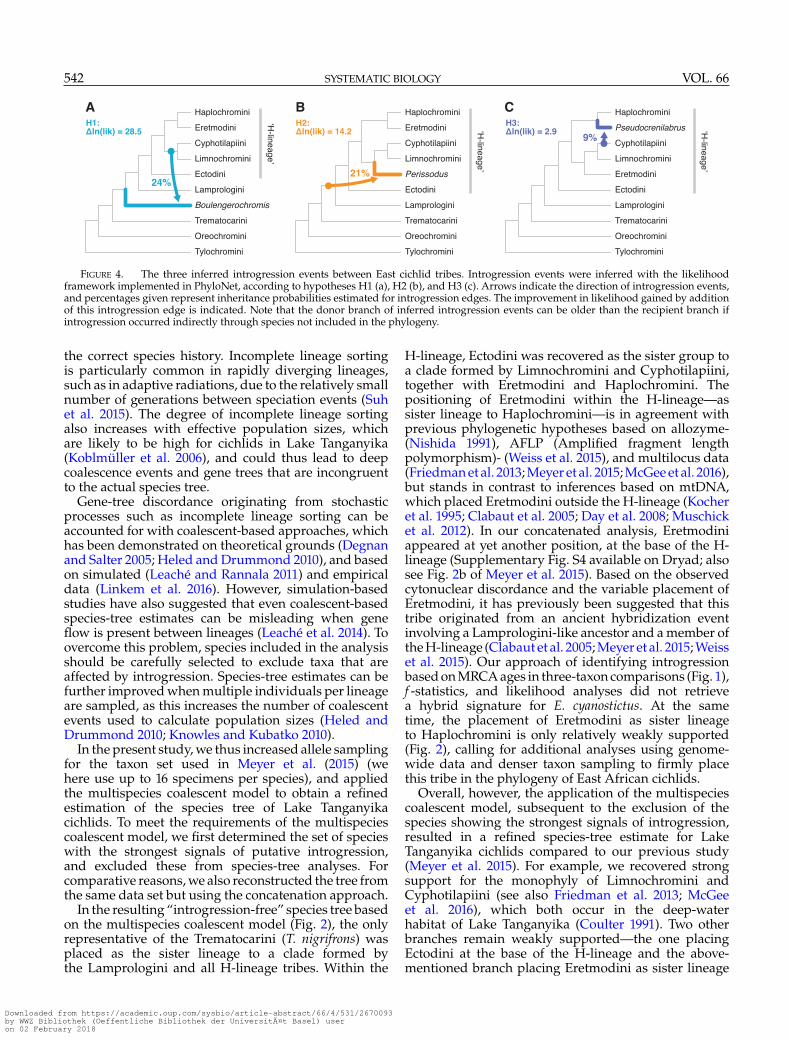
recovered consistently in at least 9 out of 10 analysisreplicates for each set of analyses with the softwarePhyloNet, indicating run convergence. All resultingmaximum likelihood network topologies werecompletely congruent with the previously inferredspecies tree (Fig. 2), except that E. cyanostictus appearedcloser to the Cyphotilapiini and Limnochromini thanto the Haplochromini when P. philander was includedin the taxon set. The addition of single introgressionedges to the tree improved the likelihood by 28.5, 14.2,and 2.9 log units when B. microlepis, P. microlepis, andP. philander, respectively, were included in the taxon set.B. microlepis was recovered as the sister lineage of theclade combining the H-lineage and Lamprologini, andappears to have received introgression from the commonancestor of Cyphotilapiini and Limnochromini, with anestimated inheritance probability of 24% (Fig. 4a).
Perissodus microlepis, on the other hand was found asthe sister of Cyphotilapiini and Limnochromini, and apart of its genome appears to have introgressed fromthe common ancestor of H-lineage and Lamprologini,with a slightly lower inferred inheritance probabilityof 21% (Fig. 4b). Thus, the two introgression edgesinferred for B. microlepis and P. microlepis are opposingeach other, which could be taken as indication thatgene flow between the common ancestor of H-lineageand Lamprologini and the common ancestor ofCyphotilapiini and Limnochromini was bidirectionaland occurred through hybridization between a memberof Boulengerochromini (or a shared ancestor withBathybatini) and a member of Perissodini (or a sharedancestor with Cyprichromini). Finally, P. philander wasrecovered as the sister lineage of other Haplochromini,and appears to have received introgression fromCyphotilapiini, with an estimated inheritanceprobability of 9% (Fig. 4c). Thus, we find strongsupport (≥14.2 log-likelihood units) for hypotheses H1and H2 of introgression between the H-lineage and theBoulengerochromini, and moderate support (2.9 log-likelihood units) for hypothesis H3 of introgression fromthe Cyphotilapiini to Lake Tanganyika Haplochromini(“Tropheini”).
DISCUSSION
A Refined Species-Tree Topology for LakeTanganyika Cichlids
With hundreds of species of fish, mollusks, andcrustaceans found nowhere else on earth, LakeTanganyika is a textbook example of the evolution ofa complex ecosystem in isolation (Salzburger et al.2014). In particular, the endemic fauna of cichlid fisheshas received considerable scientific attention includingphylogenetic estimates using molecular sequence data.Earlier mtDNA-based phylogenetic hypotheses for LakeTanganyika cichlids—sometimes in combination with asmall number of nuclear markers—were characterizedby a partial lack of resolution (especially with respectto relationships between tribes) and low support valuesfor many nodes, as well as inconsistencies betweenstudies (Kocher et al. 1995; Salzburger et al. 2002b;Clabaut et al. 2005; Day et al. 2008; Koblmüller et al.2008; Muschick et al. 2012). The rapid developmentof sequencing techniques leading to the availability ofmultiple independent molecular markers, in associationwith novel algorithms, promises to improve species-treeestimates (Delsuc et al. 2005; Lemmon and Lemmon2013).
In a recent study (Meyer et al. 2015), we presenteda well-supported phylogenetic hypothesis of therelationships between Lake Tanganyika cichlid tribesbased on 42 nuclear loci using a concatenation approach.The strategy of concatenating multilocus data hassome limitations, though. For example, in situations ofprevalent hybridization or incomplete lineage sorting,a concatenation approach might not be able to redraw
Downloaded from https://academic.oup.com/sysbio/article-abstract/66/4/531/2670093by WWZ Bibliothek (Oeffentliche Bibliothek der Universität Basel) useron 02 February 2018
542 SYSTEMATIC BIOLOGY VOL. 66
FIGURE 4. The three inferred introgression events between East cichlid tribes. Introgression events were inferred with the likelihoodframework implemented in PhyloNet, according to hypotheses H1 (a), H2 (b), and H3 (c). Arrows indicate the direction of introgression events,and percentages given represent inheritance probabilities estimated for introgression edges. The improvement in likelihood gained by additionof this introgression edge is indicated. Note that the donor branch of inferred introgression events can be older than the recipient branch ifintrogression occurred indirectly through species not included in the phylogeny.
the correct species history. Incomplete lineage sortingis particularly common in rapidly diverging lineages,such as in adaptive radiations, due to the relatively smallnumber of generations between speciation events (Suhet al. 2015). The degree of incomplete lineage sortingalso increases with effective population sizes, whichare likely to be high for cichlids in Lake Tanganyika(Koblmüller et al. 2006), and could thus lead to deepcoalescence events and gene trees that are incongruentto the actual species tree.
Gene-tree discordance originating from stochasticprocesses such as incomplete lineage sorting can beaccounted for with coalescent-based approaches, whichhas been demonstrated on theoretical grounds (Degnanand Salter 2005; Heled and Drummond 2010), and basedon simulated (Leaché and Rannala 2011) and empiricaldata (Linkem et al. 2016). However, simulation-basedstudies have also suggested that even coalescent-basedspecies-tree estimates can be misleading when geneflow is present between lineages (Leaché et al. 2014). Toovercome this problem, species included in the analysisshould be carefully selected to exclude taxa that areaffected by introgression. Species-tree estimates can befurther improved when multiple individuals per lineageare sampled, as this increases the number of coalescentevents used to calculate population sizes (Heled andDrummond 2010; Knowles and Kubatko 2010).
In the present study, we thus increased allele samplingfor the taxon set used in Meyer et al. (2015) (wehere use up to 16 specimens per species), and appliedthe multispecies coalescent model to obtain a refinedestimation of the species tree of Lake Tanganyikacichlids. To meet the requirements of the multispeciescoalescent model, we first determined the set of specieswith the strongest signals of putative introgression,and excluded these from species-tree analyses. Forcomparative reasons, we also reconstructed the tree fromthe same data set but using the concatenation approach.
In the resulting “introgression-free” species tree basedon the multispecies coalescent model (Fig. 2), the onlyrepresentative of the Trematocarini (T. nigrifrons) wasplaced as the sister lineage to a clade formed bythe Lamprologini and all H-lineage tribes. Within the
H-lineage, Ectodini was recovered as the sister group toa clade formed by Limnochromini and Cyphotilapiini,together with Eretmodini and Haplochromini. Thepositioning of Eretmodini within the H-lineage—assister lineage to Haplochromini—is in agreement withprevious phylogenetic hypotheses based on allozyme-(Nishida 1991), AFLP (Amplified fragment lengthpolymorphism)- (Weiss et al. 2015), and multilocus data(Friedman et al. 2013; Meyer et al. 2015; McGee et al. 2016),but stands in contrast to inferences based on mtDNA,which placed Eretmodini outside the H-lineage (Kocheret al. 1995; Clabaut et al. 2005; Day et al. 2008; Muschicket al. 2012). In our concatenated analysis, Eretmodiniappeared at yet another position, at the base of the H-lineage (Supplementary Fig. S4 available on Dryad; alsosee Fig. 2b of Meyer et al. 2015). Based on the observedcytonuclear discordance and the variable placement ofEretmodini, it has previously been suggested that thistribe originated from an ancient hybridization eventinvolving a Lamprologini-like ancestor and a member ofthe H-lineage (Clabaut et al. 2005; Meyer et al. 2015; Weisset al. 2015). Our approach of identifying introgressionbased on MRCA ages in three-taxon comparisons (Fig. 1),f -statistics, and likelihood analyses did not retrievea hybrid signature for E. cyanostictus. At the sametime, the placement of Eretmodini as sister lineageto Haplochromini is only relatively weakly supported(Fig. 2), calling for additional analyses using genome-wide data and denser taxon sampling to firmly placethis tribe in the phylogeny of East African cichlids.
Overall, however, the application of the multispeciescoalescent model, subsequent to the exclusion of thespecies showing the strongest signals of introgression,resulted in a refined species-tree estimate for LakeTanganyika cichlids compared to our previous study(Meyer et al. 2015). For example, we recovered strongsupport for the monophyly of Limnochromini andCyphotilapiini (see also Friedman et al. 2013; McGeeet al. 2016), which both occur in the deep-waterhabitat of Lake Tanganyika (Coulter 1991). Two otherbranches remain weakly supported—the one placingEctodini at the base of the H-lineage and the above-mentioned branch placing Eretmodini as sister lineage
Downloaded from https://academic.oup.com/sysbio/article-abstract/66/4/531/2670093by WWZ Bibliothek (Oeffentliche Bibliothek der Universität Basel) useron 02 February 2018
2017 MEYER ET AL.—SPECIES TREE OF LAKE TANGANYIKA CICHLIDS 543
to Haplochromini. The apparent lack of phylogeneticresolution among these branches in our analyses withthe multispecies coalescent model (Fig. 2) is likely toreflect the rapidity of lineage formation at the base of theH-lineage (see also Salzburger et al. 2002a; Koblmülleret al. 2004; Duftner et al. 2005; Koblmüller et al. 2008).While the basal branches within the H-lineage receivehigher support values based on the concatenation model(Supplementary Fig. S4 available on Dryad), these maybe misleading, as concatenation has been shown tooverestimate branch support and potentially produceincorrect species-tree estimates (Kubatko and Degnan2007; Ogilvie et al. 2016; Linkem et al. 2016). In contrast,using the multispecies coalescent model with only tensof loci may produce more accurate species trees thanconcatenation with far larger data sets (Ogilvie et al.2016).
The drawback of our strategy to produce an“introgression-free” species-tree estimate is that itcomes on the expense of the exclusion of certaintaxa (the putative recipients of introgression). Theresulting species tree is therefore robust, yet incomplete.Nevertheless, there are ways to interpret the placementof the taxa that were excluded from species-tree analysesdue to signals of introgression. For example, underthe assumption that the true phylogenetic signal isstronger than the signal resulting from introgression,the frequencies of the attachment of a lineage to a givenbranch in the individual gene trees can be considered asdemocratic vote for its phylogenetic position (indicatedby dots on branches in Fig. 2). We exemplify this for thethree taxa with the strongest signals of introgression.Based upon the inspection of individual gene trees,B. microlepis is suggested to be a sister lineage ofT. nigrifrons (as e.g., Salzburger et al. 2002a; Clabaut et al.2005; Meyer et al. 2015), or, alternatively, more closelyrelated to the common ancestor the Lamprologini andthe H-lineage (as in Weiss et al. 2015). Perissodus microlepisshows affinities to the ancestor of Ectodini (see, e.g.,Kocher et al. 1995; Clabaut et al. 2005) or is placed in aclade together with Limnochromini and Cyphotilapiini(as observed in Salzburger et al. 2002a; Friedman et al.2013). Finally, the riverine haplochromine P. philander ismost often placed near the base of the Haplochrominiclade (see, e.g., Salzburger et al. 2002a; Clabaut et al. 2005;Santos et al. 2014; Meyer et al. 2015), but also appearsfrequently as sister lineage to the Ectodini, which hasnot been observed previously.
Our strategy to separate phylogenetic signals ofspecies divergences from those of incomplete lineagesorting and introgression assumes that the latter twoprocesses are the only sources of gene-tree discordance.However, it has been shown that with increasing sizeof the data set used for phylogenetic inference, thedegree of systematic errors due to violations of the modelof sequence evolution, can also increase and producemisleading phylogenetic signal (Rodríguez-Ezpeletaet al. 2007). These model violations may arise, forexample, from changes in site-specific substitution ratesover time (heterotachy; Pagel and Meade 2008), from
among-species heterogeneity in sequence composition(Rodríguez-Ezpeleta et al. 2007), or from GC-contentvariation among taxa (Jarvis et al. 2014). If and to whatdegree these model violations affect our data set, withpossible consequences for phylogenetic inference, hasnot been tested explicitly. However, it is likely thatmisleading phylogenetic signals due to these modelviolations are stronger on longer timescales (as in Jarviset al. 2014), suggesting that systematic errors may havelittle effect on the inference of the relatively recentdiversification of Lake Tanganyika cichlids.
A number of alternative approaches, which havenot been explored here, are available for species-tree inference while taking hybridization into account.A phylogenetic model similar to that used in the“InferNetwork_ML” method of PhyloNet (Yu et al. 2014)is also implemented in the software PhyloNetworks(Solís-Lemus and Ané 2016), as a method named“SNaQ” (Species Networks applying Quartets). Incontrast to “InferNetwork_ML”, however, “SNaQ” doesnot calculate the full likelihood of this model, but apseudolikelihood after decomposition of the phylogenyinto four-taxon subsets, which allows faster calculationsand therefore the application to larger data sets, atthe cost of comparability of different networks (Solís-Lemus and Ané 2016). The option to infer networks basedon their pseudolikelihood (calculated from three-taxonsubsets) instead of their full likelihood has also beenadded to the software PhyloNet, as a method named“InferNetwork_MPL” (Yu and Nakhleh 2015). A modelfor the joint inference of incomplete lineage sorting andhybridization is also available in the software STEM-hy (Kubatko 2009). However, in this comparatively earlyimplementation, the species topology is assumed to beknown and the hybridization event is considered to leadto hybrid speciation (Mallet 2007), which apparentlyis far less common than introgressive hybridization, inwhich genetic material is exchanged between lineageswithout the production of a hybrid species (Schumeret al. 2014).
Application of the Multispecies Coalescent Model ImprovesAge Estimates for East African Radiations
The timeline of diversification estimated with themultispecies coalescent model was consistently youngerthan that obtained with concatenated sequences forall markers. This observation is in agreement withthe differences between the models employed bythe two approaches. While the concatenation modelimplicitly assumes that all gene trees are identical toeach other as well as to the species tree (Edwardset al. 2016), the multispecies coalescent model accountsfor genetic divergence that predates speciation. As aresult, concatenation is likely to result in overestimatedspeciation times, and the degree of this overestimationdepends on the ancestral effective population sizes(McCormack et al. 2011). With large population sizes,as are commonly found in adaptive radiations of fishes
Downloaded from https://academic.oup.com/sysbio/article-abstract/66/4/531/2670093by WWZ Bibliothek (Oeffentliche Bibliothek der Universität Basel) useron 02 February 2018
544 SYSTEMATIC BIOLOGY VOL. 66
(Won et al. 2005), the difference in age estimates obtainedwith the two approaches can be on the order of millionsof years (Colombo et al. 2015; Ogilvie et al. 2016). As allprevious fossil-based phylogenetic time calibrations ofthe East African cichlid diversification were based on theconcatenation model (e.g., Genner et al. 2007; Schwarzeret al. 2009; Friedman et al. 2013; McMahan et al. 2013),our timeline estimated with the multispecies coalescentmodel is likely to provide more realistic divergence datesfor cichlid radiations in lakes Tanganyika, Malawi, andVictoria.
Lake Tanganyika radiation.—Even though seismicreflection data in combination with extrapolationsof Pleistocene sedimentation rates suggest that LakeTanganyika originated around 12–9 Ma (Cohen et al.1993, 1997), previous concatenation-based age estimatesfor tribes endemic to this lake are far older. Regardlessof whether an assumed Gondwanan vicariance or thecichlid fossil record were used for divergence-timeanalyses, estimates of Genner et al. (2007) imply thatat least 10 cichlid lineages colonized Lake Tanganyikaindependently but left no traces of their existence outsideof the lake. Using calibrations based on the phylogeny ofAzuma et al. (2008) and the fossil Oreochromis †lorenzoi(Carnevale et al. 2003), Schwarzer et al. (2009) estimatedthe MRCA of Lamprologini and the H-lineage between20.4 and 10.6 Ma, with a mean age estimate of 15.4 Ma.This estimate is comparable to our concatenation-basedage estimate for the same node (12.2 Ma), but is likely topredate the origin of Lake Tanganyika. In contrast, ouranalyses with the multispecies coalescent model, timecalibrated according to McMahan et al. (2013), suggestthat Lamprologini and the H-lineage diverged around9.2 Ma, which could thus represent the first divergenceevent within Lake Tanganyika (Fig. 3). This timelineis, therefore, consistent with a colonization history ofLake Tanganyika that requires two to four colonizationevents from lineages that subsequently went extinctoutside the lake (Trematocarini, the common ancestorof Lamprologini and the H-lineage, and possibly theancestors of Boulengerochromini and Bathybatini)(Salzburger et al. 2002a). According to estimates basedon the multispecies coalescent model in combinationwith time constraints derived from Friedman et al.(2013), even the divergence of Trematocarini (andthus possibly also those of Boulengerochromini andBathybatini) could have occurred within the lake(around 8.7 Ma; Supplementary Fig. S3 available onDryad), which would allow the possibility of a singleaustrotilapiine colonization of Lake Tanganyika.
Within the H-lineage, we identified a sequence ofrapid splitting events with the multispecies coalescentmodel that began with the separation of Ectodiniaround 7.4 Ma (based on time constraints derived fromMcMahan et al. 2013) and ended with the divergenceof Eretmodini and Haplochromini less than 400,000years later. In contrast, estimates for these divergenceevents are stretched out over almost 2 myr when inferred
with the concatenation model, which is indicative ofa high degree of incomplete lineage sorting and thusdiscordance of individual gene trees. Our coalescent-based age estimates for these lineages coincide withthe topographic depression of the northern LakeTanganyika basin (8–7 Ma; Cohen et al. 1993; Lezzaret al. 1996), suggesting that the main diversification ofLake Tanganyika tribes could have been triggered byecological opportunity (see, e.g., Wagner et al. 2012) inthis newly formed lake basin.
Lake Malawi radiation.—Lake Malawi has existedperennially for 4.5–4.0 myr (Ring and Betzler 1995),which is consistent with most phylogenetic age estimatesfor its largely endemic cichlid radiation (Genner et al.2007; Schwarzer et al. 2009; Friedman et al. 2013; Lohet al. 2013; McMahan et al. 2013). However, throughoutits history, Lake Malawi has experienced severe lake-level fluctuations with lowstands that had considerableimpact on its cichlid fauna due to habitat reduction andeutrophication (Salzburger et al. 2014; Lyons et al. 2015).Our age estimate based on the multispecies coalescentmodel and time constraints derived from McMahanet al. (2013) (749 ka) nearly coincides with a shiftin hydroclimate regimes during the Mid-PleistoceneTransition (∼800 ka) that led to a wetter climate andless frequent lake-level fluctuations (Lyons et al. 2015).These changes could have promoted diversification ofLake Malawi cichlid fishes due to increased ecologicalopportunity and habitat stability.
Lake Victoria radiation.—While the Lake Victoria basinoriginated around 400 ka (Johnson et al. 1996; Salzburgeret al. 2014), the radiation of the endemic Lake Victoriasuperflock (sensu Verheyen et al. 2003, excluding LakeKivu species) has long been thought to be youngerthan 200 ka, based on mitochondrial mutation rateestimates and palaeogeographic considerations (Meyeret al. 1990; Johnson et al. 1996; Verheyen et al. 2003).However, phylogenetic time calibrations have so farfailed to reproduce these young age estimates (Elmeret al. 2009; Wagner et al. 2012; Rabosky et al. 2013).Though our timeline based on concatenation suggestsan early origin of the Lake Victoria superflock around913 ka, mean age estimates based on the multispeciescoalescent model support a much younger origin (191–160 ka; Fig. 3; Supplementary Fig. 3 available on Dryad)in agreement with previous studies (Meyer et al. 1990;Johnson et al. 1996; Verheyen et al. 2003). In line withthis observation, MCC gene trees of Lake Victoriacichlids coalesce much earlier (6.1–0.7 Ma) than theirMCC species tree in analyses with the multispeciescoalescent model, which indicates that most of thegenetic variation present in cichlids of the Lake Victoriasuperflock pre-existed in the common ancestor. Ourestimate of the effective population size of this ancestor(Ne =143,000) is small compared to those of otherinternal branches but nevertheless suggests a rather largefounding population of the Lake Victoria superflock.
Downloaded from https://academic.oup.com/sysbio/article-abstract/66/4/531/2670093by WWZ Bibliothek (Oeffentliche Bibliothek der Universität Basel) useron 02 February 2018
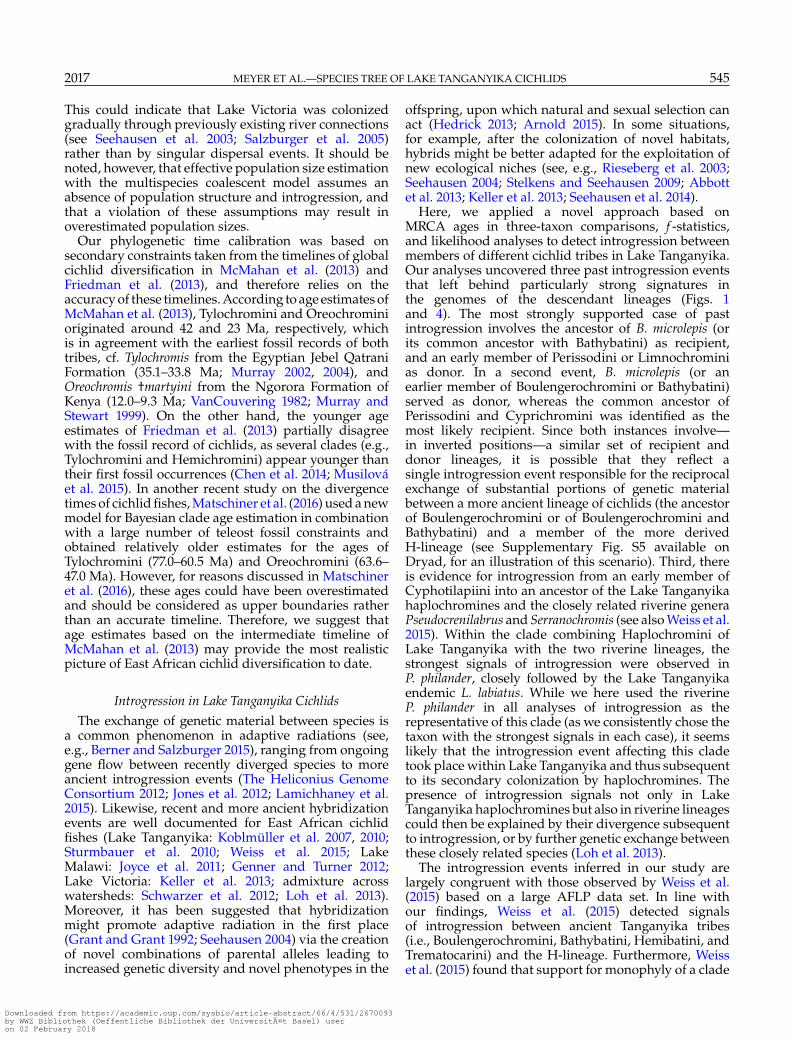
2017 MEYER ET AL.—SPECIES TREE OF LAKE TANGANYIKA CICHLIDS 545
This could indicate that Lake Victoria was colonizedgradually through previously existing river connections(see Seehausen et al. 2003; Salzburger et al. 2005)rather than by singular dispersal events. It should benoted, however, that effective population size estimationwith the multispecies coalescent model assumes anabsence of population structure and introgression, andthat a violation of these assumptions may result inoverestimated population sizes.
Our phylogenetic time calibration was based onsecondary constraints taken from the timelines of globalcichlid diversification in McMahan et al. (2013) andFriedman et al. (2013), and therefore relies on theaccuracy of these timelines. According to age estimates ofMcMahan et al. (2013), Tylochromini and Oreochrominioriginated around 42 and 23 Ma, respectively, whichis in agreement with the earliest fossil records of bothtribes, cf. Tylochromis from the Egyptian Jebel QatraniFormation (35.1–33.8 Ma; Murray 2002, 2004), andOreochromis †martyini from the Ngorora Formation ofKenya (12.0–9.3 Ma; VanCouvering 1982; Murray andStewart 1999). On the other hand, the younger ageestimates of Friedman et al. (2013) partially disagreewith the fossil record of cichlids, as several clades (e.g.,Tylochromini and Hemichromini) appear younger thantheir first fossil occurrences (Chen et al. 2014; Musilováet al. 2015). In another recent study on the divergencetimes of cichlid fishes, Matschiner et al. (2016) used a newmodel for Bayesian clade age estimation in combinationwith a large number of teleost fossil constraints andobtained relatively older estimates for the ages ofTylochromini (77.0–60.5 Ma) and Oreochromini (63.6–47.0 Ma). However, for reasons discussed in Matschineret al. (2016), these ages could have been overestimatedand should be considered as upper boundaries ratherthan an accurate timeline. Therefore, we suggest thatage estimates based on the intermediate timeline ofMcMahan et al. (2013) may provide the most realisticpicture of East African cichlid diversification to date.
Introgression in Lake Tanganyika CichlidsThe exchange of genetic material between species is
a common phenomenon in adaptive radiations (see,e.g., Berner and Salzburger 2015), ranging from ongoinggene flow between recently diverged species to moreancient introgression events (The Heliconius GenomeConsortium 2012; Jones et al. 2012; Lamichhaney et al.2015). Likewise, recent and more ancient hybridizationevents are well documented for East African cichlidfishes (Lake Tanganyika: Koblmüller et al. 2007, 2010;Sturmbauer et al. 2010; Weiss et al. 2015; LakeMalawi: Joyce et al. 2011; Genner and Turner 2012;Lake Victoria: Keller et al. 2013; admixture acrosswatersheds: Schwarzer et al. 2012; Loh et al. 2013).Moreover, it has been suggested that hybridizationmight promote adaptive radiation in the first place(Grant and Grant 1992; Seehausen 2004) via the creationof novel combinations of parental alleles leading toincreased genetic diversity and novel phenotypes in the
offspring, upon which natural and sexual selection canact (Hedrick 2013; Arnold 2015). In some situations,for example, after the colonization of novel habitats,hybrids might be better adapted for the exploitation ofnew ecological niches (see, e.g., Rieseberg et al. 2003;Seehausen 2004; Stelkens and Seehausen 2009; Abbottet al. 2013; Keller et al. 2013; Seehausen et al. 2014).
Here, we applied a novel approach based onMRCA ages in three-taxon comparisons, f -statistics,and likelihood analyses to detect introgression betweenmembers of different cichlid tribes in Lake Tanganyika.Our analyses uncovered three past introgression eventsthat left behind particularly strong signatures inthe genomes of the descendant lineages (Figs. 1and 4). The most strongly supported case of pastintrogression involves the ancestor of B. microlepis (orits common ancestor with Bathybatini) as recipient,and an early member of Perissodini or Limnochrominias donor. In a second event, B. microlepis (or anearlier member of Boulengerochromini or Bathybatini)served as donor, whereas the common ancestor ofPerissodini and Cyprichromini was identified as themost likely recipient. Since both instances involve—in inverted positions—a similar set of recipient anddonor lineages, it is possible that they reflect asingle introgression event responsible for the reciprocalexchange of substantial portions of genetic materialbetween a more ancient lineage of cichlids (the ancestorof Boulengerochromini or of Boulengerochromini andBathybatini) and a member of the more derivedH-lineage (see Supplementary Fig. S5 available onDryad, for an illustration of this scenario). Third, thereis evidence for introgression from an early member ofCyphotilapiini into an ancestor of the Lake Tanganyikahaplochromines and the closely related riverine generaPseudocrenilabrus and Serranochromis (see also Weiss et al.2015). Within the clade combining Haplochromini ofLake Tanganyika with the two riverine lineages, thestrongest signals of introgression were observed inP. philander, closely followed by the Lake Tanganyikaendemic L. labiatus. While we here used the riverineP. philander in all analyses of introgression as therepresentative of this clade (as we consistently chose thetaxon with the strongest signals in each case), it seemslikely that the introgression event affecting this cladetook place within Lake Tanganyika and thus subsequentto its secondary colonization by haplochromines. Thepresence of introgression signals not only in LakeTanganyika haplochromines but also in riverine lineagescould then be explained by their divergence subsequentto introgression, or by further genetic exchange betweenthese closely related species (Loh et al. 2013).
The introgression events inferred in our study arelargely congruent with those observed by Weiss et al.(2015) based on a large AFLP data set. In line withour findings, Weiss et al. (2015) detected signalsof introgression between ancient Tanganyika tribes(i.e., Boulengerochromini, Bathybatini, Hemibatini, andTrematocarini) and the H-lineage. Furthermore, Weisset al. (2015) found that support for monophyly of a clade
Downloaded from https://academic.oup.com/sysbio/article-abstract/66/4/531/2670093by WWZ Bibliothek (Oeffentliche Bibliothek der Universität Basel) useron 02 February 2018
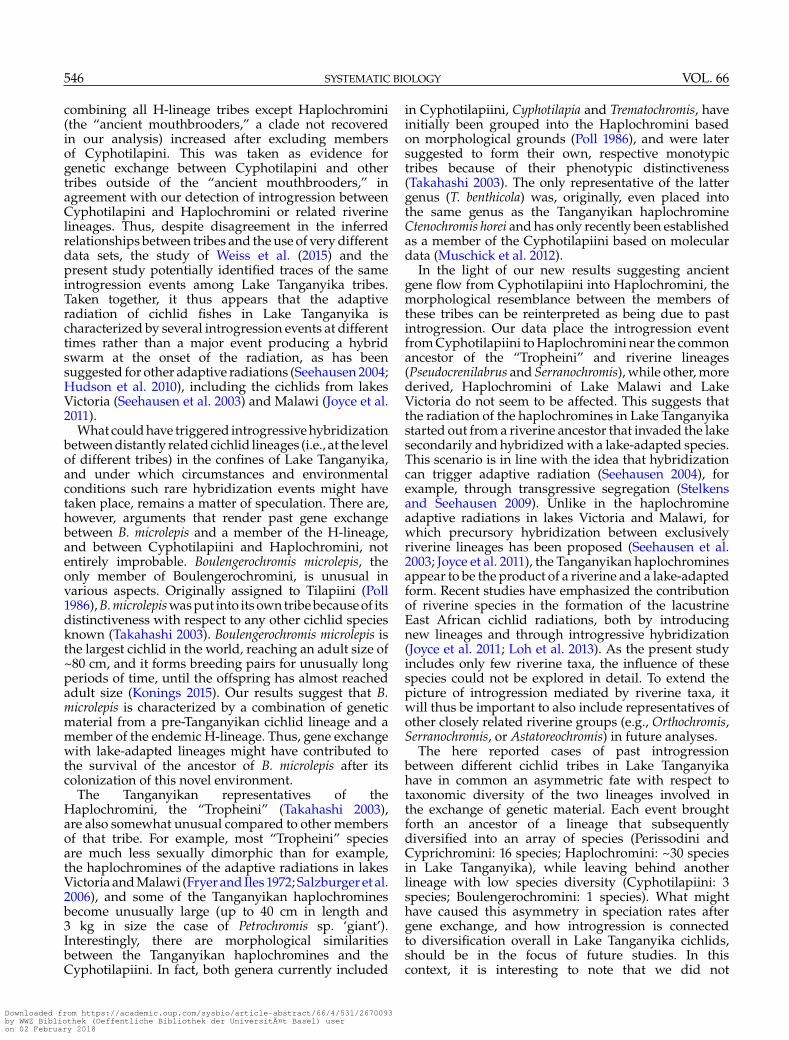
546 SYSTEMATIC BIOLOGY VOL. 66
combining all H-lineage tribes except Haplochromini(the “ancient mouthbrooders,” a clade not recoveredin our analysis) increased after excluding membersof Cyphotilapini. This was taken as evidence forgenetic exchange between Cyphotilapini and othertribes outside of the “ancient mouthbrooders,” inagreement with our detection of introgression betweenCyphotilapini and Haplochromini or related riverinelineages. Thus, despite disagreement in the inferredrelationships between tribes and the use of very differentdata sets, the study of Weiss et al. (2015) and thepresent study potentially identified traces of the sameintrogression events among Lake Tanganyika tribes.Taken together, it thus appears that the adaptiveradiation of cichlid fishes in Lake Tanganyika ischaracterized by several introgression events at differenttimes rather than a major event producing a hybridswarm at the onset of the radiation, as has beensuggested for other adaptive radiations (Seehausen 2004;Hudson et al. 2010), including the cichlids from lakesVictoria (Seehausen et al. 2003) and Malawi (Joyce et al.2011).
What could have triggered introgressive hybridizationbetween distantly related cichlid lineages (i.e., at the levelof different tribes) in the confines of Lake Tanganyika,and under which circumstances and environmentalconditions such rare hybridization events might havetaken place, remains a matter of speculation. There are,however, arguments that render past gene exchangebetween B. microlepis and a member of the H-lineage,and between Cyphotilapiini and Haplochromini, notentirely improbable. Boulengerochromis microlepis, theonly member of Boulengerochromini, is unusual invarious aspects. Originally assigned to Tilapiini (Poll1986), B. microlepis was put into its own tribe because of itsdistinctiveness with respect to any other cichlid speciesknown (Takahashi 2003). Boulengerochromis microlepis isthe largest cichlid in the world, reaching an adult size of~80 cm, and it forms breeding pairs for unusually longperiods of time, until the offspring has almost reachedadult size (Konings 2015). Our results suggest that B.microlepis is characterized by a combination of geneticmaterial from a pre-Tanganyikan cichlid lineage and amember of the endemic H-lineage. Thus, gene exchangewith lake-adapted lineages might have contributed tothe survival of the ancestor of B. microlepis after itscolonization of this novel environment.
The Tanganyikan representatives of theHaplochromini, the “Tropheini” (Takahashi 2003),are also somewhat unusual compared to other membersof that tribe. For example, most “Tropheini” speciesare much less sexually dimorphic than for example,the haplochromines of the adaptive radiations in lakesVictoria and Malawi (Fryer and Iles 1972; Salzburger et al.2006), and some of the Tanganyikan haplochrominesbecome unusually large (up to 40 cm in length and3 kg in size the case of Petrochromis sp. ‘giant’).Interestingly, there are morphological similaritiesbetween the Tanganyikan haplochromines and theCyphotilapiini. In fact, both genera currently included
in Cyphotilapiini, Cyphotilapia and Trematochromis, haveinitially been grouped into the Haplochromini basedon morphological grounds (Poll 1986), and were latersuggested to form their own, respective monotypictribes because of their phenotypic distinctiveness(Takahashi 2003). The only representative of the lattergenus (T. benthicola) was, originally, even placed intothe same genus as the Tanganyikan haplochromineCtenochromis horei and has only recently been establishedas a member of the Cyphotilapiini based on moleculardata (Muschick et al. 2012).
In the light of our new results suggesting ancientgene flow from Cyphotilapiini into Haplochromini, themorphological resemblance between the members ofthese tribes can be reinterpreted as being due to pastintrogression. Our data place the introgression eventfrom Cyphotilapiini to Haplochromini near the commonancestor of the “Tropheini” and riverine lineages(Pseudocrenilabrus and Serranochromis), while other, morederived, Haplochromini of Lake Malawi and LakeVictoria do not seem to be affected. This suggests thatthe radiation of the haplochromines in Lake Tanganyikastarted out from a riverine ancestor that invaded the lakesecondarily and hybridized with a lake-adapted species.This scenario is in line with the idea that hybridizationcan trigger adaptive radiation (Seehausen 2004), forexample, through transgressive segregation (Stelkensand Seehausen 2009). Unlike in the haplochromineadaptive radiations in lakes Victoria and Malawi, forwhich precursory hybridization between exclusivelyriverine lineages has been proposed (Seehausen et al.2003; Joyce et al. 2011), the Tanganyikan haplochrominesappear to be the product of a riverine and a lake-adaptedform. Recent studies have emphasized the contributionof riverine species in the formation of the lacustrineEast African cichlid radiations, both by introducingnew lineages and through introgressive hybridization(Joyce et al. 2011; Loh et al. 2013). As the present studyincludes only few riverine taxa, the influence of thesespecies could not be explored in detail. To extend thepicture of introgression mediated by riverine taxa, itwill thus be important to also include representatives ofother closely related riverine groups (e.g., Orthochromis,Serranochromis, or Astatoreochromis) in future analyses.
The here reported cases of past introgressionbetween different cichlid tribes in Lake Tanganyikahave in common an asymmetric fate with respect totaxonomic diversity of the two lineages involved inthe exchange of genetic material. Each event broughtforth an ancestor of a lineage that subsequentlydiversified into an array of species (Perissodini andCyprichromini: 16 species; Haplochromini: ~30 speciesin Lake Tanganyika), while leaving behind anotherlineage with low species diversity (Cyphotilapiini: 3species; Boulengerochromini: 1 species). What mighthave caused this asymmetry in speciation rates aftergene exchange, and how introgression is connectedto diversification overall in Lake Tanganyika cichlids,should be in the focus of future studies. In thiscontext, it is interesting to note that we did not
Downloaded from https://academic.oup.com/sysbio/article-abstract/66/4/531/2670093by WWZ Bibliothek (Oeffentliche Bibliothek der Universität Basel) useron 02 February 2018
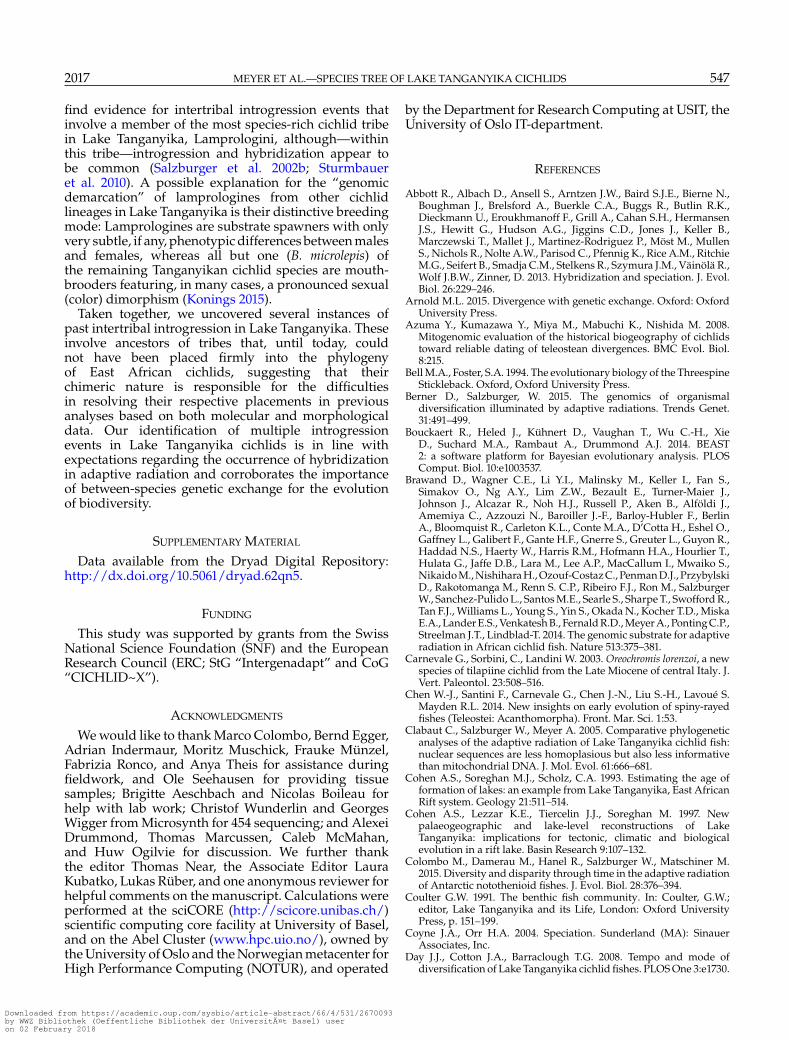
2017 MEYER ET AL.—SPECIES TREE OF LAKE TANGANYIKA CICHLIDS 547
find evidence for intertribal introgression events thatinvolve a member of the most species-rich cichlid tribein Lake Tanganyika, Lamprologini, although—withinthis tribe—introgression and hybridization appear tobe common (Salzburger et al. 2002b; Sturmbaueret al. 2010). A possible explanation for the “genomicdemarcation” of lamprologines from other cichlidlineages in Lake Tanganyika is their distinctive breedingmode: Lamprologines are substrate spawners with onlyvery subtle, if any, phenotypic differences between malesand females, whereas all but one (B. microlepis) ofthe remaining Tanganyikan cichlid species are mouth-brooders featuring, in many cases, a pronounced sexual(color) dimorphism (Konings 2015).
Taken together, we uncovered several instances ofpast intertribal introgression in Lake Tanganyika. Theseinvolve ancestors of tribes that, until today, couldnot have been placed firmly into the phylogenyof East African cichlids, suggesting that theirchimeric nature is responsible for the difficultiesin resolving their respective placements in previousanalyses based on both molecular and morphologicaldata. Our identification of multiple introgressionevents in Lake Tanganyika cichlids is in line withexpectations regarding the occurrence of hybridizationin adaptive radiation and corroborates the importanceof between-species genetic exchange for the evolutionof biodiversity.
SUPPLEMENTARY MATERIAL
Data available from the Dryad Digital Repository:http://dx.doi.org/10.5061/dryad.62qn5.
FUNDING
This study was supported by grants from the SwissNational Science Foundation (SNF) and the EuropeanResearch Council (ERC; StG “Intergenadapt” and CoG“CICHLID~X”).
ACKNOWLEDGMENTS
We would like to thank Marco Colombo, Bernd Egger,Adrian Indermaur, Moritz Muschick, Frauke Münzel,Fabrizia Ronco, and Anya Theis for assistance duringfieldwork, and Ole Seehausen for providing tissuesamples; Brigitte Aeschbach and Nicolas Boileau forhelp with lab work; Christof Wunderlin and GeorgesWigger from Microsynth for 454 sequencing; and AlexeiDrummond, Thomas Marcussen, Caleb McMahan,and Huw Ogilvie for discussion. We further thankthe editor Thomas Near, the Associate Editor LauraKubatko, Lukas Rüber, and one anonymous reviewer forhelpful comments on the manuscript. Calculations wereperformed at the sciCORE (http://scicore.unibas.ch/)scientific computing core facility at University of Basel,and on the Abel Cluster (www.hpc.uio.no/), owned bythe University of Oslo and the Norwegian metacenter forHigh Performance Computing (NOTUR), and operated
by the Department for Research Computing at USIT, theUniversity of Oslo IT-department.
REFERENCES
Abbott R., Albach D., Ansell S., Arntzen J.W., Baird S.J.E., Bierne N.,Boughman J., Brelsford A., Buerkle C.A., Buggs R., Butlin R.K.,Dieckmann U., Eroukhmanoff F., Grill A., Cahan S.H., HermansenJ.S., Hewitt G., Hudson A.G., Jiggins C.D., Jones J., Keller B.,Marczewski T., Mallet J., Martinez-Rodriguez P., Möst M., MullenS., Nichols R., Nolte A.W., Parisod C., Pfennig K., Rice A.M., RitchieM.G., Seifert B., Smadja C.M., Stelkens R., Szymura J.M., Väinölä R.,Wolf J.B.W., Zinner, D. 2013. Hybridization and speciation. J. Evol.Biol. 26:229–246.
Arnold M.L. 2015. Divergence with genetic exchange. Oxford: OxfordUniversity Press.
Azuma Y., Kumazawa Y., Miya M., Mabuchi K., Nishida M. 2008.Mitogenomic evaluation of the historical biogeography of cichlidstoward reliable dating of teleostean divergences. BMC Evol. Biol.8:215.
Bell M.A., Foster, S.A. 1994. The evolutionary biology of the ThreespineStickleback. Oxford, Oxford University Press.
Berner D., Salzburger, W. 2015. The genomics of organismaldiversification illuminated by adaptive radiations. Trends Genet.31:491–499.
Bouckaert R., Heled J., Kühnert D., Vaughan T., Wu C.-H., XieD., Suchard M.A., Rambaut A., Drummond A.J. 2014. BEAST2: a software platform for Bayesian evolutionary analysis. PLOSComput. Biol. 10:e1003537.
Brawand D., Wagner C.E., Li Y.I., Malinsky M., Keller I., Fan S.,Simakov O., Ng A.Y., Lim Z.W., Bezault E., Turner-Maier J.,Johnson J., Alcazar R., Noh H.J., Russell P., Aken B., Alföldi J.,Amemiya C., Azzouzi N., Baroiller J.-F., Barloy-Hubler F., BerlinA., Bloomquist R., Carleton K.L., Conte M.A., D’Cotta H., Eshel O.,Gaffney L., Galibert F., Gante H.F., Gnerre S., Greuter L., Guyon R.,Haddad N.S., Haerty W., Harris R.M., Hofmann H.A., Hourlier T.,Hulata G., Jaffe D.B., Lara M., Lee A.P., MacCallum I., Mwaiko S.,Nikaido M., Nishihara H., Ozouf-Costaz C., Penman D.J., PrzybylskiD., Rakotomanga M., Renn S. C.P., Ribeiro F.J., Ron M., SalzburgerW., Sanchez-Pulido L., Santos M.E., Searle S., Sharpe T., Swofford R.,Tan F.J., Williams L., Young S., Yin S., Okada N., Kocher T.D., MiskaE.A., Lander E.S., Venkatesh B., Fernald R.D., Meyer A., Ponting C.P.,Streelman J.T., Lindblad-T. 2014. The genomic substrate for adaptiveradiation in African cichlid fish. Nature 513:375–381.
Carnevale G., Sorbini, C., Landini W. 2003. Oreochromis lorenzoi, a newspecies of tilapiine cichlid from the Late Miocene of central Italy. J.Vert. Paleontol. 23:508–516.
Chen W.-J., Santini F., Carnevale G., Chen J.-N., Liu S.-H., Lavoué S.Mayden R.L. 2014. New insights on early evolution of spiny-rayedfishes (Teleostei: Acanthomorpha). Front. Mar. Sci. 1:53.
Clabaut C., Salzburger W., Meyer A. 2005. Comparative phylogeneticanalyses of the adaptive radiation of Lake Tanganyika cichlid fish:nuclear sequences are less homoplasious but also less informativethan mitochondrial DNA. J. Mol. Evol. 61:666–681.
Cohen A.S., Soreghan M.J., Scholz, C.A. 1993. Estimating the age offormation of lakes: an example from Lake Tanganyika, East AfricanRift system. Geology 21:511–514.
Cohen A.S., Lezzar K.E., Tiercelin J.J., Soreghan M. 1997. Newpalaeogeographic and lake-level reconstructions of LakeTanganyika: implications for tectonic, climatic and biologicalevolution in a rift lake. Basin Research 9:107–132.
Colombo M., Damerau M., Hanel R., Salzburger W., Matschiner M.2015. Diversity and disparity through time in the adaptive radiationof Antarctic notothenioid fishes. J. Evol. Biol. 28:376–394.
Coulter G.W. 1991. The benthic fish community. In: Coulter, G.W.;editor, Lake Tanganyika and its Life, London: Oxford UniversityPress, p. 151–199.
Coyne J.A., Orr H.A. 2004. Speciation. Sunderland (MA): SinauerAssociates, Inc.
Day J.J., Cotton J.A., Barraclough T.G. 2008. Tempo and mode ofdiversification of Lake Tanganyika cichlid fishes. PLOS One 3:e1730.
Downloaded from https://academic.oup.com/sysbio/article-abstract/66/4/531/2670093by WWZ Bibliothek (Oeffentliche Bibliothek der Universität Basel) useron 02 February 2018
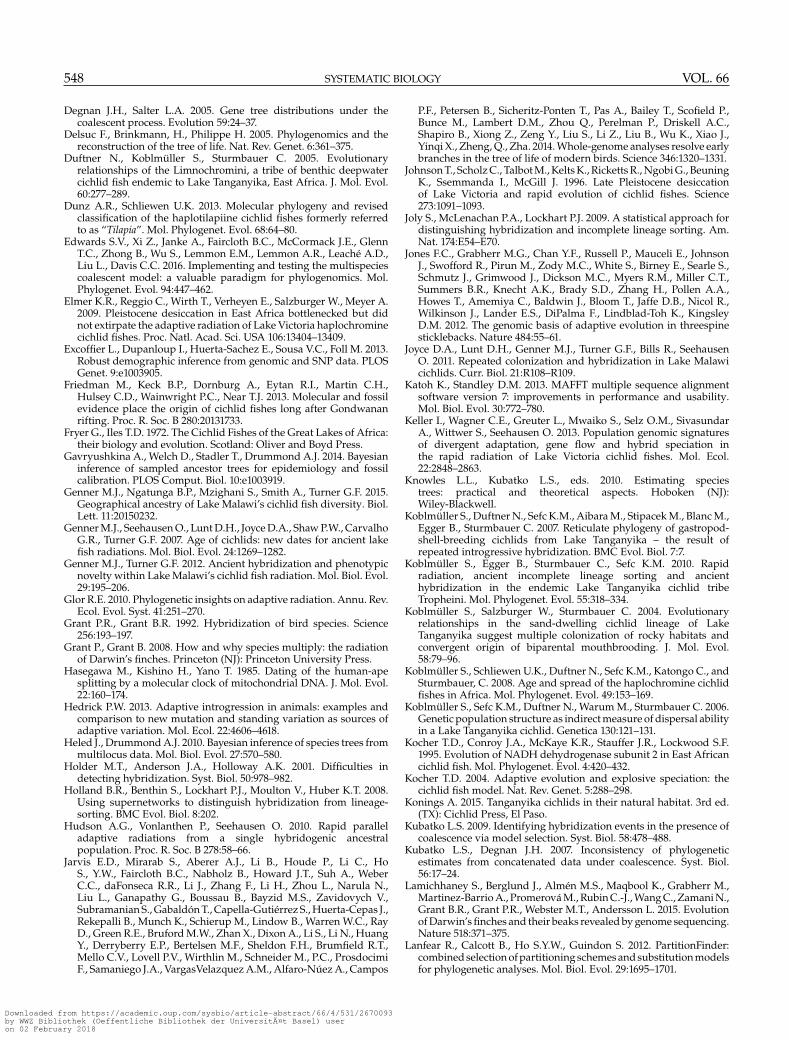
548 SYSTEMATIC BIOLOGY VOL. 66
Degnan J.H., Salter L.A. 2005. Gene tree distributions under thecoalescent process. Evolution 59:24–37.
Delsuc F., Brinkmann, H., Philippe H. 2005. Phylogenomics and thereconstruction of the tree of life. Nat. Rev. Genet. 6:361–375.
Duftner N., Koblmüller S., Sturmbauer C. 2005. Evolutionaryrelationships of the Limnochromini, a tribe of benthic deepwatercichlid fish endemic to Lake Tanganyika, East Africa. J. Mol. Evol.60:277–289.
Dunz A.R., Schliewen U.K. 2013. Molecular phylogeny and revisedclassification of the haplotilapiine cichlid fishes formerly referredto as “Tilapia”. Mol. Phylogenet. Evol. 68:64–80.
Edwards S.V., Xi Z., Janke A., Faircloth B.C., McCormack J.E., GlennT.C., Zhong B., Wu S., Lemmon E.M., Lemmon A.R., Leaché A.D.,Liu L., Davis C.C. 2016. Implementing and testing the multispeciescoalescent model: a valuable paradigm for phylogenomics. Mol.Phylogenet. Evol. 94:447–462.
Elmer K.R., Reggio C., Wirth T., Verheyen E., Salzburger W., Meyer A.2009. Pleistocene desiccation in East Africa bottlenecked but didnot extirpate the adaptive radiation of Lake Victoria haplochrominecichlid fishes. Proc. Natl. Acad. Sci. USA 106:13404–13409.
Excoffier L., Dupanloup I., Huerta-Sachez E., Sousa V.C., Foll M. 2013.Robust demographic inference from genomic and SNP data. PLOSGenet. 9:e1003905.
Friedman M., Keck B.P., Dornburg A., Eytan R.I., Martin C.H.,Hulsey C.D., Wainwright P.C., Near T.J. 2013. Molecular and fossilevidence place the origin of cichlid fishes long after Gondwananrifting. Proc. R. Soc. B 280:20131733.
Fryer G., Iles T.D. 1972. The Cichlid Fishes of the Great Lakes of Africa:their biology and evolution. Scotland: Oliver and Boyd Press.
Gavryushkina A., Welch D., Stadler T., Drummond A.J. 2014. Bayesianinference of sampled ancestor trees for epidemiology and fossilcalibration. PLOS Comput. Biol. 10:e1003919.
Genner M.J., Ngatunga B.P., Mzighani S., Smith A., Turner G.F. 2015.Geographical ancestry of Lake Malawi’s cichlid fish diversity. Biol.Lett. 11:20150232.
Genner M.J., Seehausen O., Lunt D.H., Joyce D.A., Shaw P.W., CarvalhoG.R., Turner G.F. 2007. Age of cichlids: new dates for ancient lakefish radiations. Mol. Biol. Evol. 24:1269–1282.
Genner M.J., Turner G.F. 2012. Ancient hybridization and phenotypicnovelty within Lake Malawi’s cichlid fish radiation. Mol. Biol. Evol.29:195–206.
Glor R.E. 2010. Phylogenetic insights on adaptive radiation. Annu. Rev.Ecol. Evol. Syst. 41:251–270.
Grant P.R., Grant B.R. 1992. Hybridization of bird species. Science256:193–197.
Grant P., Grant B. 2008. How and why species multiply: the radiationof Darwin’s finches. Princeton (NJ): Princeton University Press.
Hasegawa M., Kishino H., Yano T. 1985. Dating of the human-apesplitting by a molecular clock of mitochondrial DNA. J. Mol. Evol.22:160–174.
Hedrick P.W. 2013. Adaptive introgression in animals: examples andcomparison to new mutation and standing variation as sources ofadaptive variation. Mol. Ecol. 22:4606–4618.
Heled J., Drummond A.J. 2010. Bayesian inference of species trees frommultilocus data. Mol. Biol. Evol. 27:570–580.
Holder M.T., Anderson J.A., Holloway A.K. 2001. Difficulties indetecting hybridization. Syst. Biol. 50:978–982.
Holland B.R., Benthin S., Lockhart P.J., Moulton V., Huber K.T. 2008.Using supernetworks to distinguish hybridization from lineage-sorting. BMC Evol. Biol. 8:202.
Hudson A.G., Vonlanthen P., Seehausen O. 2010. Rapid paralleladaptive radiations from a single hybridogenic ancestralpopulation. Proc. R. Soc. B 278:58–66.
Jarvis E.D., Mirarab S., Aberer A.J., Li B., Houde P., Li C., HoS., Y.W., Faircloth B.C., Nabholz B., Howard J.T., Suh A., WeberC.C., daFonseca R.R., Li J., Zhang F., Li H., Zhou L., Narula N.,Liu L., Ganapathy G., Boussau B., Bayzid M.S., Zavidovych V.,Subramanian S., Gabaldón T., Capella-Gutiérrez S., Huerta-Cepas J.,Rekepalli B., Munch K., Schierup M., Lindow B., Warren W.C., RayD., Green R.E., Bruford M.W., Zhan X., Dixon A., Li S., Li N., HuangY., Derryberry E.P., Bertelsen M.F., Sheldon F.H., Brumfield R.T.,Mello C.V., Lovell P.V., Wirthlin M., Schneider M., P.C., ProsdocimiF., Samaniego J.A., VargasVelazquez A.M., Alfaro-Núez A., Campos
P.F., Petersen B., Sicheritz-Ponten T., Pas A., Bailey T., Scofield P.,Bunce M., Lambert D.M., Zhou Q., Perelman P., Driskell A.C.,Shapiro B., Xiong Z., Zeng Y., Liu S., Li Z., Liu B., Wu K., Xiao J.,Yinqi X., Zheng, Q., Zha. 2014. Whole-genome analyses resolve earlybranches in the tree of life of modern birds. Science 346:1320–1331.
Johnson T., Scholz C., Talbot M., Kelts K., Ricketts R., Ngobi G., BeuningK., Ssemmanda I., McGill J. 1996. Late Pleistocene desiccationof Lake Victoria and rapid evolution of cichlid fishes. Science273:1091–1093.
Joly S., McLenachan P.A., Lockhart P.J. 2009. A statistical approach fordistinguishing hybridization and incomplete lineage sorting. Am.Nat. 174:E54–E70.
Jones F.C., Grabherr M.G., Chan Y.F., Russell P., Mauceli E., JohnsonJ., Swofford R., Pirun M., Zody M.C., White S., Birney E., Searle S.,Schmutz J., Grimwood J., Dickson M.C., Myers R.M., Miller C.T.,Summers B.R., Knecht A.K., Brady S.D., Zhang H., Pollen A.A.,Howes T., Amemiya C., Baldwin J., Bloom T., Jaffe D.B., Nicol R.,Wilkinson J., Lander E.S., DiPalma F., Lindblad-Toh K., KingsleyD.M. 2012. The genomic basis of adaptive evolution in threespinesticklebacks. Nature 484:55–61.
Joyce D.A., Lunt D.H., Genner M.J., Turner G.F., Bills R., SeehausenO. 2011. Repeated colonization and hybridization in Lake Malawicichlids. Curr. Biol. 21:R108–R109.
Katoh K., Standley D.M. 2013. MAFFT multiple sequence alignmentsoftware version 7: improvements in performance and usability.Mol. Biol. Evol. 30:772–780.
Keller I., Wagner C.E., Greuter L., Mwaiko S., Selz O.M., SivasundarA., Wittwer S., Seehausen O. 2013. Population genomic signaturesof divergent adaptation, gene flow and hybrid speciation inthe rapid radiation of Lake Victoria cichlid fishes. Mol. Ecol.22:2848–2863.
Knowles L.L., Kubatko L.S., eds. 2010. Estimating speciestrees: practical and theoretical aspects. Hoboken (NJ):Wiley-Blackwell.
Koblmüller S., Duftner N., Sefc K.M., Aibara M., Stipacek M., Blanc M.,Egger B., Sturmbauer C. 2007. Reticulate phylogeny of gastropod-shell-breeding cichlids from Lake Tanganyika – the result ofrepeated introgressive hybridization. BMC Evol. Biol. 7:7.
Koblmüller S., Egger B., Sturmbauer C., Sefc K.M. 2010. Rapidradiation, ancient incomplete lineage sorting and ancienthybridization in the endemic Lake Tanganyika cichlid tribeTropheini. Mol. Phylogenet. Evol. 55:318–334.
Koblmüller S., Salzburger W., Sturmbauer C. 2004. Evolutionaryrelationships in the sand-dwelling cichlid lineage of LakeTanganyika suggest multiple colonization of rocky habitats andconvergent origin of biparental mouthbrooding. J. Mol. Evol.58:79–96.
Koblmüller S., Schliewen U.K., Duftner N., Sefc K.M., Katongo C., andSturmbauer, C. 2008. Age and spread of the haplochromine cichlidfishes in Africa. Mol. Phylogenet. Evol. 49:153–169.
Koblmüller S., Sefc K.M., Duftner N., Warum M., Sturmbauer C. 2006.Genetic population structure as indirect measure of dispersal abilityin a Lake Tanganyika cichlid. Genetica 130:121–131.
Kocher T.D., Conroy J.A., McKaye K.R., Stauffer J.R., Lockwood S.F.1995. Evolution of NADH dehydrogenase subunit 2 in East Africancichlid fish. Mol. Phylogenet. Evol. 4:420–432.
Kocher T.D. 2004. Adaptive evolution and explosive speciation: thecichlid fish model. Nat. Rev. Genet. 5:288–298.
Konings A. 2015. Tanganyika cichlids in their natural habitat. 3rd ed.(TX): Cichlid Press, El Paso.
Kubatko L.S. 2009. Identifying hybridization events in the presence ofcoalescence via model selection. Syst. Biol. 58:478–488.
Kubatko L.S., Degnan J.H. 2007. Inconsistency of phylogeneticestimates from concatenated data under coalescence. Syst. Biol.56:17–24.
Lamichhaney S., Berglund J., Almén M.S., Maqbool K., Grabherr M.,Martinez-Barrio A., Promerová M., Rubin C.-J., Wang C., Zamani N.,Grant B.R., Grant P.R., Webster M.T., Andersson L. 2015. Evolutionof Darwin’s finches and their beaks revealed by genome sequencing.Nature 518:371–375.
Lanfear R., Calcott B., Ho S.Y.W., Guindon S. 2012. PartitionFinder:combined selection of partitioning schemes and substitution modelsfor phylogenetic analyses. Mol. Biol. Evol. 29:1695–1701.
Downloaded from https://academic.oup.com/sysbio/article-abstract/66/4/531/2670093by WWZ Bibliothek (Oeffentliche Bibliothek der Universität Basel) useron 02 February 2018
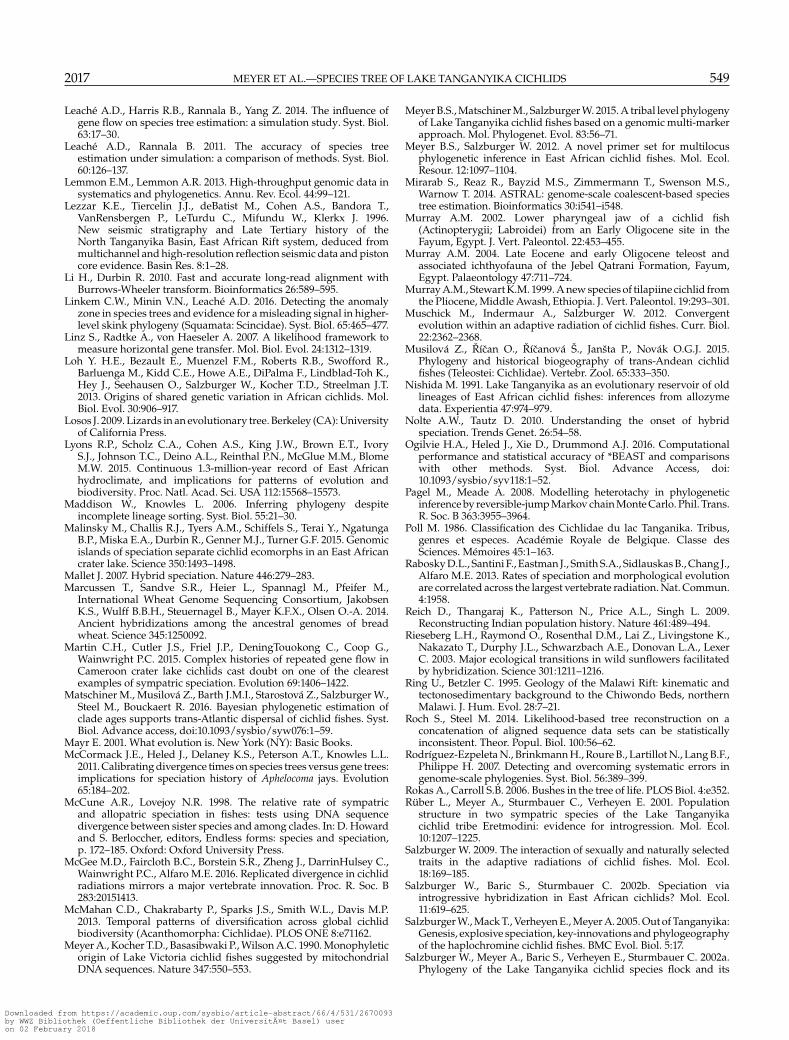
2017 MEYER ET AL.—SPECIES TREE OF LAKE TANGANYIKA CICHLIDS 549
Leaché A.D., Harris R.B., Rannala B., Yang Z. 2014. The influence ofgene flow on species tree estimation: a simulation study. Syst. Biol.63:17–30.
Leaché A.D., Rannala B. 2011. The accuracy of species treeestimation under simulation: a comparison of methods. Syst. Biol.60:126–137.
Lemmon E.M., Lemmon A.R. 2013. High-throughput genomic data insystematics and phylogenetics. Annu. Rev. Ecol. 44:99–121.
Lezzar K.E., Tiercelin J.J., deBatist M., Cohen A.S., Bandora T.,VanRensbergen P., LeTurdu C., Mifundu W., Klerkx J. 1996.New seismic stratigraphy and Late Tertiary history of theNorth Tanganyika Basin, East African Rift system, deduced frommultichannel and high-resolution reflection seismic data and pistoncore evidence. Basin Res. 8:1–28.
Li H., Durbin R. 2010. Fast and accurate long-read alignment withBurrows-Wheeler transform. Bioinformatics 26:589–595.
Linkem C.W., Minin V.N., Leaché A.D. 2016. Detecting the anomalyzone in species trees and evidence for a misleading signal in higher-level skink phylogeny (Squamata: Scincidae). Syst. Biol. 65:465–477.
Linz S., Radtke A., von Haeseler A. 2007. A likelihood framework tomeasure horizontal gene transfer. Mol. Biol. Evol. 24:1312–1319.
Loh Y. H.E., Bezault E., Muenzel F.M., Roberts R.B., Swofford R.,Barluenga M., Kidd C.E., Howe A.E., DiPalma F., Lindblad-Toh K.,Hey J., Seehausen O., Salzburger W., Kocher T.D., Streelman J.T.2013. Origins of shared genetic variation in African cichlids. Mol.Biol. Evol. 30:906–917.
Losos J. 2009. Lizards in an evolutionary tree. Berkeley (CA): Universityof California Press.
Lyons R.P., Scholz C.A., Cohen A.S., King J.W., Brown E.T., IvoryS.J., Johnson T.C., Deino A.L., Reinthal P.N., McGlue M.M., BlomeM.W. 2015. Continuous 1.3-million-year record of East Africanhydroclimate, and implications for patterns of evolution andbiodiversity. Proc. Natl. Acad. Sci. USA 112:15568–15573.
Maddison W., Knowles L. 2006. Inferring phylogeny despiteincomplete lineage sorting. Syst. Biol. 55:21–30.
Malinsky M., Challis R.J., Tyers A.M., Schiffels S., Terai Y., NgatungaB.P., Miska E.A., Durbin R., Genner M.J., Turner G.F. 2015. Genomicislands of speciation separate cichlid ecomorphs in an East Africancrater lake. Science 350:1493–1498.
Mallet J. 2007. Hybrid speciation. Nature 446:279–283.Marcussen T., Sandve S.R., Heier L., Spannagl M., Pfeifer M.,
International Wheat Genome Sequencing Consortium, JakobsenK.S., Wulff B.B.H., Steuernagel B., Mayer K.F.X., Olsen O.-A. 2014.Ancient hybridizations among the ancestral genomes of breadwheat. Science 345:1250092.
Martin C.H., Cutler J.S., Friel J.P., DeningTouokong C., Coop G.,Wainwright P.C. 2015. Complex histories of repeated gene flow inCameroon crater lake cichlids cast doubt on one of the clearestexamples of sympatric speciation. Evolution 69:1406–1422.
Matschiner M., Musilová Z., Barth J.M.I., Starostová Z., Salzburger W.,Steel M., Bouckaert R. 2016. Bayesian phylogenetic estimation ofclade ages supports trans-Atlantic dispersal of cichlid fishes. Syst.Biol. Advance access, doi:10.1093/sysbio/syw076:1–59.
Mayr E. 2001. What evolution is. New York (NY): Basic Books.McCormack J.E., Heled J., Delaney K.S., Peterson A.T., Knowles L.L.
2011. Calibrating divergence times on species trees versus gene trees:implications for speciation history of Aphelocoma jays. Evolution65:184–202.
McCune A.R., Lovejoy N.R. 1998. The relative rate of sympatricand allopatric speciation in fishes: tests using DNA sequencedivergence between sister species and among clades. In: D. Howardand S. Berloccher, editors, Endless forms: species and speciation,p. 172–185. Oxford: Oxford University Press.
McGee M.D., Faircloth B.C., Borstein S.R., Zheng J., DarrinHulsey C.,Wainwright P.C., Alfaro M.E. 2016. Replicated divergence in cichlidradiations mirrors a major vertebrate innovation. Proc. R. Soc. B283:20151413.
McMahan C.D., Chakrabarty P., Sparks J.S., Smith W.L., Davis M.P.2013. Temporal patterns of diversification across global cichlidbiodiversity (Acanthomorpha: Cichlidae). PLOS ONE 8:e71162.
Meyer A., Kocher T.D., Basasibwaki P., Wilson A.C. 1990. Monophyleticorigin of Lake Victoria cichlid fishes suggested by mitochondrialDNA sequences. Nature 347:550–553.
Meyer B.S., Matschiner M., Salzburger W. 2015. A tribal level phylogenyof Lake Tanganyika cichlid fishes based on a genomic multi-markerapproach. Mol. Phylogenet. Evol. 83:56–71.
Meyer B.S., Salzburger W. 2012. A novel primer set for multilocusphylogenetic inference in East African cichlid fishes. Mol. Ecol.Resour. 12:1097–1104.
Mirarab S., Reaz R., Bayzid M.S., Zimmermann T., Swenson M.S.,Warnow T. 2014. ASTRAL: genome-scale coalescent-based speciestree estimation. Bioinformatics 30:i541–i548.
Murray A.M. 2002. Lower pharyngeal jaw of a cichlid fish(Actinopterygii; Labroidei) from an Early Oligocene site in theFayum, Egypt. J. Vert. Paleontol. 22:453–455.
Murray A.M. 2004. Late Eocene and early Oligocene teleost andassociated ichthyofauna of the Jebel Qatrani Formation, Fayum,Egypt. Palaeontology 47:711–724.
Murray A.M., Stewart K.M. 1999. A new species of tilapiine cichlid fromthe Pliocene, Middle Awash, Ethiopia. J. Vert. Paleontol. 19:293–301.
Muschick M., Indermaur A., Salzburger W. 2012. Convergentevolution within an adaptive radiation of cichlid fishes. Curr. Biol.22:2362–2368.
Musilová Z., Rícan O., Rícanová Š., Janšta P., Novák O.G.J. 2015.Phylogeny and historical biogeography of trans-Andean cichlidfishes (Teleostei: Cichlidae). Vertebr. Zool. 65:333–350.
Nishida M. 1991. Lake Tanganyika as an evolutionary reservoir of oldlineages of East African cichlid fishes: inferences from allozymedata. Experientia 47:974–979.
Nolte A.W., Tautz D. 2010. Understanding the onset of hybridspeciation. Trends Genet. 26:54–58.
Ogilvie H.A., Heled J., Xie D., Drummond A.J. 2016. Computationalperformance and statistical accuracy of *BEAST and comparisonswith other methods. Syst. Biol. Advance Access, doi:10.1093/sysbio/syv118:1–52.
Pagel M., Meade A. 2008. Modelling heterotachy in phylogeneticinference by reversible-jump Markov chain Monte Carlo. Phil. Trans.R. Soc. B 363:3955–3964.
Poll M. 1986. Classification des Cichlidae du lac Tanganika. Tribus,genres et especes. Académie Royale de Belgique. Classe desSciences. Mémoires 45:1–163.
Rabosky D.L., Santini F., Eastman J., Smith S.A., Sidlauskas B., Chang J.,Alfaro M.E. 2013. Rates of speciation and morphological evolutionare correlated across the largest vertebrate radiation. Nat. Commun.4:1958.
Reich D., Thangaraj K., Patterson N., Price A.L., Singh L. 2009.Reconstructing Indian population history. Nature 461:489–494.
Rieseberg L.H., Raymond O., Rosenthal D.M., Lai Z., Livingstone K.,Nakazato T., Durphy J.L., Schwarzbach A.E., Donovan L.A., LexerC. 2003. Major ecological transitions in wild sunflowers facilitatedby hybridization. Science 301:1211–1216.
Ring U., Betzler C. 1995. Geology of the Malawi Rift: kinematic andtectonosedimentary background to the Chiwondo Beds, northernMalawi. J. Hum. Evol. 28:7–21.
Roch S., Steel M. 2014. Likelihood-based tree reconstruction on aconcatenation of aligned sequence data sets can be statisticallyinconsistent. Theor. Popul. Biol. 100:56–62.
Rodríguez-Ezpeleta N., Brinkmann H., Roure B., Lartillot N., Lang B.F.,Philippe H. 2007. Detecting and overcoming systematic errors ingenome-scale phylogenies. Syst. Biol. 56:389–399.
Rokas A., Carroll S.B. 2006. Bushes in the tree of life. PLOS Biol. 4:e352.Rüber L., Meyer A., Sturmbauer C., Verheyen E. 2001. Population
structure in two sympatric species of the Lake Tanganyikacichlid tribe Eretmodini: evidence for introgression. Mol. Ecol.10:1207–1225.
Salzburger W. 2009. The interaction of sexually and naturally selectedtraits in the adaptive radiations of cichlid fishes. Mol. Ecol.18:169–185.
Salzburger W., Baric S., Sturmbauer C. 2002b. Speciation viaintrogressive hybridization in East African cichlids? Mol. Ecol.11:619–625.
Salzburger W., Mack T., Verheyen E., Meyer A. 2005. Out of Tanganyika:Genesis, explosive speciation, key-innovations and phylogeographyof the haplochromine cichlid fishes. BMC Evol. Biol. 5:17.
Salzburger W., Meyer A., Baric S., Verheyen E., Sturmbauer C. 2002a.Phylogeny of the Lake Tanganyika cichlid species flock and its
Downloaded from https://academic.oup.com/sysbio/article-abstract/66/4/531/2670093by WWZ Bibliothek (Oeffentliche Bibliothek der Universität Basel) useron 02 February 2018
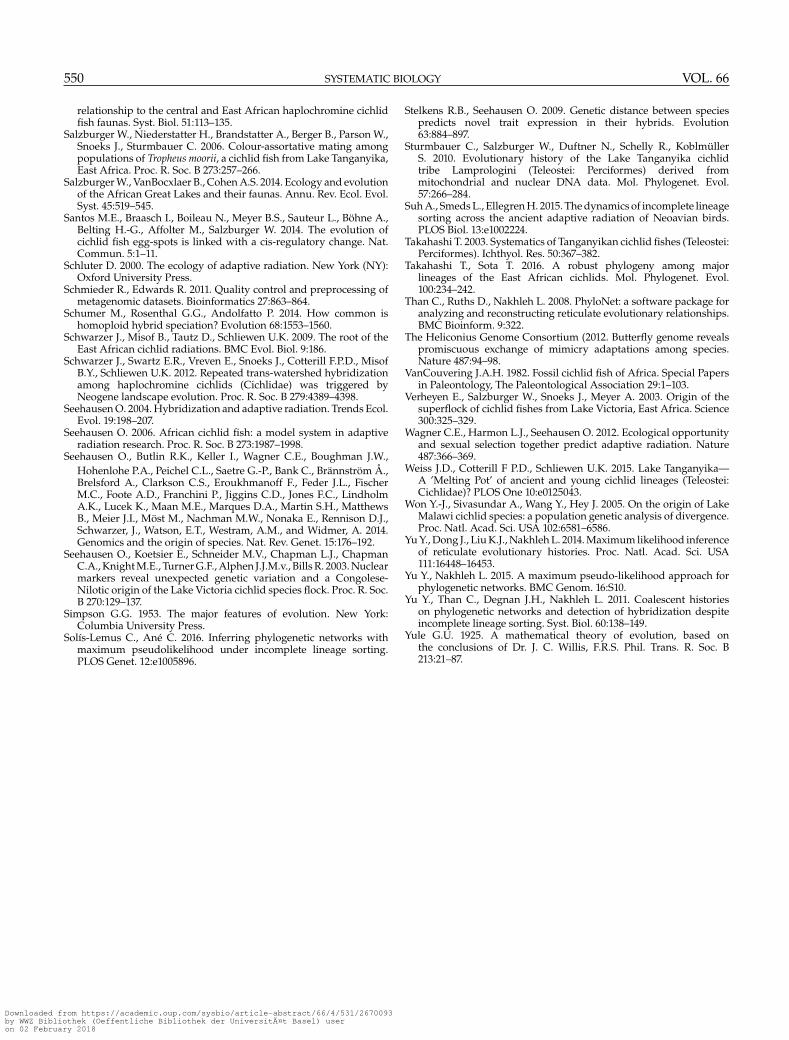
550 SYSTEMATIC BIOLOGY VOL. 66
relationship to the central and East African haplochromine cichlidfish faunas. Syst. Biol. 51:113–135.
Salzburger W., Niederstatter H., Brandstatter A., Berger B., Parson W.,Snoeks J., Sturmbauer C. 2006. Colour-assortative mating amongpopulations of Tropheus moorii, a cichlid fish from Lake Tanganyika,East Africa. Proc. R. Soc. B 273:257–266.
Salzburger W., VanBocxlaer B., Cohen A.S. 2014. Ecology and evolutionof the African Great Lakes and their faunas. Annu. Rev. Ecol. Evol.Syst. 45:519–545.
Santos M.E., Braasch I., Boileau N., Meyer B.S., Sauteur L., Böhne A.,Belting H.-G., Affolter M., Salzburger W. 2014. The evolution ofcichlid fish egg-spots is linked with a cis-regulatory change. Nat.Commun. 5:1–11.
Schluter D. 2000. The ecology of adaptive radiation. New York (NY):Oxford University Press.
Schmieder R., Edwards R. 2011. Quality control and preprocessing ofmetagenomic datasets. Bioinformatics 27:863–864.
Schumer M., Rosenthal G.G., Andolfatto P. 2014. How common ishomoploid hybrid speciation? Evolution 68:1553–1560.
Schwarzer J., Misof B., Tautz D., Schliewen U.K. 2009. The root of theEast African cichlid radiations. BMC Evol. Biol. 9:186.
Schwarzer J., Swartz E.R., Vreven E., Snoeks J., Cotterill F.P.D., MisofB.Y., Schliewen U.K. 2012. Repeated trans-watershed hybridizationamong haplochromine cichlids (Cichlidae) was triggered byNeogene landscape evolution. Proc. R. Soc. B 279:4389–4398.
Seehausen O. 2004. Hybridization and adaptive radiation. Trends Ecol.Evol. 19:198–207.
Seehausen O. 2006. African cichlid fish: a model system in adaptiveradiation research. Proc. R. Soc. B 273:1987–1998.
Seehausen O., Butlin R.K., Keller I., Wagner C.E., Boughman J.W.,Hohenlohe P.A., Peichel C.L., Saetre G.-P., Bank C., Brännström Å.,Brelsford A., Clarkson C.S., Eroukhmanoff F., Feder J.L., FischerM.C., Foote A.D., Franchini P., Jiggins C.D., Jones F.C., LindholmA.K., Lucek K., Maan M.E., Marques D.A., Martin S.H., MatthewsB., Meier J.I., Möst M., Nachman M.W., Nonaka E., Rennison D.J.,Schwarzer, J., Watson, E.T., Westram, A.M., and Widmer, A. 2014.Genomics and the origin of species. Nat. Rev. Genet. 15:176–192.
Seehausen O., Koetsier E., Schneider M.V., Chapman L.J., ChapmanC.A., Knight M.E., Turner G.F., Alphen J.J.M.v., Bills R. 2003. Nuclearmarkers reveal unexpected genetic variation and a Congolese-Nilotic origin of the Lake Victoria cichlid species flock. Proc. R. Soc.B 270:129–137.
Simpson G.G. 1953. The major features of evolution. New York:Columbia University Press.
Solís-Lemus C., Ané C. 2016. Inferring phylogenetic networks withmaximum pseudolikelihood under incomplete lineage sorting.PLOS Genet. 12:e1005896.
Stelkens R.B., Seehausen O. 2009. Genetic distance between speciespredicts novel trait expression in their hybrids. Evolution63:884–897.
Sturmbauer C., Salzburger W., Duftner N., Schelly R., KoblmüllerS. 2010. Evolutionary history of the Lake Tanganyika cichlidtribe Lamprologini (Teleostei: Perciformes) derived frommitochondrial and nuclear DNA data. Mol. Phylogenet. Evol.57:266–284.
Suh A., Smeds L., Ellegren H. 2015. The dynamics of incomplete lineagesorting across the ancient adaptive radiation of Neoavian birds.PLOS Biol. 13:e1002224.
Takahashi T. 2003. Systematics of Tanganyikan cichlid fishes (Teleostei:Perciformes). Ichthyol. Res. 50:367–382.
Takahashi T., Sota T. 2016. A robust phylogeny among majorlineages of the East African cichlids. Mol. Phylogenet. Evol.100:234–242.
Than C., Ruths D., Nakhleh L. 2008. PhyloNet: a software package foranalyzing and reconstructing reticulate evolutionary relationships.BMC Bioinform. 9:322.
The Heliconius Genome Consortium (2012. Butterfly genome revealspromiscuous exchange of mimicry adaptations among species.Nature 487:94–98.
VanCouvering J.A.H. 1982. Fossil cichlid fish of Africa. Special Papersin Paleontology, The Paleontological Association 29:1–103.
Verheyen E., Salzburger W., Snoeks J., Meyer A. 2003. Origin of thesuperflock of cichlid fishes from Lake Victoria, East Africa. Science300:325–329.
Wagner C.E., Harmon L.J., Seehausen O. 2012. Ecological opportunityand sexual selection together predict adaptive radiation. Nature487:366–369.
Weiss J.D., Cotterill F P.D., Schliewen U.K. 2015. Lake Tanganyika—A ’Melting Pot’ of ancient and young cichlid lineages (Teleostei:Cichlidae)? PLOS One 10:e0125043.
Won Y.-J., Sivasundar A., Wang Y., Hey J. 2005. On the origin of LakeMalawi cichlid species: a population genetic analysis of divergence.Proc. Natl. Acad. Sci. USA 102:6581–6586.
Yu Y., Dong J., Liu K.J., Nakhleh L. 2014. Maximum likelihood inferenceof reticulate evolutionary histories. Proc. Natl. Acad. Sci. USA111:16448–16453.
Yu Y., Nakhleh L. 2015. A maximum pseudo-likelihood approach forphylogenetic networks. BMC Genom. 16:S10.
Yu Y., Than C., Degnan J.H., Nakhleh L. 2011. Coalescent historieson phylogenetic networks and detection of hybridization despiteincomplete lineage sorting. Syst. Biol. 60:138–149.
Yule G.U. 1925. A mathematical theory of evolution, based onthe conclusions of Dr. J. C. Willis, F.R.S. Phil. Trans. R. Soc. B213:21–87.
Downloaded from https://academic.oup.com/sysbio/article-abstract/66/4/531/2670093by WWZ Bibliothek (Oeffentliche Bibliothek der Universität Basel) useron 02 February 2018