Discussion Paper No. Exploring the Role of Trust ...
41
הפקולטה לחקלאות | המחלקה לכלכלת סביבה וניהול רחובות ת.ד12 טל':9489230 - 08 | פקס:9466267 - 8 0 | [email protected] המרכז למחקר בכלכלה חקלאיתThe Center for Agricultural Economic Research המחלקה לכלכלת סביבה וניהולDepartment of Environmental Economics and Management Discussion Paper No. 5.20 Exploring the Role of Trust Indicators in the P2P Economy: Analysis and Simulations of an Airbnb Market By Aliza Fleischer, Eyal Ert and Ziv Bar-Nachum מאמרים של חברי המחלקה נמצאים גם באתרי הבית שלהם: Papers by members of the Department can be found in their home sites: http://departments.agri.huji.ac.il/economics/index.html ת. ד. 12 , רחובות76100 P.O. Box 12, Rehovot 76100, Israel
Transcript of Discussion Paper No. Exploring the Role of Trust ...
לכלכלת סביבה וניהול | המחלקה לחקלאות הפקולטה
12רחובות ת.ד
[email protected] | 9466267-80| פקס: 9489230-08טל':
המרכז למחקר בכלכלה חקלאית
The Center for Agricultural Economic Research
המחלקה לכלכלת סביבה וניהולDepartment of Environmental Economics and Management
Discussion Paper No. 5.20
Exploring the Role of Trust Indicators in the P2P
Economy: Analysis and Simulations of an Airbnb
Market
By
Aliza Fleischer, Eyal Ert and Ziv Bar-Nachum
מאמרים של חברי המחלקה נמצאים :גם באתרי הבית שלהם
Papers by members of the Department can be found in their home sites:
http://departments.agri.huji.ac.il/economics/index.html
P.O. Box 12, Rehovot 76100, Israel 76100רחובות , 12. ד.ת

1
Exploring the Role of Trust Indicators in the P2P Economy: Analysis and
Simulations of an Airbnb Market
Aliza Fleischer, Eyal Ert, and Ziv Bar Nachum
The Hebrew University of Jerusalem
Abstract
We propose a structural econometric model in which listings in an Airbnb market differ
not only in their attributes, but also in their seller’s characteristics as trust indicators.
Applying the model to Stockholm’s Airbnb market reveals that hosts’ attributes
significantly affect market performance. Simulations of market scenarios show that the
very high review scores and the Superhost certification help Airbnb compete with hotels
and increase its market welfare. We also show that the “Airbnb plus” luxury program,
which makes the apartments a closer substitute for hotels, leads to an increase in Airbnb’s
market welfare. Our analysis provides a framework for understanding the full impact of
the different attributes of the products, their providers and their management in the
sharing-economy accommodation market.
Keywords: Airbnb; trust; structural econometric model; differentiated goods market

2
1 Introduction
Trust between buyers and sellers plays an important role in online peer-to-peer
(P2P) markets, especially in sharing economy platforms such as Airbnb and Uber, where
online transactions are followed by offline encounters between strangers. The high risk
involved in such transactions makes trust crucial to their success to an even greater
degree than it is for more traditional P2P online markets that are limited to online
transactions, such as eBay (Einav et al., 2016). For this reason, many P2P platforms
provide information not only about their products and services, but also about their
sellers. This study suggests that Airbnb utilizes these attributes in order to gain advantage
in its competition with hotels in the accommodation market.
We claim that sellers’ characteristics act as trust indicators and may play a
prominent role in this economy just like attributes of goods. The most common indicator
of trust in ecommerce platforms is probably the ratings (“review scores”) shared by past
customers, which are used as a reputation system. The use of review scores reduces
information asymmetry, so many online markets solicit this information and display it to
their customers (Cabral & Hortacsu, 2010; Tadelis, 2016). In the context of P2P markets,
there are various studies on the role of sellers reputation in eBay (Livingston, 2005;
Melnik & Alm, 2002; Tadelis, 2016). Recent research on Airbnb, a market leader of the
sharing economy, has also studied the role of reputation (Ert & Fleischer, 2019; Fradkin
et al., 2018). Yet the research on Airbnb has also identified additional important
indicators that might affect consumers’ perception of sellers’ trustworthiness. These
include the hosts’1 personal images (Ert et al., 2016), their self-disclosure texts (Ma et al.,
2017), and the Superhost badge, which has been implemented in Airbnb as a quality
certification system (Gunter, 2018). The utilization and visibility of these seller attributes
have undergone major changes in the past several years on Airbnb, probably as part of
the company’s competitive strategy in the accommodation market (Ert and Fleischer,
2019).
1 Airbnb refers to sellers as “hosts” and consumers as “guests.”

3
While the aforementioned studied have provided an initial evidence to the
potential role of sellers’ attributes in these P2P markets, their effect on these market is far
from being clear since they have only analysed specific features of the market (e.g.,
price), rather the market as a whole. The current paper makes this leap by analysing the
effect of both product and seller attributes on the entire Airbnb market in Stockholm by
using an econometric model of the market.
We employed a differentiated goods market analysis where we utilized the
different types of the sellers’ attributes in addition to the goods’ attributes. We
incorporated both sets of attributes into a structural model of the whole market, i.e.,
including demand and pricing equations with the hotel market as an outside good.
Applying this approach to the Stockholm Airbnb market, in which the different trust
indicators of the host and property attributes are observable, made it possible to compare
the role of these two sets of attributes in the market. Moreover, the estimated model
enables the simulation of market equilibria under different scenarios with changes in trust
and property attributes.
This analysis led to the following main findings:
(1) Although the listings in Stockholm’s Airbnb market differentiate themselves
in both their property and host attributes, the market is still highly competitive, with
demand elasticity of approximately -5 and a mark-up of 19%. We also found that guests
see listings in the same neighbourhood as a closer substitute than listings in different
neighbourhoods. (2) In our estimation of the structural empirical model of the market
(demand and pricing equations), we used five host attributes: perceived trustworthiness of
the host’s photo, Superhost certification, review score, host’s self-disclosure text and the
host verification. The results revealed preferences for verified hosts, hosts who appear
more trustworthy by their images, higher review scores, and Superhost certification. Yet
Superhost certification entails higher costs for the host. Therefore, the final impact of
introducing this certification to the market can be assessed only by market simulation.
(3) We found that the physical attributes of the properties preferred by guests are central
location, entire home (i.e., not sharing an apartment with the host), more rooms, and
better-looking property. The more attractive properties attract more guests, but they also
entail higher costs. Therefore, the full impact of changes in these variables on prices,

4
market shares, and welfare is not straightforward and could only be assessed by
simulating full market equilibria. (4) By using the estimated structural econometric
model of the market, we simulated two scenarios that explained the Airbnb changes in its
trust signals and in upgrading their product to Airbnb plus. We evaluated their impact on
demand, price level, profit, consumer surplus, and total welfare. In the first simulation,
we shifted the scale of the Airbnb review score to have the same mean and standard
deviation as the review scores hotels receive on Booking.com, and eliminated the
Superhost certification. This resulted in a shift of guests to the outside good, (i.e., the
hotels) and a loss of profits and consumer surplus in the Airbnb market. This result might
explain why Airbnb strongly encourages guests to give very high rankings, despite the
fact that this action makes them less informative. The implementation of the Superhost
certification is similar, and although it might seem initially vague and redundant, it
actually increases welfare. The second simulation tested the impact of introducing Airbnb
plus — a selection of high-quality homes. The results show that this introduction results
in an increase in demand and welfare in the Airbnb market, despite the price increase. It
should be emphasized, that these results could be obtained only by simulating the full
structural model of the market, as some attributes, like Superhost certification and
luxurious properties, imply not only an increase in demand but also in costs. Thus,
previous analyses that focused on only one market feature (e.g., price), fall short from
addressing the implications of these attributes.
The main contribution of this paper is its use of a structural econometric model to
analyse a sharing economy market as a whole while taking into consideration the seller
and the good’s attributes. A whole market analysis of the Airbnb market has not
previously been reported in the literature and sellers' attributes have not been taken into
consideration. The use of this model sheds light on two seemingly counterintuitive
phenomena that characterize Airbnb. First, it explains why Airbnb has encouraged very
high reviews scores, to the extent they become uninformative (although information
about hosts is pivotal to its operation), and also explains the addition of the seemingly
redundant Superhost certification. Secondly, the model explains why Airbnb has shifted
its position in the accommodation market from a low-cost alternative to hotels that
focuses on hosts, to a close substitute to hotels that offers luxury accommodation options

5
(Airbnb plus). These shifts in strategy imply changes in demand and costs that might act
in opposite directions, and thus could be evaluated only by simulating the market
equilibrium under the new conditions. We show that this strategy appears to have an
advantage for Airbnb’s in its competition with the hotels in the accommodation market
and accordingly results in higher profits and welfare in the Airbnb market.
Digital platforms are changing the way urban economies operate. Although the different
platforms operate in different markets they share many similarities such as use of
unexploited labor, algorithmic management, digital reputation and crowdsourcing. They
are also competing with existing traditional firms (e.g., UBER and taxis, Airbnb and
hotels). In the case of urban tourism markets, the Covid-19 pandemic has temporarily
paused some of these processes but it is increasing the use of digital services in other
markets. More importantly, it caused a radical change in online consumption and a shift
from offline to online transactions. Thus, we contend that this study can provide insights
into other markets wherein digital platforms such as Airbnb are competing with the
traditional incumbent firms. These insights can also be useful in post-Covid-19 days with
the expected recovery (Airbnb might recover faster than hotel due to social distancing)
and the sharp increase in the digital economy.

6
2 Literature Review
Over the years, Airbnb has continuously modified its trust signals and their
visibility. For example, its two-sided rating system, whereby guests review hosts and
hosts review guests, provoked fears of retaliation, which led to very high and
uninformative review scores (Bolton et al., 2013; Ert et al., 2016; Zervas et al., 2015). To
address this problem, Airbnb modified its review mechanism so that reviews are not
revealed until both guest and host have submitted them. Fradkin et al. (2018) found this
change to be effective in providing a more informative reputation system. Nevertheless, a
recent examination of the review scores in 13 large cities revealed that their level
remained high (Ert & Fleischer, 2019). A possible explanation for this phenomenon is
that guests are strongly encouraged to give high ratings in their feedback.2 This
encouragement alludes to the interest of Airbnb to maintain high reputation scores even
though it makes them uninformative.
Another change that Airbnb has implemented is the inclusion of the Superhost
badge. According to Airbnb, superhosts are “experienced hosts who provide a shining
example for other hosts and extraordinary experiences for their guests.” Although this
definition is somewhat vague and even redundant (it is correlated with the review score),
it is clear that Airbnb found it necessary to establish its own certification system, similar
to eBay’s eTRS (eBay’s Top-Rated Seller; Elfenbein et al. 2015).
Airbnb not only modified the trust indicators, but also changed their prominence
in the search screen. Until 2014, the front page of search results yielded images of the
living space and the host only. Between 2014 and 2017, Airbnb added the review score,
on a scale of one to five stars, to the images of the living space and the host displayed in
the initial search results. At the end of 2016, Airbnb removed the image of the host from
the front page of the search results (for details see Ert & Fleischer 2019). Following this
change, potential guests can see the host’s image only after they choose a listing and click
on it. For years, hosts’ photos were placed next to the property photo on the front page of
the search results to highlight the personal experience and differentiate Airbnb from
2 The following text is send to guests: "Please before you leave your feedback take into
consideration Airbnb criteria for Guests satisfaction. There is a common misunderstanding about the stars
value by which a lot of times guests leaves 4 stars and nice comment for the host thinking it's a good
feedback while actually Airbnb considers it bad feedback and penalizes all host below 4.8 stars."

7
hotels. The host’s personal photo was originally intended to facilitate a sense of social
contact that inspires mutual trust, which is often missing in ecommerce (Charness et al.,
2007; Gefen & Straub, 2004). Yet personal hosts’ photos might have had additional
effects, since they also disclose social information (e.g., gender, race) and led to
automatic impression formation (e.g., perceived trustworthiness). Indeed, hosts’ photos
were found to affect guests’ decision making (Ert et al. 2016). However, this change in
the prominence of the hosts’ photos may have occurred in response to claims of racial
discrimination (Edelman et al., 2017; Edelman & Luca, 2014), which were widely
covered in the media.3
Another change Airbnb introduced is the line of luxurious, beautifully stylized
and designed properties on “Airbnb plus.” This change, alongside the previously
mentioned change of weakening the visibility of the hosts’ photos, positioned Airbnb
listings as closer substitutes for hotel accommodations. Li and Srinivasan (2019) studied
this trend by testing the impact of “professional” hosts on lowering costs. They suggest
that this trend helps Airbnb cannibalize the hotels in the same location. We want to study
the introduction of “Airbnb plus” from the point of view of the attributes and their effect
on demand (the property is more attractive) and costs (it is more costly to operate a
luxury apartment).
In order to identify the role of the aforementioned attributes in the economic
performance of an Airbnb market, we applied a model in the spirit of Berry, Levinsohn,
and Pakes’s (1995; henceforth BLP) differentiated goods model of the American car
market. Variants of this model have been applied to different markets, such as the
Swedish analgesics market (Björnerstedt & Verboven, 2016; henceforth B&V), grocery
stores (Eizenberg et al., 2018), and the rural accommodation market (Tchetchik et al.,
2008). All of these markets are differentiated goods markets in which the attributes of the
goods differ, e.g., the car model, the medication dosage, the location of the retail store, or
the size of the accommodation unit, respectively. Services in P2P markets differ in their
attributes in a similar manner, e.g., number of rooms and location. However, unlike
business-to-customer (B2C) markets, P2P service platforms also differ in terms of their
3 See, e.g., https://www.theverge.com/2017/7/26/16037492/airbnb-naacp-partnership-racism-diversity-
hosts

8
sellers’ (e.g., hosts in Airbnb, drivers in Uber) attributes, which are typically interpreted
as trust signals.
Including Airbnb hosts’ attributes in the model is not a straightforward matter. They
appear in different information formats—numeric scores (online reviews), identifiers
(Superhost badge), textual narratives (hosts’ self-disclosure texts), and visual items
(hosts’ photos). One of the challenges of this work is to quantify the visual and textual
information in order to account for it fully in the empirical model. By doing so, we can
include both, product attributes and sellers’ attributes, in the same analytical framework.
The next section describes this framework in details.
3 Methodology
3.1 A Differentiated Good Market Model of Airbnb
We propose a differentiated goods market model as a framework for analysing an
Airbnb market. The underlying assumption of this model is that both the listing’s and the
host’s attributes affect market performance, e.g., market shares, prices, markups, and
welfare. We are especially interested in the effect of different trust indicators and changes
in them (e.g., online reviews, hosts’ photos, hosts’ self-disclosure texts, and the Superhost
badge) on the market.
Our model is defined in terms of four primitives and a Nash equilibrium
assumption in prices. The primitives are: (1) the utility function that assigns values to
different possible combinations of product and host attributes, (2) the cost function that
determines the production cost associated with different combinations of attributes, (3) a
distribution of consumer characteristics, and (4) a distribution of listing characteristics.
Conditional on these primitives, the model can be solved for the distribution of prices,
quantities, and consumer welfare. It can then be used in different market equilibrium
simulations that will interpret modifications of trust attributes that have occurred in the
market and their impact on welfare. The utility, aggregate empirical demand, and pricing
equations are depicted below. We chose to display the primitives and the derived final
empirical equations.

9
3.1.1 Demand
We chose to follow the extension of B&V to BLP’s model and use utility specification
where price enters logarithmically, market shares are measured in value, and the potential
market in our case refers to the potential value of the accommodation market in a
location. This extension allows the implied price elasticities to be quasi-constant instead
of quasi-linear in prices.4 Based on B&V and BLP analyses of the USA car market and
the Swedish analgesics market , this functional form is not expected to have a strong
impact on our main conclusions.
Consider an Airbnb market with J listings, j=1… J, and N potential guests
i=1…N. A one-level nest is specified, where the different nests are defined as the
different neighbourhoods in the city. Underlying this single-level nesting is the
assumption that due to common unobserved variables such as tourism attractions and
amenities, the degree of substitution between two listings from the same neighbourhood
is higher than the one between two attractions from different neighbourhoods. Although
it is possible that guests have heterogeneous preferences when it comes to the number of
rooms in a listing, we preferred to retain the nested model because location plays an
important role in this market and dictates the structure of substitution.
The utility of guest i from staying in listing j is:
ijigjijjij pyfxu )1(),( −++++= ,
where jx is a vector of observed characteristics of listing j, including the property and the
hosts’ observed characteristics, iy is individual i’s income, and jp is the price per night
of listing j. j captures the average utility (over all potential guests) attached by the guest
to the unobserved characteristics of listing j. These attributes are observed by guests and
hosts, but unobserved by the researcher. ig is the ith guest’s preference for a specific
4 See B&V for further details on the model.

10
neighbourhood g, and ij is the guest’s ith idiosyncratic preference for listing j. The
parameter σ captures the substitution patterns between and within neighbourhoods.
Based on this primitive, the aggregate empirical demand function receives the following
form:
(1) jgjjjj spxss ++−= )ln(ln)ln( /0,
where js is the revenue market share of listing j, 0s is the revenue market share of the
outside good, in our case the hotels in the same city, and gjs /
is the revenue market share
of listing j in neighbourhood g.
3.1.2 Pricing
It is assumed that each host maximizes profits. In the short run, the decision variable is
the price, while other characteristics of the listing remain fixed. Each host is assumed to
set prices that maximize his/her profit given his/her product’s attributes and the prices
and attributes of the competing listings. We assumed that a Nash equilibrium for this
pricing game exists and the equilibrium prices are at the interior of the host’s strategy
sets.
In order to obtain the empirical pricing specification, we rearranged the first order
conditions to receive:
jj
j
jpq
qmp
−= jc ,
where 𝑚𝑐𝑗 is the marginal cost of listing j, and jq is the number of nights sold.
Stated differently, we received the following expression for the markup:
jjj
jj
ep
mcp 1=
−,
where 𝑒𝑗𝑗 is the absolute value of the own-price elasticity.

11
The nested logit constant expenditure specification generates simple analytic expressions
for the aggregate own-price elasticity of demand (for further details, see Appendix 1):
−
−+−−−=
−=
1
1)1(1 / jgj
j
j
j
j
jj
ss
q
p
p
qe .
Based on this primitive, and by assuming that the marginal cost is log-linear in the vector
of cost attributes (BLP, 1995) ( ) jjj Wmc +=ln , we obtain the following estimable
pricing equation:
(2) ( )
j
jgj
jgj
jjss
ssWp
+
−+−−−
−−−−=
1)1(1
)1(1lnln
/
/ .
The expression of the markup, in the large brackets, is a positive fraction between zero
and one. If 𝜎=0, only the market share, 𝑠𝑗, affects the markup. Conversely, as 𝜎
approaches one, only the nest share (regional share in our case) matters. Thus, the
relationships in the data between the prices, market shares, and regional revenue shares
will assist in identifying the substitution parameter 𝜎.
The empirical demand and pricing equations, (1) and (2) respectively, consist of a
system of nonlinear, simultaneous equations that can be estimated. That is, the system of
revenue share (Eq. 1) and pricing equations (Eq. 2) for all listings yields an equilibrium
model of the Airbnb market in a city. By employing the estimated parameters, the model
facilitates simulations of the equilibrium of the Airbnb market under various conditions.
3.2 Data
Our dataset, compiled from various sources, consists of information on Airbnb
listings in Stockholm. Stockholm was chosen because it is not a very large city and is still
characterized mainly by peer-to-peer transactions rather than a more commercialized
version where rental companies rent properties to tourists. Another benefit of focusing on
Stockholm is that it has five well-defined neighbourhoods that appear on its site
(Kungsholmen, Norrmalm, Södermalm, Östermalm, and outside the city center) that we

12
used as nests. We obtained two complementary data sets for Stockholm Airbnb listings
from Airdna (https://www.airdna.co/). One data set included the economic performance
of listings (Average Daily Rate (ADR), number of reservations, and revenue) during the
year 2016, on a monthly basis. The second data set included a static shot of each listing’s
attributes (e.g., photo of the host, review score) at the month the data was downloaded,
i.e., January 2017. One dilemma concerns the choice of the exact time period for the
market analysis. Our first thought was to simply analyze the entire year 2016 and use the
monthly economic performance as panel data. However, this choice has some major
drawbacks. Some of the listings’ attributes are likely to have changed over the course of
an entire year (e.g., review score), and so their record from January 2017 might
misrepresent their actual state as it was 12 months earlier on January 2016. The longer
the period, the higher the chance that the listing’s attributes have changed. This issue is
important since our interest is analyzing the impact of the attributes on economic
performance. There is no way to retrospectively obtain the actual attributes as they were
in each month of 2016. Another challenge is that many listings have zero revenue during
certain months. This challenge can be addressed by considering the total revenue over a
period of several months. Thus, we decided to define the market we would study as the
last five months of 2016, i.e., from August to December 2016. One important aspect of
this time frame is that it captures both peak and low seasons, i.e., summer, fall and
winter. At the same time, it is not too long a period for the listing’s attributes to change
drastically,5 while it is long enough for most of the active listings to have non-zero
revenue. In this case, the market share of each listing is its revenues during these five
months divided by the total revenue of the accommodation market in Stockholm.
Airbnb Stockholm, as recorded in January 2017, included 8626 listings. However,
only a small number of those listings was actively competing in the market during the last
five months of 2016. In terms of level of activity, the listings in the market range from
those that have not been rented for more than a year, to very active listings that have been
rented during each month of the study period. On Airbnb, unlike hotels, hosts can choose
5 We checked how dynamic the changes in attributes of the listings are. While we did not have the
data to compare the attributes of January 2017 to those of August 2016, we had data for January and April
2017. Our comparison of the major attributes between these two points in time showed almost no changes
during this time span, confirming our assumption.
13
not to rent their property even if it appears on the site. They can choose to rent it only at
their convenience and block it at other times or deny requests from potential guests as
they choose. Thus, listings can be arranged along this range according to their level of
active competition in the market. Some were available for only a few days (e.g., the hosts
left for a weekend and decided to rent their apartment over this weekend) and some were
available for most of the period. In the current analysis, we focus on the latter type of
listings, the ones most active in the market, for several reasons. First, the current analysis
dictates the collection of primary data on each listing regarding their visual attributes
(e.g., judgement of host and apartment photos) and textual attributes, which is very costly
and can be done only to a subset of the market. Given that the analysis can only focus on
one subset of the listings, it seems more reasonable to focus on the most active listings,
under the assumption that these listings are the ones that drive the market in terms of
transactions, revenue share, and so on. Another important feature of analyzing the subset
that includes the most active listings is that there are no missing values on important
attributes that are needed for the analysis. The estimation problem we could have faced
with this sample selection was that it could have affected the statistical significance of the
chosen statistical tests. It also should be noted that what we learn from these estimations
about the connections between the attributes and the market performance of a listing is
mainly relevant for the most active listings and might not be relevant for the non-active
ones.
The process of eliminating the listings that were not relevant for our analysis was
composed of the following steps. The first step was removing “ghost” listings, i.e.,
apartments that were never rented in 2016, which resulted in 6082 listings remaining.
Next, we removed listings that were not been rented at least once during the five-month
period (August to December 2016). The application of this criterion resulted in 4243
listings remaining. Our next step was to remove listings that were blocked for booking
for more than two weeks per month during the five-month period. This step resulted in
1473 listings remaining. We then excluded listings that have never been rated by guests
(i.e., that have no review score). This resulted in a dataset of 1238 relevant listings.
By selecting this set of listings, we were exposed to the error of eliminating a
listing that was active in the market but did not receive any reservations during the study

14
period because it priced itself out of the market. In order to test this possibility, we
compared the average daily rate (ADR) of the1238 listings dataset with that of the 4844
listings that were excluded from the initial data of 6082 listings. The comparison revealed
that the ADR in the 1238 listings data set ($139) was very similar to the ADR of the
initial dataset ($133). Therefore, we can reject the concern that the listings that were
excluded from our analysis are not active because they priced themselves out of the
market. The next step was excluding properties that were not apartments or houses (e.g.,
dormitories, boats, and so on), resulting in 1159 listings remaining.
Since the focus of the study was the role of the different listings' attributes in the
market, we excluded listings that had no photos of hosts (e.g., that featured smiley icons,
flowers, and so on) or the property (e.g., that showed city views), and those whose self-
disclosure text was in Swedish. Nevertheless, we used them by adding their revenue to
that of the outside good—in our case the hotels in Stockholm. After the application of
these criteria, the final data set included 576 relevant listings.
In order to ensure that there was no selection bias resulting from the latter
exclusion, we compared the listings in the final dataset with the listings that were
excluded from the 1159-listing dataset. Table 2 shows some differences between the two
sets, yet in most cases these differences are rather small even in cases where they showed
statistical significance.
-------------------put Table 2 here ---------------
To summarize, the final dataset of Stockholm’s listings used in the current study
represents all the active apartments that had all the needed information for our analysis.
Thus, the market we analyzed is the market of the last five months in 2016 of active
listings that contain all the information we needed. The rest of the active listings in our
analysis fall, with the hotel market, into the category of outside good, which is taken into
consideration in our theoretical and empirical model.
The listings’ attributes include the following variables: listing type (shared room,
private room, entire home), number of months on Airbnb (computed according to the
listing’s creation date), neighbourhood, number of bedrooms, number of bathrooms,
maximum guests allowed, Average Daily Rate (ADR) in USD, number of reviews,
review score (i.e., overall rating score), number of reservation days, number of available

15
days, number of blocked days, number of listing photos posted, and listing’s main photo.
For each of the listing’s variables that include monthly information (e.g., ADR), we then
used the means (or sums wherever applicable) over the five months of the recorded data.
The hosts’ data include the host’s self-disclosure text, from which we extracted
the number of words in the description, Superhost status (yes/no), whether the host was
tagged as “verified” (yes/no), number of host’s listings, and the host’s personal photo.
The data extracted from Airbnb does not include the perceived trustworthiness of
the hosts and the perceived attractiveness of the apartment. To collect this information,
we leveraged on-demand user-contributed opinions from Amazon Mechanical Turk
(AMT). The data consists of photos of 538 different hosts and 576 photos of their
apartments. The host photos were evaluated by 540 AMT workers from the US and
Canada. Each worker examined 20 photos. Each host photo was examined by 20 AMT
workers who responded to the question “How trustworthy is the person in the picture?”
(on a scale of 1 to 10). Interrater correlation analysis was performed on the rating data for
the photographs in each group of participants. The results indicated adequate levels of
reliability (mean score = 0.70).
To assess the perceived attractiveness of the apartment photos, we recruited
another 400 AMT workers, each of whom examined 30 photos. Each apartment’s photo
was examined by 20 workers who responded to the question: “Would you choose to
spend a night in the lodging shown in the picture?” (on a scale of 1 to10) We computed
the mean scores for each of these variables and merged them with the original dataset.
Interrater correlation analysis was performed on the rating data for the apartment
photographs in each group of participants. The results indicated adequate levels of
reliability (mean score = 0.73).
The quantification of the text was conducted according to Ma et al.'s (2017)
algorithm, which analyzes the text of host profiles to predict hosts’ perceived
trustworthiness, based on their textual features. We chose to use the word count of the
self-disclosure text as a proxy for trustworthiness based on the strong correlation the
authors found between the number of words in the text and the host’s trustworthiness as
calculated by their algorithm.

16
The Airbnb Stockholm market analysis is based on the structural empirical model,
as described in Section 2. The system of equations is estimated using the merged dataset
that includes the listings’ and hosts’ data from Airdna, the on-demand user-generated
data from AMT, and the text quantification data.

17
4 Model Specification and Results
In this section, we present the specification of our empirical model and the
estimation results. We estimated four models, each composed of a different set of hosts’
attributes. This section reports the empirical analysis and the next section reports
simulations that applied these estimates to different scenarios in order to evaluate the
economic effects of the changes Airbnb is undergoing.
The nested logit model used here implies that guests tend to have higher levels of
substitution within a neighbourhood than between neighbourhoods. This model structure
is more suitable for our analysis, since guests tend to seek accommodation near their
point of interest in a city (Shoval et al., 2011). Thus, it is more likely that guests would
prefer to substitute listings within the neighbourhood than outside it.
The potential accommodation market in Stockholm is defined as the total revenue
of hotels in 2016 (Stockholm Hotel Report 2018, n.d.) adjusted to a five-month period. In
2016 there were 7,185,507 available hotel rooms with RevPAR (revenue per available
room) of 100.7 USD and total revenue of approximately 723 million USD.
4.1 Estimation Methodology
The system of equations (1) and (2) is simultaneous and non-linear in α and ; the
price, 𝑝𝑗 , and the shares, js and
gjs /are endogenous and thus require a set of
instruments. The error terms in both equations are functions of unobserved attributes of
the listing and thus can be correlated, and α and appear in both equations. We chose to
employ the general method of moments (GMM) in the estimation as the best procedure to
handle the aforementioned econometric problems mainly because it does not require
additional assumptions on the error terms in the structural equations. The estimations
were carried out by utilizing GMM procedure in STATA (v15).

18
4.2 Instruments
The endogenous variables in the model are the price, 𝑝𝑗, and the shares, js and
gjs /. Instrument variables for revenue shares that do not correlate with costs are the
following: the perceived trustworthiness of the host photo, which is observed by the
guests and positively correlated with demand, but not with costs, and the number of
apartments of the same size in the neighbourhood, the number of hotel rooms, and the
number of other Airbnb listings at the neighbourhood level, which are negatively
correlated with the revenue shares with and within the neighbourhood, as suggested by
BLP and B&V. Therefore, they are used as instruments for both types of shares.
The instruments for price (ADR) are: the average price of listings of the same size
in different neighbourhoods, the average price of listings of different size in the same
neighbourhood, the number of listings of the same size in different neighbourhood,
dummy if the host manages more than one listing (economies of scale), and the number
of reservations (a large number of short-stay reservations are more costly to manage than
a small number of long-stay reservations). The choice of all instruments was validated by
the F-test of the excluded instruments, which was significant in the first-stage regressions
for all three endogenous variables. Table 1 shows descriptive statistics of these
instruments. Note that we treated the review score, our variable for reputation, as an
exogenous variable. This assumption can be justified to the extent that the review score is
based on the mean of all guests’ ratings, and different guests observed different prices
during the relevant period. We tested this assumption by considering a specification
-------------------- put Table 1 here---------------
where overall rating was treated as an endogenous variable with the same set of
instruments, with no significant change in the results.
4.3 Results
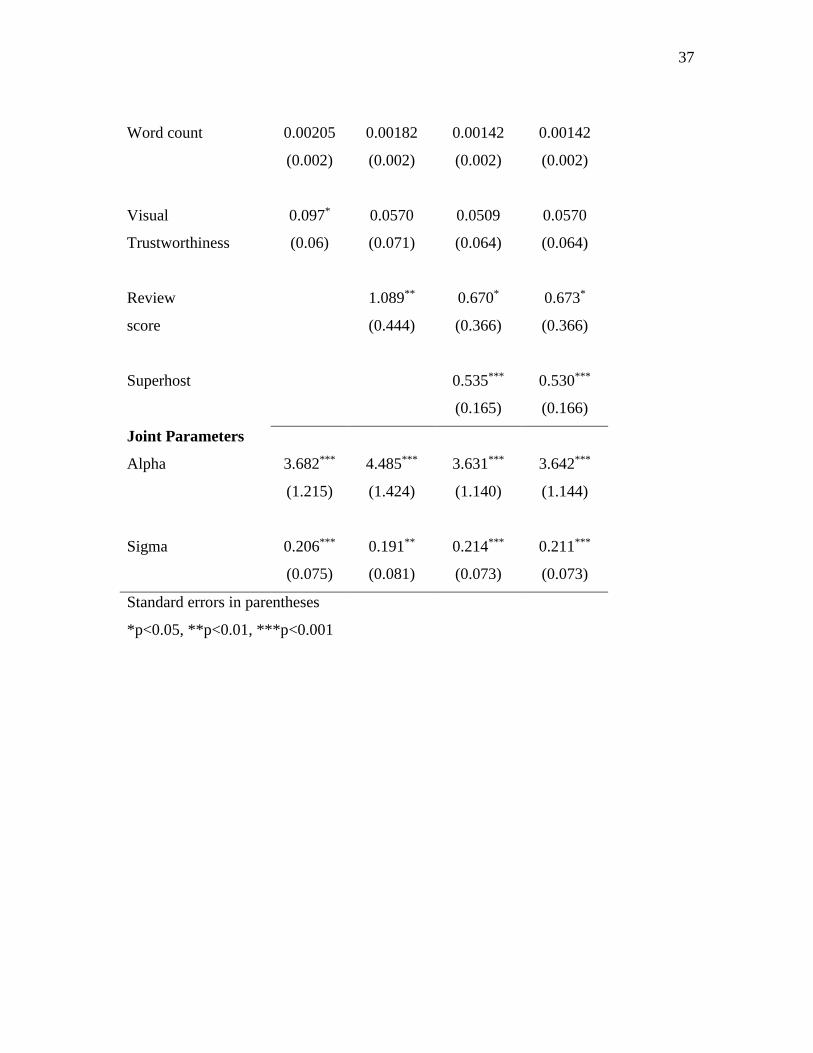
Table 3 presents the estimated demand parameters for four different models. We
report the values of α and in the demand estimation results table although they also
19
appear in the pricing equation. As expected, and are both positive and significant.6
The significance of confirms our nested structure assumption that guests perceive
listings in the same neighbourhood as closer substitutes than listings from different
neighbourhoods. The estimated value of demand elasticity is -5.2 (see Appendix 1 for the
method of calculating the elasticity) and the markup is, accordingly, 19%. The value of
the elasticity is the weighted (by sales) average elasticity across the listings. In a work by
Lanza et al. (Lanza et al., 2003) demand elasticity for tourism in 13 European countries
was estimated to be between -1.8 to -1.1. Konovalova and Vidishcheva (Konovalova &
Vidishcheva, 2013) conducted an empirical study on elasticity of demand in tourism and
hospitality industries in different economics. They found that the average price elasticity
of demand for most countries is between -2 to -0.8. Our findings of a relatively high
demand elasticity and a lower markup reveal that, comparing to tourism markets, the
Airbnb market in Stockholm is competitive and although the listings differ in their
attributes, guests consider them as close substitutes.
-----------------------put Table 3 here-----------------
In Model 1 we included only the variable of visual trustworthiness and in Model 2
we added the variable review scores. As expected, guests have higher preferences for
more trustworthy host images and listings with better host reputations (higher review
score). In both cases, the variables are positive, trustworthy image is significant in Model
1 only and review score is significant in Model 2. Model 3 reveals that when we included
the Superhost certification badge the review score coefficient is still significant but at a
lower level of significance and visual trustworthiness was not significant. Pearson
correlation between Superhost and review score is 0.27, between Superhost and visual
trust 0.1, and between review score and visual trust 0.08. We can also see that guests
have higher preferences for verified hosts and that the trustworthiness of the self-
disclosure text does not seem to affect guests’ preferences significantly.
The estimated coefficients in all the models suggest that guests have different
valuations for the different listings’ physical attributes. Guests’ valuations of entire
homes and private rooms are significantly higher than their valuations of
6 Due to the structured minus sign of alpha (i.e., -) in demand equation (1), a positive coefficient of alpha
is expected.
20
accommodations in shared rooms. Likewise, their valuations are significantly higher for
more bedrooms and bathrooms. As expected, guests’ valuations for listings increase if the
accommodations are located at the center of Stockholm. Other significant variables that
positively affect demand are the level of attractiveness of the listing’s main image and the
number of listing images posted. A possible explanation for the significant positive
coefficient of the number of images is that posting a large number of photos conveys the
message that a host has nothing to hide. We control for the number of days some of the
hosts blocked their listing by adding the number of blocked days to the estimation.
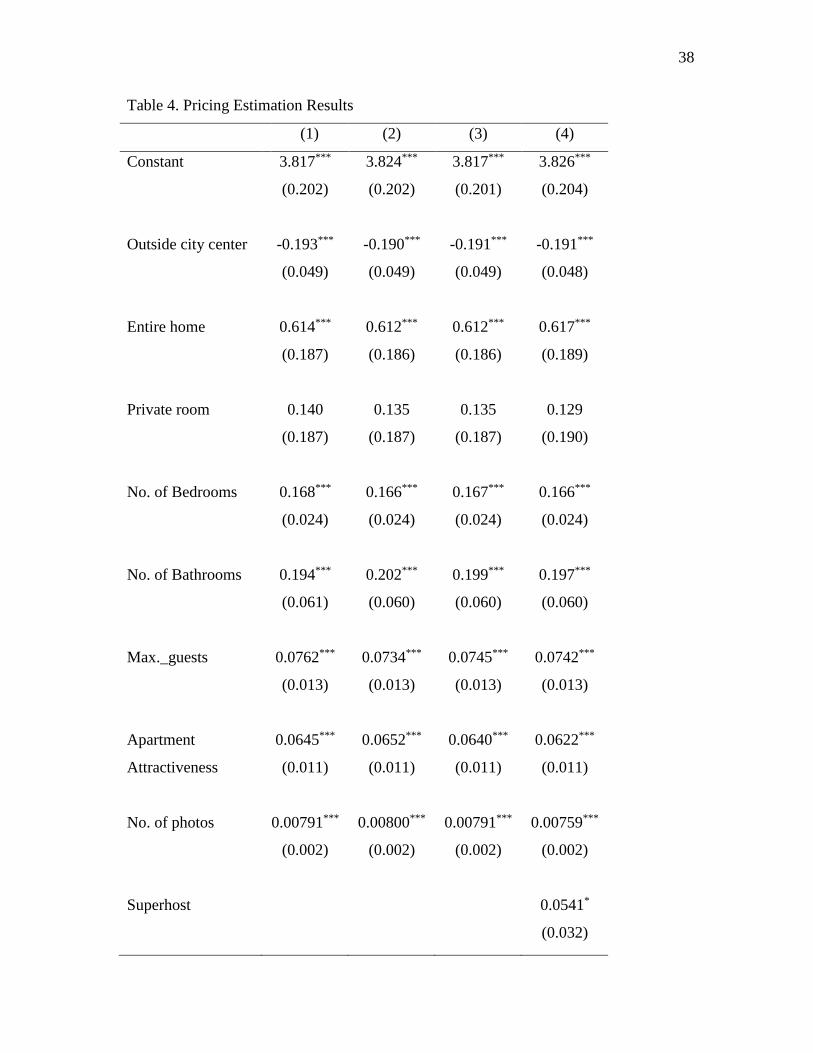
Table 4 presents the results for the pricing equation. The estimated coefficients in
the table reflect the effect of the attributes on marginal cost. Estimation results suggest
that listings located outside the city center enjoy lower marginal cost, whereas the cost of
an entire home is higher than that of shared rooms and private rooms. Costs increase with
the size of the apartment (number of bedrooms, bathrooms, and maximum number of
guests) and the attractiveness of the interior decoration (‘apartment mean’ and ‘number of
photos’). In Model 4, the Superhost certification was included in the pricing equation
under the assumption that in order to excel, hosts with such certification face higher
costs. The coefficient is positive, but not significant.
-------------------put Table 4 here ----------------

21
5 Simulations of Stockholm’s Airbnb Market Equilibrium
Given the estimated parameters, the system of demand and pricing equations (1) and (2)
comprises an equilibrium model of the Stockholm Airbnb market. Exogenous to the
equilibrium model are the host and listing attributes. After an exogenous change in host
and/or listing attributes, the model searches for sets of 576 listing prices (i.e., ADR) and
quantities (i.e., number of reservation days) that simultaneously solve the demand and
pricing equations in equilibrium.
Table 5 presents the results of simulating the equilibrium of Stockholm’s Airbnb
market in two scenarios. The first simulation was intended to evaluate the role of the
hosts’ attributes in a scenario in which there are no Superhosts and the reputation
indicators are taking a plunge. In the second one, we simulated a scenario in which the
physical attributes of the property had improved—a move from Airbnb to “Airbnb plus”
—the category within Airbnb that offers more luxurious listings. In each simulation, we
were able to evaluate the effects of the changes on the number of reservation days, the
ADR, profits, consumer surplus (see Appendix 2 for details), and total welfare of the
market. It should be noted that the simulaions take into considaration the optout option
of hotels as an outside good. For example, when we lower the reputation of all the listings
consumers have the option to choose not to stay in any Airbnb apartment and choose to
stay in hotels in the accomodation market of Stokholm. The different listings do not only
compete with each other they also compete with hotels in the accomodation market. Thus
the absulte change in the level of repuatation of all Airbnb listings does make a
difference.
-----------------------put Table 5 here----------------------
5.1 Simulation 1: Change in the hosts’ attributes – lower review scores and no
Superhosts
The purpose of this simulation was to test the effect of the hosts’ attributes on the market.
Ostensibly, they should not have affected the market, since they do not describe the
product traded in the market. However, as we showed in the estimated model, they do
play a significant role in the market. As mentioned above, high review scores are very

22
important for Airbnb in its competition with the hotels in the accommodation market. The
same holds true for the Superhost certification. These two attributes assist Airbnb in
overcoming its image as a risky P2P platform. Thus, in this simulation we tested what
would happen if we eliminated the Superhost certification (currently held by
approximately 20 percent of the market) and lowered the review score to the same level
hotels in Europe receive on Booking.com. We employed the data of hotels’ rankings in
Paris, London, Barcelona, Vienna and Berlin from Ert et al.’s (2016) study. Based on the
distribution of the rankings from these locations, we shifted and scaled Airbnb’s review
scores so they would have the same mean and SD as those of the hotels.7 Under this
scenario, Airbnb market suffers a 34 percent reduction in reservation days. In our model,
this means that these reservations shifted to hotels. ADR decreased by one percent,
implying that demand decreased even more, but it was offset by the price decrease. Profit
decreased by 35 percent and consumer surplus by 42 percent. These results demonstrate
the importance of reputation and quality certification in Airbnb’s market. They explain
why Airbnb implemented the Superhost certification although it is correlated with the
review score. It also explains why Airbnb does not make an effective effort to change the
very high review scores. As mentioned above, these very high review scores do not
provide the necessary information about the hosts in this market, in which trust plays an
important role. Nevertheless, it is in Airbnb’s interest to keep the review scores high in
order to maintain a competitive edge over hotels in the same location.
5.2 Simulation 2: Change in the listings’ attributes – A move towards Airbnb plus
Airbnb is moving slowly toward offering more luxury apartments and boutique
accommodations. As mentioned above, their new line of luxury accommodation is called
“Airbnb plus” (https://www.airbnb.com/plus). In light of the fact that Airbnb positioned
itself in its early years as a low-cost alternative to hotels, this recent development is
significant. We attempted to simulate this change by increasing the number of bedrooms
by one in listings with an entire apartment only. We also increased the apartment’s
7 Mean and SD of the review score of the hotels are 7.73 and 0.62 respectively on a scale of 1 to
10. In the simulation, we normalized it to the scale of 1 to 5 as it is used in Airbnb, resulting in a mean of
3.86 and an SD of 0.31.
23
attractiveness score (based on its photos), which reflects improvement in the design of the
interior decoration. With these changes in the accommodations’ attributes, we simulated
an upscaling of the Airbnb market in Stockholm. This resulted mainly in a 24 percent
increase in ADR. Demand increased by 24 percent despite the price increase. Profit and
consumer surplus increased by 57 percent and 60 percent respectively. From this
simulation, we can infer that the Airbnb market seems to benefit by positioning itself as
offering luxury accommodations, despite the fact that its initial positioning focused on its
being cheaper than hotels. This situation may explain Airbnb’s move to a level of
accommodation similar to that of the hotels with which it is competing.

24
6 Conclusions
Peer-to-peer market platforms, particularly those associated with the “sharing economy,”
are based on trust between buyers and sellers. Therefore, these platforms present not only
product information, but also substantial information about their sellers, indicating the
importance of trust to their success. Consequently, products in P2P service markets are
not differentiated from one another only in terms of their physical attributes, but also in
terms of their sellers’ attributes, which are interpreted as trust signals.
In this paper, we introduced a framework for identifying the role of trust and its
importance to economic performance in P2P platforms. To that end, we used a
differentiated goods model that takes into account differentiation in the attributes of both
products and their sellers. The empirical model also provides a convenient framework for
market-equilibrium simulations, which we use to examine the effect of the different
attributes on economic welfare. We applied our model to the Stockholm Airbnb market
by using numerical, visual, and textual data from different sources that described the
sellers’ attributes. We also simulated different market equilibria to evaluate the full
impact of the different attributes, since some appear in both the demand and pricing
equations.
We showed that although the Airbnb market in Stockholm is a differentiated
goods market, it is a competitive market with relatively high demand elasticity. The
simulation results suggest an explanation for why it is in the interest of these platforms to
retain the uninformative high review scores and introduce an additional quality
certification. Specifically, the simulations show that lowering the review scores and
eliminating the certification will cause guests to move to hotels in the city, resulting in a
reduction in profit and consumer surplus. We also explain the shift in the positioning of
Airbnb from an inexpensive alternative to hotels to a closer substitute for hotels by
introducing an upscale line of luxury accommodations.
We provide insight into the role of sellers’ attributes in P2P markets and show
how they can be deployed in order to increase the market welfare. Airbnb changed
sellers’ attributes over time, altering their dominance on the search page and adding
additional ones, and we showed the economic rationale behind these actions. We

25
demonstrated that Airbnb utilizes its unique capabilities as an online platform in order to
compete with hotels—the traditional products in the market. This significant insight, that
it is possible to increase profit by changing the attributes of the sellers only, can be
applied to other P2P markets.
This paper takes a first step in offering not a partial analysis of P2P markets (as its
predecessors did), but rather a full market economic model that considers not only the
equilibrium in the market, but also the effect of an outside good, i.e., hotels in our case.
Thus, it suggests a reasonable and relatively simple extension of the differentiated goods
modeling approach that enables the assessment of P2P markets.
Our work has a number of limitations, some of which can point to fruitful areas
for future research. In this study, we focused on the Stockholm Airbnb market, which
shares its main important features with other Airbnb markets (e.g., the online platform),
but certainly includes some specific attributes (e.g., the city’s structure). Accordingly, in
order to address the generalizability of current market and results future studies could
compare them with those of other cities in different areas in the world. Another fruitful
possibility for future research would involve assessing the role of the trust indicator in
more traditional P2P markets where sellers and buyers do not meet offline, such as eBay.
The framework developed in this study could be used for such purposes.

26
7 References
Berry, S., Levinsohn, J., & Pakes, A. (1995). Automobile prices in market equilibrium.
Econometrica: Journal of the Econometric Society, 841–890.
Berry, S. T. (1994). Estimating discrete-choice models of product differentiation. The
RAND Journal of Economics, 242–262.
Björnerstedt, J., & Verboven, F. (2016). Does merger simulation work? Evidence from
the swedish analgesics market. American Economic Journal: Applied Economics,
8(3), 125–164.
Bolton, G., Greiner, B., & Ockenfels, A. (2013). Engineering trust: Reciprocity in the
production of reputation information. Management Science, 59(2), 265–285.
Cabral, L., & Hortacsu, A. (2010). The dynamics of seller reputation: Evidence from
eBay. The Journal of Industrial Economics, 58(1), 54–78.
Cardell, N. S. (1997). Variance Components Structures for the Extreme-Value and
Logistic Distributions with Application to Models of Heterogeneity. Econometric
Theory, 13(2), 185–213. https://doi.org/10.1017/S0266466600005727
Charness, G., Haruvy, E., & Sonsino, D. (2007). Social distance and reciprocity: An
Internet experiment. Journal of Economic Behavior & Organization, 63(1), 88–
103. https://doi.org/10.1016/j.jebo.2005.04.021
Edelman, B., & Luca, M. (2014). Digital Discrimination: The Case of Airbnb. com.
Harvard Business School NOM Unit Working Paper, 14–054. http://www.west-
info.eu/files/airbnb_research.pdf
Edelman, B., Luca, M., & Svirsky, D. (2017). Racial discrimination in the sharing
economy: Evidence from a field experiment. American Economic Journal:
Applied Economics, 9(2), 1–22.
Einav, L., Farronato, C., & Levin, J. (2016). Peer-to-peer markets. Annual Review of
Economics, 8, 615–635.
Eizenberg, A., Lach, S., & Yiftach, M. (2018). Retail Prices in a City.

27
Elfenbein, D. W., Fisman, R., & McManus, B. (2015). Market structure, reputation, and
the value of quality certification. American Economic Journal: Microeconomics,
7(4), 83–108.
Ert, E., & Fleischer, A. (2019). The evolution of trust in Airbnb: A case of home rental.
Annals of Tourism Research, 75, 279–287.
Ert, E., Fleischer, A., & Magen, N. (2016). Trust and reputation in the sharing economy:
The role of personal photos in Airbnb. Tourism Management, 55, 62–73.
https://doi.org/10.1016/j.tourman.2016.01.013
Fradkin, A., Grewal, E., & Holtz, D. (2018). The determinants of online review
informativeness: Evidence from field experiments on Airbnb. Available at SSRN:
Https://Ssrn.Com/Abstract=2939064.
Gefen, D., & Straub, D. W. (2004). Consumer trust in B2C e-commerce and the
importance of social presence: Experiments in e-products and e-services. Omega,
32(6), 407–424.
Gunter, U. (2018). What makes an Airbnb host a superhost? Empirical evidence from San
Francisco and the Bay Area. Tourism Management, 66, 26–37.
Konovalova, A. A., & Vidishcheva, E. V. (2013). Elasticity of demand in tourism and
hospitality. European Journal of Economic Studies, 2, 84–89.
Lanza, A., Temple, P., & Urga, G. (2003). The implications of tourism specialisation in
the long run: An econometric analysis for 13 OECD economies. Tourism
Management, 24(3), 315–321.
Li, H., & Srinivasan, K. (2019). Competitive Dynamics in the Sharing Economy: An
Analysis in the Context of Airbnb and Hotels. Marketing Science.
Livingston, J. A. (2005). How valuable is a good reputation? A sample selection model of
internet auctions. Review of Economics and Statistics, 87(3), 453–465.
Ma, X., Hancock, J. T., Mingjie, K. L., & Naaman, M. (2017). Self-Disclosure and
Perceived Trustworthiness of Airbnb Host Profiles. CSCW, 2397–2409.
https://s.tech.cornell.edu/assets/papers/ma2017airbnb.pdf
Melnik, M. I., & Alm, J. (2002). Does a Seller’s eCommerce Reputation Matter?
Evidence from eBay Auctions. The Journal of Industrial Economics, 50(3), 337–
349. https://doi.org/10.1111/1467-6451.00180

28
Shoval, N., McKercher, B., Ng, E., & Birenboim, A. (2011). Hotel location and tourist
activity in cities. Annals of Tourism Research, 38(4), 1594–1612.
Stockholm Hotel Report 2018. (n.d.). Mynewsdesk. Retrieved January 8, 2019, from
http://www.mynewsdesk.com/investstockholm/documents/stockholm-hotel-
report-2018-82659
Tadelis, S. (2016). Reputation and feedback systems in online platform markets. Annual
Review of Economics, 8, 321–340.
Tchetchik, A., Fleischer, A., & Finkelshtain, I. (2008). Differentiation and synergies in
rural tourism: Estimation and simulation of the Israeli market. American Journal
of Agricultural Economics, 90(2), 553–570.
Train, K. E. (2009). Discrete Choice Methods with Simulation. Cambridge University
Press.
Zervas, G., Proserpio, D., & Byers, J. (2015). A First Look at Online Reputation on
Airbnb, Where Every Stay is Above Average. Where Every Stay Is Above
Average (January 23, 2015).
http://papers.ssrn.com/sol3/papers.cfm?abstract_id=2554500

29
Appendix 1
Own Price Elasticity in the One-Level Nested Logit Constant Expenditure Demand
Model
We rely on Björnerstedt and Verboven’s (2016) two-level nested logit constant expenditure
demand model, which generates the following analytic expressions for price elasticities
(B&V pages 159–160):
(A.10) 13
/
2
22
/
21
1
1 11
1
1
1
1
1jkjjkgjjkhgjjk
k
j
j
k DsDsDsDq
p
p
q−
−
−−
−−
−−
−−=
where 1
jkD , 2
jkD and 3
jkD are dummy variables defined as follows: 11 =jkD if j=k, 12 =jkD
if j and k are in the same subgroup, and 13 =jkD if j and k are in the same group (and zero
otherwise). The indices g and h are the group and subgroup indices, respectively. 21, are
the nesting parameters associated with the nested logit distribution, measuring the
preference correlation across products of the same subgroup or group. If 02 = , the model
reduces to the one-level nested logit (as specified in our context), and if 021 == the
model reduces to the familiar logit model, so preferences are not correlated across products
of the same subgroups or groups.
In order to get the expression for the own price elasticity in the one-level nested
logit constant expenditure demand model, 1321 === jkjkjk DDD , and 02 = need to be set
in (A.10).8
(A.11)
−
−−−−−−=
−
−−−−−+−−=
=−
−+
−−
−−=−
−
−
−−
−−=
1
)1()1(1
1
)1()1()1(1
111
111
1
1
1
1
///
/
/
/
jgjjgjgj
jgj
gj
jgj
j
j
j
j
sssss
sss
ssq
p
p
q
8 All the dummy variables are equal to 1 since j=k. Moreover, indices “h” and “1” are redundant
when reducing to one-level nested logit.

30
31
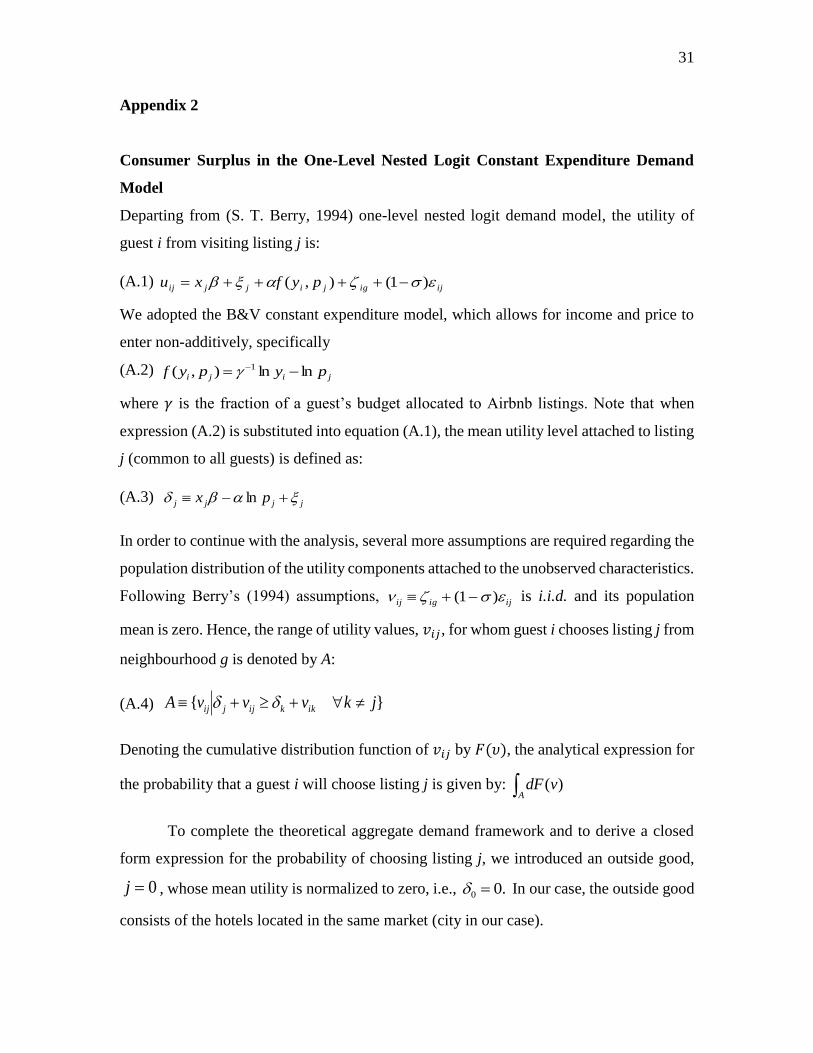
Appendix 2
Consumer Surplus in the One-Level Nested Logit Constant Expenditure Demand
Model
Departing from (S. T. Berry, 1994) one-level nested logit demand model, the utility of
guest i from visiting listing j is:
(A.1) ijigjijjij pyfxu )1(),( −++++=
We adopted the B&V constant expenditure model, which allows for income and price to
enter non-additively, specifically
(A.2) jiji pypyf lnln),( 1 −= −
where 𝛾 is the fraction of a guest’s budget allocated to Airbnb listings. Note that when
expression (A.2) is substituted into equation (A.1), the mean utility level attached to listing
j (common to all guests) is defined as:
(A.3) jjjj px +− ln
In order to continue with the analysis, several more assumptions are required regarding the
population distribution of the utility components attached to the unobserved characteristics.
Following Berry’s (1994) assumptions, ijigij )1( −+ is i.i.d. and its population
mean is zero. Hence, the range of utility values, 𝑣𝑖𝑗, for whom guest i chooses listing j from
neighbourhood g is denoted by A:
(A.4) }{ jkvvvA ikkijjij ++
Denoting the cumulative distribution function of 𝑣𝑖𝑗 by 𝐹(𝜐), the analytical expression for
the probability that a guest i will choose listing j is given by: A vdF )(
To complete the theoretical aggregate demand framework and to derive a closed
form expression for the probability of choosing listing j, we introduced an outside good,
0=j , whose mean utility is normalized to zero, i.e., .00 = In our case, the outside good
consists of the hotels located in the same market (city in our case).

32
Following (Cardell, 1997), it can be shown that the joint distribution of 𝑣𝑖𝑗 is given by:
𝑣 ∼ exp [− ∑ (∑ 𝑒𝑣𝑗
𝜎𝐺𝑔
𝑗=1)
𝜎𝐺𝑙=1 ] where
gG denotes the set of listings in neighbourhood g.
Employing the above distributional assumptions, the familiar closed form expression for
the probability that a guest i will choose a listing j belonging to neighbourhood g is:
(A.5)
( )
II
I
II
II
I
II
I
I
I
I
G
g GjGjg GjGj
j
ee
e
ee
e
eee
e
eee
e
ee
ee
ee
e
ee
es
gG
j
gGgG
j
gGgG
j
gG
gG
j
gG
gG
j
g
j
g
j
j
g
j
g
j
j
=
=
=
=
=
+
=
=
−
−
−
−−
−
−
−−
−
−
−−
−
−
−
=
−
−
−
−
−
−
−
−
1
1
1
)1(
1
)1(
)1(
1
1
1
1
1
1
1
1
11
1
1
11
1
1
,
where gGI and I are the “inclusive values” defined by:
(A.6)
+=
=
−=
=
−
−
−
G
g
I
GjGj
G
gG
g
j
g
j
g
eI
eeI
1
1
11
1ln
lnln)1(
The expected utility of a random consumer (guest) i in utiles is:
(A.7) IeuEEUG
g
gGI
Jj
iji =
+=
=
= 1
1lnmax
Following (Train, 2009), we convert utiles to monetary terms by dividing the expected
utility iEU by the marginal utility of income iij yu to get:
(A.8) i
G
g gGj
j
i
G
g gGj
j
i
i
iij
ii y
e
y
e
y
EU
yu
EUCS
+
=
+
==
=
=
−
−
=
−
−
1
1
1
1
1
1 1ln1ln
the consumer surplus (per consumer).

33
Define =
=N
i
iyY1
as the total income of all N consumers in the economy. Following B&V
we define YB = as the total potential budget allocated to the differentiated listings in the
economy. Therefore, the total consumer surplus is:
(A.9) B
e
Y
e
CSCS
G
g gGj
jG
g gGj
j
N
i
i
+
=
+
==
=
−
−
=
−
−
=
1
1
1
1
1
1
1
1ln1ln

34
Table 1. Descriptive Statistics
Variable Scale Mean Std. Dev.
ADR ($) 145.73 86.21
Revenue share 0.0017 0.0015
Block share 0.04 0.06
Outside city center Outside=1 0.06
Review score 1-5 4.72 0.24
Entire home Entire=1 0.79
Private room Private=1 0.20
No. of photos 12.55 7.82
Apartment attarctivness 1-10 6.11 1.23
No. of bedrooms 1.21 0.72
No. of bathrooms 1.08 0.26
Verified Verified=1 0.61
Superhost Super=1 0.19
Max._guests 2.95 1.43
Visual Trustworthiness 1–10 6.10 0.83
Word count 28.14 35.98

35
Table 2: Comparison of the final data (576 listings) with the 583 (1159-576) listings’ data
Data 576 Data 583
Mean Std. Mean Std.
ADR 145.73 86.21 138.43 85.19
Prop. blocking days 0.04 0.06 0.04 0.05
Outside of city center 0.07 0.26 0.07 0.25
Review score 4.72** 0.24 4.67 0.40
Entire home 0.79** 0.41 0.85 0.35
Private room 0.20*** 0.40 0.13 0.34
No. of listing photos 12.55** 7.82 11.14 7.47
No. of bathrooms 1.08 0.26 1.07 0.24
Verified host 0.61*** 0.49 0.41 0.49
Superhost 0.17*** 0.38 0.08 0.27
Multiple apartments 0.28 0.45 0.26 0.44
No. of reservations 19.05*** 13.51 11.90 10.77
No. of bedrooms 1.21 0.71 1.15 0.75
Maximum guests 2.95 1.43 2.95 1.38
Response time (min) 390.57 438.80 361.04 437.76
*p<0.05, **p<0.01, ***p<0.001, for the differnce between the means of the two datasets

36
Table 3. Demand Estimation Results
(1) (2) (3) (4)
Constant -0.970 -3.357 -3.775 -3.822
(3.830) (3.455) (2.911) (2.924)
Block share -0.686 -1.139 -0.944 -0.981
(1.143) (1.312) (1.126) (1.130)
Outside city -1.266*** -1.459*** -1.298*** -1.299***
center (0.289) (0.362) (0.291) (0.292)
Entire home 4.028*** 4.765*** 4.131*** 4.144***
(1.026) (1.276) (1.041) (1.044)
Private room 1.972*** 2.302*** 2.018*** 2.026***
(0.610) (0.810) (0.662) (0.665)
No. of Bedrooms 1.154*** 1.343*** 1.108*** 1.113***
(0.319) (0.364) (0.297) (0.298)
No. of Bathrooms 1.137*** 1.344*** 1.119*** 1.118***
(0.428) (0.499) (0.400) (0.402)
Apartment 0.289*** 0.316*** 0.243*** 0.245***
attractiveness (0.099) (0.109) (0.086) (0.087)
No. of photos 0.0469*** 0.0526*** 0.0424*** 0.0427***
(0.014) (0.016) (0.012) (0.012)
Verified 0.255** 0.224 0.181 0.183
(0.121) (0.138) (0.119) (0.119)
37
Word count 0.00205 0.00182 0.00142 0.00142
(0.002) (0.002) (0.002) (0.002)
Visual 0.097* 0.0570 0.0509 0.0570
Trustworthiness (0.06) (0.071) (0.064) (0.064)
Review 1.089** 0.670* 0.673*
score (0.444) (0.366) (0.366)
Superhost 0.535*** 0.530***
(0.165) (0.166)
Joint Parameters
Alpha 3.682*** 4.485*** 3.631*** 3.642***
(1.215) (1.424) (1.140) (1.144)
Sigma 0.206*** 0.191** 0.214*** 0.211***
(0.075) (0.081) (0.073) (0.073)
Standard errors in parentheses
*p<0.05, **p<0.01, ***p<0.001
38
Table 4. Pricing Estimation Results
(1) (2) (3) (4)
Constant 3.817*** 3.824*** 3.817*** 3.826***
(0.202) (0.202) (0.201) (0.204)
Outside city center -0.193*** -0.190*** -0.191*** -0.191***
(0.049) (0.049) (0.049) (0.048)
Entire home 0.614*** 0.612*** 0.612*** 0.617***
(0.187) (0.186) (0.186) (0.189)
Private room 0.140 0.135 0.135 0.129
(0.187) (0.187) (0.187) (0.190)
No. of Bedrooms 0.168*** 0.166*** 0.167*** 0.166***
(0.024) (0.024) (0.024) (0.024)
No. of Bathrooms 0.194*** 0.202*** 0.199*** 0.197***
(0.061) (0.060) (0.060) (0.060)
Max._guests 0.0762*** 0.0734*** 0.0745*** 0.0742***
(0.013) (0.013) (0.013) (0.013)
Apartment 0.0645*** 0.0652*** 0.0640*** 0.0622***
Attractiveness (0.011) (0.011) (0.011) (0.011)
No. of photos 0.00791*** 0.00800*** 0.00791*** 0.00759***
(0.002) (0.002) (0.002) (0.002)
Superhost 0.0541*
(0.032)

39
Standard errors in parentheses
*p<0.10, **p<0.05, ***p<0.01

40
Table 5. Simulation Results
Current Simulation 1: Simulation 2:
No Superhosts,
and review
score
distribution
transfer
An additional
room in each
apartment,
and apartment
attractiveness
increases by
10%
Reservation
days
40,628 -34% 24%
ADR ($US) 145 -1% 21%
Profit ($US) 1,077,633 -35% 57%
Consumer
surplus ($US)
2,968,470 -42% 60%
Total welfare
($US)
4,046,103 -40% 59%