Discussion Paper No. 2001/72 Public Finance and … analyzed within both the neoclassical and...
29
Copyright ã UNU/WIDER 2001 * UNU/WIDER This study has been prepared within the UNU/WIDER project on “New Fiscal Policies for Growth and Poverty Reduction”. Project Director: Tony Addison UNU/WIDER gratefully acknowledges the financial contribution to the project by the Government of Italy (Directorate General for Development Cooperation). Discussion Paper No. 2001/72 Public Finance and Economic Growth Empirical Evidence from Developing Countries Matthew O. Odedokun* September 2001 Abstract The study is an empirical test of the effects of different categories of government expenditure, revenue and deficits on economic growth in developing countries. It is based on panel data of annual series over the last three decades for 103 countries, which are further classified into low-income, high-income, mineral exports dependent, and foreign aid dependent groups. Our findings suggest that the effects of the fiscal variables on growth vary across these groups of countries. But broadly, capital expenditure have been detrimental to growth, just as current expenditure on goods and services, while expenditure on wages and salaries is growth-promoting. …/… Keywords: fiscal policy, public finance, economic growth JEL classification: O23, O40
Transcript of Discussion Paper No. 2001/72 Public Finance and … analyzed within both the neoclassical and...
Copyright� UNU/WIDER 2001
* UNU/WIDER
This study has been prepared within the UNU/WIDER project on “New Fiscal Policies for Growth andPoverty Reduction”. Project Director: Tony Addison
UNU/WIDER gratefully acknowledges the financial contribution to the project by the Government ofItaly (Directorate General for Development Cooperation).
Discussion Paper No. 2001/72
Public Financeand Economic Growth
Empirical Evidencefrom Developing Countries
Matthew O. Odedokun*
September 2001
Abstract
The study is an empirical test of the effects of different categories of governmentexpenditure, revenue and deficits on economic growth in developing countries. It isbased on panel data of annual series over the last three decades for 103 countries, whichare further classified into low-income, high-income, mineral exports dependent, andforeign aid dependent groups. Our findings suggest that the effects of the fiscalvariables on growth vary across these groups of countries. But broadly, capitalexpenditure have been detrimental to growth, just as current expenditure on goods andservices, while expenditure on wages and salaries is growth-promoting. …/…
Keywords: fiscal policy, public finance, economic growth
JEL classification: O23, O40
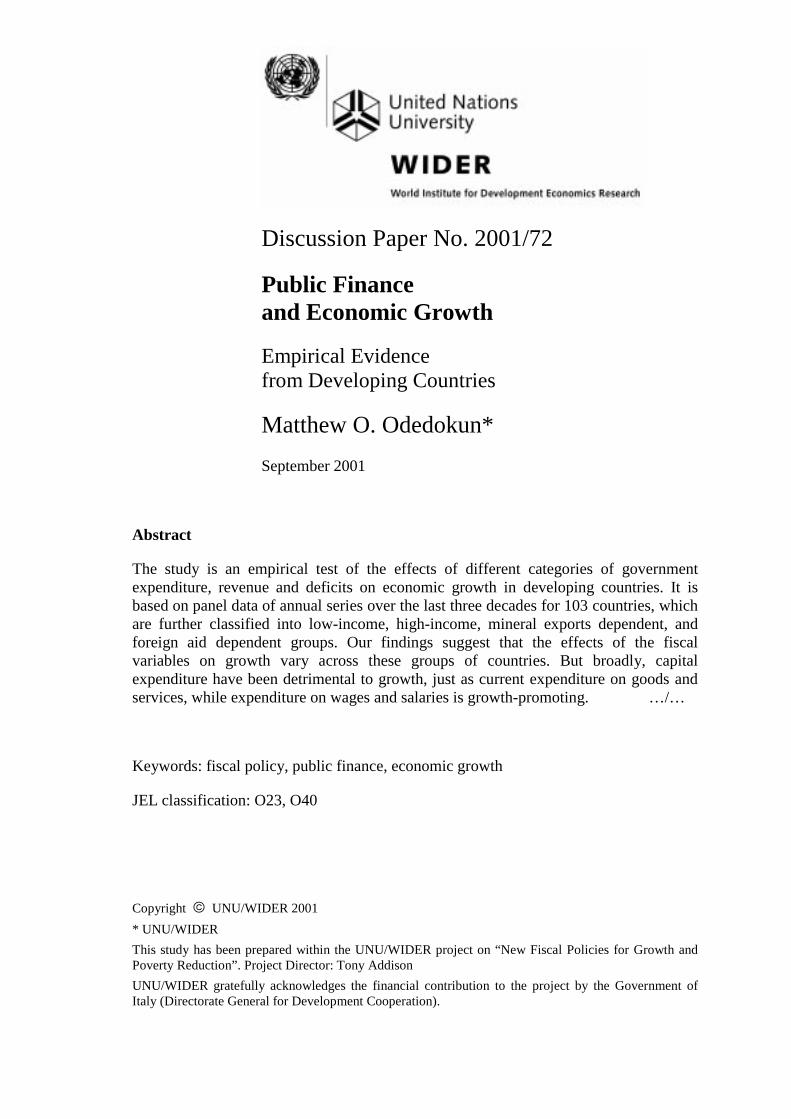
Also, functional expenditure on general administration and defense have retardedgrowth while spending on education and, to some extent, transport and communicationssector are growth-friendly. Other economic and functional categories of spendinggenerally have mixed effects, which are sometimes statistically insignificant. Non-taxrevenue retards growth in only high-income and mineral exporting groups of countries.Taxes on income and profits are growth-retarding, just as taxes on domestic goods andservices in all groups, except mineral exporting one. Taxes on international trade arefound to be growth-promoting in only the low-income and foreign aid dependent groupsof countries. Foreign grants promote growth in only the group of countries that heavilydepend on them while fiscal deficits, whether domestically or foreign financed, retardgrowth.
Acknowledgements
Presented at the United Nations University/World Institute for Development EconomicsResearch (UNU/WIDER) Project Meeting on Fiscal Policies for Growth and PovertyReduction, Helsinki, Finland, 17-18 November 2000.
Comments provided by colleagues on the initial draft are gratefully acknowledged. Butany errors and omissions are those of the author alone.
1
1 Introduction
Public expenditure accounted for over 25 percent of GDP in developing countries in thelast three decades (see Table 1). Thus, while public expenditure and revenue do notcapture the totality of public actions on the economy, they do account for the bulk of it.Therefore, an understanding of how public actions can be better shaped in improvingthe economy requires a knowledge of the direction and magnitude of the effects ofgovernment expenditure and revenue on economic growth—the promotion of which hasalways been a central objective of public finance.
For this reason, the role of public expenditure and their sources of finance on economicgrowth has been attracting some attention in the literature, particularly since early1990s. At the theoretical level, the direction of effects of expenditure and taxation hasbeen analyzed within both the neoclassical and endogenous growth frameworks, butwith neither a categorical consensus nor unanimous conclusion as to whether theexpenditure or taxation has unambiguous effect—whether positive or negative—ontransitional growth rate (in the case of neoclassical paradigm) or steady-state growthpath (within the endogenous growth approach). The ambiguity is even more pronouncedat the empirical level, as mixed results pervade the literature. As aptly concluded byAgell et al..(1997, p. 33), “...the theoretical and empirical evidence … is found to admitno conclusion on whether the relation is positive, negative or non-existent”.
In an attempt to further narrow down the often conflicting empirical findings, effortslater moved from an analysis of the effects of aggregate government spending andrevenue on economic growth to an examination of the effects of different categories ofspending and revenue so as to identify which of them can be labeled “productive” and“unproductive”. Studies reported by Easterly and Rebelo (1993) and Devarajanet al.(1996) were among the earliest under this category, when viewed from a multi-countryand developing country perspective. But, even then, the lack of unanimity in thefindings has still existed. In part, this is probably due to differences in the compositionof countries sampled, as the effects of each item of government expenditure and revenueon growth is likely to be conditioned by the context or environment in which it takesplace—e. g. whether it is in a low- or high-income country as well as whether it is in acountry that depends on “windfall” or “gratuitous” external sources of finance.
Following from the foregoing, the present study would try to shed further light on theunresolved issues by focusing on different groups of developing countries, based on thelevel of per capita income as well as on the degree of dependence of the budget onexternal “windfall” and “gratuitous” sources of finance.1 It will also present a moredisaggregated analysis of the fiscal variables, and report an updated evidence from amore comprehensive list of developing countries, as most of the existing studies have
1 The “windfall” external sources of finance in the budget is used here to mean dependence on revenuefrom export of petroleum and other minerals while “gratuitous” external sources refer to theproportion of expenditure financed through foreign grants. Strictly speaking, revenue from petroleumand other minerals are not derived from exports as such but from production, whether exported or not,in the form of royalties and profit tax.
2
been based on developed country data sets.2 Annual panel data over 1970s to 1990s forover 100 developing countries are employed in the study.
The remaining discussion is organized into 4 sections. The next section is on literaturereview. In section 3, we spell out the rationale for the study, describe the model andmethod of its estimation; and discuss the data employed. The empirical results arepresented in section 4 while section 5 is on summary and conclusion. An appendixlisting the countries covered is provided at the end of the text.
2 Brief literature review
At the theoretical level, neoclassical growth model of different shades have been used instudying the effects of government expenditure and taxation on growth. A commonfeature of all neoclassical models is that policies, fiscal or otherwise, can only affect thelevel of income but not the steady state economic growth rate—which can only beaffected by the rate of technological change and population (or labor force) growth.However, policies can affect the speed of transition from one steady state to anotherand, hence, economic growth during the transition. So, assumption of the economybeing in transit from one steady-state to another has to be invoked for policies to berelevant in determining growth rate—see Barro and Sala-i-Martin (1995) and Temple(1999). As reviewed in Easterly and Rebelo (1993), some—e.g. Sato (1967) andFeldstein (1974)—used Solow’s (1956) version while others—like Judd (1985) andChamley (1986)—use the variant developed by Cass (1965) and Coopmans (1965).
More recently, however, the endogenous growth theory was developed by Romer(1986), Lucas (1988) and others. Within this framework, polices can affect steady-stategrowth rate and not just the growth rate during the transition from one steady-state toanother. Following this development, a number of studies—e.g. Barro (1990) andCashin (1995)—have tried to model the effects of government expenditure and taxes onsteady state growth.
Whether based on the neoclassical or endogenous growth framework, the predictionemerging from many of the theoretical studies is that taxes on investment and incomehinder growth, particularly by reducing returns to (and, hence, accumulation of) capital.Similarly, neutral or negative effects of government consumption expenditure andpositive effects of government investment expenditure have often been predicted(Aschauer, 1989). But these outcomes depend on the assumptions made, as some otherstudies utilizing a different set of assumptions do generate contrary predictions. Theprediction of the effects of fiscal deficits on growth is equally mixed, with negativeeffects being applicable—within the context of infinite horizon models - when a higherdeficit today is assumed to be eliminated in future through taxes on income orconsumption. Alogoskoufis and Ploeg (1991) employed an overlapping generationmodel to predict negative effects of fiscal deficits on savings rate and growth.
2 Annual panel data over 1970s to 1990s for over 103 developing countries (see the appendix) areemployed in the study—the most comprehensive of the limited number of studies based on developingcountries ever reported in the literature.
3
At the empirical level, there have been a number of studies testing for the effects ofaggregate government spending (or, sometimes, government consumption andinvestment spending separately considered) and taxation on growth. Some of these arebased on time series studies for a single country or a number of countries, as in Ram(1986) and Roy and Vadlamudi (1998), while others employ cross-country data, as inBarro (1991) and Odedokun (1997). Later, research efforts started to focus on anexamination of the effects of different economic and functional categories ofgovernment expenditure as well as taxes on growth. A pioneering study along this line,within a multi-country context, is that of Easterly and Rebelo (1993). Others, like that ofDevarajanet al. (1996), have since been reported and a most recent review of these ispresented in Folster and Henrekson (1999). Here, we only highlight two features ofthese and earlier studies that have been reported. One of the features is the lack ofunanimity in the empirical findings, which often conflict with one another. For instance,while some have identified growth-promoting effects of government investmentspending and selected functional categories of government spending (particularly, oneducation and infrastructure), others have not. The second feature is the fewness ofstudies based on developing countries among those that are being reported, asresearchers appear to be more at ease with the ready availability and high quality offiscal data for developed countries and because of other reasons that have been adducedby Slemrod (1995) and Folster and Henrekson (1999). While some painstaking effortshave actually been made to cover developing countries in a number of studies, as inEasterly and Rebelo (1993), Devarajanet al. (1996) and Odedokun (1997), the numberis relatively very few.
There is therefore the need to further shed light on the rather conflicting findings thathave so far been reported and also to give an exclusive coverage to the developingcountries. Accomplishing these are some of the objectives of the present study.
3 Rationale for the study, model specification and the data
3.1 Rationale for the study
The present study explores or tests for the effects of different categories of governmentspending and revenue on economic growth in developing countries. It also exploreswhether the developing country-wide effects vary between poorer and richer sub-groupsas well as whether the effects depend on the extent to which the government depends onexternal “windfall” revenue from mineral exports and “gratuitous” receipts in the formof grants.
The reason for the focus on developing countries has been adduced above—most of theexisting studies have been based on developed countries. As to the reason for the low-and high-income groups, the effects of public finance on growth are often said to varyaccording the level of per capita income. According to Folster and Henrekson (1999),“Yet, studies that mix rich and poor countries do not necessarily represent a good test ofwhat theory predicts. Theoretical reasoning … point to an expectation of a negativeeffect in countries where the size of the government sector exceeds a certain threshold.In practice, we only observe very large public sectors in rich countries.”
4
Concerning the separate treatments accorded the group of countries that depends onexternal “windfall” revenue from mineral exports and other one that depend on“gratuitous” receipts in the form of official transfers from abroad, the hypothesis to betested is whether dependence on these sources of revenue affects the efficiency of theirutilization. In these groups of countries, especially the group that depend heavily onrevenue and royalties derived from mineral exploitation, the size of government istypically larger. Because of this and due to the fact that there are no specific tax payersfor such revenue sources, the government may be less accountable (to taxpayers that donot really exist as such) and rent-seeking is likely to be more prevalent. It has beenposited, e. g. by Olson (1982), that this type of scenario tends to give rise to evolution oforganized interest groups that seek to promote legislations and government spending ofthe type that retards growth. This type of situation can also promote corruption of thetype that leads to a diversion of government resources into unproductive uses.
3.2 Model specification
Whether based on the neoclassical or endogenous framework, the model often specifiedfor testing the effects of fiscal variables on growth broadly consists of a regressionequation with growth of per capita (or per labor) income as the dependent variable and aset of conditioning variables as well as the fiscal variables of interest as the regressors.3
This same broad approach is adopted in the following study. Specifically, the equationspecified for estimation is of the following form:
gyit = αZit + βXit + uit ….. (1)
where: gy = growth rate of per capita real GDP;
Z = vector of conditioning variables;
X = vector of fiscal variables—either on the expenditure or revenue sidesof budget;
α = vector of parameters of the conditioning variables;
β = vector of parameters of the fiscal variables;
u = stochastic or random term; and
i, t subscripts = country and time subscripts, respectively—because of theuse of panel data.
3.2.1 Conditioning variables
These are not the variables whose parameter estimates are of immediate interest in thestudy. But they are included so that the estimates of the fiscal variable parameters would
3 The interpretations of the resulting parameter estimates, however, differ. Under the neoclassicalsetting, they represent transitional effects on growth rate that is moving from one steady-state toanother while, under the endogenous growth framework, they are interpreted as permanent effects onthe steady-state growth rates.
5
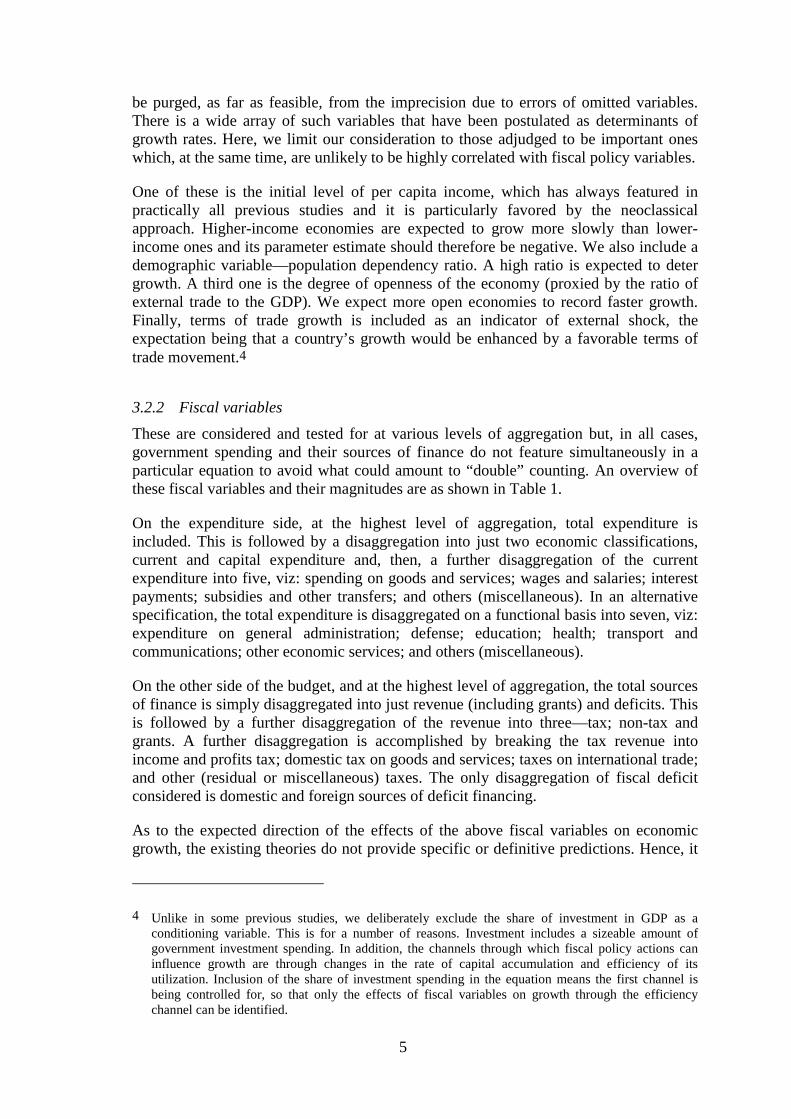
be purged, as far as feasible, from the imprecision due to errors of omitted variables.There is a wide array of such variables that have been postulated as determinants ofgrowth rates. Here, we limit our consideration to those adjudged to be important oneswhich, at the same time, are unlikely to be highly correlated with fiscal policy variables.
One of these is the initial level of per capita income, which has always featured inpractically all previous studies and it is particularly favored by the neoclassicalapproach. Higher-income economies are expected to grow more slowly than lower-income ones and its parameter estimate should therefore be negative. We also include ademographic variable—population dependency ratio. A high ratio is expected to detergrowth. A third one is the degree of openness of the economy (proxied by the ratio ofexternal trade to the GDP). We expect more open economies to record faster growth.Finally, terms of trade growth is included as an indicator of external shock, theexpectation being that a country’s growth would be enhanced by a favorable terms oftrade movement.4
3.2.2 Fiscal variables
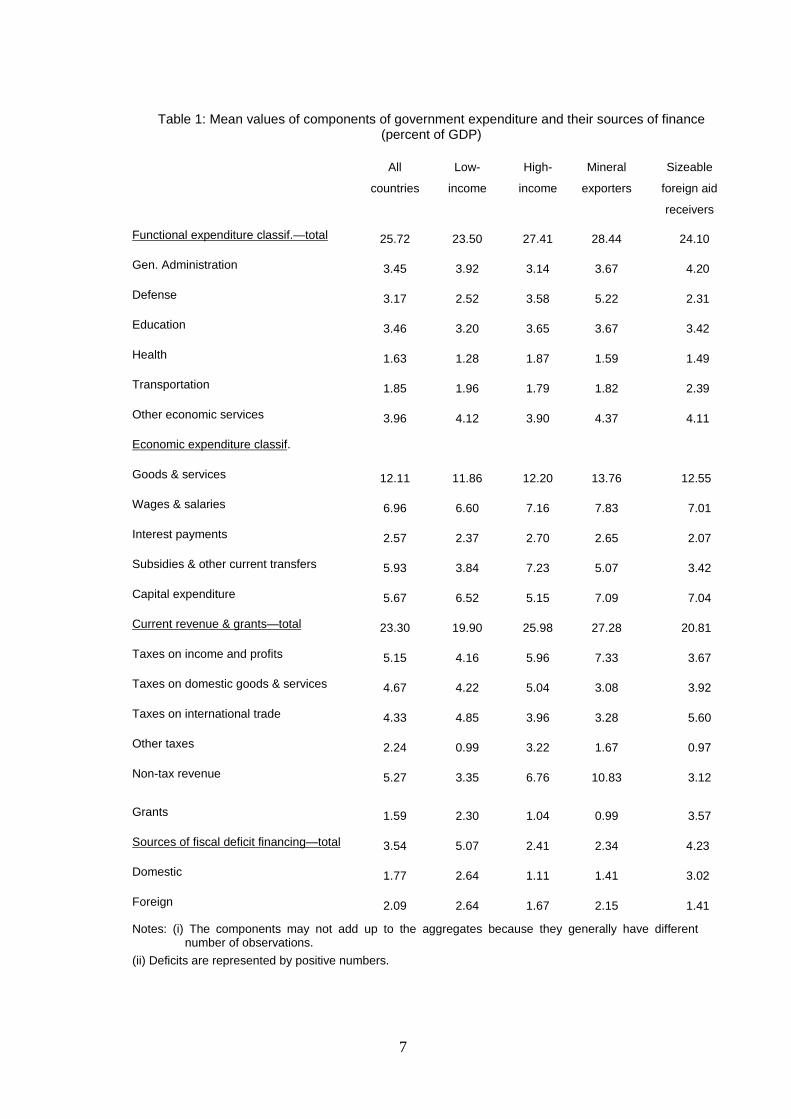
These are considered and tested for at various levels of aggregation but, in all cases,government spending and their sources of finance do not feature simultaneously in aparticular equation to avoid what could amount to “double” counting. An overview ofthese fiscal variables and their magnitudes are as shown in Table 1.
On the expenditure side, at the highest level of aggregation, total expenditure isincluded. This is followed by a disaggregation into just two economic classifications,current and capital expenditure and, then, a further disaggregation of the currentexpenditure into five, viz: spending on goods and services; wages and salaries; interestpayments; subsidies and other transfers; and others (miscellaneous). In an alternativespecification, the total expenditure is disaggregated on a functional basis into seven, viz:expenditure on general administration; defense; education; health; transport andcommunications; other economic services; and others (miscellaneous).
On the other side of the budget, and at the highest level of aggregation, the total sourcesof finance is simply disaggregated into just revenue (including grants) and deficits. Thisis followed by a further disaggregation of the revenue into three—tax; non-tax andgrants. A further disaggregation is accomplished by breaking the tax revenue intoincome and profits tax; domestic tax on goods and services; taxes on international trade;and other (residual or miscellaneous) taxes. The only disaggregation of fiscal deficitconsidered is domestic and foreign sources of deficit financing.
As to the expected direction of the effects of the above fiscal variables on economicgrowth, the existing theories do not provide specific or definitive predictions. Hence, it
4 Unlike in some previous studies, we deliberately exclude the share of investment in GDP as aconditioning variable. This is for a number of reasons. Investment includes a sizeable amount ofgovernment investment spending. In addition, the channels through which fiscal policy actions caninfluence growth are through changes in the rate of capital accumulation and efficiency of itsutilization. Inclusion of the share of investment spending in the equation means the first channel isbeing controlled for, so that only the effects of fiscal variables on growth through the efficiencychannel can be identified.
6
is safer to let them be data-determined or empirically observed. All we can do at thisstage is to review the reasons why some of them might have positive effects and others,negative effects. Government spending of the type that corrects for the existence ofmarket failures (including provision of collective goods and goods with externalities aswell as goods that are typically produced through natural monopolies) are likely topromote growth and this type of government spending are being referred to in theliterature as “productive” government expenditure. Similarly, if the income effect ofhigher income taxes is opposite to and sufficiently very high to offset the (growth-retarding) substitution effect on labor supply, then it too can promote growth. On theother hand, government spending would be growth-retarding if it crowds out privateinvestment and private production; is bedeviled with rent-seeking and corruption; or therequisite expenditure administrative capacity is lacking. In the same vein, taxationwould likely be detrimental to growth by creating a gap between gross and net returnson saving and by being a disincentive to labor supply. This apart, poor taxadministration too can lead to the same result.
7
Table 1: Mean values of components of government expenditure and their sources of finance(percent of GDP)
All
countries
Low-
income
High-
income
Mineral
exporters
Sizeable
foreign aid
receivers
Functional expenditure classif.—total 25.72 23.50 27.41 28.44 24.10
Gen. Administration 3.45 3.92 3.14 3.67 4.20
Defense 3.17 2.52 3.58 5.22 2.31
Education 3.46 3.20 3.65 3.67 3.42
Health 1.63 1.28 1.87 1.59 1.49
Transportation 1.85 1.96 1.79 1.82 2.39
Other economic services 3.96 4.12 3.90 4.37 4.11
Economic expenditure classif.
Goods & services 12.11 11.86 12.20 13.76 12.55
Wages & salaries 6.96 6.60 7.16 7.83 7.01
Interest payments 2.57 2.37 2.70 2.65 2.07
Subsidies & other current transfers 5.93 3.84 7.23 5.07 3.42
Capital expenditure 5.67 6.52 5.15 7.09 7.04
Current revenue & grants—total 23.30 19.90 25.98 27.28 20.81
Taxes on income and profits 5.15 4.16 5.96 7.33 3.67
Taxes on domestic goods & services 4.67 4.22 5.04 3.08 3.92
Taxes on international trade 4.33 4.85 3.96 3.28 5.60
Other taxes 2.24 0.99 3.22 1.67 0.97
Non-tax revenue 5.27 3.35 6.76 10.83 3.12
Grants 1.59 2.30 1.04 0.99 3.57
Sources of fiscal deficit financing—total 3.54 5.07 2.41 2.34 4.23
Domestic 1.77 2.64 1.11 1.41 3.02
Foreign 2.09 2.64 1.67 2.15 1.41
Notes: (i) The components may not add up to the aggregates because they generally have differentnumber of observations.
(ii) Deficits are represented by positive numbers.
8
3.3 Estimation methodology
We are very conscious of the possibility of endogeneity of the right-hand variables, i.e.reverse causation from economic growth to the fiscal variables and most of theconditioning variables discussed above. Most of the previous empirical studies on thesubject have been faulted by subsequent reviewers on this ground. To cater for this, werefrain from relating contemporaneous growth rate with the contemporaneous right-hand variables. Instead, the initial values of the latter (i. e., during year t) are used asregressors in the equation containing 5-year moving average growth rate (i. e. over yeart+1 to year t+5) as the dependent variable. The only exception is the terms of tradegrowth, whose contemporaneous value (also measured as 5-year average growth rate) isexpected to be truly independent of contemporaneous economic growth.5
The study is based on time series (annual) data pooled across the countries into a panel.To derive the estimates, we employ fixed-effect method of panel data estimation. Thistechnique caters for the existence of country-specific factors that do affect economicgrowth by allowing the intercept term to vary across countries.
Also, due to the existence of large variation in the values of the regressors acrosscountries, we correct for possible existence of heteroscedasticity by employing White’s(1980) homoscedasticity-consistent estimation technique.6
3.4 Measurement, scope and sources of the data
The fiscal variables are from the IMF’s Government Finance Statistical Yearbook(GFSY). The terms of trade data are froman unpublished IMF source, just as theinformation used in determining the proportion of merchandise exports accounted for bypetroleum. All other data are from the World Bank’s Economic Development Indicators(electronic format).
The study is based on annual data over 1970 to 1998 for those developing countries forwhich fiscal data are available form the GFSY for at least five consecutive years overthe period and the end-1998 population is not less than half a million.. They total 103countries and their list is provided in the Appendix.
All the fiscal variables are expressed as ratios of GDP. Economic growth is the 5-yearmoving average growth of real GDP per capita, exactly the same approach favored andutilized by Devarajanet al. (1996, p. 322) “so as to eliminate short-term fluctuationsinduced by shifts in public expenditure, and by choosing a moving average, we are ableto increase the number of time series observation in our panel data.” The same approachis used in computing the terms of trade growth.
5 The 5-year moving average growth rate of each of the per capita GDP and terms of trade is computedthrough the least-squares method.
6 The employment of moving average growth rate of per capita GDP as the dependent variable makesthe Durbin-Watson statistic to be much lower than the ideal value of 2. But, because of the panel dataemployed, especially whereby the time series for most of the countries pooled are interrupted withmissing values, the use of DW statistic is hardly applicable in diagnosing serial correlation of theresiduals. Diagnosing the existence of serial correlation of residuals within the context of panel data isstill far from being perfectly resolved in econometric literature.
9
3.5 Classification of countries
As already pointed out before, separate estimates are derived for all the 103 countriescombined as well as different classifications of these countries. One classification is onthe basis of per capita income, which is used to divide the countries into poor and richgroups of developing countries. The real per capita income (at 1995 US $ ) cut-off usedfor this purpose is $1,000. The other classification is based on the extent of revenuefrom mineral (crude petroleum and metallic) exploitation - and, hence, mineral exports.The countries regarded as belonging to this category are those having the sum ofpetroleum and metallic mineral exports accounting for not less than 20 percent of totalmerchandise exports. The third category is the countries that depend much on foreignofficial transfers (grants) in financing the budget and a country is so classified if theofficial transfers account for not less than 20 percent of total government expenditure.7
The rationale for the above classifications has been discussed earlier.
4 Empirical Results
4.1 Broad view of the results
The estimates of the economic growth equations are presented below in Tables 2 to 9. Inall cases, the explanatory power of the equations is only modest, judging by the modestvalues of the adjusted R2. This is not unexpected and neither is it uncommon, given theheterogeneity of the countries covered.
The estimates of the conditioning variables are explicitly reported in only Tables 2 and3. While they are included in deriving the results reported in Tables 4 to 9, theirestimates are not reported there for brevity and to save space, since these estimates arefound to be essentially the same as those reported in Tables 2 and 3. It can be seen fromthese Tables 2 and 3 that the estimates of the conditioning variables are broadly in linewith expectation. Particularly, the initial level of per capita income enters all equationswith negative and statistically significant coefficients. The same is true for thepopulation age dependency ratio, except in the equation for substantial aid receivinggroup of countries where it is not statistically significant. Also, the terms of tradegrowth enters all equations with the expected positive coefficient that is statisticallysignificant except for low-income and sizeable foreign aid receiving groups ofcountries. It is only the openness of economy regressor that does not enter the equationswith statistical significance.
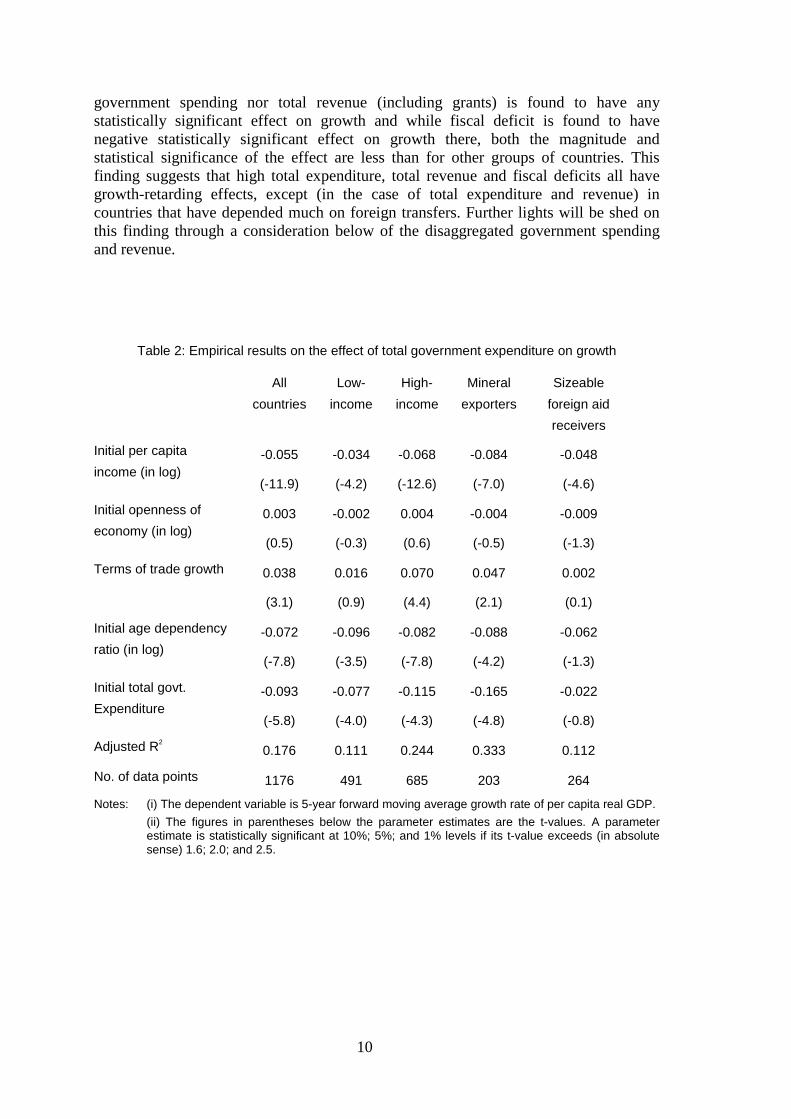
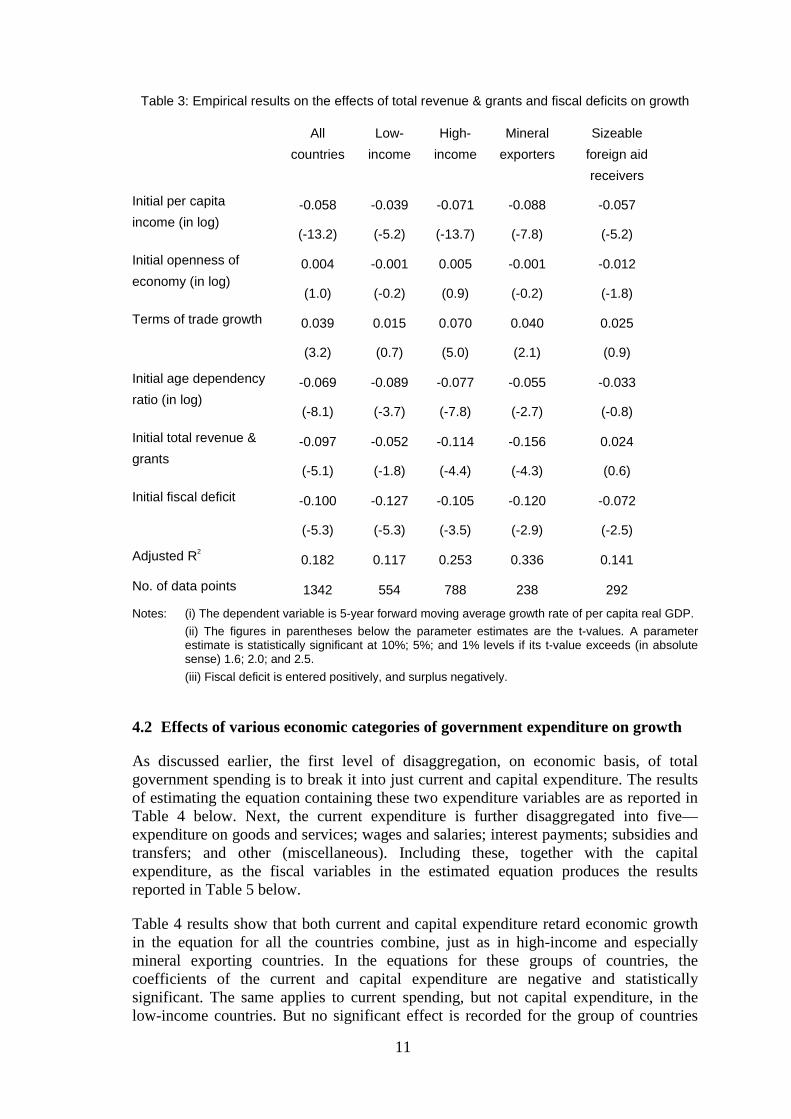
Concerning the effects of the aggregate fiscal variables on growth, these are very clearlyportrayed in Tables 2 and 3, from where it can be seen that higher share of totalgovernment spending in GDP has statistically significant negative coefficients in theequations for the groups of countries considered. The same applies to each of totalrevenue and fiscal deficit in relation to GDP. The only exception is the group ofcountries that have received substantial foreign transfers, where neither total
7 Under each of these classifications, a country can belong into a category only during a part of theentire period. For instance, if the per capita real income crossed the $1,000 threshold in 1990, it wouldbe classified as a poor country before 1990 and as a rich country thereafter.
10
government spending nor total revenue (including grants) is found to have anystatistically significant effect on growth and while fiscal deficit is found to havenegative statistically significant effect on growth there, both the magnitude andstatistical significance of the effect are less than for other groups of countries. Thisfinding suggests that high total expenditure, total revenue and fiscal deficits all havegrowth-retarding effects, except (in the case of total expenditure and revenue) incountries that have depended much on foreign transfers. Further lights will be shed onthis finding through a consideration below of the disaggregated government spendingand revenue.
Table 2: Empirical results on the effect of total government expenditure on growth
All
countries
Low-
income
High-
income
Mineral
exporters
Sizeable
foreign aid
receivers
Initial per capita
income (in log)-0.055
(-11.9)
-0.034
(-4.2)
-0.068
(-12.6)
-0.084
(-7.0)
-0.048
(-4.6)
Initial openness of
economy (in log)0.003
(0.5)
-0.002
(-0.3)
0.004
(0.6)
-0.004
(-0.5)
-0.009
(-1.3)
Terms of trade growth 0.038
(3.1)
0.016
(0.9)
0.070
(4.4)
0.047
(2.1)
0.002
(0.1)
Initial age dependency
ratio (in log)-0.072
(-7.8)
-0.096
(-3.5)
-0.082
(-7.8)
-0.088
(-4.2)
-0.062
(-1.3)
Initial total govt.
Expenditure-0.093
(-5.8)
-0.077
(-4.0)
-0.115
(-4.3)
-0.165
(-4.8)
-0.022
(-0.8)
Adjusted R2
0.176 0.111 0.244 0.333 0.112
No. of data points 1176 491 685 203 264
Notes: (i) The dependent variable is 5-year forward moving average growth rate of per capita real GDP.
(ii) The figures in parentheses below the parameter estimates are the t-values. A parameterestimate is statistically significant at 10%; 5%; and 1% levels if its t-value exceeds (in absolutesense) 1.6; 2.0; and 2.5.
11
Table 3: Empirical results on the effects of total revenue & grants and fiscal deficits on growth
All
countries
Low-
income
High-
income
Mineral
exporters
Sizeable
foreign aid
receivers
Initial per capita
income (in log)-0.058
(-13.2)
-0.039
(-5.2)
-0.071
(-13.7)
-0.088
(-7.8)
-0.057
(-5.2)
Initial openness of
economy (in log)0.004
(1.0)
-0.001
(-0.2)
0.005
(0.9)
-0.001
(-0.2)
-0.012
(-1.8)
Terms of trade growth 0.039
(3.2)
0.015
(0.7)
0.070
(5.0)
0.040
(2.1)
0.025
(0.9)
Initial age dependency
ratio (in log)-0.069
(-8.1)
-0.089
(-3.7)
-0.077
(-7.8)
-0.055
(-2.7)
-0.033
(-0.8)
Initial total revenue &
grants-0.097
(-5.1)
-0.052
(-1.8)
-0.114
(-4.4)
-0.156
(-4.3)
0.024
(0.6)
Initial fiscal deficit -0.100
(-5.3)
-0.127
(-5.3)
-0.105
(-3.5)
-0.120
(-2.9)
-0.072
(-2.5)
Adjusted R2
0.182 0.117 0.253 0.336 0.141
No. of data points 1342 554 788 238 292
Notes: (i) The dependent variable is 5-year forward moving average growth rate of per capita real GDP.
(ii) The figures in parentheses below the parameter estimates are the t-values. A parameterestimate is statistically significant at 10%; 5%; and 1% levels if its t-value exceeds (in absolutesense) 1.6; 2.0; and 2.5.
(iii) Fiscal deficit is entered positively, and surplus negatively.
4.2 Effects of various economic categories of government expenditure on growth
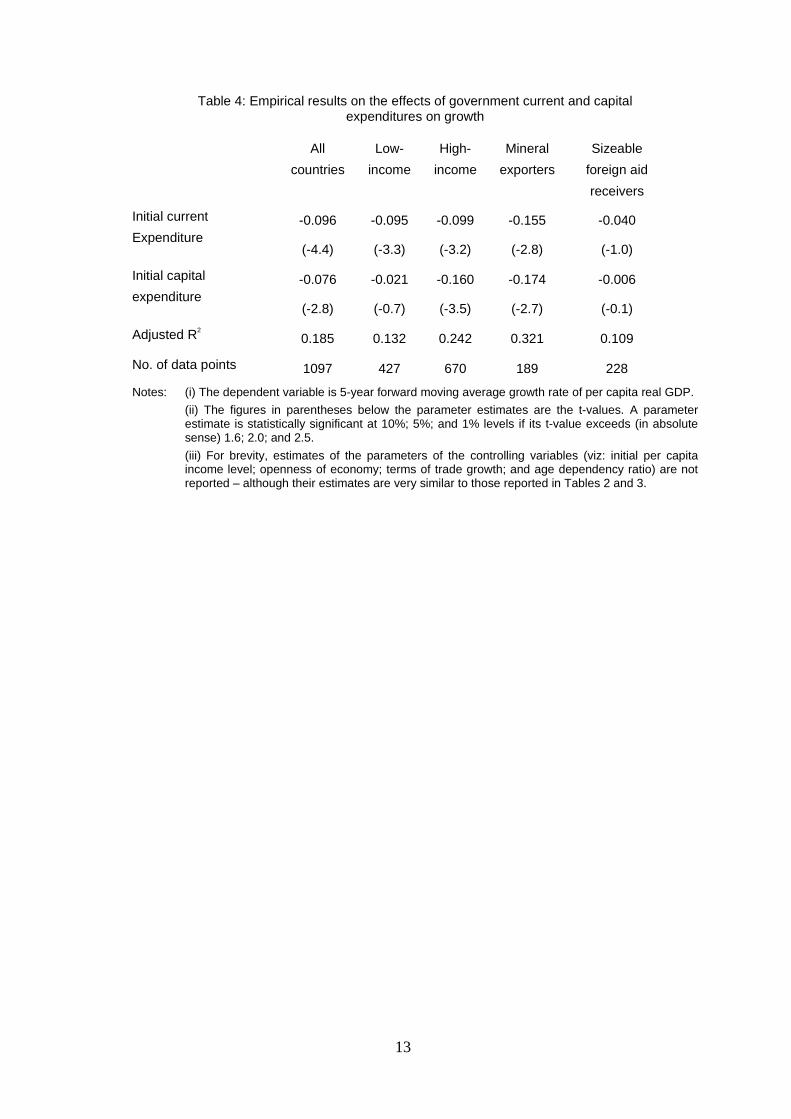
As discussed earlier, the first level of disaggregation, on economic basis, of totalgovernment spending is to break it into just current and capital expenditure. The resultsof estimating the equation containing these two expenditure variables are as reported inTable 4 below. Next, the current expenditure is further disaggregated into five—expenditure on goods and services; wages and salaries; interest payments; subsidies andtransfers; and other (miscellaneous). Including these, together with the capitalexpenditure, as the fiscal variables in the estimated equation produces the resultsreported in Table 5 below.
Table 4 results show that both current and capital expenditure retard economic growthin the equation for all the countries combine, just as in high-income and especiallymineral exporting countries. In the equations for these groups of countries, thecoefficients of the current and capital expenditure are negative and statisticallysignificant. The same applies to current spending, but not capital expenditure, in thelow-income countries. But no significant effect is recorded for the group of countries
12
that are large receivers of foreign grants. A probable explanation of the observednegative effect of capital expenditure on growth is that, apart from the possibility of itcrowding-out private investment, it is more vulnerable or prone to rent-seeking andgraft than current spending, the result of which would be to reduce the productivity ofthe expenditure. It can also be due to the long gestation period required for publicinvestment projects to yield output. That it is not found to have negative effects in theaid-receiving countries could be due to project-tying of aid and other monitoringdevices that the foreign donors often put in place to reduce injudicious capital spendingby the receiving governments. Concerning explanation of the just noted effects ofcurrent spending, further insights into this are provided by examining the effects of itsvarious components as discussed next paragraphs.
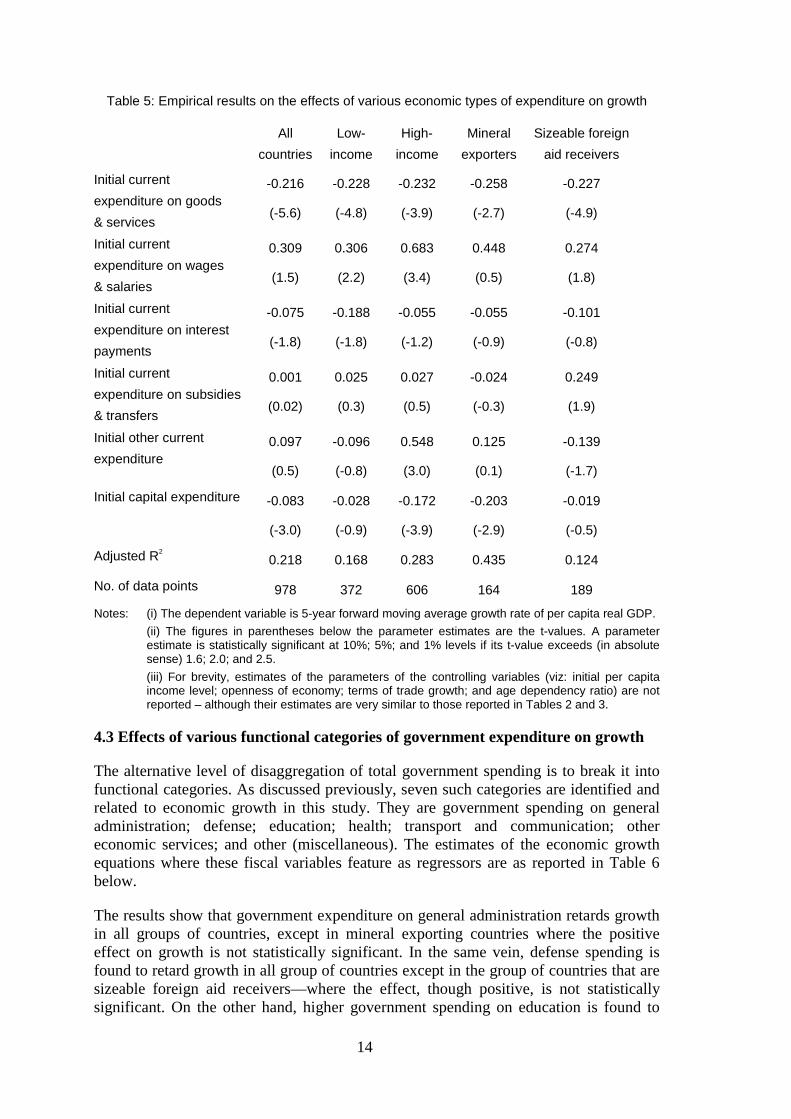
Based on Table 5 results, the following are the observed effects of different componentsof current spending on growth: current spending on goods and services has detrimentaleffects on growth in all groups of countries, as its coefficients are negative andstatistically significant in all cases. The reverse is the case for current expenditure onwages are salary, the coefficients of which is positive in all equations and exhibitstatistical significance except in the equation for mineral exporting group of countries.Concerning current spending on interest payments, while its coefficients are negative inall equations, it is only in the equation for low-income countries where it is statisticallysignificant to some extent. It is also only in this same group of countries where currentspending on subsidies and transfers is found to have fairly significant effect ongrowth—but, this time, a positive effect. Other (miscellaneous) current expenditure isfound to have no significant effect on growth, except in the high-income group ofcountries where significant positive effect is recorded.
A probable reason for the observed detrimental effects on economic growth of currentspending on goods and services and the simultaneous positive effects of currentspending on wages and salaries is also in terms of the rent-seeking syndrome. Corruptpractices and other rent-seeking vices are likely to be more characteristic of supply ofgoods and services to the government sector (particularly, in typical cases wheregovernment procurement as well as custody or storage procedures are weak) than in thecase of payment of wages and salaries.8 Current spending on interest payments appearto have significantly hindered economic growth of only the poorest countries probablybecause they are the ones that feel the pinch of the burden more, especially interestpayments on external debts. Concerning subsidies and other current transfers that isfound to promote growth of substantial aid-receiving countries, probably such transfersare better targeted and more needed in such countries. Other (miscellaneous) currentspending assumes a sizeable dimension only in the high-income countries and thisprobably explains why it has a significant (positive) effect on growth in only this groupof countries.
8 For instance, payroll fraud (typically) by rank and file of civil servants might be less detrimental thanexecutive frauds that often characterize award of contracts for government projects and procurementof goods and services.
13
Table 4: Empirical results on the effects of government current and capitalexpenditures on growth
All
countries
Low-
income
High-
income
Mineral
exporters
Sizeable
foreign aid
receivers
Initial current
Expenditure-0.096
(-4.4)
-0.095
(-3.3)
-0.099
(-3.2)
-0.155
(-2.8)
-0.040
(-1.0)
Initial capital
expenditure-0.076
(-2.8)
-0.021
(-0.7)
-0.160
(-3.5)
-0.174
(-2.7)
-0.006
(-0.1)
Adjusted R2
0.185 0.132 0.242 0.321 0.109
No. of data points 1097 427 670 189 228
Notes: (i) The dependent variable is 5-year forward moving average growth rate of per capita real GDP.
(ii) The figures in parentheses below the parameter estimates are the t-values. A parameterestimate is statistically significant at 10%; 5%; and 1% levels if its t-value exceeds (in absolutesense) 1.6; 2.0; and 2.5.
(iii) For brevity, estimates of the parameters of the controlling variables (viz: initial per capitaincome level; openness of economy; terms of trade growth; and age dependency ratio) are notreported – although their estimates are very similar to those reported in Tables 2 and 3.
14
Table 5: Empirical results on the effects of various economic types of expenditure on growth
All
countries
Low-
income
High-
income
Mineral
exporters
Sizeable foreign
aid receivers
Initial current
expenditure on goods
& services
-0.216
(-5.6)
-0.228
(-4.8)
-0.232
(-3.9)
-0.258
(-2.7)
-0.227
(-4.9)
Initial current
expenditure on wages
& salaries
0.309
(1.5)
0.306
(2.2)
0.683
(3.4)
0.448
(0.5)
0.274
(1.8)
Initial current
expenditure on interest
payments
-0.075
(-1.8)
-0.188
(-1.8)
-0.055
(-1.2)
-0.055
(-0.9)
-0.101
(-0.8)
Initial current
expenditure on subsidies
& transfers
0.001
(0.02)
0.025
(0.3)
0.027
(0.5)
-0.024
(-0.3)
0.249
(1.9)
Initial other current
expenditure0.097
(0.5)
-0.096
(-0.8)
0.548
(3.0)
0.125
(0.1)
-0.139
(-1.7)
Initial capital expenditure -0.083
(-3.0)
-0.028
(-0.9)
-0.172
(-3.9)
-0.203
(-2.9)
-0.019
(-0.5)
Adjusted R2
0.218 0.168 0.283 0.435 0.124
No. of data points 978 372 606 164 189
Notes: (i) The dependent variable is 5-year forward moving average growth rate of per capita real GDP.
(ii) The figures in parentheses below the parameter estimates are the t-values. A parameterestimate is statistically significant at 10%; 5%; and 1% levels if its t-value exceeds (in absolutesense) 1.6; 2.0; and 2.5.
(iii) For brevity, estimates of the parameters of the controlling variables (viz: initial per capitaincome level; openness of economy; terms of trade growth; and age dependency ratio) are notreported – although their estimates are very similar to those reported in Tables 2 and 3.
4.3 Effects of various functional categories of government expenditure on growth
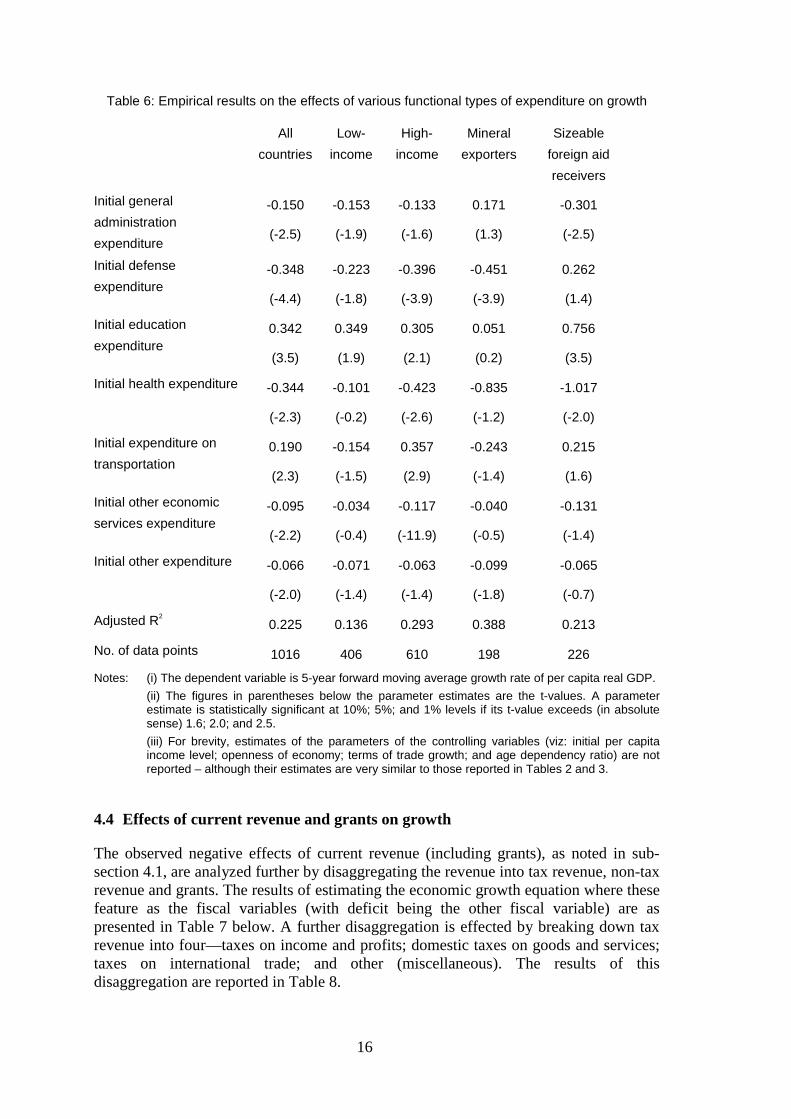
The alternative level of disaggregation of total government spending is to break it intofunctional categories. As discussed previously, seven such categories are identified andrelated to economic growth in this study. They are government spending on generaladministration; defense; education; health; transport and communication; othereconomic services; and other (miscellaneous). The estimates of the economic growthequations where these fiscal variables feature as regressors are as reported in Table 6below.
The results show that government expenditure on general administration retards growthin all groups of countries, except in mineral exporting countries where the positiveeffect on growth is not statistically significant. In the same vein, defense spending isfound to retard growth in all group of countries except in the group of countries that aresizeable foreign aid receivers—where the effect, though positive, is not statisticallysignificant. On the other hand, higher government spending on education is found to
15
promote growth in all groups of the countries, with statistically insignificant positiveeffect recorded only for mineral exporting group of countries. Health expenditure,which is least in magnitude (see Table 1), is found not to promote growth in thesecountries and, in fact, it is observed to retard growth in high-income group of countries.Expenditure on transport and communication is found to have positive effects on growthonly in high-income and sizeable foreign aid receiving groups of countries but nodiscernable effect in the low-income and mineral exporting countries. High governmentspending on other economic services is found to hinder growth substantially in high-income countries but without any significant or discernable effects on growth in othergroups of countries. The other or miscellaneous functional expenditure category doesnot appear to have any effect on growth except in mineral exporting group of countrieswhere negative effect, which is statistically significant only at the margin, is recorded.
That higher spending on general administration retards growth could be due to the factsuch spending is not often determined by economic consideration and may also bedevoid of financial prudence. While defense spending can conceptually promote growthby creating security necessary for economic activities, the observed negative effect—which is in conformity with the findings generally reported in the empirical literature—suggests that defense spending in these countries have generally not often been directedtowards this end. The non-negative effect recorded by aid-receiving group of countriescould be due to some donor-induced restraints on possibly reckless and aggressivedefense spending. The observed growth-promoting effect of education spending showsthe importance of human capital development to economic growth of developingcountries. That no such growth-promoting effect is observed in the case of healthexpenditure could be due to a number of reasons. Probably, health spending is morevulnerable to rent-seeking than education spending. Also, health spending is typicallyundertaken by lower-levels of government to a greater extent than education spendingand our data covers only central government health spending—which might focus moreon tertiary health care (which would have less impact on human capital formation).Expenditure on transportation and communication is expected to strengthen the physicalinfrastructures that are supposed to facilitate production and this explains its observedgrowth-promoting effect in the high-income and sizeable aid receiving groups ofcountries. However, this explanation is weakened by the fact that the positive effect isnot observed in low-income and mineral exporting countries. Concerning spending onother economic services, one would have expected it to promote growth but this is notin line with the results reported in the Table, from where it can be seen that it evenretards growth in high-income group of countries. This apparent paradox could be dueto the fact that such spending is not often focused; the economic projects are not beingtargeted or scrutinized on the basis of economic criteria; and is dominated by politicalconsideration as well as prone to rent-seeking. That the other (miscellaneous)expenditure does not have significant effects on growth could be due to itsmiscellaneous nature and the small magnitudes of the amounts involved.
16
Table 6: Empirical results on the effects of various functional types of expenditure on growth
All
countries
Low-
income
High-
income
Mineral
exporters
Sizeable
foreign aid
receivers
Initial general
administration
expenditure
-0.150
(-2.5)
-0.153
(-1.9)
-0.133
(-1.6)
0.171
(1.3)
-0.301
(-2.5)
Initial defense
expenditure-0.348
(-4.4)
-0.223
(-1.8)
-0.396
(-3.9)
-0.451
(-3.9)
0.262
(1.4)
Initial education
expenditure0.342
(3.5)
0.349
(1.9)
0.305
(2.1)
0.051
(0.2)
0.756
(3.5)
Initial health expenditure -0.344
(-2.3)
-0.101
(-0.2)
-0.423
(-2.6)
-0.835
(-1.2)
-1.017
(-2.0)
Initial expenditure on
transportation0.190
(2.3)
-0.154
(-1.5)
0.357
(2.9)
-0.243
(-1.4)
0.215
(1.6)
Initial other economic
services expenditure-0.095
(-2.2)
-0.034
(-0.4)
-0.117
(-11.9)
-0.040
(-0.5)
-0.131
(-1.4)
Initial other expenditure -0.066
(-2.0)
-0.071
(-1.4)
-0.063
(-1.4)
-0.099
(-1.8)
-0.065
(-0.7)
Adjusted R2
0.225 0.136 0.293 0.388 0.213
No. of data points 1016 406 610 198 226
Notes: (i) The dependent variable is 5-year forward moving average growth rate of per capita real GDP.
(ii) The figures in parentheses below the parameter estimates are the t-values. A parameterestimate is statistically significant at 10%; 5%; and 1% levels if its t-value exceeds (in absolutesense) 1.6; 2.0; and 2.5.
(iii) For brevity, estimates of the parameters of the controlling variables (viz: initial per capitaincome level; openness of economy; terms of trade growth; and age dependency ratio) are notreported – although their estimates are very similar to those reported in Tables 2 and 3.
4.4 Effects of current revenue and grants on growth
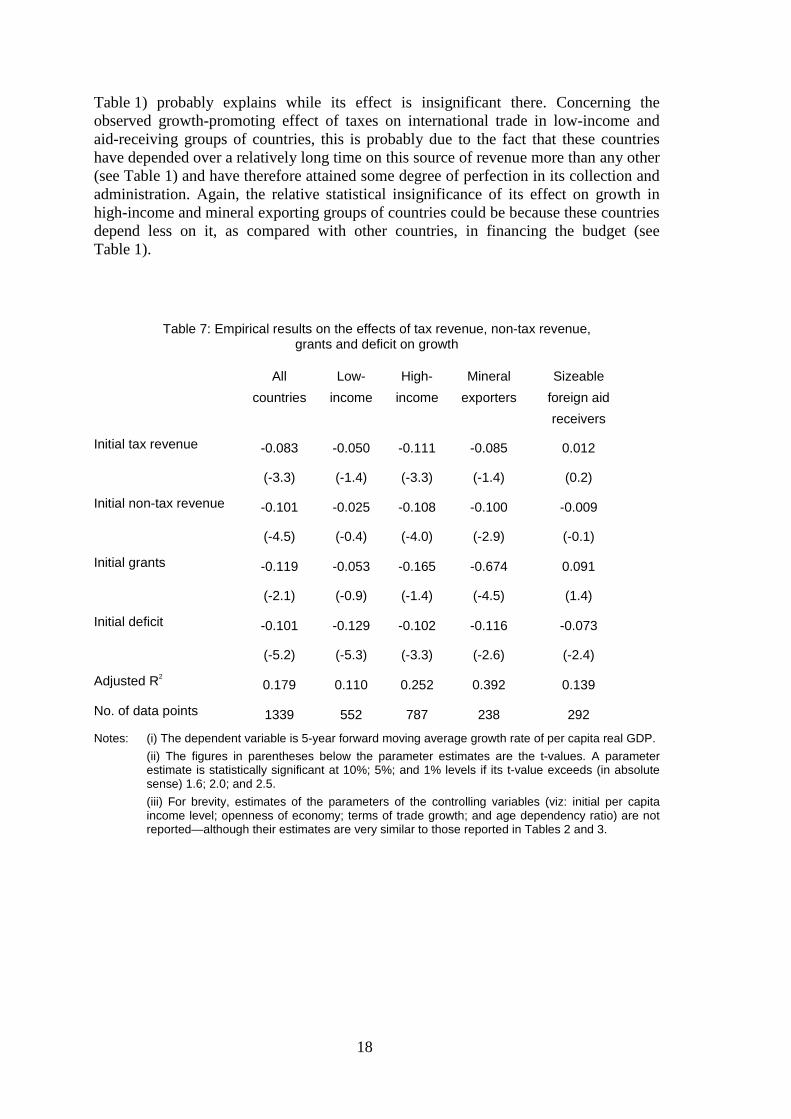
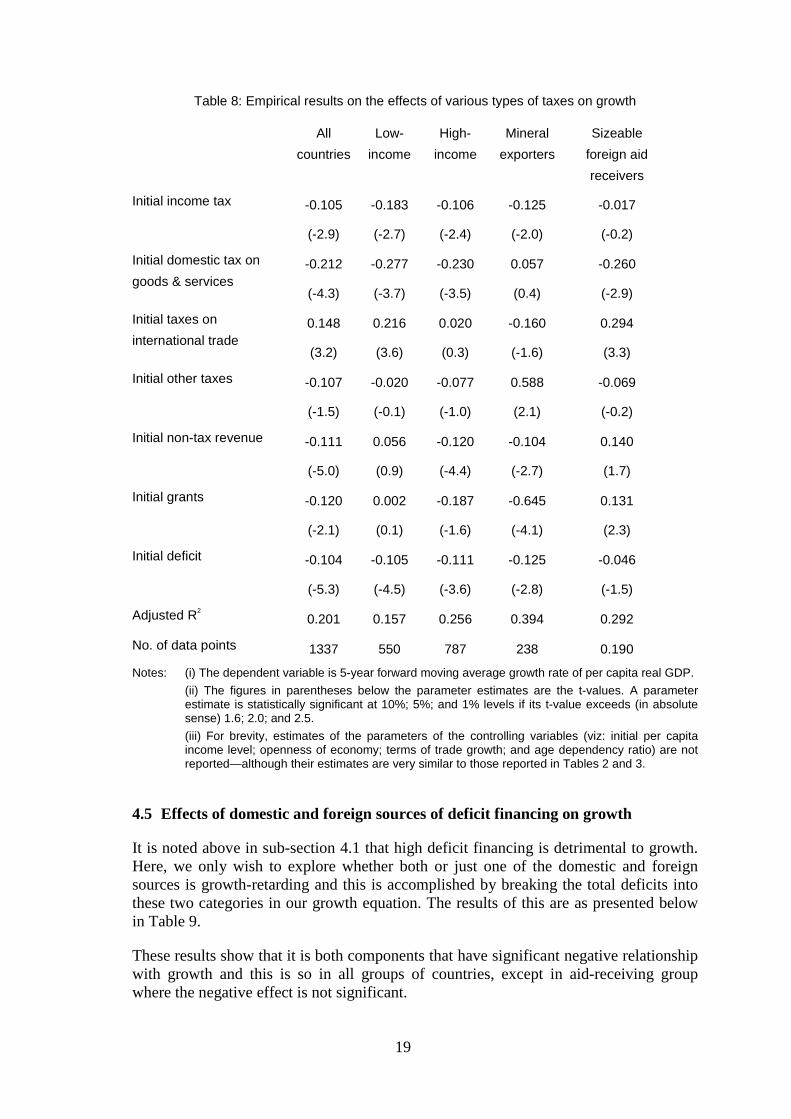
The observed negative effects of current revenue (including grants), as noted in sub-section 4.1, are analyzed further by disaggregating the revenue into tax revenue, non-taxrevenue and grants. The results of estimating the economic growth equation where thesefeature as the fiscal variables (with deficit being the other fiscal variable) are aspresented in Table 7 below. A further disaggregation is effected by breaking down taxrevenue into four—taxes on income and profits; domestic taxes on goods and services;taxes on international trade; and other (miscellaneous). The results of thisdisaggregation are reported in Table 8.

17
From Table 7, it can be seen that tax revenue has significant growth-retarding effect inhigh-income countries and insignificant effects on growth in other groups of countries.High non-tax revenue, on the other hand, is seen to hinder growth in high-income andmineral exporting countries while high level of grants significantly retards growth inonly mineral exporting countries. Positive, though mild, effect is recorded in thosecountries that are substantial receivers of grants (Tables 7 and especially Table 8).
Further insights on the effects of tax revenue are provided by examining its furtherdisaggregation, as discussed next paragraph. Concerning the observed negative effect ofnon-tax revenue in only high-income and mineral exporting groups of countries, thiscould be due to the fact that it is only in these two groups where the amounts collectedof non-tax revenue accounts for a high fraction of the budget and also of the GDP (seeTable 1).9 The amounts involved are relatively small in other groups of countries tomake much impact on growth. The mild positive effect of grants in those countries thatreceive substantial aid could be due to the effect of monitoring, by donors, of theirdisbursements. That the same grants retard growth in mineral exporting countries mightbe because these countries typically do not receive much of the routine aid and the littlethey receive is often dictated mainly by political considerations, making the utilizationto be hardly amenable to oversight or monitoring by the donors.
The results presented in Table 8 show that high income tax ratio has statisticallysignificant negative effects on growth in all groups of countries, except in the group thatdepend substantially on foreign aid, where the negative effect is not significant.Similarly, high taxes (in relation to GDP) on domestic goods and services too retardgrowth in all groups of countries except in mineral exporting group where it does nothave a negative effect. On the other hand, taxes on international trade are observed tohave positive effects on growth in low-income as well as substantial foreign aidreceiving groups of countries while marginally significant negative effect is recorded inmineral exporting group and insignificant effect in high-income group. The other(miscellaneous) taxes are found to have insignificant effect on growth in all casesexcept in mineral exporting group of countries where positive effect is recorded.
That high income (and profit) tax ratio is found to hinder growth is not unexpected, as itis often regarded as a deterrent to supply of labor, efforts and enterprise. This is inaddition to the usually high costs of collection and administration that bedevils this typeof tax in most developing countries. Also, that its negative effect is statisticallyinsignificant in the aid-receiving group of countries could be due to the fact that incometax ratio is lowest there (see Table 1). The negative effect of high domestic taxes ongoods and services could be due to the evolving nature of the culture and system of thistax (which might have made it cumbersome and its administration inefficient) in manydeveloping countries—e.g. standard value-added tax system hardly existed, during mostof the years covered by the study, in many of the countries sampled. It is hoped that,with the passage of time, the countries would perfect the system and make it growth-conducive. That mineral exporting countries depend less on this type of tax (see
9 Mineral exporters depend a lot on this class of revenue (as royalties) and, since most of them areclassified under high-income group, this also explains why the latter group too records high ratio ofnon-tax revenue.
18
Table 1) probably explains while its effect is insignificant there. Concerning theobserved growth-promoting effect of taxes on international trade in low-income andaid-receiving groups of countries, this is probably due to the fact that these countrieshave depended over a relatively long time on this source of revenue more than any other(see Table 1) and have therefore attained some degree of perfection in its collection andadministration. Again, the relative statistical insignificance of its effect on growth inhigh-income and mineral exporting groups of countries could be because these countriesdepend less on it, as compared with other countries, in financing the budget (seeTable 1).
Table 7: Empirical results on the effects of tax revenue, non-tax revenue,grants and deficit on growth
All
countries
Low-
income
High-
income
Mineral
exporters
Sizeable
foreign aid
receivers
Initial tax revenue -0.083
(-3.3)
-0.050
(-1.4)
-0.111
(-3.3)
-0.085
(-1.4)
0.012
(0.2)
Initial non-tax revenue -0.101
(-4.5)
-0.025
(-0.4)
-0.108
(-4.0)
-0.100
(-2.9)
-0.009
(-0.1)
Initial grants -0.119
(-2.1)
-0.053
(-0.9)
-0.165
(-1.4)
-0.674
(-4.5)
0.091
(1.4)
Initial deficit -0.101
(-5.2)
-0.129
(-5.3)
-0.102
(-3.3)
-0.116
(-2.6)
-0.073
(-2.4)
Adjusted R2
0.179 0.110 0.252 0.392 0.139
No. of data points 1339 552 787 238 292
Notes: (i) The dependent variable is 5-year forward moving average growth rate of per capita real GDP.
(ii) The figures in parentheses below the parameter estimates are the t-values. A parameterestimate is statistically significant at 10%; 5%; and 1% levels if its t-value exceeds (in absolutesense) 1.6; 2.0; and 2.5.
(iii) For brevity, estimates of the parameters of the controlling variables (viz: initial per capitaincome level; openness of economy; terms of trade growth; and age dependency ratio) are notreported—although their estimates are very similar to those reported in Tables 2 and 3.
19
Table 8: Empirical results on the effects of various types of taxes on growth
All
countries
Low-
income
High-
income
Mineral
exporters
Sizeable
foreign aid
receivers
Initial income tax -0.105
(-2.9)
-0.183
(-2.7)
-0.106
(-2.4)
-0.125
(-2.0)
-0.017
(-0.2)
Initial domestic tax on
goods & services-0.212
(-4.3)
-0.277
(-3.7)
-0.230
(-3.5)
0.057
(0.4)
-0.260
(-2.9)
Initial taxes on
international trade0.148
(3.2)
0.216
(3.6)
0.020
(0.3)
-0.160
(-1.6)
0.294
(3.3)
Initial other taxes -0.107
(-1.5)
-0.020
(-0.1)
-0.077
(-1.0)
0.588
(2.1)
-0.069
(-0.2)
Initial non-tax revenue -0.111
(-5.0)
0.056
(0.9)
-0.120
(-4.4)
-0.104
(-2.7)
0.140
(1.7)
Initial grants -0.120
(-2.1)
0.002
(0.1)
-0.187
(-1.6)
-0.645
(-4.1)
0.131
(2.3)
Initial deficit -0.104
(-5.3)
-0.105
(-4.5)
-0.111
(-3.6)
-0.125
(-2.8)
-0.046
(-1.5)
Adjusted R2
0.201 0.157 0.256 0.394 0.292
No. of data points 1337 550 787 238 0.190
Notes: (i) The dependent variable is 5-year forward moving average growth rate of per capita real GDP.
(ii) The figures in parentheses below the parameter estimates are the t-values. A parameterestimate is statistically significant at 10%; 5%; and 1% levels if its t-value exceeds (in absolutesense) 1.6; 2.0; and 2.5.
(iii) For brevity, estimates of the parameters of the controlling variables (viz: initial per capitaincome level; openness of economy; terms of trade growth; and age dependency ratio) are notreported—although their estimates are very similar to those reported in Tables 2 and 3.
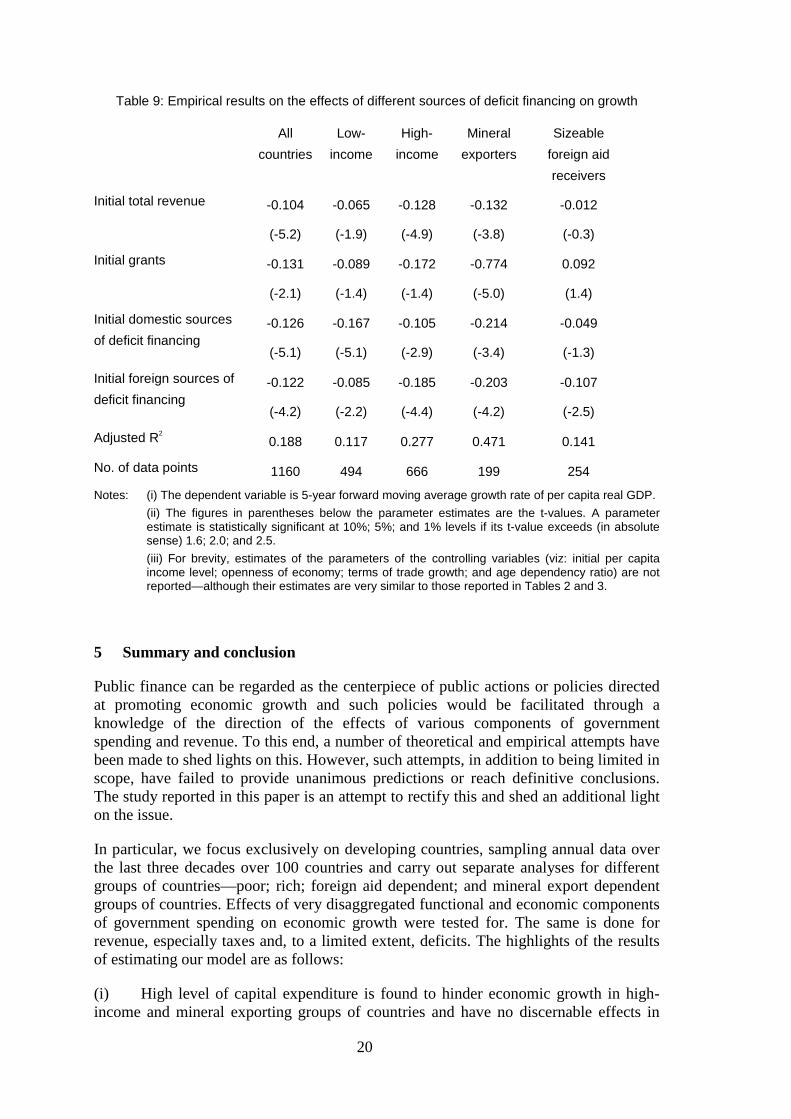
4.5 Effects of domestic and foreign sources of deficit financing on growth
It is noted above in sub-section 4.1 that high deficit financing is detrimental to growth.Here, we only wish to explore whether both or just one of the domestic and foreignsources is growth-retarding and this is accomplished by breaking the total deficits intothese two categories in our growth equation. The results of this are as presented belowin Table 9.
These results show that it is both components that have significant negative relationshipwith growth and this is so in all groups of countries, except in aid-receiving groupwhere the negative effect is not significant.
20
Table 9: Empirical results on the effects of different sources of deficit financing on growth
All
countries
Low-
income
High-
income
Mineral
exporters
Sizeable
foreign aid
receivers
Initial total revenue -0.104
(-5.2)
-0.065
(-1.9)
-0.128
(-4.9)
-0.132
(-3.8)
-0.012
(-0.3)
Initial grants -0.131
(-2.1)
-0.089
(-1.4)
-0.172
(-1.4)
-0.774
(-5.0)
0.092
(1.4)
Initial domestic sources
of deficit financing-0.126
(-5.1)
-0.167
(-5.1)
-0.105
(-2.9)
-0.214
(-3.4)
-0.049
(-1.3)
Initial foreign sources of
deficit financing-0.122
(-4.2)
-0.085
(-2.2)
-0.185
(-4.4)
-0.203
(-4.2)
-0.107
(-2.5)
Adjusted R2
0.188 0.117 0.277 0.471 0.141
No. of data points 1160 494 666 199 254
Notes: (i) The dependent variable is 5-year forward moving average growth rate of per capita real GDP.
(ii) The figures in parentheses below the parameter estimates are the t-values. A parameterestimate is statistically significant at 10%; 5%; and 1% levels if its t-value exceeds (in absolutesense) 1.6; 2.0; and 2.5.
(iii) For brevity, estimates of the parameters of the controlling variables (viz: initial per capitaincome level; openness of economy; terms of trade growth; and age dependency ratio) are notreported—although their estimates are very similar to those reported in Tables 2 and 3.
5 Summary and conclusion
Public finance can be regarded as the centerpiece of public actions or policies directedat promoting economic growth and such policies would be facilitated through aknowledge of the direction of the effects of various components of governmentspending and revenue. To this end, a number of theoretical and empirical attempts havebeen made to shed lights on this. However, such attempts, in addition to being limited inscope, have failed to provide unanimous predictions or reach definitive conclusions.The study reported in this paper is an attempt to rectify this and shed an additional lighton the issue.
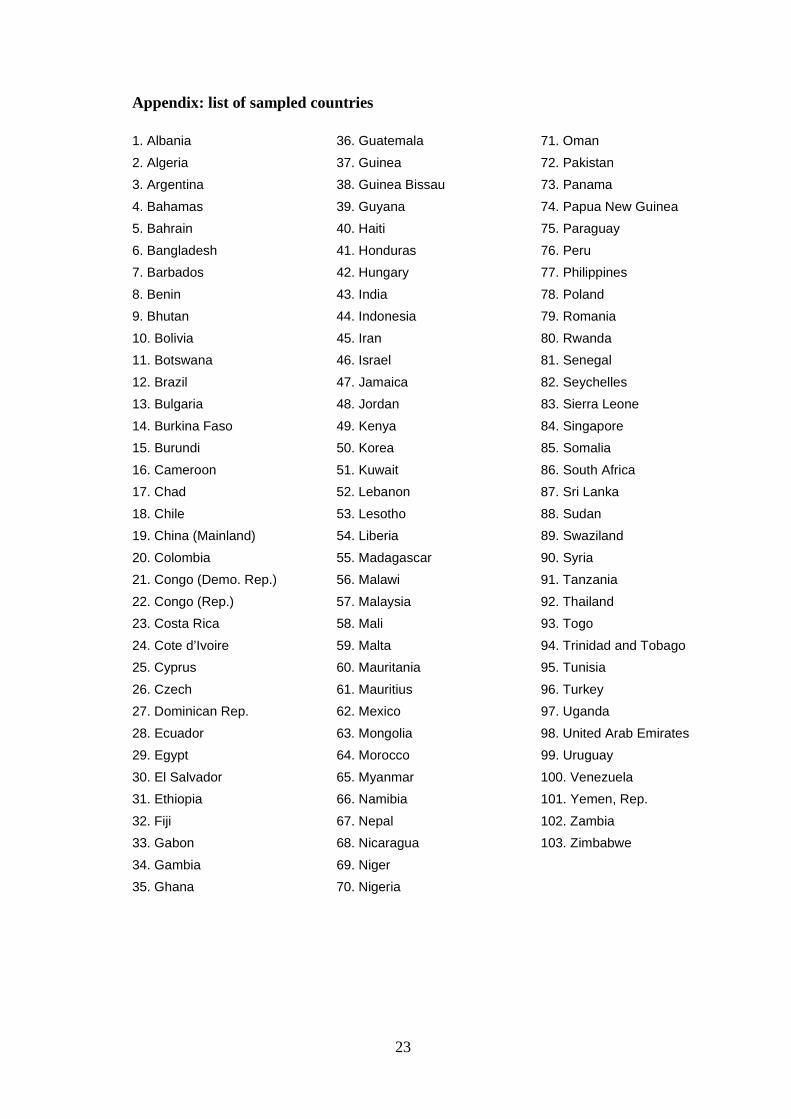
In particular, we focus exclusively on developing countries, sampling annual data overthe last three decades over 100 countries and carry out separate analyses for differentgroups of countries—poor; rich; foreign aid dependent; and mineral export dependentgroups of countries. Effects of very disaggregated functional and economic componentsof government spending on economic growth were tested for. The same is done forrevenue, especially taxes and, to a limited extent, deficits. The highlights of the resultsof estimating our model are as follows:
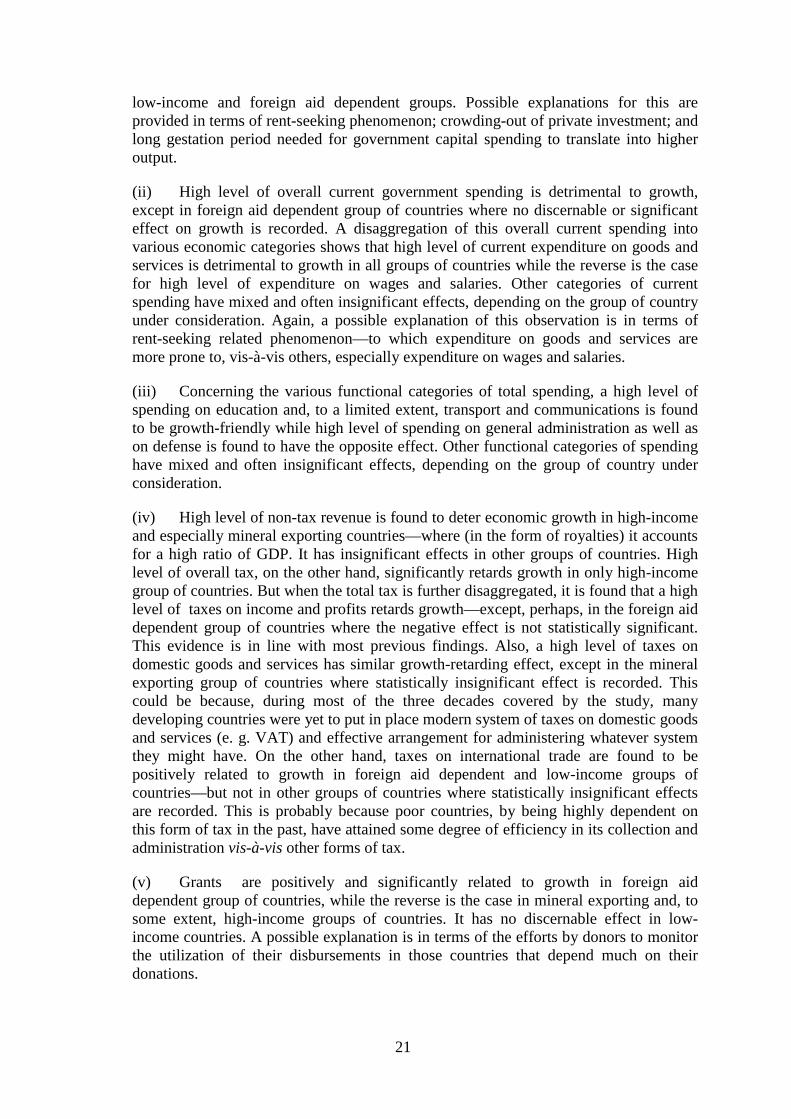
(i) High level of capital expenditure is found to hinder economic growth in high-income and mineral exporting groups of countries and have no discernable effects in
21
low-income and foreign aid dependent groups. Possible explanations for this areprovided in terms of rent-seeking phenomenon; crowding-out of private investment; andlong gestation period needed for government capital spending to translate into higheroutput.
(ii) High level of overall current government spending is detrimental to growth,except in foreign aid dependent group of countries where no discernable or significanteffect on growth is recorded. A disaggregation of this overall current spending intovarious economic categories shows that high level of current expenditure on goods andservices is detrimental to growth in all groups of countries while the reverse is the casefor high level of expenditure on wages and salaries. Other categories of currentspending have mixed and often insignificant effects, depending on the group of countryunder consideration. Again, a possible explanation of this observation is in terms ofrent-seeking related phenomenon—to which expenditure on goods and services aremore prone to, vis-à-vis others, especially expenditure on wages and salaries.
(iii) Concerning the various functional categories of total spending, a high level ofspending on education and, to a limited extent, transport and communications is foundto be growth-friendly while high level of spending on general administration as well ason defense is found to have the opposite effect. Other functional categories of spendinghave mixed and often insignificant effects, depending on the group of country underconsideration.
(iv) High level of non-tax revenue is found to deter economic growth in high-incomeand especially mineral exporting countries—where (in the form of royalties) it accountsfor a high ratio of GDP. It has insignificant effects in other groups of countries. Highlevel of overall tax, on the other hand, significantly retards growth in only high-incomegroup of countries. But when the total tax is further disaggregated, it is found that a highlevel of taxes on income and profits retards growth—except, perhaps, in the foreign aiddependent group of countries where the negative effect is not statistically significant.This evidence is in line with most previous findings. Also, a high level of taxes ondomestic goods and services has similar growth-retarding effect, except in the mineralexporting group of countries where statistically insignificant effect is recorded. Thiscould be because, during most of the three decades covered by the study, manydeveloping countries were yet to put in place modern system of taxes on domestic goodsand services (e. g. VAT) and effective arrangement for administering whatever systemthey might have. On the other hand, taxes on international trade are found to bepositively related to growth in foreign aid dependent and low-income groups ofcountries—but not in other groups of countries where statistically insignificant effectsare recorded. This is probably because poor countries, by being highly dependent onthis form of tax in the past, have attained some degree of efficiency in its collection andadministrationvis-à-visother forms of tax.
(v) Grants are positively and significantly related to growth in foreign aiddependent group of countries, while the reverse is the case in mineral exporting and, tosome extent, high-income groups of countries. It has no discernable effect in low-income countries. A possible explanation is in terms of the efforts by donors to monitorthe utilization of their disbursements in those countries that depend much on theirdonations.
22
(vii) A high level of fiscal deficit is found to have retarded growth and this is the casewhether domestically or externally financed.
But some caveat have to be noted here in connection with our findings. In particular,given the limited guidance provided by theory, our “explanations” of the findings, asprovided in the text, are hardly nothing more than conjectures. More important, ouranalysis is based on public finance statistics that must have been compiled andclassified under different methodologies, despite the fact that we obtained them fromthe IMF’s Government Finance Statistics (GFS) Yearbook. This is not to talk of missingvalues and lack of continuity in the series for each country. In addition, as rightlypointed out by Easterly and Rebello (1993, p. 421) in a similar study, “GFS, which isour main source of fiscal data suffers from two relevant shortcomings: (i) it includesonly central government activities and thus excludes local government and publicenterprises … and (ii) for some years and some countries the GFS statistics are based onbudget data.”
However, having said that, it is hoped that such caveats are not so serious to invalidatesome of the findings of this study. Many of such findings are expected to be an eye-opener as to how public finances can be improved to enhance growth. For instance, thatgovernment capital spending has been negatively related to growth in these countries inthe past is not necessarily a basis for discontinuation with government investmentspending. It only implies that measures should be taken to make government capitalspending to be productive. The same interpretation applies to other findings.
23
Appendix: list of sampled countries
1. Albania 36. Guatemala 71. Oman
2. Algeria 37. Guinea 72. Pakistan
3. Argentina 38. Guinea Bissau 73. Panama
4. Bahamas 39. Guyana 74. Papua New Guinea
5. Bahrain 40. Haiti 75. Paraguay
6. Bangladesh 41. Honduras 76. Peru
7. Barbados 42. Hungary 77. Philippines
8. Benin 43. India 78. Poland
9. Bhutan 44. Indonesia 79. Romania
10. Bolivia 45. Iran 80. Rwanda
11. Botswana 46. Israel 81. Senegal
12. Brazil 47. Jamaica 82. Seychelles
13. Bulgaria 48. Jordan 83. Sierra Leone
14. Burkina Faso 49. Kenya 84. Singapore
15. Burundi 50. Korea 85. Somalia
16. Cameroon 51. Kuwait 86. South Africa
17. Chad 52. Lebanon 87. Sri Lanka
18. Chile 53. Lesotho 88. Sudan
19. China (Mainland) 54. Liberia 89. Swaziland
20. Colombia 55. Madagascar 90. Syria
21. Congo (Demo. Rep.) 56. Malawi 91. Tanzania
22. Congo (Rep.) 57. Malaysia 92. Thailand
23. Costa Rica 58. Mali 93. Togo
24. Cote d’Ivoire 59. Malta 94. Trinidad and Tobago
25. Cyprus 60. Mauritania 95. Tunisia
26. Czech 61. Mauritius 96. Turkey
27. Dominican Rep. 62. Mexico 97. Uganda
28. Ecuador 63. Mongolia 98. United Arab Emirates
29. Egypt 64. Morocco 99. Uruguay
30. El Salvador 65. Myanmar 100. Venezuela
31. Ethiopia 66. Namibia 101. Yemen, Rep.
32. Fiji 67. Nepal 102. Zambia
33. Gabon 68. Nicaragua 103. Zimbabwe
34. Gambia 69. Niger
35. Ghana 70. Nigeria
24
References
Alogoskoufis, G. and R. van der Ploeg (1991), Endogenous Growth and OverlappingGenerations, mimeo (Birbeck College, London).
Aschauer, D. (1989), “Is Public Expenditure Productive”,Journal of MonetaryEconomics, vol. 23, 177-200.
Barro, R. J. (1991), “Economic Growth in a Cross-section of Countries”,QuarterlyJournal of Economics, vol. 106, 2, 407-43.
Barro, R. J. and N. G. Sala-i-Martin (1995),Economic Growth, McGraw Hill, NewYork.
Bleaney, M., N. Gemmell and R. Kneller (2001), “Public expenditure, taxation andgrowth: Testing the endogenous growth model”,Canadian Journal of Economics,(forthcoming).
Cashin, P. (1995), “Government spending, taxes and growth”,IMF Staff Papers, Vol.42, 2, pp. 237-69.
Cass, D., (1965), “Optimum Growth in an Aggregative Model of CapitalAccumulation”,Review of Economic Studies, vol. 32, 233-40.
Chamley, C. (1986), “Optimal Taxation of Capital Income in General Equilibrium withInfinite Lives”, Econometrica, vol. 54, 607-22.
Devarajan, S., V. Swaroop and H. Zou (1996), “The composition of public expenditureand economic growth”,Journal of Monetary Economics, 37, 1996, pp. 313-44.
Easterly, W. and S. Rebelo (1993), “Fiscal policy and economic growth”, Journal ofMonetary Economics, 32, 1993, pp. 417-58.
Feldstein, M. (1974), “Tax Incidence in a Growing Economy with Variable LaborSupply”,Quarterly Journal of Economics, vol. 88, 551-73.
Folster, S. and Henrekson, M. (1999), “Growth and the public sector: A critique of thecritics”, European Journal of Political Economy,15 (2), June 1999, pp. 337-58.
Gerson, P. (1998), “The impact of fiscal policy variables on output growth”,IMFWorking Paper: WP/98/01, 1998.
Ghali, K. H. (1997), “Government spending and economic growth in Saudi Arabia”,Journal of Economic Development, 22 (2), Dec. 1997, pp. 165-72.
Haan, J. De, J. Sturm and B. Sikken (1996), “Government capital formation:Explaining the decline”,Weltwirtschaftliches Archiv, 132, 1996, pp. 65-74.
Hanson, P. and M. Henrekson (1994), “A new framework for testing the effect ofgovernment spending on productivity”,Public Choice, 81, 1994, pp. 381-401.
Hutchinson, G. A. and U. Schmacher (1997), “Fiscal expenditure policy and economicgrowth: Evidence from Latin America and the Caribbean”, Social and EconomicStudies, 46(4), Dec. 1997, pp. 1-16.
Jones, C. (1995), “Time series tests of endogenous growth models”, Quarterly Journalof Economics, May 1995, 110, pp. 495-525.
25
Judd, K. (1985), “Redistributive Taxation in a simple perfect Foresight Model”, Journalof Public Economics, vol. 28, 59-83.
Kneller, R., M. Bleaney and N. Gemmell (1999), “Public policy and the governmentbudget constraint: Evidence from the OECD”,Journal of Public Economics, Nov.1999, 74, pp. 171-90.
Kocherlakota, N. and K. M. Yi (1997), “Is there endogenous long-run growth?Evidence from the US and UK”,Journal of Money, Credit and Banking, 29, 1997,pp. 2235-62.
Koopmans, T. (1965), On the Concept of Optimal Economic Growth, in “TheEconometric Approach to Development Planning”,Pontific Acad. Sci. (NorthHolland, Amsterdam, 225-87.
Lucas, R. (1990), “Supply side Economics: An Analytical Review”, Oxford EconomicPapers, vol. 42, 293-316.
Miller, S. and Russek, F. (1997), “Fiscal structures and economic growth: internationalevidence”,Economic Inquiry, 35 (3), July 1997, pp. 603-13.
Odedokun, M. O. (1997), “Relative Effects of Public versus Private InvestmentSpending on Economic Efficiency and Growth in Developing Countries”, AppliedEconomics, vol. 29, 10, 1325-36.
Ram, R. (1986), “Government Size and Economic Growth: Anew Framework and someEvidence from Cross-section and Time-series Data”,American Economic Review,vol. 76, 1, 191-203.
Romer, P. (1986), “Increasing Returns and Long-run Growth”,Journal of PoliticalEconomy, vol. 94, 1002-1037.
Roy, K. C. and Y. R. Vadlamudi (1998), “Government expenditure and economicgrowth under economic change: Selected developing countries”,Indian Journal ofQuantitative Economics, 13 (1), 1998, pp. 90-109.
Slemrod, J. (1995), “What cross-country studies teach about government involvement,prosperity and economic growth?”Brookings Papers on Economic Activity, Vol O,No 3, 1995, pp. 373-415.
Sato, K. (1967), “Taxation and Neoclassical Growth”,Public Finance, 22, 346-70.
Solow, R. (1956), “A Contribution to the Theory of Economic Growth”,QuarterlyJournal of Economics,vol. 70, 65-94.
Tanzi, V. and H. H. Zee (1997), “Fiscal policy and long-run growth”,IMF Staff Papers,44, 1997, pp. 2179-2209.
Temple, J. (1999), “The new growth evidence”,Journal of Economic Literature, vol.37(1), March 1999, pp. 112-56.
White, H. (1980), “A Heteroscedasticity-consistent Covariance Matrix Estimator andDirect Test for Heteroscedasticity”,Econometrica, vol. 48, pp. 817-38.

UNU World Institute for Development Economics Research (UNU/WIDER)was established by the United Nations University as its first research andtraining centre and started work in Helsinki, Finland in 1985. The purpose ofthe Institute is to undertake applied research and policy analysis on structuralchanges affecting the developing and transitional economies, to provide aforum for the advocacy of policies leading to robust, equitable andenvironmentally sustainable growth, and to promote capacity strengtheningand training in the field of economic and social policy making. Its work iscarried out by staff researchers and visiting scholars in Helsinki and throughnetworks of collaborating scholars and institutions around the world.
UNU World Institute for Development Economics Research (UNU/WIDER)Katajanokanlaituri 6 B, 00160 Helsinki, Finland
Camera-ready typescript prepared by Adam Swallow at UNU/WIDERPrinted at UNU/WIDER, Helsinki
The views expressed in this publication are those of the author(s). Publication does not implyendorsement by the Institute or the United Nations University, nor by the programme/project sponsors, ofany of the views expressed.
ISSN 1609-5774ISBN 952-455-268-X (printed publication)ISBN 952-455-269-8 (internet publication)