Discrimination in Grading · the United States that evaluates teachers’ perceptions of African...
44
Discrimination in Grading By REMA N. HANNA AND LEIGH L. LINDEN We report the results of an experiment that was designed to test for discrimination in grading in India. We recruited teachers to grade exams. We randomly assigned child “characteristics” (age, gender, and caste) to the cover sheets of the exams to ensure that there is no relationship between these observed characteristics and the exam quality. We find that teachers give exams that are assigned to be lower-caste scores that are about 0.03 to 0.08 standard deviations lower than those that are assigned to be high caste. The teachers’ behavior appears consistent with statistical discrimination. * This project was funded in part by the University Research Challenge Fund at New York University. Linden also gratefully acknowledges the support of a NAE/Spencer Post-Doctoral Fellowship for his effort on the project. We thank Payal Hathi for outstanding research assistance. We thank Abhijit Banerjee, Amitabh Chandra, David Figlio, Karla Hoff, Asim Khwaja, Michael Kremer, Sendhil Mullainathan, Karthik Muralidharan, Rohini Pande, and Jonah Rockoff for helpful comments. We thank seminar participants at Bocconi University, Facultés Universitaires Notre-Dame de la Paix, NBER Education Meetings at Stanford, the National Academy of Education Spencer Post-Doctoral Fellowship Program and the Harvard Development Lunch. All errors and omissions remain our own. Hana: John F. Kennedy School of Government, Harvard University, Mailbox 26, 79 JFK Street, Cambridge, MA 02138 (e-mail: [email protected]) Linden: Department of Economics, The University of Texas at Austin, 1 University Station C3100, Austin, TX, 78712 (e-mail: [email protected]). Numerous studies have documented what is known as the Pygmalion effect, in which students perform better or worse simply because teachers expect them to do so (see for example, Rosenthal and Jacobson, 1968). In the modern education system, such expectations are set not just by teachers but by a range of evaluators, many of whom have no direct contact with the student, such as admissions officers or the anonymous graders of national and standardized exams. Of
Transcript of Discrimination in Grading · the United States that evaluates teachers’ perceptions of African...

Discrimination in Grading
By REMA N. HANNA AND LEIGH L. LINDEN
We report the results of an experiment that was designed to test for
discrimination in grading in India. We recruited teachers to grade
exams. We randomly assigned child “characteristics” (age, gender,
and caste) to the cover sheets of the exams to ensure that there is no
relationship between these observed characteristics and the exam
quality. We find that teachers give exams that are assigned to be
lower-caste scores that are about 0.03 to 0.08 standard deviations
lower than those that are assigned to be high caste. The teachers’
behavior appears consistent with statistical discrimination.
* This project was funded in part by the University Research Challenge Fund at New York University. Linden also
gratefully acknowledges the support of a NAE/Spencer Post-Doctoral Fellowship for his effort on the project. We thank
Payal Hathi for outstanding research assistance. We thank Abhijit Banerjee, Amitabh Chandra, David Figlio, Karla Hoff,
Asim Khwaja, Michael Kremer, Sendhil Mullainathan, Karthik Muralidharan, Rohini Pande, and Jonah Rockoff for helpful
comments. We thank seminar participants at Bocconi University, Facultés Universitaires Notre-Dame de la Paix, NBER
Education Meetings at Stanford, the National Academy of Education Spencer Post-Doctoral Fellowship Program and the
Harvard Development Lunch. All errors and omissions remain our own. Hana: John F. Kennedy School of Government,
Harvard University, Mailbox 26, 79 JFK Street, Cambridge, MA 02138 (e-mail: [email protected]) Linden:
Department of Economics, The University of Texas at Austin, 1 University Station C3100, Austin, TX, 78712 (e-mail:
Numerous studies have documented what is known as the Pygmalion effect, in
which students perform better or worse simply because teachers expect them to do
so (see for example, Rosenthal and Jacobson, 1968). In the modern education
system, such expectations are set not just by teachers but by a range of evaluators,
many of whom have no direct contact with the student, such as admissions
officers or the anonymous graders of national and standardized exams. Of

particular concern is whether the resulting experiences of students differ
systematically based on observable characteristics, like minority status and
gender. Such discrimination could have long-lasting effects, by reinforcing
erroneous beliefs of inferiority (Steele and Aronson, 1995, 1998; Hoff and
Pandey, 2006) and discouraging children from making human capital investments
(Mechtenberg, 2009; Taijel, 1970; Arrow, 1972; Coate and Loury, 1993).
Additionally, since such external evaluations are often used to determine access to
academic opportunities like competitive schools and higher education, such
discrimination could directly block access to these important resources.
Unlike teaching, however, external evaluations take place away from the
classroom, making it feasible to restrict the information available to evaluators.
Teachers can often deduce the race of a student from physical characteristics
observed in the classroom, but this information can be removed from an exam, for
example, before it is graded. Thus, concerns have entered the discussions on
grading standards both because the expectations conveyed through them affect
student achievement (Figlio and Lucas, 2004) and because more formalized
grading strategies may result in a less equitable distributions of scores (Brennan et
al., 2001; Gallagher, 1998).
Unfortunately, it is difficult to empirically test whether discrimination exists.
Disadvantaged minorities, by definition, come from disadvantaged backgrounds
with many characteristics that are associated with poor academic performance—
few educational resources in schools, low levels of parental education, etc. Thus,
it is hard to understand whether children from minority groups perform worse due
to discrimination or due to other characteristics. Moreover, as Anderson, Fryer
and Holt (2006) discuss, “uncovering mechanisms behind discrimination is
difficult because the attitudes about race, gender, and other characteristics that
serve as a basis for differential treatment are not easily observed or measured.”

In this study, we designed an experiment to investigate discrimination in
grading. We implemented an exam competition in which we recruited children to
compete for a large financial prize (58 USD or 55.5 percent of the parents’
monthly income). We then recruited local teachers and provided each teacher
with a set of exams. We randomly assigned the child “characteristics” (age,
gender, and caste) to the cover sheets of the individual exams that were to be
graded by the teachers in order to ensure that there would be no systematic
relationship between the characteristics observed by the teachers and the quality
of the exams. Therefore, any effect of the randomized characteristics on test
scores can be attributed to discrimination.
Within the education literature, our work builds upon a rich body of research in
the United States that evaluates teachers’ perceptions of African American and
female students (see Ferguson, 2003, for a thorough literature review). Our
methods closely correspond to recent field experiments that have measured racial
discrimination in labor market settings, typically in the hiring of actual applicants.
The researchers either have actual individuals apply for jobs (Fix and Struyk,
1993) or they may submit fictitious job applications to actual job openings
(Bertrand and Mullainathan, 2004; Banerjee, Bertrand, Datta, and Mullainathan,
2009; Siddique, 2008). Under both strategies, the “applicants” are statistically
identical in all respects, except for race or caste group. Unlike pure laboratory
experiments, in which individuals are asked to perform assessments in a
consequence-free environment, an advantage of these experiments is that they
measure the behavior of actual employers making real employment decisions.
The early literature on discrimination in grading practices focuses on small-
scale lab experiments. Subjects were asked to hypothetically evaluate tests, essays
or other student responses for which the researcher has experimentally
manipulated the characteristics of the student to whom the work is attributed.
Many of these early studies find evidence of discrimination: for example,

DeMeis and Turner (1978) find discrimination against African Americans, while
Jacobson and Efferts (1974) find evidence of reverse discrimination with
unsuccessful females being criticized less harshly than males when failing a
leadership task. However, this literature also finds evidence that discrimination
varies by who does the grading (Coates, 1972; Lenney, Mitchell, and Browning,
1983), the type of work being evaluated (Wen, 1979), and the underlying quality
of the individual’s application (Deaux and Taynor, 1973). Compared to our
methodology, many of these older studies have limited sample sizes and ask
graders to assign hypothetical grades. Like the labor market studies, our design
places graders in an environment in which their grades have a material effect on
the well-being of a child because the graders know they determine the awarding
of the prizes.
The second, more recent, strand of the literature compares scores obtained from
non-blind grading to scores awarded under blind grading using observational
data.1
1
Outside of the education context: Goldin and Rouse (2000) find that the adoption of blind auditions for symphony orchestras increase the proportion of hired women. Blank (1991) finds no evidence of gender discrimination when submissions to the The American Economics Review are refereed with or without knowledge of the author’s identity.
Much of this literature tends to find results that contradict the earlier
experimental evidence from the lab, finding no discrimination for minority
students (Shay and Jones, 2006; Dorsey and Colliver, 1995; Baird, 1998;
Newstead and Dennis, 1990). Recent exceptions include Lavy (2008), which
finds that blind evaluations actually help male students, and Botelho, Madeira,
and Rangel (2010) who find evidence of discrimination against black children in
Brazil. While these studies provide important evidence, the same exams are
usually not graded by the same grader or even using the same grading framework,
requiring the researcher to infer differences in grading practices by comparing the
distribution of scores between two different measures of student performance. We

compare the same exams graded under non-blind grading, holding the individual
grader and all but the characteristics of the student constant.
On the whole, we find evidence of discrimination against lower-caste children.
Teachers give exams that are assigned to “lower-caste” scores that are about 0.03
to 0.08 standard deviations lower than exams that are assigned to “high caste.”
These differences are practically very small. They represent, at most, a difference
in exam scores of 1.5 percentage points and given the observed test scores
distribution, a reduction in score of this magnitude would only slightly change a
students’ rank in the distribution. On average, we do not find any evidence of
discrimination by gender or age.
The data appear consistent with statistical discrimination. Graders tend to
discriminate more against children who are graded early in the evaluation process,
suggesting that graders utilize demographic characteristics when the testing
instrument or grade distribution are more uncertain. If the graders were purely
taste-discriminating, there would be little reason to expect that discrimination
would vary by the order in which they graded the exam.
We find no evidence that the subjectivity of the test mattered: in fact, graders
made “less subjective” subjects, such as math, “more” subjective by being
generous with partial credit. Finally, we do not find evidence of in-group bias on
average. In fact, we observe the opposite, with discrimination against the low-
caste children being driven by low-caste graders, and graders from the high-caste
groups appearing not to discriminate at all (even when controlling for the
education and age of grader).
Taken together, these findings offer new insights into discrimination in grading.
First, the results suggest that if discrimination exists in the subtle grading of an
exam, other more blatant forms of discrimination may exist in the educational
system as well. Second, we shed light on the channels through which
discrimination operates, so that these findings can help inform the design of future

anti-discrimination policies. For example, given that the graders appear to
statistically discriminate, policies aimed at making graders more confident in the
testing techniques may, perhaps, reduce the dependence on child characteristics
while grading.
The paper proceeds as follows. Section II provides some background on caste
discrimination and education in India, and articulates our conceptual framework.
Section III describes the methodology, while Section IV describes the data. We
provide the results in Section V. Section VI concludes.
II. BACKGROUND AND CONCEPTUAL FRAMEWORK
A. Caste Discrimination in India
In India, individuals in the majority Hindu religion were traditionally divided
into hereditary caste groups that denoted both their family’s place within the
social hierarchy and their professional occupation. In order of prestige, these
castes were the Brahmin, Kshatriya, Vaishya, and Shudra respectively denoting
priests, warriors/nobility, traders/farmers and manual laborers.
In principle, individuals are now free to choose occupations regardless of caste,
but like race in the United States, these historical distinctions have created
inequities that still exert powerful social and economic influences.2
2
Banerjee and Knight (1985), Lakshmanasamy and Madheswaran (1995), and Unni (2007) give evidence of inequality across groups by earnings, while Rao (1992), Chandra (1997), and Munshi and Rosenzweig (2006) show evidence of inequality in social and economic mobility. Deshpande and Newman (2007) and Madheswaran and Attewell (2007) provide some evidence of discrimination in earnings, while Siddique (2008) and Jodhka and Newman (2007) document discrimination in hiring practices.
Given the
large gap in family income and labor market opportunities between children from
low- and high-castes, it is not surprising that children from traditionally
disadvantaged caste groups tend to have worse educational outcomes than those

from the more advantaged groups. For example, Bertrand, Hanna, and
Mullainathan (2010) show large differences in the entrance exam scores across
caste groups entering engineering colleges, while Holla (2008) shows similar
differences in final high school exams.
While it is difficult to identify the influence of caste separately from poverty
and low socioeconomic status, the potential for discrimination in schools is
significant. Student populations can be diverse and both urban and rural schools
maintain detailed records of their students’ caste and religion, along with other
demographic information such as age, gender, and various information on their
parents (see, for example, He, Linden, and MacLeod, 2008). Anecdotal evidence
suggests that teachers may use this information. For example, the Probe Report
of India (1999) cites cases of teachers banning lower-caste children from joining
school, and Shastry and Linden (2009) show that caste is correlated with the
degree to which teachers exaggerate the attendance of students in conditional cash
transfer programs.
B. Conceptual Framework
We explore three main theories of discrimination in this paper. First, we aim to
distinguish between behaviors that are consistent with taste-based models of
discrimination, in which teachers may have particular preferences for individuals
of a particular group or characteristic (Becker, 1971), and statistical
discrimination, in which teachers may use observable characteristics to proxy for
unobservable skills (Phelps, 1972; Arrow, 1972).
One might think that the process of grading would limit statistical
discrimination in practice, as teachers observe a measure of skill for the child, i.e.
the actual performance on the exam. However, this may not be the case: First,
the teacher may be lazy and may not carefully study each exam to determine its
quality. Instead, he or she may just use the demographic characteristics as a
proxy for skill. Second, teachers may statistically discriminate if they are not
confident about the testing instrument. In particular, teachers may be unsure as to
what the final distribution of grades “should” look like, and therefore, they may
not know how much partial credit to give per question. Thus, teachers may use
the demographics, not as a signal of performance, but rather as a signal of where
the child should place in the distribution.
Our design allows us to test the different implications of these models.3
Second, we explore whether discrimination is more likely to occur in
subjective subjects. The introduction of objective tests (particularly multiple
choice exams) has been championed as a key method for reducing teacher
discrimination. However, these types of tests are not without their detractors,
particularly because objective exams are limited in their ability to capture certain
types of learning (see, for example, Darling-Hammond, 1994; Jae and Cowling,
2008). We explore whether teachers are less likely to discriminate when grading
exams in relatively objective subjects (like math and Hindi) than subjective
subjects (like art).
For example, if teachers practice taste-based discrimination, the level of
discrimination should be constant regardless of the order in which the exam is
graded. On the other hand, we would expect that grades are correlated with exam
order if there is statistical discrimination—more discrimination at the end if
teachers are lazy and more discrimination at the start if teachers are unsure about
the testing instrument and/or the distribution of exam scores.
3 There are very few empirical papers that have tested for the presence of statistical and/or taste-based discrimination.
These include, but are not limited, to: Altonji and Pierret (2001), which finds evidence of statistical discrimination based on schooling, but not race; Han (2004), which performs a test for taste-based discrimination in the credit market and cannot reject the null hypothesis of the non-existence of taste-based discrimination; Levitt (2004), which finds some evidence of taste-based discrimination against older individuals; and List (2004), which finds evidence of statistical discrimination in the sports cards market.
Finally, we test for the presence of in-group bias, i.e. positive bias toward
members of one’s own group (see Anderson, Fryer and Holt, 2006, for a review).
For example, teachers’ beliefs about the average characteristics and capabilities of
children from different castes may be influenced by their own membership in a
particular caste. One might imagine that lower-caste teachers would be less likely
to use caste as a proxy for performance given their intimate experience with low-
caste status or alternatively that they might be partial towards people from their
own social group. However, there are arguments against in-group bias: for
example, low-caste teachers may have internalized a belief that different castes
have different abilities, and thus such teachers may discriminate more against
low-status children. In laboratory experiments, subjects often exhibit behaviors
that are consistent with in-group bias.4
We explore whether low-caste teachers
are more likely to discriminate in favor of low-caste children.
III. METHODOLOGY AND DATA
A. Experimental Design
The experiment is comprised of three components: child testing sessions, the
creation of grading packets, and teacher grading sessions. Each component is
described in depth below.
4
A series of experiments in the psychology literature have found that individuals presented in-group bias even in artificially constructed groups (Vaughn, Tajfel, and Williams, 1981) or groups that were randomly assigned (Billig and Tajfel, 1973). Turner and Brown (1976) studied “in-group bias” when “status” is conferred to the groups, and found that while all subjects were biased in favor of their own group, the groups identified as superior exhibited more in-group bias. More recently, Klein and Azzi (2001) also find that both “inferior” and “superior” groups gave higher scores to people in their own group. In addition, using data from the game show “The Weakest Link,” Levitt (2004) finds that some evidence that men vote more often to remove other men and women vote more for women.

Child Testing Sessions.—In April 2007, we ran exam tournaments for children
between seven and 14 years of age. Our project team went door to door to invite
parents to allow their children to attend a testing session to compete for a 2,500
INR prize (about 58 USD).5 Families were informed that the prizes would be
distributed to the highest scoring child in each of the two age groups (7 to 10
years of age, and 11 to 14 years of age), that the exams would be graded by local
teachers after the testing sessions, and that the prize would be distributed after the
grading was complete. The prize is relatively large, given that the parents earn an
average of 4,500 INR per month (104 USD).6
Over a two-week period, 69 children attended four testing sessions. The
sessions were held in accessible locations such as community halls, empty homes
or temples to ensure that they did not conflict with the school day and that parents
would be able to accompany their children. During the testing sessions, the
project team obtained informed consent and then administered a short survey to
the parents in order to collect information on the child and the basic demographic
characteristics of the family.
Next, the project team administered the exam. We included questions that
tested standard math and language skills, as well as an art section. Math was
selected as the most objective section, covering counting, greater than/less than,
number sequences, addition, subtraction, basic multiplication, and simple word
problems. Language, which was chosen to be the intermediately objective
section, included questions on basic vocabulary, spelling, synonyms, antonyms, 5
For recruitment, our project team mapped the city, collecting demographic information about each community. To ensure that children of varying castes would be present at each session, the team then recruited from neighborhoods with many caste groups or from several homogenous caste neighborhoods.
6 The formula for awarding the prize affects the probability that a given child will benefit from the competition. If
teachers used this information in conjunction with their initial assessments of an exam’s quality, the prize structure may even affect the level of discrimination experienced by different students. For example, our mechanism makes the grading of higher quality exams more important than the grading of low quality exams because only the highest quality exams can receive the prize. It is possible that graders may make an initial (though noisy) assessment of an exam and then decide how much effort to spending grading. They may even choose to rely more on stereotypes when grading exams that they believe have no chance of winning. This is an important question for future research.

and basic reading comprehension. Finally, the art section was designed to be the
most subjective: children were asked to draw a picture of their family doing their
favorite activity and then to explain the activity. The exam took about 1.5 hours.
All parents and children were told that they would be contacted with information
about the prize when grading was complete.
Randomizing Child Characteristics.—Typically, one can only access data on the
actual grades teachers assign to students whose characteristics the teachers know.
This makes it difficult to identify what grade the teacher would have assigned had
another child, with different socioeconomic characteristics, completed the same
exam in an identical manner. To solve this problem, we randomized the
demographic characteristics observed by teachers on each exam so that these
characteristics are uncorrelated with exam quality. (Henceforth, we refer to the
characteristics that are randomly assigned as the “assigned characteristics” and the
characteristics of the child actually giving the exam as the “actual
characteristics”.) Thus, any correlation between the assigned characteristics and
exam scores is evidence of discrimination.
Each teacher was asked to grade a packet of exams. To form these packets,
each completed test was stripped of identifying information, assigned an ID
number, and photocopied. Twenty-five exams were then randomly selected to
form each packet, without replacement, in order to ensure that the teacher did not
grade the same photocopied test more than once. Each exam in the packet was
then given a coversheet, which contained the randomly assigned characteristics:
child’s first name, last name, gender, caste information, and age.7
7
We also include caste categories (General, Other Backward Caste, Scheduled Caste, and Scheduled Tribe), which are groupings of the caste. We find small effects of discrimination against the lower categories, but while the magnitude is the
Each exam
was graded by an average of 43 teachers.

As explained in Section I, one of the main limitations of existing studies that
compare blindly and non-blindly graded exams is that they have to compare
across different graders using different grading standards. We designed our study
to allow for the inclusion of grader fixed effect by stratifying the assignment of
the exams and assigned child characteristics to ensure an equal distribution for
each grader. Since many last names are caste specific, we randomized the last
name and the caste together. Similarly, first name and gender were randomized
together.8
The assigned characteristics were each drawn from an independent
distribution. Caste was assigned as follows: 12.5 percent of the exams were
assigned each to the highest caste (Brahmin) and the next caste (Kshatriya), while
50 percent of the exams were assigned to the Vaishya Caste and 25 percent were
assigned to the Shudra Caste.
For each teacher, we sampled the child’s name without replacement so
that the teacher did not grade two different exams from the same child.
9
We randomly selected the ages of the students
from a uniform distribution between eight and 14, and ensured that gender was
equally distributed among the males and females.
Teacher Grading Sessions.—We next recruited teachers to grade the exams. We
obtained a listing of the city’s schools from the local government and divided
them into government and private schools. For each category, we ranked the
schools using a random number generator. The project team began recruitment at
the schools at the top of the list and approached schools until they obtained the
same across all coefficients, it is only statistically significant when including the blind test score. Disaggregating by category, the effect is driven by the scheduled caste category. Given the overlapping in categories and caste, we cannot isolate different effects between these two groupings.
8 This strategy has the advantage of consistently conveying caste. It does prevent us from identifying the specific
channel through which teachers get the information. It may be possible, for example, that the name alone is enough to convey caste.
9 In addition to being classified into the four large castes, Indian citizens can also be assigned to several affirmative
action categories. These are Scheduled Tribe, Scheduled Caste, and Otherwise Backward Castes. The purpose of the distribution of castes was to ensure variation in both caste and the caste categories to which children could be assigned. These categories are restricted to the lowest two castes. The result of ensuring equal distribution among each category was that 75 percent of exams were assigned to the lowest two castes.

desired number of teachers.10
The recruitment proceeded as follows: First, the project team talked with
the school’s headmaster to obtain permission to recruit teachers. Once permission
was obtained, the team invited teachers to participate in a study to understand
grading practices, where they were told that they would grade twenty-five exams
in return for a 250 INR (about 5.80 USD) payment. The team also informed the
teachers that the child who obtained the highest overall score would receive a
prize worth 2,500 INR (about 58 USD). This prize was designed to ensure that
the grades had real effects on the well-being of the children, just as the grades
assigned by external graders also have a direct impact on things like the receipt of
a scholarship or school admissions.
In total, the project team visited about 167 schools
to recruit 120 teachers, 67 from government schools and 53 from private schools.
11
Each grading session lasted about two hours. The project team provided the
teachers with a complete set of answers for the math and language sections of the
test, and the maximum points allotted for each question for all three test sections.
The team went through the answer set question by question with the teachers.
Teachers were told that partial credit was allowed, but the team did not describe
how it should be allocated. Thus, the teachers were allowed to allocate partial
credit points as they felt appropriate.
Next, the teachers each received 25 randomly selected exams—with the
randomly assigned cover sheets—to grade, as well as a “testing roster” to fill out.
To ensure that teachers viewed the cover sheets, we asked them to copy the cover
sheet information onto the grade roster. They were then asked to grade the exam
and enter the grades onto the roster. When a teacher finished grading, the project 10
Overall, about half of the schools that were approached had teachers that agreed to participate. Generally, teachers cited being busy or a lack of interest as reasons for declining our offer.
11 These results may also have implications for the behavior of teachers in the classroom. However, the incentives in
this study are, of course, not identical to those experienced in the classroom. In the classroom, teachers know much more about a child than is available on our cover sheets and teachers have the opportunity to interact repeatedly with students over the course of the school year.

team administered a short survey to the teacher, which was designed to learn their
demographic characteristics and teaching philosophy.
After all the grading sessions were complete, we computed the average grade
for each child across all teachers who graded his or her exam. We then awarded
the prize to the highest scoring child in each of the age categories based on these
average grades.
B. Data Description
We collected two sets of exam scores. The first set includes the test scores
generated by each teacher. In addition, a member of the research staff graded
each exam on a “blind” basis, with no access to the original characteristics of the
students taking the exam or any assigned characteristics. This was done to
provide an objective assessment of the quality of the individual exam. Note that
while the blind grading was meant to mimic the teacher’s grading procedures, it
was conducted by a project team member who may have graded differently from
the teachers. Finally, note that we normalized the exam scores in the analysis that
follows in order to facilitate comparisons with other studies in the literature. Each
section and the overall exam score are normalized relative to the distribution of
the individual scores for the respective measure.12
In addition, we have data from two surveys. First, we have data from the
parent survey, which contains information on the family’s caste and the child’s
gender and age. Second, we have data from the teacher survey, which included
basic demographic information, such as the teachers’ religion, caste, educational
background, age, and gender. In addition, we also collected information on the
12
We have also estimated the results normalizing relative to the blind test scores. Since this is a linear transformation of the dependent variable, the change only affects the magnitude of the coefficient, and it does not affect the hypothesis tests. However, we obtain similar estimates of the coefficients.

characteristics of teachers’ students. Note that there was almost no variation these
questions–all of the teachers taught low-income students like those in our sample.
C. Empirical Strategy
Our primary specification takes the following form:
(1) ijjjijijij wzvy ετδβ +++=
where yij is the test score assigned to test i by the teacher j and vij is a vector that
is comprised of the randomly assigned characteristics: age, a dummy variable
which indicates that the exam was assigned to a female, and a dummy variable
that indicates whether the test was assigned to one of the lower-caste groups. In
addition, we include grader fixed effects (wj) allowing us to hold the graders’
individual standards fixed. While the random assignment eliminates the
systematic correlation between actual child characteristics and the assigned
characteristics, it is possible that small differences in the types of tests assigned to
each category will exist in any finite sample. To ensure that our estimates are
robust to these small differences, we additionally include a linear control function
that includes the actual characteristics of the child (zij).
IV. DESCRIPTIVE STATISTICS AND INTERNAL VALIDITY
A. Descriptive Statistics
In Table 1, we provide descriptive statistics for the 120 teachers. In Column 1,
we provide the summary statistics for the full sample. In Columns 2 and 3, we
divide the sample by the teachers’ caste. In Columns 4 and 5, we disaggregate the
sample by the teachers’ gender, and finally, we divide the sample by the teachers’
education level in Columns 6 and 7.
Sixty-eight percent of the teachers belong to the upper caste group (Panel A,
Column 1). They tend to be relatively young (35 years) and female (73 percent).
We recruited at both public and private schools, resulting in a fairly equal number
of teachers across the two groups, with 56 percent teaching at private schools.
About half hold a master’s degree. The relationships between the characteristics
generally follow the expected patterns: low-caste teachers are more represented in
private school positions, less likely to have a master’s degree, and more likely to
be male (Columns 2 – 3).
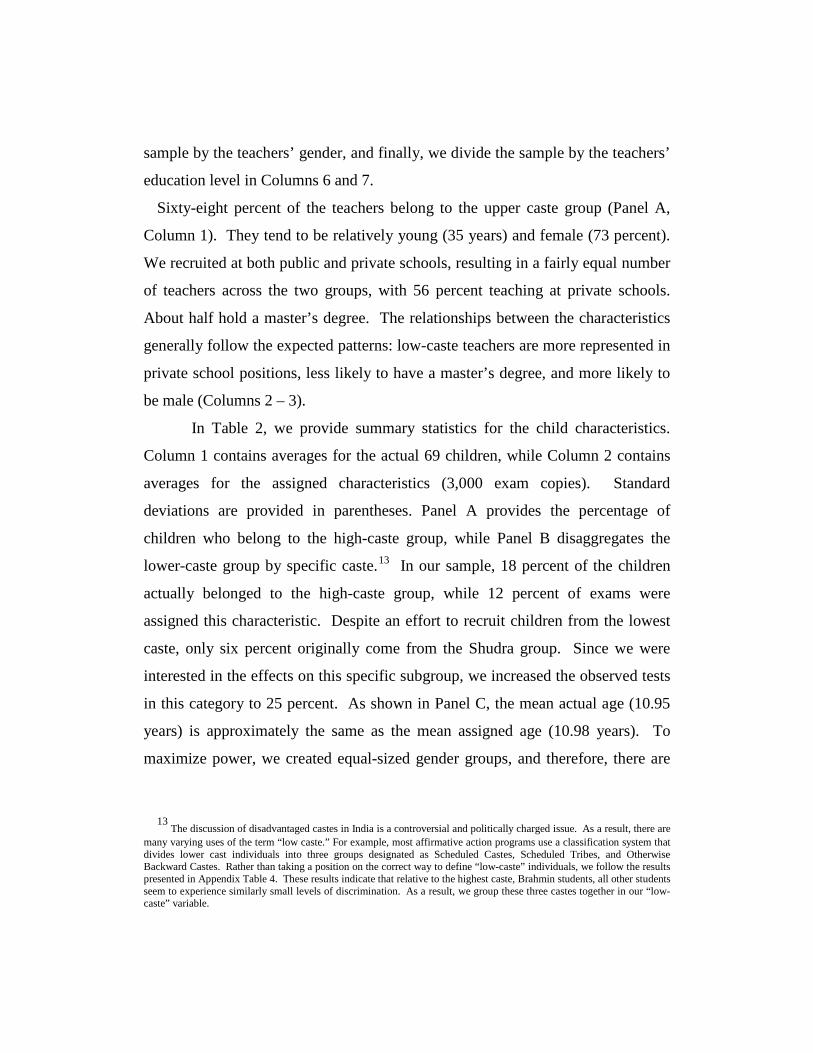
In Table 2, we provide summary statistics for the child characteristics.
Column 1 contains averages for the actual 69 children, while Column 2 contains
averages for the assigned characteristics (3,000 exam copies). Standard
deviations are provided in parentheses. Panel A provides the percentage of
children who belong to the high-caste group, while Panel B disaggregates the
lower-caste group by specific caste.13
13
The discussion of disadvantaged castes in India is a controversial and politically charged issue. As a result, there are many varying uses of the term “low caste.” For example, most affirmative action programs use a classification system that divides lower cast individuals into three groups designated as Scheduled Castes, Scheduled Tribes, and Otherwise Backward Castes. Rather than taking a position on the correct way to define “low-caste” individuals, we follow the results presented in Appendix Table 4. These results indicate that relative to the highest caste, Brahmin students, all other students seem to experience similarly small levels of discrimination. As a result, we group these three castes together in our “low-caste” variable.
In our sample, 18 percent of the children
actually belonged to the high-caste group, while 12 percent of exams were
assigned this characteristic. Despite an effort to recruit children from the lowest
caste, only six percent originally come from the Shudra group. Since we were
interested in the effects on this specific subgroup, we increased the observed tests
in this category to 25 percent. As shown in Panel C, the mean actual age (10.95
years) is approximately the same as the mean assigned age (10.98 years). To
maximize power, we created equal-sized gender groups, and therefore, there are

more females in the assigned sample (50 percent) as compared to the actual
sample (44 percent).
Table 3 provides a description of the test scores. Rather than the
normalized scores, we provide the scores as the fraction of total possible points
here, for easy interpretation. Using the teacher grades (Column 1), the children
scored a total of 60 percent. They scored the lowest in art (47 percent) and the
highest in math (68 percent). The grading of the exam’s art section may have
been more subjective than the math or language sections because the average
score assigned by the teachers (47) is much lower than the scores given by the
blind graders (64). The means of the teachers’ test scores for the math and
language exams are very similar to those of the blind graders (Panel B of Table
3).
Moving away from the differences in subjectivity across tests, the data indicate
that regardless of the subject, teachers do exhibit a fair amount of discretion in
grading overall. Figure 1 provides a description of the total test score range (in
percentages) per test. Each vertical line represents the range of scores assigned to
one of the 69 exams by teachers. The boxes at the center of each line designate
the range of the 25th and 75th percentiles, and the individual dots represent
extreme outliers. Overall, even excluding the numerous outliers, the score ranges
per exam are quite large, indicating that different teachers assigned partial credit
very differently to the same exam.
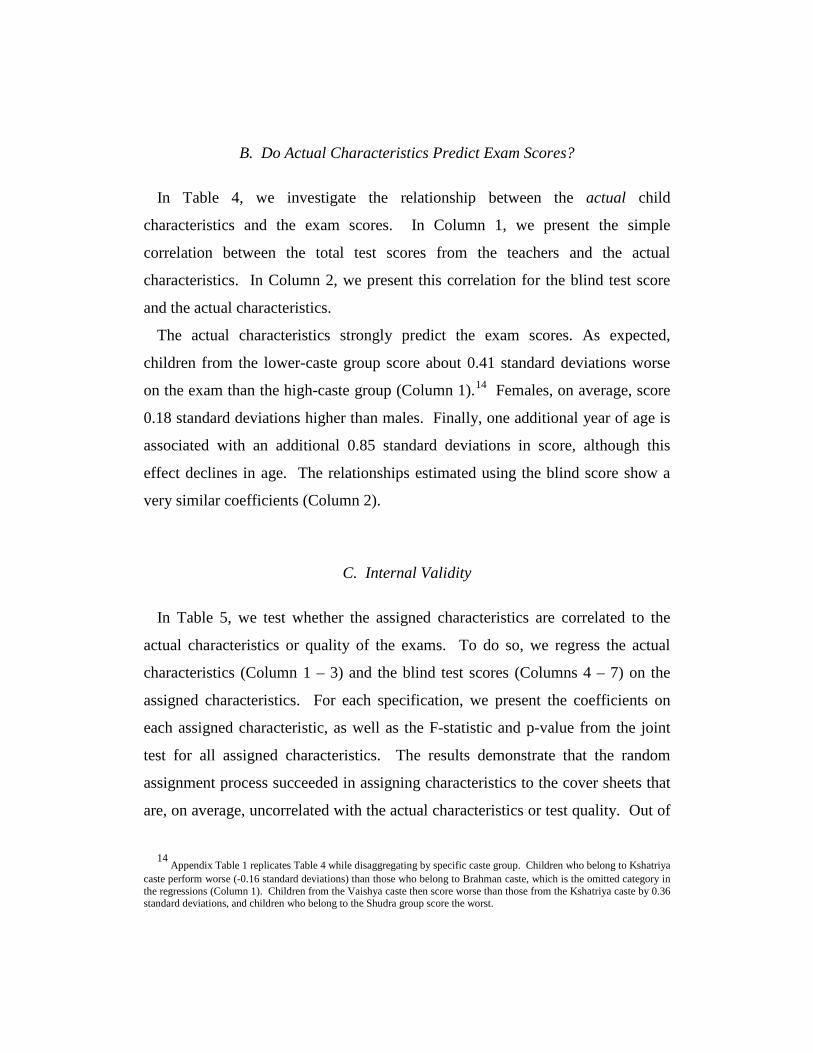
B. Do Actual Characteristics Predict Exam Scores?
In Table 4, we investigate the relationship between the actual child
characteristics and the exam scores. In Column 1, we present the simple
correlation between the total test scores from the teachers and the actual
characteristics. In Column 2, we present this correlation for the blind test score
and the actual characteristics.
The actual characteristics strongly predict the exam scores. As expected,
children from the lower-caste group score about 0.41 standard deviations worse
on the exam than the high-caste group (Column 1).14
Females, on average, score
0.18 standard deviations higher than males. Finally, one additional year of age is
associated with an additional 0.85 standard deviations in score, although this
effect declines in age. The relationships estimated using the blind score show a
very similar coefficients (Column 2).
C. Internal Validity
In Table 5, we test whether the assigned characteristics are correlated to the
actual characteristics or quality of the exams. To do so, we regress the actual
characteristics (Column 1 – 3) and the blind test scores (Columns 4 – 7) on the
assigned characteristics. For each specification, we present the coefficients on
each assigned characteristic, as well as the F-statistic and p-value from the joint
test for all assigned characteristics. The results demonstrate that the random
assignment process succeeded in assigning characteristics to the cover sheets that
are, on average, uncorrelated with the actual characteristics or test quality. Out of 14
Appendix Table 1 replicates Table 4 while disaggregating by specific caste group. Children who belong to Kshatriya caste perform worse (-0.16 standard deviations) than those who belong to Brahman caste, which is the omitted category in the regressions (Column 1). Children from the Vaishya caste then score worse than those from the Kshatriya caste by 0.36 standard deviations, and children who belong to the Shudra group score the worst.

the 28 comparisons, only three of the coefficients are statistically significant, and
all of the coefficients in Columns 4-7 are much smaller in magnitude than those
observed in Table 4. The joint tests provide further evidence: of the seven
estimated equations, only one is statistically significant at the 10 percent level. In
particular, as shown in Column 4, we find little correlation between all of the
assigned characteristics and the quality of the overall exam, as measured by the
blind test score (p-value of .77).15
V. RESULTS
A. Do Teachers Discriminate?
In Table 6, we present the results of the regression of the exam scores on
assigned caste, gender and age.16 In Column 1, we provide the overall effects of
the assigned characteristics on the test scores assigned by the teachers. Given the
randomization, we do not necessarily need to include control variables. However,
doing so may provide us with greater precision. Therefore, we present the results
of specifications in which we control for the actual characteristics (Column 2) and
then additionally include grader fixed effects (Column 3). Finally, we also
control for the blind test score (Column 4). All standard errors are robust.17
As shown in Column 1, we find that the teachers gave, on average, the exams
assigned to be “low-caste” scores that were 0.084 standard deviations lower than
an exam that was assigned to be “high caste” (significant at the ten percent
15
In Appendix Tables 2 and 3, we disaggregate the exam data by individual caste group. The table further confirms that the randomization was successful.
16 In Appendix Table 4, we show the results by disaggregated caste groups. We cannot reject the hypothesis that the
coefficients on the three observed caste variables are significantly different from one another. Therefore, we grouped the variables together to create the “low-caste” variable.
17 Common practice is to cluster at the unit of randomization. However, in our estimates, the randomization occurs at
the level of the individual observation. As a result, we do not cluster the estimates at a pre-specified level.

level).18 Controlling for child characteristics (Columns 2) and teacher fixed
effects (Column 3) does not significantly affect the estimate on the lower-caste
indicator variable, but the addition of the controls improves the precision of the
estimates, which are now statistically significant at the five percent level. The
addition of the blind test score causes the point estimate to fall to -0.026 (Column
4). The estimate, however, remains statistically significant at the ten percent
level.19
Our results suggest that while discrimination may be present, the magnitude of
the overall effect is relatively small. While the estimate from our preferred
specification in Column 3 (including teacher fixed effects and original
characteristics control variables) is 21 percent of the 0.41 standard deviation
observed gap in performance based on actual characteristics for our sample, this
difference is relatively small in absolute terms. It reflects a difference in actual
exam scores of only 1.5 percentage points. Relative to the distribution of blind
scores, a reduction in score by this magnitude at the median would not change a
child’s ranking in the distribution at all.
20
18
It is important to note that in what follows, we can only measure the relative treatment of children in the highest caste to lower-caste children. In all specifications, the highest caste children are the omitted category and the indicator variable for the lower castes measures the difference between the lower castes and the highest caste.
It is hard to imagine such differences
being noticed by an individual child much less altering the child’s self-
perceptions. The effect of the observed 0.41 standard deviation gap by actual
19 Unfortunately, this experiment was not designed to allow the use of test fixed effects. During the random
assignment of characteristics to cover sheets and exams to teachers, we ensured that the assignment of exams to teachers was stratified such that each teacher received a distribution of exams with similar characteristics, allowing for the inclusion of grader fixed effects. While we ensured that the quality of exams were equally distributed (Table 5), we were not able to similarly stratify the assignment of characteristics and graders to the individual exams to ensure that each exam was graded by the same types of teachers and assigned the same distribution of characteristics. As a result, we cannot include exam fixed effects without changing the underlying sample of exams used in the analysis since some exams were not assigned to some castes or types of graders.
20 At other points in the distribution, a child’s ranking would change, but still by only a small amount. At the 75th
percentile, for example, the child’s rank would fall by 5.8 percentage points and at the 25th percentile, the child’s rank would fall by only 1.5 percentage points.

characteristics would cause the median student to fall to the 38.4th percentile, a
decline of 11.6 percentage points.21
We do not find any effect of assigned gender or age on total test scores,
regardless of specification (Table 6).
22 Note that not only are the effects not
statistically significant, but also the magnitudes of the effects are very small.
Given that there is no effect on either age or gender, we focus the rest of the
analysis on caste.23
B. Statistical versus Taste-Based Discrimination
To understand whether discrimination is correlated with exam order, we
randomly ordered the exams in the packet. We can therefore graph the
relationship between assigned scores and grading order by caste group (Figure 2).
The x-axis is the order in which the exams were graded (from 1 to 25). The dotted
line signifies the scores for the assigned low-caste group, while the solid line
signifies this for the assigned high-caste group. We find a gap in test scores
between the assigned low- and high-caste groups at the start of the grading order,
but this effect fades as the place in the grading order increases. 21
A student at the 75th percentile would fall by 21.75 percentage points to the 53.25th, and at the 25th percentile a student’s rank would fall 5.8 percentage points.
22 It is possible that the teachers could gauge actual gender from visual clues such as handwriting if we believe, for example, that girls have neater handwriting. However, we have no evidence that this ever happened. No teacher, for example, was reported to have made remarks suggesting that they found the characteristics surprising, such as by noting that a child had “neat handwriting for a boy.” Moreover, the existing evidence suggests that this may not be a problem: Lavy (2008) finds that the bias against boys is the same in both subjects where girls can be more easily identified from their handwriting and those where it harder deduce gender from the handwriting. It is also possible that the child’s actual age is discernible from the exam. For example, a teacher might have received an exam from a young child that was assigned an older age and not believed the assignment, perhaps ignoring age altogether as a result. The data suggest that it would be difficult to infer age from the quality of an exam: for example, a 14 year-old in the sample scored a 28 on the blind test score, which is lower than the minimum blind test score for a seven year-old (41). More generally, a national survey of children aged seven to 14 in India showed that the range of skills of children vary significantly by age (Pratham, 2005).
23 In results not presented in this draft, we also estimate all of the relationships investigated in Tables 7-9 using age and
gender, but find no differential treatment across these characteristics. Finally, in Appendix Table 5, we show the results of specifications where we interact the low-caste indicator variable with the female dummy variable. The sign of the interaction between low caste and female is positive, but the coefficient is indistinguishable from zero.

We test this in a more formal regression framework in Table 7. In Column 1,
we control for the order in which the exams were graded and add a term to
account for the interaction between the grading order and the assigned
characteristics. In Column 2, we show the results of the interaction between the
assigned characteristics and a variable that indicates that the exam was graded in
the first half of a teacher’s pile. All regressions include the original test
characteristics, the grader fixed effects, and assigned gender and age.
We find that the grading order matters. Independent of order, teachers
mark exams that are assigned to be low caste 0.22 standard deviations lower
(significant at the one percent level; Column 1). As grading order increases, the
difference is mitigated. The first exams that are graded by the teachers exhibit a -
0.22 standard deviations difference between the high-caste and low-caste exams.
By the 25th exam, low-caste exams are treated very much like high-caste exams
with a difference of only 0.042 standard deviations. As shown in Column 2,
being graded in the first half of the packet implies a 0.11 standard deviation gap
between the low and high-caste exams, but this is not statistically significant at
conventional levels.
The evidence appears consistent with statistical discrimination.24
24
Note that the way in which teachers statically discriminate may either be borne out of statistical actualities or their own tastes of how these groups should fare. For example, if the teachers are statistically discriminating, then we would expect them to use observed age to make predictions about the skills of the child, since the age variable has much more predictive power than caste. However, assigned age does not predict the test scores. Thus, if they are statistically discriminating, then the teachers might have incomplete information, might just be bad at making statistical predictions as to how children of particular groups will fare on the exams, or might discriminate based on preconceived notions of how different groups should perform.
Teachers
may statistically discriminate in two ways. First, teachers may be lazy and use
statistical discrimination to reduce the amount of time they need to spend grading
each exam. While we cannot fully rule out this possiblity, the fact that the
teachers knew that a large prize was at stake increased the seriousness of the
exercise. When they were confused, the teachers asked the project team questions
and all of the teachers spent a fair bit of time grading each exam. Moreover, if
teachers were lazy, then we might expect them to mark wrong answers as “0”
right away, and not spend time thinking through the answer to determine the
correct level of partial credit. In fact, we observed the opposite: teachers gave a
considerable amount of partial credit for wrong answers. Finally, we might
expect that lazy teachers would discriminate more at the end of the packet, as they
become more fatigued from grading. However, this was not the case. Thus, it
does not appear as though the teachers were shirking their responsibilities.
Second, teachers may statistically discriminate if there is uncertainty over how
to give partial credit, or they would like to give out a certain quantity of “good”
scores and they are unsure what the final test score distribution will be. In this
case, the teachers may use the characteristics of a child, not as a signal of
performance, but rather as a signal of where the child will end up in the
distribution. Here, we would expect more discrimination at the start of the exam,
when teachers are learning about the exam distribution.25
C. The Subjectivity of the Exam
It is possible that teachers might not be able to discriminate if they have little
leeway in assigning points to the exam questions. Thus, we specifically included
subjects on the exam that had different levels of subjectivity.26
25
If teachers are statistically discriminating, then natural repeated interactions in the classroom may reduce discrimination. However, if discrimination early on during the course of the year leads to a self-fulfilling prophesy, statistical discrimination early in the school year may have long lasting effects throughout the school year.
In Table 8, we
present the results disaggregated by subject. All specifications include the
26 Unfortunately, the order in which teachers graded the exam was always the same: math, Hindi, and then art.
Ideally, we would have randomized the order that the teachers graded questions across the exams, but we did not want to confuse the teachers. Thus, it is possible that the teachers learn the “quality” of the child from carefully grading questions early on (i.e. the math section) and this biased their grading of later sections (i.e. the art section). This may bias us against finding differences across subjects.
original test characteristics, grader fixed effects, and assigned age and gender.
We do not observe significant differences across the three subjects. Even in the
art section, the reduction in test scores for assigned low caste is similar to that of
the math section.
To better understand these results, we took a closer look at the points assigned
for each question on the exam. We did not give the teachers advice about how to
assign points for each question. We only provided guidance on the maximum
number of possible points. Despite the fact that the questions on the test were
relatively simple, the graders still made an effort to assign students partial credit
for the questions on the Hindi section (and also, to a lesser degree, the math
section). Therefore, even though the art exam was the most subjective, graders
managed to exert discretion over all of the exams.
D. In-Group Bias
Finally, we explore whether teachers differ in the degree to which they utilized
the assigned characteristics when grading. Individuals may discriminate in favor
of their own group (in-group bias), and therefore we test if low-caste teachers
favor low-caste children. In addition, we estimate whether the degree of
discrimination varies by teachers’ gender, education level or age, since the
literature suggests that these characteristics may also influence the level of
discrimination. Specifically, educated teachers may be more aware and tolerant
of diversity, whereas older teachers may have more experience teaching students
of different backgrounds.
We present the results of our analysis in Table 9. We present the results by
caste, gender, master’s degree completion, and age in Panels A through D,
respectively. In Column 1, we show the results for the sample that is listed in the

panel title, while in Column 2, we show the results for the remaining teachers. In
Column 3, we present the estimated difference between the coefficients.
We do not find evidence of in-group bias. In fact, we observe the opposite. We
do not see any difference in test scores between exams assigned to be lower caste
and those assigned to be high caste for high-caste teachers (Column 1, Panel A).
However, low-caste teachers (Column 2) seem to have discriminated significantly
against members of their own group. The difference between low- and high-caste
teachers is large—about 0.18 standard deviations—and significant at the five
percent level (Column 3).27
Turning to gender, we observe that female teachers significantly downgrade
low-caste exams, while male teachers do not. However, the coefficient of the
effects for male teachers is not significantly different than the coefficient for
female teachers. Although, while the coefficients are similar, the sample size of
male teachers is much smaller (33 male teachers versus 87 female teachers),
increasing the variance in the estimates. Finally, we find no significant difference
in caste discrimination by teachers’ education or age.
VII. CONCLUSION
While education has the power to transform the lives of the poor, children who
belong to traditionally disadvantaged groups may not reap the full benefits of
education if graders systematically discriminate against them. Through an
experimental design, we find evidence that teachers discriminate against low-
caste children while grading exams. For example, we find that the teachers give
27
Caste ranking are extremely detailed. So, there are lower subgroups even within the low-caste groups. We can observe that generally low-caste graders are differentially treat low-caste children relative to high-caste children. A question for future research, which would require a more detailed analysis with a much larger sample size, is to investigate whether teachers are discriminating generally against lower-caste students or targeting particular (possibly lower) subgroups.
exams that are assigned to be upper caste scores that are, on average, 0.03 to 0.08
standard deviations higher than those assigned to be lower caste. We do not find
any overall evidence of discrimination by gender. The evidence suggests that
teachers may be practicing statistical discrimination. On average, we do not find
evidence of in-group bias.
The findings from this study provide a clear direction for future research. First,
the study suggests that external graders are practicing statistical discrimination
when there is more uncertainty over the testing instrument. This could imply that
policies designed to increase understanding of an exam may reduce
discrimination. Future research should try to determine whether improving
confidence and quality through training programs reduces discrimination.
Second, graders naturally added subjectivity to “objective” subjects like math
through the generous use of partial credit. It is important to understand how
graders assign partial credit and whether helping them learn to better standardize
grading mechanisms can reduce discrimination, while still allowing for the
flexibility that open-ended questions provide. Finally, if discrimination is present
in the subtle art of grading, this suggests that teachers may discriminate through
other mechanisms as well. Suitably modified, experiments such as this might be
able to capture these other mechanisms through which teachers convey biases.
REFERENCES
Altonji, Joseph and Charles Pierret. 2001. “Employer Learning and Statistical
Discrimination.” Quarterly Journal of Economics 116 (1): 313-350.
Anderson, Lisa, Roland Fryer and Charles Holt. 2006. “Discrimination:
Experimental Evidence from Psychology and Economics.” In Handbook on the

Economics of Discrimination, edited by William M. Rogers, 97-118.
Northampton, MA: Edward Elgar.
Arrow, Kenneth. 1972. “Models of Job Discrimination.” In Racial Discrimination
in Economic Life, edited by A. H. Pascal, 83-102. Lexington, MA: D. C.
Health.
Baird, Jo-Anne. 1998. “What’s in a Name? Experiments with Blind Marking in
A-Level Exams.” Educational Research 40(2): 191-202.
Banerjee, Abhijit, Marianne Bertrand, Saugato Datta, and Sendhil Mullainathan.
2009. “Labor Market Discrimination in Delhi: Evidence from a Field
Experiment.” Journal of Comparative Economics 37(1): 14-27.
Banerjee, Biswajit and J.B. Knight. 1985. “Caste Discrimination in the Indian
Urban Labour Market.” Journal of Development Economics 17(3): 277-307.
Becker, Gary. 1971. The Economics of Discrimination, 2nd
ed. Chicago:
University of Chicago Press.
Bertrand, Marianne, Rema Hanna, and Sendhil Mullainathan. 2010. “Affirmative
Action in Education: Evidence from Engineering College Admissions in India.”
Journal of Public Economics 94(1-2): 16-29.
Bertrand, Marianne and Sendhil Mullainathan. 2004. “Are Emily and Greg More
Employable than Lakisha and Jamal? A Field Experiment on Labor Market
Discrimination.” American Economic Review 94(4): 991-1013.

Billig, Michael and Henri Tajfel. 1973. “Social Categorization and Similarity in
Intergroup Behavior.” European Journal of Social Psychology 3(1): 27-52.
Blank, Rebecca M. 1991. “The Effects of Double-Blind versus Single-Blind
Reviewing: Experimental Evidence from the American Economic Review.” The
American Economic Review 81(5): 1041-1067.
Botelho, Fernando, Ricardo Madeira, and Marcos Rangel. 2010. “Discrimination
Goes to School? Racial Differences in Performance Assessments by Teachers.”
Unpublished Manuscript. Department of Economics, University of Sao Paulo.
Brennan, Robert, Jimmy Kim, Melodie Wenz-Gross, and Gary N. Siperstein.
2001. “The Relative Equitability of High-Stakes Testing versus Teacher-
Assigned Grades: An Analysis of the Massachusetts Comprehensive
Assessment System (MCAS).” Harvard Education Review. 71(2): 173-216.
Chandra, V.P. 1997. “Remigration: Return of the Prodigals: An Analysis of the
Impact of the Cycles of Migration and Remigration on Caste Mobility.”
International Migration Review. 31(1): 1220-1240.
Coate, Steven and Glenn Loury. 1993. “Will Affirmative Action Eliminate
Negative Stereotypes?” American Economic Review 83(5): 1220-1240.
Coates, Brian. 1972. “White Adult Behavior toward Black and White Children.”
Child Development 43(1): 143-154.
Darling-Hammond, Linda. 1994. “Performance-Based Assessment and
Educational Equity.” Harvard Educational Review 64 (1): 5-26.
Deaux, Kay and Janet Taynor. 1973. “Evaluation of Male and Female Ability:
Bias Works Two Ways.” Psychological Reports 32: 261-262.
DeMeis, Debra Kanai and Ralph R. Turner. 1978. “Effects of Students’ Race,
Physical Attractiveness, and Dialect on Teachers’ Evaluations.” Contemporary
Educational Psychology 3(1): 77-86.
Deshpande, Ashwini and Katherine Newman. 2007. “Where the Path Leads: The
Role of Caste in Post-University Employment Expectations.” Economic and
Political Weekly 42(41): 4133-4140.
Dorsey, J. Kevin and Jerry. A. Colliver. 1995. “Effect of Anonymous Test
Grading on Passing Rates as Related to Gender and Race.” Academic Medicine
70(4): 321-323.
Ferguson, Ronald. 2003. “Teachers’ Perceptions and Expectations and the Black-
White Test Score Gap.” Urban Education 38(4): 460-507.
Figlio, David and Maurice Lucas. 2004. “Do High Grading Standards Affect
Student Performance?” Journal of Public Economics 88: 1815-1834.
Fix, M. and R. Struyk. 1993. Clear and Convincing Evidence. Washington, DC:
The Urban Institute Press.
Gallagher, Ann. 1998. “Gender and Antecedents of Performance in Mathematics
Testing.” Teachers College Record 100(2): 297-314.
Goldin, Claudia and Cecilia Rouse. 2000. “Orchestrating Impartiality: The Impact
of ‘Blind’ Auditions on Female Musicians.” The American Economic Review
90(4): 715-741.
Han, Song. 2004. “Discrimination in Lending: Theory and Evidence.” Journal of
Real Estate Finance: Economics 29(1): 5-46
He, Fang, Leigh Linden, and Margaret MacLeod. 2008. “How to Teach English in
India: Testing the Relative Productivity of Instruction Methods within the
Pratham English Language Education Program.” Unpublished Manuscript.
Department of Economics, The University of Texas at Austin.
Hoff, Karla and Priyanka Pandey. 2006. “Discrimination, Social Identity, and
Durable Inequalities.” American Economic Review, Papers and Proceedings
96(2): 206-211.
Holla, Alaka. 2008. “Caste Discrimination in School Admissions: Evidence from
Test Scores.” Innovations for Poverty Action Working Paper.
Jacobson, Marsha B. and Joan Effertz. 1974. “Sex Roles and Leadership:
Perceptions of the Leaders and the Led.” Organizational Behavior and Human
Performance 12(3): 383-396.
Jae, Haeron and John Cowling. 2008. “Objectivity in Grading: The Promise of
Bar Codes.” College Teaching 57(1): 51-55.
Jodhka, Surinder S. and Katherine Newman. 2007. “In the Name of Globalisation:
Meritocracy, Productivity and the Hidden Language of Caste.” Economic and
Political Weekly 42(41): 4125- 4132.
Klein, Oliver and Assad Azzi. 2001. “Do High Status Groups Discriminate More?
Differentiation Between Social Identity and Equity Concerns.” Social Behavior
& Personality 29(3): 209-221.
Kremer, Michael, Edward Miguel, and Rebecca Thornton. 2009. “Incentives to
Learn.” Review of Economics and Statistics 91(3): 437-456.
Lakshmanasamy, T. and S. Madheshwaran. 1995. “Discrimination by
Community: Evidence from Indian Scientific and Technical Labour Market.”
Indian Journal of Social Science 8(1): 59-77.
Lavy, Victor. 2008. “Do Gender Stereotypes Reduce Girls’ or Boys’ Human
Capital Outcomes? Evidence from a Natural Experiment.” Journal of Public
Economics 92(10-11): 2083-2105.
Lenney, Ellen, Linda Mitchell, and Chris Browning. 1983. “The Effect of Clear
Evaluation Criteria on Sex Bias in Judgments of Performance.” Psychology of
Women Quarterly 7(4): 313-328.
Levitt, Steven. 2004. “Testing Theories Of Discrimination: Evidence From
Weakest Link.” Journal of Law and Economics 47(2): 431-452.
List, John. 2004. “The Nature and Extent of Discrimination in the Marketplace:
Evidence from the Field.” The Quarterly Journal of Economics 119(1): 49-89.
Madheshwaran, S. and Paul Attewell. 2007. “Caste Discrimination in the Indian
Urban Labour Market: Evidence from the National Sample Survey.” Economic
and Political Weekly 42(41): 4146-4153.
Mechtenberg, Lydia. 2009. “Cheap Talk in the Classroom: How Biased Grading
at School Explains Gender Differences in Achievements, Career Choices, and
Wages.” Review of Economic Studies 76(4): 1431-1459.
Munshi, Kaivan and Mark Rosenzweig. 2006. “Traditional Institutions Meet the
Modern World: Caste, Gender, and Schooling Choice in a Globalizing
Economy.” American Economic Review 96(4): 1225-1252.
Newstead, Stephen E. and Ian Dennis. 1990. “Blind Marking and Sex Bias in
Student Assessment.” Assessment and Evaluation in Higher Education 15(2):
132-139.
Phelps, Edmund. 1972. “The Statistical Theory of Racism and Sexism.” American
Economic Review 62(3): 659-661.
Pratham. 2005. “Annual Status of Education Report.” Pratham Resource Center:
Mumbai, India.
The PROBE Report. 1999. Public Report on Basic Education in India. New
Delhi, India: Oxford University Press.
Rao, V. 1992. “Does Prestige Matter? Compensating Differential for Social
Mobility in the Indian Caste System.” University of Chicago Economics
Research Center Working Paper Series No. 92-6.

Rosenthal, Robert and Lenore Jacobsen. 1968. “Pygmalion in the Classroom.”
The Urban Review 3(1): 16-20.
Shay, S. and B. Jones. 2006. “Anonymous Examination Marking at University of
Cape Town: The Quest for an `Agonising-Free Zone’.” South African Journal
of Higher Education 20(4): 528-546.
Shastry, Gauri Kartini and Leigh Linden. 2009. “Identifying Agent Discretion:
Exaggerating Student Attendance in Response to a Conditional School
Nutrition Program.” Unpublished Manuscript. Department of Economics, The
University of Texas at Austin.
Siddique, Zahra. 2008. “Caste Based Discrimination: Evidence and Policy.” IZA
Discussion Paper Series No 3737.
Steele, Claude and Joshua Aronson. 1998. “Stereotype Threat and the Intellectual
Test Performance of African-Americans.” Journal of Personality and Social
Psychology 69(5): 797-811.
Tajfel, Henri. 1970. “Experiments in Inter-Group Discrimination.” Scientific
American 223(5): 96-102.
Tukey, J. W. 1977. Exploratory Data Analysis. Reading, MA: Addison–Wesley.
Turner, J. C. and R. J. Brown. 1976. “Social Status, Cognitive Alternatives, and
Intergroup Relations.” In Differentiation Between Social Groups: Studies in the
Social Psychology of Intergroup Relations, edited by H. Tajfel. European
Monographs in Social Psychology. Academic Press: London.

Unni, Jeemol. 2007. “Earnings and Education among Social Groups.” In State,
Markets and Inequalities: Human Development in Rural, edited by A. Shariff
and M. Krishnaraj. India, Orient Longman: New Dehli.
Vaughan, G. M., H. Tajfel, and J. Williams. 1981. “Bias in Reward Allocation in
an Intergroup and an Interpersonal Context.” Social Psychology Quarterly
44(1), 37-42.
Wen, Shih-Sung. 1979. “Racial Halo on Evaluative Grading: General or
Differential?” Contemporary Educational Psychology 4: 15-19.

TABLE 1: TEACHER CHARACTERISTICS
All Caste Gender Education
High Caste Low Caste Female Male No Master's Master's
Characteristic (1) (2) (3) (4) (5) (6) (7)
Number of Teachers 120 81 39 87 33 61 59 High Caste 0.68 1.00 0.00 0.75 0.48 0.61 0.75 Female 0.73 0.80 0.56 1.00 0.00 0.67 0.78 Age 35.33 36.77 32.33 36.33 32.67 32.92 37.81 Less than a Master's Degree 0.51 0.46 0.62 0.47 0.61 1.00 0.00
Private School 0.56 0.49 0.69 0.49 0.73 0.70 0.41

TABLE 2: CHILD CHARACTERISTICS
Actual Assigned (1) (2)
Panel A. High Caste 0.18 0.12 (0.39) (0.33) Panel B. Low Caste Kshatriya 0.24 0.12 (0.43) (0.33) Vaishya 0.34 0.50 (0.47) (0.50) Shudra 0.06 0.25 (0.23) (0.43) Unknown Caste/Not Hindu 0.18 (0.38) Panel C. Other Female 0.44 0.50 (0.50) (0.50) Age 10.95 10.98
(2.04) (2.00)
Notes:
1. The actual characteristics, listed in Column 1, include data on all 69 children who completed a test and a demographic survey.
2. Column 2 provides data on the randomly assigned characteristics. This column summarizes the data from the 3,000 coversheets in the study (25 for each of 120 teachers).
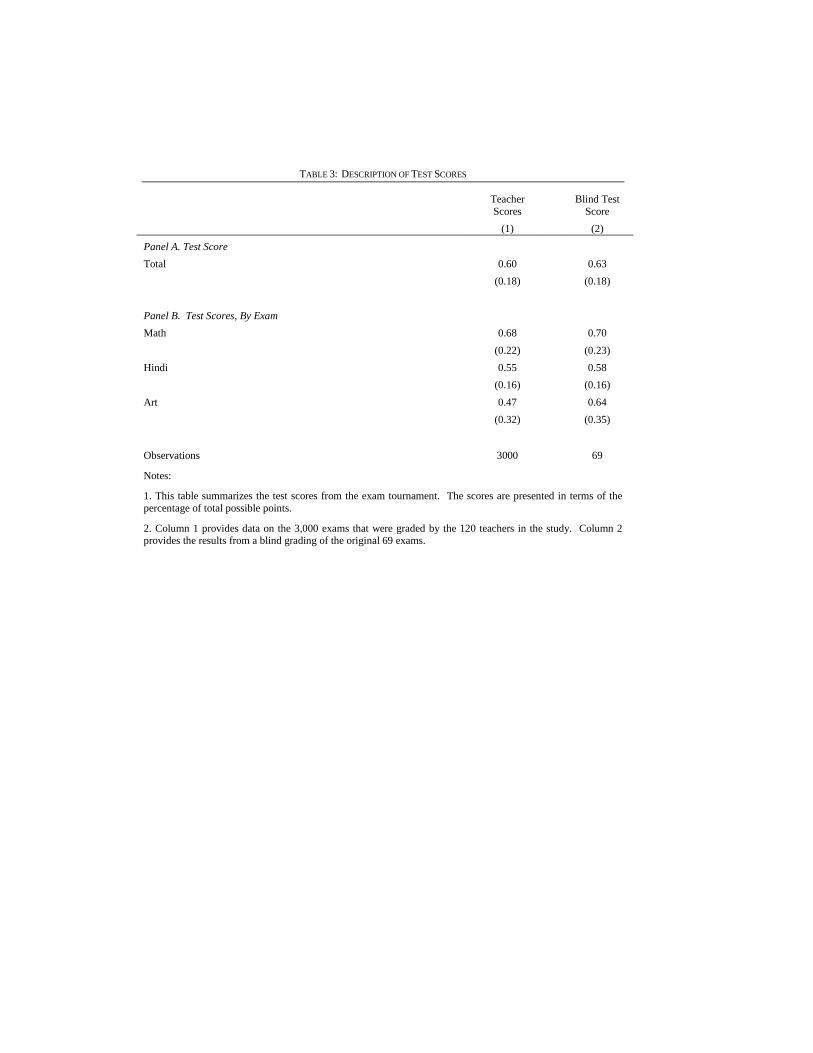
TABLE 3: DESCRIPTION OF TEST SCORES
Teacher Scores
Blind Test Score
(1) (2)
Panel A. Test Score Total 0.60 0.63
(0.18) (0.18)
Panel B. Test Scores, By Exam Math 0.68 0.70 (0.22) (0.23) Hindi 0.55 0.58 (0.16) (0.16) Art 0.47 0.64 (0.32) (0.35)
Observations 3000 69
Notes:
1. This table summarizes the test scores from the exam tournament. The scores are presented in terms of the percentage of total possible points.
2. Column 1 provides data on the 3,000 exams that were graded by the 120 teachers in the study. Column 2 provides the results from a blind grading of the original 69 exams.

FIGURE 1: RANGE PER GIVEN TEST
Notes:
1. Figure 1 provides the range of test scores (in percentages) given by the teachers for each of the 69 exams used in the study.
2. Each bar provides information for an individual test (the x-axis is the test number), and the bar indicates the range of test scores for each test assigned by teachers. The upper and lower ends of each bar are the upper and lower adjacent values and the dots represent outlying values following Tukey (1977).
0.2
.4.6
.81
Perc
enta
ge o
f Tot
al Po
ssibl
e Sc
ore
12
34
56
78
910
1112
1314
1516
1718
1920
2122
2324
2526
2728
2930
3132
3334
3536
3738
3940
4142
4344
4546
4748
4950
5152
5354
5556
5758
5960
6162
6364
6566
6768
69
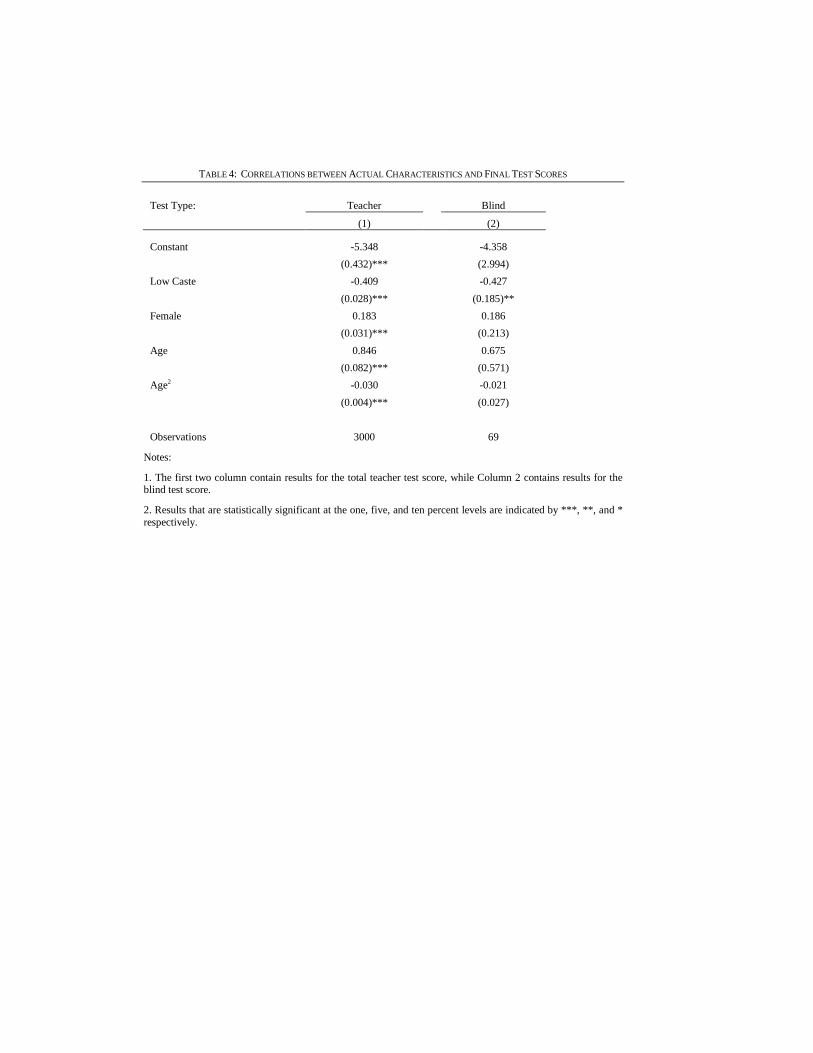
TABLE 4: CORRELATIONS BETWEEN ACTUAL CHARACTERISTICS AND FINAL TEST SCORES
Test Type: Teacher Blind
(1) (2)
Constant -5.348 -4.358 (0.432)*** (2.994) Low Caste -0.409 -0.427 (0.028)*** (0.185)** Female 0.183 0.186 (0.031)*** (0.213) Age 0.846 0.675 (0.082)*** (0.571) Age -0.030 2 -0.021 (0.004)*** (0.027) Observations 3000 69
Notes:
1. The first two column contain results for the total teacher test score, while Column 2 contains results for the blind test score.
2. Results that are statistically significant at the one, five, and ten percent levels are indicated by ***, **, and * respectively.

TABLE 5: RANDOMIZATION CHECK
Actual Characteristics Blind Scores
Low Caste Female Age Total Math Hindi Art
(1) (2) (3) (4) (5) (6) (7)
Low Caste -0.035 0.006 -0.071 -0.064 -0.062 -0.057 -0.051
(0.020)* (0.027) (0.115) (0.050) (0.052) (0.047) (0.051)
Female -0.020 -0.022 -0.022 0.011 0.030 -0.001 -0.018
(0.014) (0.018) (0.075) (0.034) (0.036) (0.032) (0.034)
Age -0.063 -0.100 0.053 -0.013 0.044 -0.067 -0.007
(0.044) (0.058)* (0.239) (0.106) (0.112) (0.100) (0.109)
Age^2 0.003 0.004 -0.003 0.001 -0.002 0.003 -0.000
(0.002) (0.003)* (0.011) (0.005) (0.005) (0.005) (0.005)
Observations 3000 3000 3000 3000 3000 3000 3000
F-Stat 2.1 1.18 0.25 0.44 0.65 0.49 0.89
P-Value 0.0779 0.3184 0.911 0.7787 0.6245 0.7401 0.4704
Notes:
1. This table contains regressions of the actual characteristics of the children of each exam on the characteristics randomly assigned to the coversheet on the copy of the exam that was graded by teachers.
2. The F-statistic and p-value provide the results of a test of joint significance of the observed characteristics.
3. Results that are statistically significant at the one, five, and ten percent levels are indicated by ***, **, and * respectively.

TABLE 6: EFFECT OF ASSIGNED CHARACTERISTICS ON TOTAL TEST SCORES
Assigned Characteristics (1) (2) (3) (4)
Low Caste -0.084 -0.081 -0.081 -0.026 (0.048)* (0.037)** (0.038)** (0.013)* Female 0.020 0.014 0.013 0.008 (0.033) (0.027) (0.027) (0.010) Age 0.001 0.003 0.003 0.001 (0.008) (0.007) (0.007) (0.003) Actual Test Characteristics YES YES YES Grader Fixed Effect YES YES
Blind Test Score YES
Notes:
1. This table presents the regression of total normalized test scores on the randomly assigned characteristics. The sample includes the 3,000 graded exams (graded in sets of 25 by 120 teachers).
2. Results that are statistically significant at the one, five, and ten percent levels are indicated by ***, **, and * respectively.

FIGURE 2: THE CASTE GAP, BY GRADING ORDER
Notes:
1. Figure estimates the relationship between the normalized total score and the order in which the exams were graded. Relationship estimated using a local linear polynomial estimate with an Epanechnikov kernal and a bandwidth of 5.
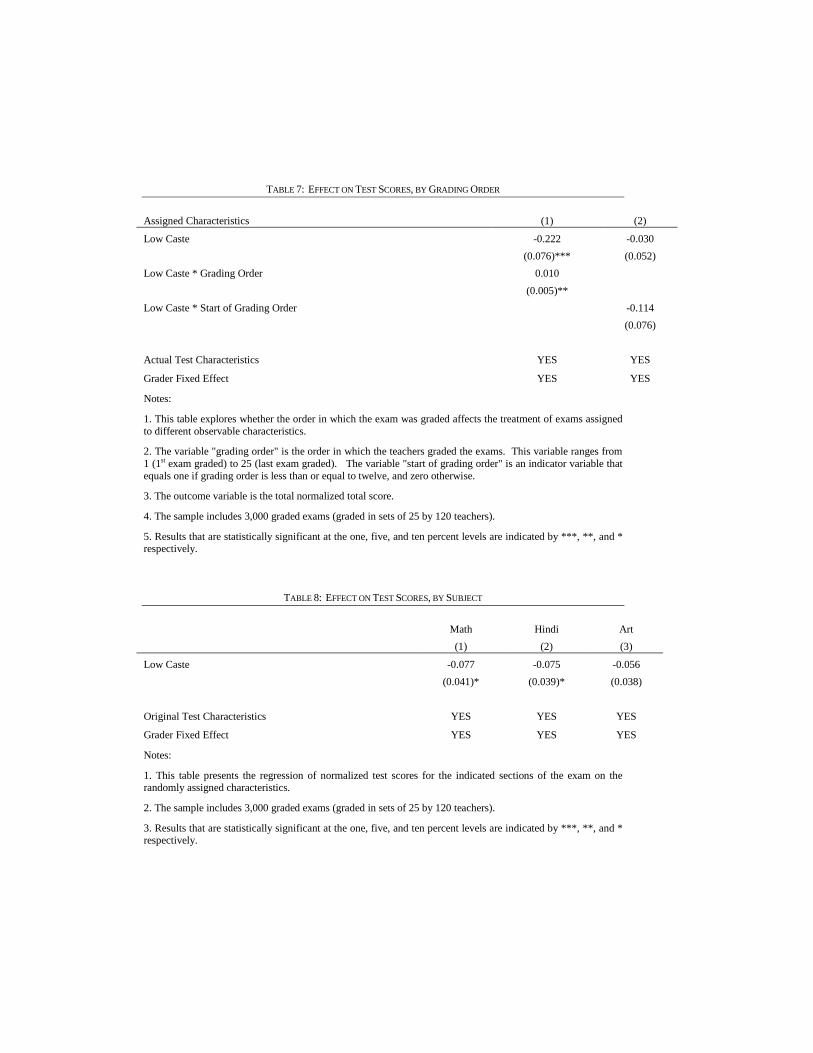
TABLE 7: EFFECT ON TEST SCORES, BY GRADING ORDER
Assigned Characteristics (1) (2)
Low Caste -0.222 -0.030 (0.076)*** (0.052) Low Caste * Grading Order 0.010 (0.005)** Low Caste * Start of Grading Order -0.114 (0.076) Actual Test Characteristics YES YES
Grader Fixed Effect YES YES
Notes:
1. This table explores whether the order in which the exam was graded affects the treatment of exams assigned to different observable characteristics.
2. The variable "grading order" is the order in which the teachers graded the exams. This variable ranges from 1 (1st
3. The outcome variable is the total normalized total score.
exam graded) to 25 (last exam graded). The variable "start of grading order" is an indicator variable that equals one if grading order is less than or equal to twelve, and zero otherwise.
4. The sample includes 3,000 graded exams (graded in sets of 25 by 120 teachers).
5. Results that are statistically significant at the one, five, and ten percent levels are indicated by ***, **, and * respectively.
TABLE 8: EFFECT ON TEST SCORES, BY SUBJECT
Math Hindi Art (1) (2) (3)
Low Caste -0.077 -0.075 -0.056 (0.041)* (0.039)* (0.038) Original Test Characteristics YES YES YES
Grader Fixed Effect YES YES YES
Notes:
1. This table presents the regression of normalized test scores for the indicated sections of the exam on the randomly assigned characteristics.
2. The sample includes 3,000 graded exams (graded in sets of 25 by 120 teachers).
3. Results that are statistically significant at the one, five, and ten percent levels are indicated by ***, **, and * respectively.

TABLE 9: EFFECT ON TEST SCORES, BY TEACHER TYPE
Belongs to panel title
category?
Difference Yes No (1) (2) (3)
Panel A. Upper Caste
Low Caste -0.021 -0.212 0.184
(0.047) (0.063)*** (0.078)**
Panel B. Male
Low Caste -0.060 -0.088 0.029
(0.073) (0.044)** (0.085)
Panel C. Masters Degree
Low Caste -0.074 -0.084 0.010
(0.050) (0.056) (0.075)
Panel D. Below Median Age
Low Caste -0.126 -0.035 -0.092
(0.050)** (0.056) (0.075)
Assigned Test Characteristics YES YES YES
Grader Fixed Effect YES YES YES
Notes:
1. This table presents estimates of discrimination disaggregated by the characteristics of the teachers.
2. Estimates presented in Column 1 are for tests graded only by teachers who have the characteristics indicated in the panel name. Column 2 contains estimates using only tests for teachers that do not have the indicated characteristic. Finally, Column 3 presents an estimate of the coefficient on the interaction of the teacher's characteristic with the indicated observed child characteristics.
3. The sample includes 3,000 graded exams (graded in sets of 25 by 120 teachers).
4. The outcome in every regression is the normalized total score.
5. Results that are statistically significant at the one, five, and ten percent levels are indicated by ***, **, and * respectively.