Discrimination and Nepotism Within Police Specialty Units
91
Portland State University Portland State University PDXScholar PDXScholar Dissertations and Theses Dissertations and Theses 2002 Discrimination and Nepotism Within Police Specialty Discrimination and Nepotism Within Police Specialty Units Units Robert Norvell Hollins III Portland State Follow this and additional works at: https://pdxscholar.library.pdx.edu/open_access_etds Part of the Criminology and Criminal Justice Commons Let us know how access to this document benefits you. Recommended Citation Recommended Citation Hollins, Robert Norvell III, "Discrimination and Nepotism Within Police Specialty Units" (2002). Dissertations and Theses. Paper 3094. https://doi.org/10.15760/etd.3096 This Thesis is brought to you for free and open access. It has been accepted for inclusion in Dissertations and Theses by an authorized administrator of PDXScholar. Please contact us if we can make this document more accessible: [email protected].
Transcript of Discrimination and Nepotism Within Police Specialty Units

Portland State University Portland State University
PDXScholar PDXScholar
Dissertations and Theses Dissertations and Theses
2002
Discrimination and Nepotism Within Police Specialty Discrimination and Nepotism Within Police Specialty
Units Units
Robert Norvell Hollins III Portland State
Follow this and additional works at: https://pdxscholar.library.pdx.edu/open_access_etds
Part of the Criminology and Criminal Justice Commons
Let us know how access to this document benefits you.
Recommended Citation Recommended Citation Hollins, Robert Norvell III, "Discrimination and Nepotism Within Police Specialty Units" (2002). Dissertations and Theses. Paper 3094. https://doi.org/10.15760/etd.3096
This Thesis is brought to you for free and open access. It has been accepted for inclusion in Dissertations and Theses by an authorized administrator of PDXScholar. Please contact us if we can make this document more accessible: [email protected].

TIIESIS APPROVAL
The abstract and thesis of Robert Norvell Hollins III for the Master of
Science in Administration of Justice were presented May 8, 2002, and accepted by
the thesis committee and the department .
COMMITTEE APPROVALS:Gary R. Perlstein, Chair
Brian C. Renauer
Grant M. FarrRepresentative of the Office of Graduate Studies
PROGRAM APPROVAL:SI 0Ronald L. Tammen, Director
Mark O. Hatfield School Of Goverment

ABSTRACT
An abstract of the thesis of Robert Norvell Hollins III for the Master of Science in
Administration of Justice presented May 8, 2002.
Title: Discrimination and Nepotism within Police Specialty Units.
A career as a police officer has served as a legitimate avenue for many Black
Americans to elevate themselves from numerous low paying less prestigious jobs,
to a more respectable better paying secured occupation that has a higher social
economic status. The general perception related to the civil service position of a
police officer, suggests that it is an occupation which should offer an environment
free from discrimination and nepotism, thereby allowing fair treatment and equal
access for advancement to all individuals employed within the police organization.
The concept of a police organization that offers fair treatment and equal access
for advancement to all of its employees in a climate that is free from discrimination
and nepotism is the subject of considerable skepticism among many black police
officers.
Police departments throughout the United States of America have been
challenged by a highly visible accusation of discrimination and nepotism in regards.,.....to the selection process and the police personnel selected to become members of
elite police specialty units.

This thesis traces the historical involvement of black police officers in The
United States and their progression to obtain equality and fair treatment as police
officers within the law enforcement community.
This thesis examines the racial demographics of eighteen (18) police
departments located in various sections of the United States and the racial
demographics of the elite police specialty units which are incorporated within each
police department.
In addition, this thesis will analyze collected data from the police departments
that participated in the study and determine if the minority representation within
each of the police department's elite police specialty units is equal to the general
population which the police departments serve and proportionate to the minority
representation within the police department.
Finally, this thesis will examine data identifying Black American's
representation in significant areas of the criminal justice system, thus analyzing the
correlation between Black American's over-representation in the criminal
components of the criminal justice system and their under-representation within
police departments and elite police specialty units.

DISCRIMINATION AND NEPOTISM
WITHIN POLICE SPECIALTY UNITS
by
ROBERT NORVELL HOLLINS III
A thesis submitted in partial fulfillment of therequirements for the degree of
MASTER OF SCIENCE10
ADMINISTRATION OF JUSTICE
Portland State University2002

TABLE OF CONTENTS
List of Tables
List of Figures
CHAPTER 1: Introduction
Background
Problem Statement
Research Questions
Definition of terms and concepts
Literature Review
Research Design
CHAPTER 2: Law and Order
Law Enforcement Struggle For Black Police Officers
CHAPTER 3: The Task of Becoming A Member of An Elite
Police Specialty Unit
Good Ole Boy Network
Police Departments That Participated
In The Study.
Black Police Officer's Representation
White Police Officer's Representation
Hispanic Police's Representation
CHAPTER 4: Racial Representation In Police
Departments
III
IV
1
1
6
11
13
14
17
19
20
23
24
26
27
28
29
50

CHAPTER 5: The Chief of Police Factor 58
White Chiefs of Police 58
Black Chiefs of Police 59
Hispanic Chiefs of Police 61
CHAPTER 6: Discrimination Lawsuits 64
Black Police Personalities. 69
T-Test Results and Conclusions 73
Summery and Conclusion 77
Bibliography 79
11

LIST OF TABLES.
TABLE 1: Index of Black Representation in Police Departments. 32
TABLE2: Index of Black Representation in Police SpecialtyUnits. 33
TABLE 3: Index of Black Representation in Police SpecialtyUnits 34
Calcultated With The LocalPopulation.
TABLE 4: Index of White representation in Police Departments. 37
TABLE 5: Index of WhiteRepresentation in Police SpecialtyUnits. 40
TABLE6: Index of WhiteRepresentation in Police SpecialtyUnits 42
CalculatedWith The Local Population.
TABLE7: Index of Hispanic Representation in Police Departments. 44
TABLE8: Index of Hispanic Representation in Police SpecialtyUnits. 46
TABLE9: Index of Hispanic Representation in Police SpecialtyUnits 48
CalculatedWith The Local Population.
TABLE 10:Police Officers/Police Chiefs by Race For Police Departments. 62
TABLE 11:Police Officers/Police Chiefs by Race For SpecialtyUnits. 62
TABLE 12:Blacks Sample Statistics. 73
TABLE 13:Whites Sample Statisics. 74
TABLE 14:Hispanics Sample Statisics. 74
TABLE 15: Independent SamplesTest. 75
TABLE 16:Coefficients Test. 75
TABLE 17:Coefficients Test. 75iii

LIST OF FIGURES
FIGURE I: Map of The United States Illustrating The Cities/PoIice 31
Departments That Participated In This Study.
FIGURE 2: Index of Black Representation in Police Departments. 35
FIGURE 3: Index of Black Representation in SpecialtyUnits/Departments. 36
FIGURE 4: Index of Black Representation in SpecialtyUnits/Population. 37
FIGURE 5: Index of White Representation in Police Departments. 39
FIGURE 6: Index of White Representation in SpecialtyUnits/Departments. 41
FIGURE 7: Index of WhiteRepresentation in SpecialtyUnits/Population. 43
FIGURE 8: Index of Hispanic Representation in Police Departments. 45
FIGURE 9: Index of Hispanic Representation in Police Specialty 47
Units/Departments.
FIGURE 10:Index of HispanicRepresentation in Police Specialty. 49
Units/Population.
FIGURE 11:Police Department's Disproportionate/Population 52
Representation Chart.
FIGURE 12:Police SpecialtyUnit's Disproportionate/Population 53
Representation chart.
FIGURE 13:Police SpecialtyUnit's Disproportionate/Department 54
Representation chart.
IV

FIGURE 14: Police Index of Race Representation: Department/Population. 55
FIGURE 15: Police Index of Race Representation, Specialty UnitJDepartment. 56
FIGURE 16: Police Index of Race Representation, Specialty Unit/Population. 57
v

CHAPTER I
Introduction
BACKGROUND
For decades, the majority of black police officers have been at the bottom level
of the law enforcement hierarchy. In the United States of America, there are
approximately 600,000 police officers of which approximately 50,000 (8.3%) are
black police officers. (Emerge.l995.p.29)
For many years, positions within the police community have been primarily
dominated by white males who have chosen law enforcement as a career. Within
the past 20 years, the faces of law enforcement have changed as a result of the
increased numbers of minorities and women entering law enforcement.
For one to understand the plight of the black police officer's struggle to obtain
equality within the police community, one must examine the history oflaw
enforcement in America, as it relates to Black Americans. In the minds of many, it
is the common belief that Black Americans have always been policed in one way or
another. Be it by some form of official law enforcement, or by an unofficial militia
assigned the task of regulating and monitoring their actions. The policing of Black
Americans began in the seventeenth century, when Africans were forcefully
removed from their home land in Africa, during the Atlantic Slave Trade, and
brought to the United States of America and exploited as slaves.
At the time of the first census in the United States in 1790, there were 757,181
I

Africans in the country, constituting 19.3 percent of the total population. All but
59,577 were slaves. Africans enslaved in America were a troublesome presence.
Belying their captor's claim that they were made for slavery, Africans rebelled
against the institution in a variety of ways. They resisted on a daily basis by
refusing to work, destroying crops and farm implements, and killing livestock.
They poisoned their owners, destroyed property through arson, and fought with
their owners and other whites. Some ran away from slavery; others cooperated
with Native Americans or white indentured servants to resist through physical
force. This resort to violence created the greatest problem for the whites in the
colonial period of American history. They lived in constant fear of slave
rebellions, and as a result passed many laws to deter, control, and suppress such
insurrections. ( Black Police In America 1996. pp. 1-2).
Along with these new laws came the slave patrols. The slave patrols were the
first distinctively American policing system, and it set the pattern of policing that
Americans of African descent would experience throughout their history. The slave
patrollers consisted of all white males who were authorized to stop, search, Whip,
maim, and even kill any African slave caught off the plantation without a pass,
engaged in illegal activities, or rnnning away. The colonial slave patrols exercised
awesome powers which were oftentimes abused. (Black Police In America 1996.pp. 1-2)
During the first three centuries of their presence in North America, few Black
Americans had the opportunity to serve in the police or constabulary forces2

organized in North America. Few Black Americans had the opportunity to serve in
the police or constabulary forces organized by Americans to preserve the peace and
maintain order. Moreover, during the colonial and antebellwn periods of American
history, when most Black Americans were slaves and were considered to be a threat
to the public order, some of the earliest police systems were organized to patrol
their activity and regulate their behavior. According to several scholars, Black
Americans have been patrolled and policed throughout their history in the
Americas and have had to endure both legal and extralegal police methods as a
consequence. Given this legacy, it was rare for Black Americans "the policed" to
become members of the patrols and forces organized to suppress them. (Black
Police In America. 1996. p. XIII)
In recent years, everywhere that Black Americans serve as chiefs, ranking
officers, or ordinary patrolmen, that service has been hard fought and hard won.
Indeed, the experience of Black Americans in law enforcement parallels the history
of black participation in almost every other form in governmental service in North
America. Black Americans were grudgingly accepted as police officers. Even after
they where hired, they were still denied equal authority with white police officers,
discriminated against in promotion and assignment, segregated, expelled, banned,
and even prevented from wearing their uniforms. In some cities they were denied
the right to carry arms and arrest White Americans. (Black Police In America
1996.p. 1.)3

Entry into law enforcement has long been a means by which impoverished
immigrant groups have attained economic and political power. But, in their efforts
to pursue this same avenue of socioeconomic advancement, Black Americans have
had to overcome obstacles that no immigrant group has encountered. Black
Americans had to acquire political power first before they could achieve
meaningful participation in law enforcement.(B1ack Police In America. 1996. p. 1.)
It was in a racist and hostile atmosphere in the nineteenth century, that first
Black Americans became law enforcement officers. They served in a racist, slave
society and implicitly accepted the oppression of Black Americans in order to carry
out their duties By accepting the racial status quo and the legal oppression of other
Black Americans, these law enforcement officers became the first black police
officers to confront the paradox of policing a society where the color of a person's
skin often determined guilt or innocence. They also became the first to accept such
roles because they believed that they could improve their own precarious position .
in a society where status was based on skin color. (Black Police In America.
1996.p.7)
It was during the 1960s when the employment of Black Americans as police
officers was of great interest, because of the Kernel Commission's recommendation
that American law enforcement agencies increase their number black police
officers to counter the charge that predominantly white police forces constituted
occupying armies established to police and oppress (not protect) Black American
4

communities. The resulting recruitment and the promotion of black law
enforcement officers in the late 1960s and the late 1970s forced police agencies to
attempt to reform long-standing policies that denied Black Americans full access to
police jobs, and virtually regulated them to second-class status police officers.
Needless to say, the attempt to reform the historically racial policies in American
police departments only engendered more problems, especially when reform meant
challenging the hegemony of white police officers for positions and promotions in
policing. (Black Police In America. 1996. p. xvii)
It is also due to the civil rights movement of the 1960s, affirmative action, law
suits, education, more awareness, and a changing society, that many of the external
barriers that at one time excluded Black Americans from entering law enforcement
have been knocked down. While the external barriers are continuously falling, it is
the internal barriers that are on the up rise and are becoming increasingly more
difficult for black police officers to overcome and move from the rank and file
position of patrol officer to the elite specialty units and higher ranking supervisory
management positions within police departments.
It is the internal barriers that black police officers must overcome in order to
become members of the elite police specialty units within police departments.
These elite police specialty units are as follows: special weapons and tactics
(S.W.A.T), bomb squad, narcotics, vice, k-9 unit, motorcycle unit, horse patrol,
river boat unit, search and rescue, diving division, air support, gang unit, auto theft
unit, street crimes unit, and liquor control to name a few.5

The aforementioned police specialty units, for the most part, are lateral
positions within police departments which are arbitrarily staffed with carefully
selected police officers from the rank and file position of patrol officer. The
selection process normally consists of a background check, an internal interview by
the applying officer's supervisors and peers who are currently assigned to the
specific police specialty unit that the applicant police officer is applying for. There
is also a regiment of specific assessment tasks that are related to the position being
applied for, that the applicant police officer must demonstrate. Lastly, for some
positions the applicant police officer may be required to take a written examination,
which in nearly all cases is reviewed and scored internally by a supervisor within
the police specialty unit. Rarely does an outsider or a person not associated with
the police specialty unit participate in the selection process of new members into
the specialty unit.
PROBLEM STATEMENT:
The problem that this thesis addresses is the under-representation of black police
officers within police department's elite police specialty units. When compared to
the general United States population, it appears that Black Americans are over-
represented in criminal components of the criminal justice system. The 1990
United States Census reported that blacks represent 12.1% of the United States
population.6

(Bureau ofthe Census 1991). There are approximately 600,000 active police
officers employed in nearly 20,000 separate police organizations in The United
States, of which approximately 20,000 (8.3%) are black police officers (Emerge
1995 p. 29).
Of all the arrests made in 1997, (ages 18 and older), 30.4% of the offenders were
black (Sourcebook 1998). In 1997 black offenders were responsible for
committing 41.1 % of the violent crimes in The United States (Sourcebook 1998).
The data collected estimates that in 1996, 9% of the adult black male population in
The United States was under correctional supervision. (Sourcebook 1998). Finally,
the data indicates that blacks represent 42.2% of the prisoners under the sentence of
death in The United States. (Sourcebook 1998).
The majority of police officers in the United States are white, representing an
overwhelming 87%. (Emerge 1995.p 29). The United States Census reported that
83% of the United States population was white (Bureau of Census 1991). The
over-representation is nothing new or unheard of, to the contrary, White dominance
in law enforcement has been a way oflife in the modem police force ever since its
creation in the early 19th century. This phenomenon causes one to wonder why it
exists and why it is so prevalent throughout the United States and within the
various police agencies. It is the intent of this thesis to examine data and evaluate
if discrimination and nepotism are relevant factors in the under-representation of
black police officers in police specialty units and police departments that
7

participated in this study.
White racial dominance of blacks in America from the establishment of black
slavery in the seventeenth century, to the establishment and consolidation of black
ghettos in the late nineteenth and throughout the twentieth centuries depended upon
systems of white policing. Without such systems, whites would have had a
difficult time developing and maintaining their ideology of racial superiority.
(Cashmore 1991: 66).
As history suggests, slavery necessitated the first system of white policing of
the black populations. As the Anglo-Saxon Americans formed their various slave
institutions in the early development of the United States, they had to design
various safe-guards to protect the white majority from black rebellions. This was
done by creating slave codes and black codes that regulated the behavior of black
slaves in the dominant white society. Furthermore, in order for these codes to be
effective, they had to be strictly and severely enforced by the ruling class. In 1686
a colonial act that was instituted gave any member of the white ruling class the
right to apprehend, chastise, and order home any slave that was off his master's
plantation without a pass. It was every member of the white majority's duty to take
an active participatory role in the policing of the black slave. Furthermore, if they
failed to uphold their duties, they were fined and punished. One must realize that
this policing strategy had a devastating effect on race relations in the South. Even
with the abolishment of slavery in 1862 effective January I, 1863, the
fear of black rebellion remained prevalent and the desire to police the black8

population never completely died. The ruling class that being Anglo-Saxon
Americans, wanted to still obtain the ability to have white dominance and white
superiority over all segments of the black population.
The white policing rule had a spill over effect on the generations to follow in
law enforcement. The racist, discriminatory beliefs and views of colonial America
were transcended and taught throughout history. Although somewhat diluted, there
is evidence that these destructive beliefs still remain in present day times. For
example, in 1997, blacks were the victims of 64.9% of the bias motivated hate
crimes that were reported in The United States. Furthermore, in 1997, anti-black
hate crimes represented 66.2% of the race related hate crimes that were in The
United States. (Sourcebook 1998).
Racism and discrimination in law enforcement agencies were wide spread and
rampant throughout the early to middle decades of the twentieth century. Black
Americans were virtually nonexistent in law enforcement agencies. In cities where
the Black American population was the majority, the percentage of black police
officers was inconsistent with and disproportionate to the number of blacks in the
general population.
For example, an unnamed police agency relatively small in size, and having
state wide authority located in the Southeastern section of the United States, was
known for the exclusion of Black-Americans and brutality toward Black-Americans
based on the disproportionate number of arrests and use of force. It was also
determined that this police agency had not hired a Black-American since its9

inception as a law enforcement institution, or hired a female police officer in 42
years.
To institute an element of balance for the under-representation of black police
officers in police departments, and the unfair treatment of blacks and members of
other minority groups, hiring practices, policies, and affirmative action quotas were
forcefully incorporated by the political powers and court system in order to force
police departments to hire Black Americans and other minorities. As one could
imagine, the police officers who joined the ranks during this type of social change
were not wholeheartedly welcomed. Because of the reluctance of the police
agencies willingness to accept the quota system, and claim that it was unfair to
white police officers, the quota system was eventually dissolved by a United States
Supreme Court ruling, and replaced with various forms of affirmative action
programs and functions.
One must realize that police officers are just as human as the next person, and
have the same likes, dislikes and problems as any other person. Therefore, it's not a
stretch ofthe imagination to believe that they too share some of the same racist,
discriminatory ideologies as some members do in the general public, which stem
from the slave trade era of colonial America. That is to maintain superiority and
rule over the Black-American population, the innate, historical concept instilled by
racist white forefathers.
As a result of a rapidly changing society, combined with raising crime rates, the
10

increase of professional and specialized criminals, and the need to reassure the
public's confidence and trust in police department's fight against crime, aggressive
proactive law enforcement specialization has become the hallmark of progressive
police departments. Police departments are limiting the responsibilities and
reducing work load of the traditional "patrol officer", who is more involved and
working closer with the community, to a non-traditional system of policing, in
which highly trained police officers are carefully selected and assigned to elite
police specialty units specifically designed to address certain crimes and areas of
law enforcement.
Although this may be welcomed news for many white police officers, it is
somewhat disheartening and viewed by many black police officers as method to
restrict their advancement within the organization, yet another internal barrier to
overcome, and a subversive tactic to limit and or exclude black police officer's
participation and involvement as members of elite police specialty units.
RESEARCH QUESTIONS:
The overwhelming perception that discrimination and nepotism exists in
modem police departments, and are considered as internal barriers that black police
officers must overcome in order to become members of elite police specialty units,
weakens morale and causes a destructive friction to develop between police officers
11

of different races. This thesis attempts to clarify the accuracy of this perception
utilizing the racial demographics of eighteen police departments and their elite
police specialty units combined with and the racial demographics of the cities
where the police departments are located. The data collected and used in this thesis
is guided by a specific set of research questions:
I. Does discrimination and nepotism exist in modem day police departments and
act as internal barriers limiting black police officer's advancement into elite police
speci alty units.
2. Does the racial demographics of the population where the police departments
are located, affect the racial demographics of the police officers assigned to elite
police specialty units.
3. Does the racial demographics of police department's personnel affect the racial
demographics of the police officers assigned to elite police specialty units.
4. Is there an interaction between the race of the Chief of Police and the race of the
police officers assigned to elite police specialty units.
5. Does the historical ideologies of policing and colonial American beliefs affect
black police officers ability to become members of elite police specialty units.
6. How do black police officers overcome the internal barriers of discrimination
and nepotism, and establish representation within elite police specialty units that is
proportionate with the percentage of blacks in the general population and the
particular police department in which the police specialty unit is based.
12

DEFINITION OF TERMS AND CONCEPTS:
POLICE DEPARTMENT: A force organized by city, state, or government to
maintain order, prevent and detect crime, and enforce laws and protect life ..
POLICE SPECIALTY UNIT: A group of highly trained carefully selected elite
police officers assigned to a particular subdivision of a police department and given
the task and responsibility of specializing in a specific area of law enforcement.
INTERNAL BARRIER: A Bureaucratized non-structural obstacle within the
police organization which is utilized by individuals in positions of power and
having decision making authority to limit the advancement and exclude police
officers from becoming members of elite police specialty units.
BLACK POLICE OFFICER: A person of African-American descent that is a
member of a police force.
NEPOTISM: Favoritism shown in business or employment on the basis of family
or friend relationship.
DISCRIMINATION: To make a distinction in favor of or against a person
based on prejudice.
PREJUDICE: An unfavorable opinion or decision formed beforehand or without
knowledge based on hatred or dislike directed against a racial, religious, or national
group.
RACE: The race ofthe population or police officer is categorized as follows:
white, black, and HispaniclLatino.
13

RACIAL DEMOGRAPIllC: The statistics of race related to the population and/or
an organization of people.
OVER-REPRESENTATION: A specific number or percentage of people
identified as belonging to a particular race represented within a sub-section, that is
disproportionate to and exceeds the percentage of people of the same race within
the main section or body of people being compared to.
LITERATIJRE REVIEW:
There have been several studies performed, and considerable research
conducted in the area of blacks in law enforcement. Much of the research has
concluded that the occupation of a police officer hasbeen primarily been dominated
by white males. The research and data indicate that black police officers are over-
coming many of the barriers that, for so many decades, have kept them excluded
from law enforcement as a career choice, and viewed as second-class citizens. The
most recent research implies that unequal treatment and discrimination still exist
within the law enforcement community across the nation.
For the most part, the data and research suggest that opportunities within law
enforcement are continually becoming available for black police officers. In the
areas of recruitment and new hires for blacks, and other minority groups, the data
indicates that the numbers are increasing. As indicated by the U.S. Department of
Justice: Bureau of Justice Statistics 2002, "from 1987-1997, within local police
14

departments, minority representation has increased from 14.5% to 21.5%. I would
concur with the prior statement. However, such is not the case when it comes to
black police officers and their representation within elite police specialty units.
Elite police specialty units are relatively new to the law enforcement crime
fighting arsenal. There has been very little published research or documentation
specifically addressing elite police specialty units or the personnel assigned to
them. Despite the lack of available data, Icompiled articles, texts, and statistical
data to assist with this study, and provide insight into elite police specialty units.
The text "Black in Blue" by Nicholas Alex, addresses the frustrations, lack of
achievements, and the feeling of inequality felt by 41 black police officers of the
New York City Police Department during the 1960's. The general consensus from
the black police officer's point of view, is that they are a small minority and
encounter discrimination on a daily basis within the police department. The author
suggests that the black police officers are engaged in a constant struggle to prove
themselves. Many of the black police officers expressed concern that they were
treated as less than equal by their peers and supervisors, and were often passed over
for promotions and police specialty assignments.
Although this study took place in the 1960's, more recent data indicates that
there is a sufficient amount of evidence to support the claim by both black and
white police officers that discrimination existed and continues to exist in the 1990's
and 2000's. Furthermore, recent data suggest that black police officers continue to
have a minority representation within law enforcement, and encounter race related15

frustrations associated with being a police officer.
The text "Black Police In America" by W. Marvin Dulaney, traces the historical
journey of the black police officer's role and involvement in law enforcement from
virtually total exclusion to holding top managerial positions in some of the nation's
largest metropolitan police departments.
The research conducted by Mr. Dulaney concurs with prior research, which
indicates that blacks have come a long way since the antebellum era of American
history. However, the research suggests that black police officers continue to find
themselves as victims subjected to discrimination within law enforcement, and
perpetrators of reverse discrimination, as they achieve success and advance to the
higher level positions within the law enforcement community.
The article by Ben Johnson (1993), discusses the public's perception of blacks
as criminals and less patriotic than non-blacks, as the result of media journalist's
portrayal of blacks when reporting violent crimes. He contends that the public is
constantly bombarded with mis-information regarding dangerous black criminals
which clouds and alters their perception as it pertains to the entire black population.
In Nick Charle's and Chrisena Colman's article "Badge Of Racism" (1995) ,
they examine why so many black undercover police officers are accidentally shot,
killed, and physically assaulted by white police officers who work in the same
police department. Moreover, they contend that during their research, no white
undercover police officer had been shot or killed by a black police officer. In the
article, the writers concur with the research and conclusion made by Ben Johnson.16

The writers indicate that their research suggests that black males are perceived
as criminals, and it is because of this perception that white police officers
mistakenly shoot undercover black police officers in the line of duty. The title
"Badge of Racism," implies that one race is superior and uses the badge to inflict
hatred upon an inferior race. All of the research concluded that in modem day
times, discrimination within the law enforcement community exists and appears to
be spreading.
RESEARCH DESIGN.
For the purpose of this study, data collection began by establishing a
database from data that was obtained through a questionnaire mailed to the office
of the chief of police and the office of the municipal director of personnel for police
departments in 50 of the largest cities in the United States. The response was as
follows: 18 or (36%) of the police departments returned completed questionnaires,
11or (22%) of the police departments returned incomplete questionnaires, and 21 or
(42%) of the police departments did not reply.
The indexes of white, black, and Hispanic police officer's representation
within the elite police specialty units of the police departments that returned
completed questionnaires were calculated and compared to the percentage of
whites, blacks, and Hispanics in the local population utilizing data from the 1990
17

United States Census.
The race of the chiefs of police and important demographic data provided by the
United States Census Bureau was analyzed to determine ifthere was a correlation
with the percentage of white, black, and Hispanic police officers assigned to elite
police specialty units within the responding police departments.
Secondary data such as newspaper articles, police statistical journals, crime
index reports, police department public information data, and statistical data from
components of the criminal justice system were analyzed for the purpose of
developing a hypothesis to explain black police officer's under-representation
within elite police specialty units.
A historical analysis of the black police officer's inception into law
enforcement was employed in order to obtain a historical perspective and
evaluate the black police officer's role and advancement in law enforcement.
Finally, civil law suits by police officers alleging discrimination in the work
place provided important informational data to support this thesis.
18

CHAPTER 2
LAW AND ORDER.
Law and order implies the protection of life and property, but it bears overtones
of racism on the part of a large number of White Americans who feel that, no
matter how recently they acquired it, they have a stake in American society by
virtue of years of prosperity, by of owning a home, an automobile, and having a
relatively well-paying job that is protected by seniority and tenure. The advocates
and supporters oflawand order include many White Americans at all occupational
and income levels, who see the mobility and new political aggressiveness of Black
Americans as a threat to their racial dominance over their society. For the issue of
law and order involves deep and historic conflicts in the meaning, emotions, and
institutions that are at the very root of American society. (Black in Blue. 1969. pp.
xi-xii]
In keeping the above philosophy in mind, one can identify the historical origin of
the black police officer's dilemma and attempt to over-come the internal
discriminatory bureaucratic barriers that they are confronted with, as they attempt
to become members of elite police specialty units.
19

LAW ENFORCEMENT: STRUGGLE FOR BLACK POLICE OFFICERS
Law enforcement is a relatively low-prestige occupation. It attracts personnel to
whom the income, security, and prestige is, however, greater than they might
otherwise achieve. Law enforcement has historically attracted white immigrants
and their children, who used law enforcement as the first step in the process of
achieving mobility in American society. As salaries have risen, and as these groups
have moved into the upper levels of the law enforcement hierarchy, white police
officers have begun to achieve a stake in American society. As immigrants, and
now as the children of immigrants, white police officers view new groups coming
to the fore in urban society as less" American" than themselves, as having little
respect for the proprieties of middle-class life, for the law as they define it, and
for the police officers themselves as White Americans and guardians ofthe law.
(Black In Blue. 1969. pp.xvii-xviii).
The very conditions of discrimination, segregation and the lack of opportunity
make law enforcement attractive to Black Americans. It is the lack of alternative
opportunities combined with the possibility of gaining employment at a relatively
secure and well-paying civil service job, that makes law enforcement an attractive
career choice. (Black In Blue. 1969. p. xviii) .
Surrounding the occupational core of the black police officer's roles are a set of
cross pressures, role contradictions, and marginalities that threaten their original
justification for entering the force. The black police officer sees the police force as20

dominated by White Americans and officialdom who places every possible
obstacle in the path of their advancement. The black police officer is assigned the
worst beats, and given little chance to enter specialized services. The black police
officer is most frequently assigned to ghetto communities where he or she is used
to maintain law and order. All too often, the black police officer is thought to be an
" uncle Tom" or" Mr. Charlie's boy," or perceived as an agent of the white
community, used to oppress and repress his friends and neighbors. (Black In Blue.
1969. p. xix) .
The black police officer, therefore, can never escape his racial identity while
serving in his official role. In the black community, the black police officer can
never be a simple human being, he is always thought of as a police officer.
The black police officer attempts to escape his uniform as soon as possible after
his tour of duty. He avoids the friends of his youth in order to avoid learning of
criminal behavior. His friends avoid him for similar reasons or because they think
of him as a traitor. He does not socialize with the white police officers in his after-
duty hours, partly because he not the same race, and mostly because he is not
fully accepted and trusted by his white police officer peers outside the job. In
short, he is drawn into an enclave of black police officers, he becomes a member of
a minority group within a minority group. Thus, he is doubly marginal. The black
police officer does not receive the same recognition from other middle-class blacks
because he has made it into the middle-class world. He has been placed in the
21

position of having to work with and within the agencies of the white community. (
Black In Blue. 1969. p. xx ).
The Black person who enters into the police role is subject to all of the tensions
and conflicts that arise from police work. Moreover, the conflicts are compounded
for the black police officer. He is more than a black person to his ethnic group
because he represents the guardian of white society, yet he is not quite a police
officer to his working companions because he is a member of an inferior racial
category. (Black In Blue 1969. p. 14 ).
22

CHAPTER 3
THE TASK OF BECOMING A MEMBER OF AN ELITE POLICE
SPECIALTY UNIT
The organizational structure of police departments does in fact allow
discrimination to take place in the area of assigning police officers to police
specialty units. There is a great deal of discretion that is built into the police
structure which affords individuals in power the opportunity to allow internal
barriers such as nepotism and discrimination to enter into the equation during the
selection process, by which police officers are arbitrarily selected to become
members of elite police specialty units.
The procedure for becoming a member of an elite police specialty unit can range
from being a fair organized structured competitive selection process that affords all
applicants an equal opportunity to become a member of a police specialty unit, to a
process that is discriminatory, unfair, abundant with nepotism and favoritism with
predetermined selections. It is the latter which allows individuals in power the
opportunity to misuse and abuse their authority.
As the doors open to more Black Americans who select law enforcement as a
career choice, the doors and opportunities that lead to positions within elite police
specialty units are closing on them. Consequently, the number of black police
officers represented in elite police specialty units is considerably lower than their
representation in the community which they serve and the rank and file entry level
23

patrol officer positions. Moreover, 50 % of the police departments mentioned in
this study had a higher representation of black police officers employed within the
police agency, when compared to the percentage of black police officer's
representation within police specialty units.
GOOD OLE BOY NETWORK
The "good ole boy network" is a phrase within the law enforcement community
which refers to a group of police officers who share a close bond with each other.
Based on the research, the "good ole boy network" can also be an internal police
barrier that black police officers encounter when they attempt to become members
of elite police specialty units. In this system, individuals belong to an internal
network, and are bonded together by occupational relationships, friendships,
family ties, social interactions, and various hobbies. Many police officers who are
part of the " good ole boy " network are in managerial positions, and have the
authority to arbitrarily select and assign police officers to elite police specialty
units. Thereby providing rank and file police officers who are also part of the"
good ole boy "network, the inside tract in the selection process and an unfair
advantage in becoming members of elite police specialty units.
The " good ole boy " network is dominated by white male police officers. Black
police officers rarely are part of the network, due in part to the lack of social
interaction between black and white police officers.
Another method of advancement and upward mobility into elite police specialty
24

units is the" kinship tradition." Within this system, there exists a long history and
tradition oflaw enforcement personnel in various families, which information
obtained through years of experience and knowledge related to law enforcement
and police work, is passed on to family members interested in pursuing a career in
law enforcement and advancing into elite police specialty units.
Based on the data and research compiled during this study, (the good ole boy
network) appeared to display and produce an environment conducive to an
atmosphere which individuals within the network practiced and tolerated
discrimination, favoritism, and nepotism on a routine basis. Moreover, the data
suggests that it is the "good ole boy network" within the law enforcement
community, which black police officers encounter a fair amount of hostility and
resistance when trying to penetrate areas within the law enforcement arena where
black representation is minimal and or non-existent.
The data suggests that in modem day times, the "good ole boy network"
continues to manifest itself as a major barrier that black police officers must
overcome in order to be successful and obtain advancement within law
enforcement community. Furthermore, the data tends to suggest, as more minority
police officers select law enforcement as a career, particularly within police
departments and cities that have a relatively low representation of minorities, the
the increased numbers of minority police officers will have a diluting effect on the
membership and influence of the "good ole boy network".
25

POLICE DEPARTMENTS THAT PARTICIPATED IN THE STUDY:
1. CHICAGO, IL
2. HOUSTON, TX
3. DETROIT, MI
4. DALLAS, TX
5. SAN ANTONIO, TX
6. EL PASO, TX
7. NEW ORLEANS, LA
8. DENVER, CO
9. FORT WORTH, TX
10. KANSAS CITY, MO
11. SAN DIEGO, CA
12. COLUMBUS, OH
13. CINCINNATI, OH
14. MIAMI, FL
15. NASHVILLE, TN
16. VIRGINIA, VA
17. ST. LOUIS, MO
18. LONG BEACH, CA
26
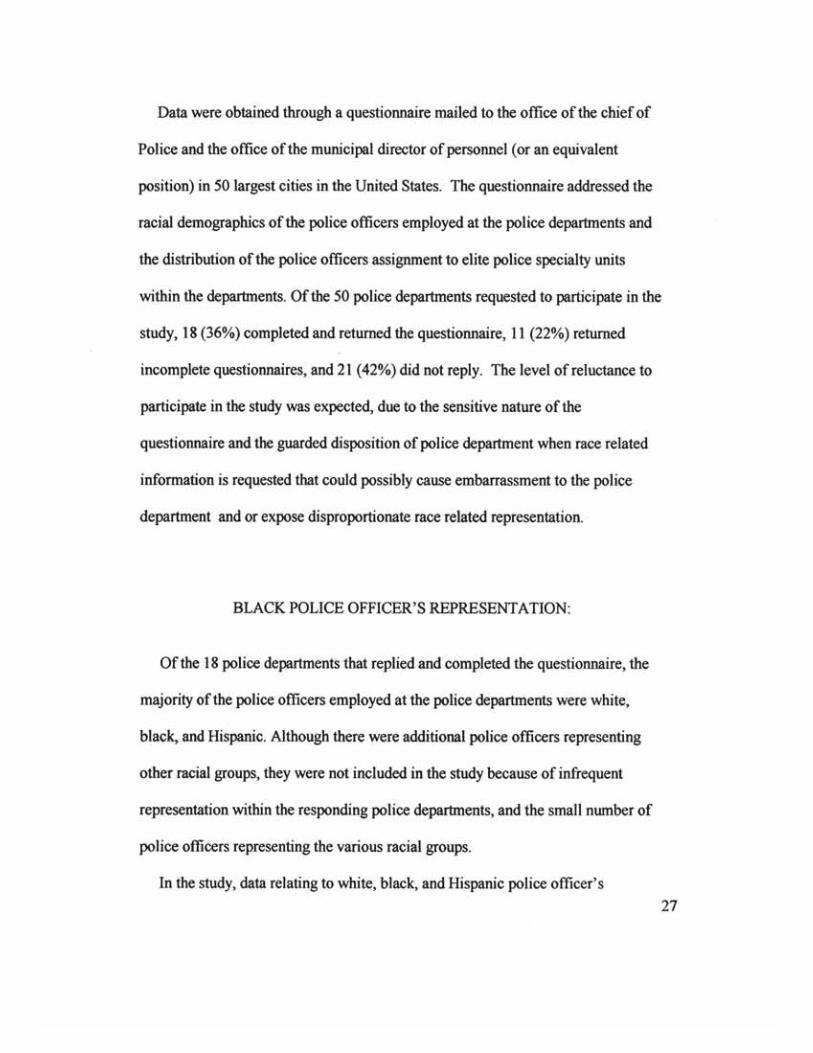
Data were obtained through a questionnaire mailed to the office of the chief of
Police and the office of the municipal director of personnel (or an equivalent
position) in 50 largest cities in the United States. The questionnaire addressed the
racial demographics of the police officers employed at the police departments and
the distribution of the police officers assignment to elite police specialty units
within the departments. Of the 50 police departments requested to participate in the
study, 18 (36%) completed and returned the questionnaire, 11 (22%) returned
incomplete questionnaires, and 21 (42%) did not reply. The level of reluctance to
participate in the study was expected, due to the sensitive nature of the
questionnaire and the guarded disposition of police department when race related
information is requested that could possibly cause embarrassment to the police
department and or expose disproportionate race related representation.
BLACK POLICE OFFICER'S REPRESENTATION:
Of the 18 police departments that replied and completed the questionnaire, the
majority of the police officers employed at the police departments were white,
black, and Hispanic. Although there were additional police officers representing
other racial groups, they were not included in the study because of infrequent
representation within the responding police departments, and the small number of
police officers representing the various racial groups.
In the study, data relating to white, black, and Hispanic police officer's27

representation within the police departments and elite police specialty units were
analyzed and compared for the purpose of determining if their representation was
proportionate or disproportionate. This data were also compared to the local
population of each city where the police departments were located in order to
determine if white, black, and Hispanic police officer's were proportionate or
disproportionate to the local population.
The data calculation of blacks in the local population and black police officer's
representation within the police departments involved in this study, displayed an
average index of (.72 ) and a standard deviation of (.17). Ofthe 18 police
departments which participated this study, 15 or ( 83.3% ) had an index less than
(1.00 ). See table land figure 2.
Black police officer's representation within elite police specialty units when
calculated with black police officers in the department, had an average index of
(1.11) with a standard deviation of (.49). Of the 18 police departments involved in
this study, 8 or (44.4%) had a black representation within elite police specialty
units of(1.00) or higher. See table 2 and figure 3.
When calculating the index of black police officer's representation within police
specialty units and blacks in the local population, the average index was (.78) with
a standard deviation of(.33). Of the 18 police departments used in this study, 15 or
(83.3%) had an index ofless than (1.00). See table 3 and I figure 4.
WHITE POLICE OFFICER'S REPRESENTATION:28

The data calculation of whites in the local population and white police officer's
representation within the 18 police departments utilized in this study displayed an
average index of(1.3I) with a standard deviation of(.18). Of the 18 police
departments used in this study, 1 or (5.5%) had an index less than (1.00). See table
4 and figure 5.
An analysis of the data indicated that white police officers had an average
representation index within police specialty units of (1.04) with a standard
deviation of(.15), when calculated with the percentage of white police officer's
representation within the police departments. Of the 18 police departments
involved in this study, 12 or (66.6%) had an index of (1.00) or higher. See table 5
and figure 6.
Based on the calculation of the data, the average index of white police officer's
representation within elite police specialty units and whites in the local population
is (1.36) with a standard deviation of(.22). Of the 18 police departments involved
in this study, 17 or (94.4%) had an index higher than (1.00). See table 6 and figure
7.mSPANlC POLICE OFFICER'S REPRESENTATION:
An analysis of the data indicated that Hispanic police officer's representation
within the police departments, when calculated with Hispanics in the local
population displayed an average index of (1.12) with a standard deviation of(.64).
Of the 18 police departments, 11 or (61.1%) had an index higher than (1.00). See
table 7 and figure 8.29
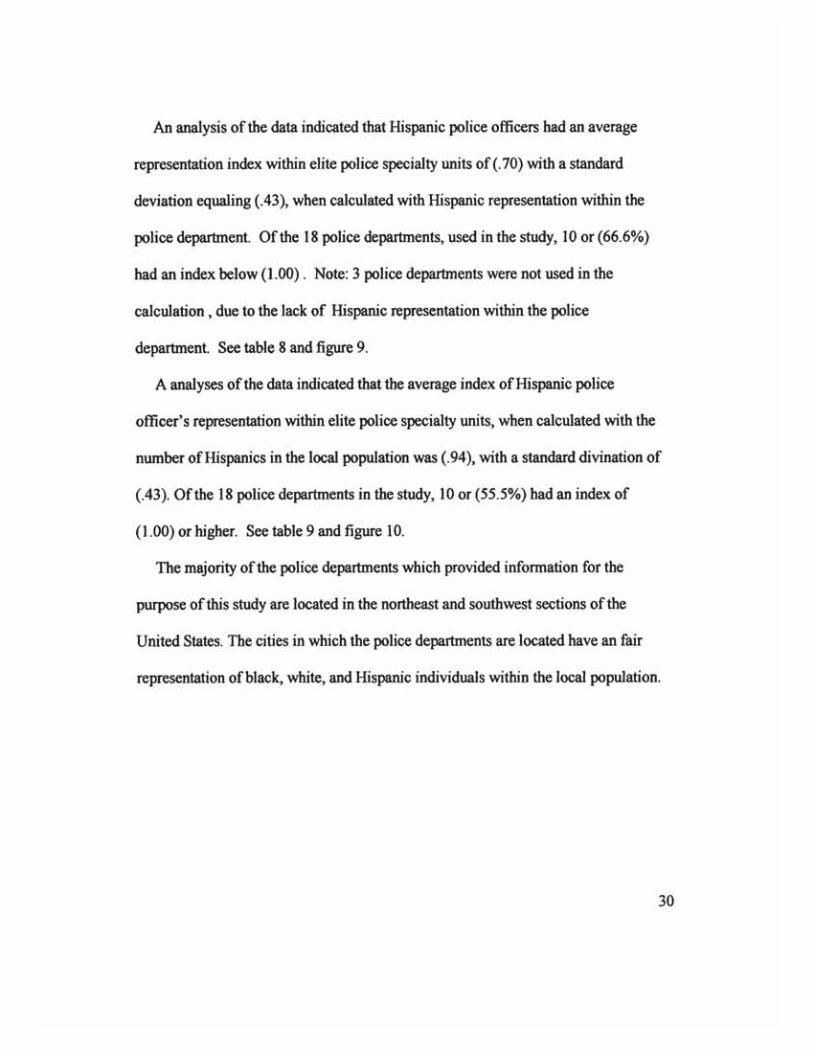
An analysis of the data indicated that Hispanic police officers had an average
representation index within elite police specialty units of (.70) with a standard
deviation equaling (.43), when calculated with Hispanic representation within the
police department. Of the 18 police departments, used in the study, 10 or (66.6%)
had an index below (1.00). Note: 3 police departments were not used in the
calculation, due to the lack of Hispanic representation within the police
department. See table 8 and figure 9.
A analyses of the data indicated that the average index of Hispanic police
officer's representation within elite police specialty units, when calculated with the
number of Hispanics in the local population was (.94), with a standard divination of
(.43). Of the 18 police departments in the study, 10 or (55.5%) had an index of
(1.00) or higher. See table 9 and figure 10.
The majority of the police departments which provided information for the
purpose of this study are located in the northeast and southwest sections of the
United States. The cities in which the police departments are located have an fair
representation of black, white, and Hispanic individuals within the local population.
30

•Denver
EI'PaSoFort WOrth •• Oollas
San AntOr\io
•-Miami
Figure 1:Map of U.S. Cities listing respondents to surveys and Police Departments
31

Total Total number Index of blacknumber of of black Percentage of Percentage of representatioofficers in officers in black officers blacks in the n within the
City department denartment in denartment nonulation denartmentChicago 13,796 3,554 25.8% 38.5% 067Houston 5,429 1,043 19.2% 27.4% 0.7Detroit 4,033 3,135 77.8% 75.3% 1.03Dallas 2,859 603 21.0% 28.8% 0.72SanAntonio 1,882 110 5.8% 6.7% 0.86El Paso 1,024 23 2.1% 3.1% 0.67NewOrleans 1,664 856 51.4% 61.3% 0.83Denver 1,449 145 9.9% 12.3% 0.8FortWorth 1,165 137 11.7% 21.6% 0.54KansasCity 1,258 152 12.0% 29.4% 0.4San Diego 2,065 180 8.7% 8.9% 0.97Columbus 1,779 251 14.1% 22.4% 0.62Cincinnati 1,058 296 27.9% 37.8% 0.73Miami 1,117 305 27.3% 24.6% 1.1Nashville 1,231 165 13.4% 24.1% 0.54VirginiaBeach 725 64 8.8% 13.6% 0.64St. Louis 1,576 506 33.3% 47.3% 0.7LongBeach 855 58 6.7% 13.2% 0.5
TABLE I: Index of black representation in Police Departments.
Note:Data were obtained through a questionnaire mailed to the office of the Chief of Police or the officeof the municipal Director of personnel (or equivalent) in the 50 largest cities in the United States.Eighteen (18) cities or 36% returned completed questionnaires. The index of black representation iscalculated by dividing the percent of black officers in a police department by the percent of blacks nthe local population. An index approaching 1.0 indicates that a police department and or city iscloser to achieving a representation of black police officers equal to their proportion in the localpopulation. The black population of a city is derived from the 1990 census of the population.
32
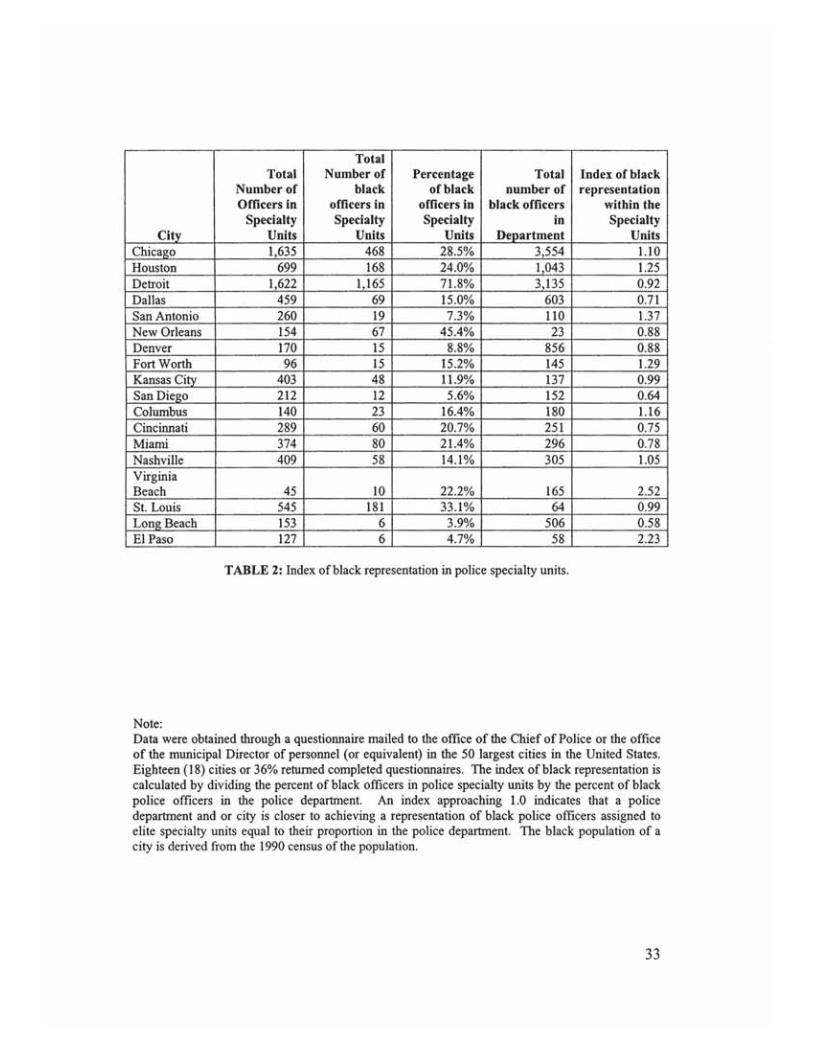
TotalTotal Number of Percentage Total Index of black
Number of black of black number of representationOfficer. in officers in officers in black officer. witbin the
Specialty Specialty Specialty in SpecialtyCitv Unit. Unit. Unit. Department Unit.
Chicago 1,635 468 28.5% 3,554 1.10Houston 699 168 24.0% 1,043 1.25Detroit 1,622 1,165 71.8% 3,135 0.92Dallas 459 69 15.0% 603 0.71San Antonio 260 19 7.3% 110 1.37New Orleans 154 67 45.4% 23 0.88Denver 170 15 8.8% 856 0.88Fort Worth 96 15 15.2% 145 1.29Kansas City 403 48 11.9% 137 0.99San Diego 212 12 5.6% 152 0.64Columbus 140 23 16.4% 180 1.16Cincinnati 289 60 20.7% 251 0.75Miami 374 80 21.4% 296 0.78Nashville 409 58 14.1% 305 1.05VirginiaBeach 45 10 22.2% 165 2.52St. Louis 545 181 33.1% 64 0.99Long Beach 153 6 3.9% 506 0.58EJ Paso 127 6 4.7% 58 2.23
TABLE 2: Index of black representation in police specialty units.
Note:Data were obtained through a questionnaire mailed to the office of the Chief of Police or the officeof the municipal Director of personnel (or equivalent) in the 50 largest cities in the United States.Eighteen (18) cities or 36% returned completed questionnaires. The index of black representation iscalculated by dividing the percent of black officers in police specialty units by the percent of blackpolice officers in the police department. An index approaching 1.0 indicates that a policedepartment and or city is closer to achieving a representation of black police officers assigned toelite specialty units equal to their proportion in the police department. The black population of acity is derived from the 1990 census of the population.
33

TotalTotal Number of Percentage
Number of black of black Percentage Index of blackOfficers in officers in officers in of blacks in representation
Specialty Specialty Specialty the within theCitv Uuits Units Units population department
Chicago 1,635 468 28.5% 38.5% 0.74Houston 699 168 24.0% 27.4% 0.87Detroit 1,622 1,165 71.8% 75.3% 0.95Dallas 459 69 15.0% 28.8% 0.53Sau Antonio 260 19 7.3% 6.7% 1.08New Orleans 154 67 45.4% 3.1% 0.74Denver 170 15 8.8% 61.3% 0.71Fort Worth 96 15 15.2% 12.3% 0.7Kansas City 403 48 11.9% 21.6% 0.4San Diego 212 12 5.6% 29.4% 0.62Columbus 140 23 16.4% 8.9% 0.73Cincinnati 289 60 20.7% 22.4% 0.54Miami 374 80 21.4% 37.8% 0.86Nashville 409 58 14.1% 24.6% 0.58VirginiaBeach 45 10 22.2% 24.1% 1.63St. Louis 545 181 33.1% 13.6% 0.69Long Beach 153 6 3.9% 47.3% 0.29El Paso 127 6 4.7% 13.2% 1.51
TABLE 3: Index of black representation in police specialty units calculated with the localpopulation.
Note:Data were obtained through a questionnaire mailed to the office of the Chief of Police or the officeof the municipal Director of personnel (or equivalent) in the 50 largest cities in the United States.Eighteen (18) cities or 36% returned completed questionnaires. The index of black representation iscalculated by dividing the percent of black officers in elite police specialty units by the percent ofblacks in the local population. An index approaching 1.0 indicates that a police department and orcity is closer to achieving a representation of black police officers assigned to elite specialty unitsequal to their proportion in the local population. The black population of a city is derived from the1990 census of the population.
34

1.2
r
.New
DOen
DFor
.Kan
II San
DCol
.Cin
.Mia
DNas
.Vir
.St.DLon
1.1
1.030.97
0.86
0.80.83 0.8
--
0.72 0.70.64
10.54 -0.5
0.730.67 0.7 0.67
0.620.6 0.54
0.40.4
0.2
oChi Hou Del DOli Sao EI P New Dell For KOIn Sao Col Gin Mia Nas Vir $1. Lon
FIGURE 2: Index of black representation within police departments.
.Chi
.Hou
DOet
.Oal
.San
III EI P
Note:Data were obtained through a questionnaire mailed to the office of the Chief of Police or the officeof the municipal Director of personnel (or equivalent) in the 50 largest cities in the United States.Eighteen (18) cities or 36% returned completed questionnaires. The index of black representation iscalculated by dividing the percent of black officers in a police department by the percent of blacks nthe local population. An index approacbing 1.0 indicates that a police department and or city iscloser to achieving a representation of black police officers equal to their proportion in the localpopulation. The black population of a city is derived from the 1990 census of the population.
35

3.00 IIChiII HourII Del
2.522.50 IIDal
2.23 II SanDNew
2.00 DDenII ForIIIKan
1.50DSanDCol
1.00 IICinIIMiaIINas
0.50 IIVirIIStLIIILon
0.00 IIEIPChi Det San Den Kan Col Mia Vir Lon
FIGURE 3: Index of black representation within specialty units compared to police departments.
Note:Data were obtained through a questionnaire mailed to the office of the Chief of Police or the officeof the municipal Director of personnel (or equivalent) in the 50 largest cities in the United States.Eighteen (18) cities or 36% retumed completed questionnaires. The index of black representation iscalculated by dividing the percent of black officers in police specialty units by the percent of blackpolice officers in the police department. An index approaching 1.0 indicates that a policedepartment and or city is closer to achieving a representation of black police officers assigned toelite specialty units equal to their proportion in the police department. The black population of acity is derived from the 1990 census of the population.
36

0.86
DClii
IIHollODe!
DDal
IISanDNewII Den
DForIIKan
illSan
DCol
DCin
IIMiaIINasIIVir
IIStL
ElLonDEIP
---'-'--~._--_.~-'-'--
Note:Data were obtained through a questionnaire mailed to the office of the Chief of Police or the officeof the municipal Director of personnel (or equivalent) in the 50 largest cities in the United States.Eighteen (18) cities or 36% returned completed questionnaires. The index of black representation iscalculated hy dividing the percent of black officers in elite police specialty units by the percent ofblacks in the local population. An index approaching 1.0 indicates that a police department and orcity is closer to achieving a representation of black police officers assigned to elite specialty unitsequal to their proportion in the local population. The black population of a city is derived from the1990 census of the population.
_._-_.~.~0.7 0.73
0.62
0.54
FIGURE 4: Index of black representation within specialty units compared to local population.
37

TotalNumber of Pereeutage Percentage Index of wbite
Total Number White of white of whites in representationof Officers in officers in officers in the within the
City Departments Department department population departmentChicago 13,796 8,322 60.4% 37.9% 1.59Houston 5,429 3,301 60.8% 40.6% 1.49Detroit 4,033 1,427 35.3% 20.6% 1.71Dallas 2,859 1,819 63.6% 47.6% 1.33SanAntonio 1,882 978 51.9% 36.2% 1.43NewOrleans 1,024 765 45.9% 33.1% 1.38Denver 1,664 1,016 70.1% 61.4% 1.14FortWorth 1,449 892 46.5% 56.4% 1.35KansasCity 1,165 1048 83.3% 64.9% 1.28San Diego 1,258 1,439 69.6% 56.6% 1.22Columbus 2,065 1,528 85.8% 73.8% 1.16Cincinnati 1,779 749 70.7% 60.1% 1.17Miami 1,058 210 18.8% 12.2% 1.54Nashville 1,117 1,038 84.3% 73.2% 1.15VirginiaBeach 1,231 625 86.2% 78.8% 1.09St. Louis 725 1,040 65.9% 50.1% 1.31LongBeach 1,576 580 67.9% 49.5% 1.37EI Paso 855 256 25.0% 26.3% 0.95
TABLE 4: Index of white representation in police departments.
Note:Data were obtained through a questionnaire mailed to the office of the Chief of Police or the officeof the municipal Director of personnel (or equivalent) in the 50 largest cities in the United States.Eighteen (18) cities or 36% returned completed questionnaires. The index of white representation iscalculated by dividing the percent of white police officers in a police department by the percent ofwhites in the local population. An index approaching 1.0 indicates that a police department and orcity is closer to achieving a representation of white police officers equal to their proportion in thelocal population. The white population of a city is derived from the 1990 census of the population.
38

DChi
IIHou1.8 1.71 ..'
1.59 tt DDel1.6 1.4~ 'iL 1.54 DDal
1.43138 I~ ~II San1.37
1.4~ .
1.35 II! .1.33 1.311.28 DNew
~1.22
1.2- ~ IIDen
1.09DFor
1-.M5.
IIKan!
II Sanr. •0.8
DCol- ~ ~ DCin0.6
IIMia0.4 IINas
0.2-;+ ~ ~ ~ IIVir
IISIL0 t8t' ~ DLon
Chi Hou Det Dal San New Den For Kan San Col Cin Mia Nas Vir StL Lon EIPDEIP
FIGURE 5: Index of white representation in police departments
Note:Data were obtained through a questionnaire mailed to the office of the Chief of Police or the officeof the municipal Director of personnel (or equivalent) in the 50 largest cities in the United States.Eighteen (I8) cities or 36% returned completed questionnaires. The index of white representation iscalculated by dividing the percent of white police officers in a police department by the percent ofwhites in the local population. An index approaching 1.0 indicates that a police department and orcity is closer to achieving a representation of white police officers equal to their proportion in thelocal population. The white population ofa city is derived from the 1990 census of the population.
39

TotalNumber Total
of Number Percentage Total Index of whiteOfficers of white of white Number of Percentage representation
in officers in officers in white of white within theSpecialty Specialty Specialty officers in officers in Specialty
Citv Units Units Units Denartment denartment UnitsChicazo 1,635 1,003 61.3% 8,322 60.4% 1.61Houston 699 398 56.9% 3,301 60.8% 1.4Detroit 1,622 417 25.7% 1427 35.3% 1.24Dallas 459 339 73.8% 1,819 63.6% 1.55SanAntonio 260 122 46.9% 978 51.9% 1.29NewOrleans 154 84 54.5% 765 45.9% 1.64Denver 170 122 71.7% 1,016 70.1% 1.16FortWorth 96 68 70.8% 892 46.5% 1.25KansasCitv 403 349 86.5% 1,048 83.3% 1.33SanDieao 212 168 79.2% 1,439 69.6% 1.39Columbus 140 117 83.5% 1,528 85.8% 1.13Cincinnati 289 229 79.2% 749 70.7% 1.31Miami 374 90 24.0% 210 18.8% 1.96Nashville 409 351 85.8% 1,038 84.3% 1.17VirginiaBeach 45 34 75.5% 625 86.2% 0.95St. Louis 545 360 66.0% 1,040 65.9% 1.31LongBeach 153 119 77.7% 580 67.9% 1.56El Paso 127 46 36.2% 256 25.0% 1.37
• Table 5: Index of white representation in police specialty units .
Note:Data were obtained through a questionnaire mailed to the office of the Chief of Police or the officeof the municipal Director of personnel (or equivalent) in the 50 largest cities in the United States.Eighteen (18) cities or 36% returned completed questionnaires. The index of white representation iscalculated by dividing the percent of white officers in elite police specialty units by the percent ofwhite police officers in the police department. An index approaching 1.0 indicates that a policedepartment and or city is closer to achieving a representation of white police officers assigned toelite specialty units equal to their proportion in the police department. The white population of acity is derived from the 1990 census of the population.
40

DChi
IIHau
2 , ? " DDel" DDal
1,8 ,~ ,,61 1',1 , , ,,' 1,56 '
II San<, "1,6 :':5~ DNew
1.4 1,39 D1' II Den1.4 --- -- ~1,29 1,33 1.31 1,31 1
1,24 1,161,25 1,17>, , DFar1.13 -1,2 IIKan
1~ - 111 IIISan
- DCal0,8
DCin0,6 -- - II Mia
IINas0.4
'; IIVir0,2 IISlL
DLan° Chi Hou Det Dal SanNewDen For Kan San Col Cin Mia Nas Vir StL Lon EIP DEIP
Figure 6: Index of white representation in specialty units compared to police departments.
Note:Data were obtained through a questionnaire mailed to the office of the Chief of Police or the officeof the municipal Director of personnel (or equivalent) in the SO largest cities in the United States,Eighteen (18) cities or 36% returned completed questionnaires. The index of white representation iscalculated by dividing the percent of white officers in elite police specialty units by the percent ofwhite police officers in the police department An index approaching 1,0 indicates that a policedepartment and or city is closer to achieving a representation of white police officers assigned toelite specialty units equal to their proportion in the police department. The white population of acity is derived from the 1990 census of the population,
41

TotalTotal Number of Perceutage
Number of wbite of white Iudex of whiteOfficers iu officers in officers in Perceutage of representation
Specialty Specialty Specialty white iu the within theCity Uuits Uuits Units population Specialty Units
Chicago 1,635 1,003 61.3% 37.9% 1.61Houston 699 398 56.9% 40.6% 1.4Detroit 1,622 417 25.7% 20.6% 1.24Dallas 459 339 73.8% 47.6% 1.55SanAntonio 260 122 46.9% 36.2% 1.29NewOrleans 154 84 54.5% 33.1% 1.64Denver 170 122 71.7% 61.4% 1.16Fort Worth 96 68 70.8% 56.4% 1.25Kansas City 403 349 86.5% 64.9% 1.33San Dieao 212 168 79.2% 56.6% 1.39Columbus 140 117 83.5% 73.8% 1.13Cincinnati 289 229 79.2% 60.1% 1.31Miami 374 90 24.0% 12.2% 1.96Nashville 409 351 85.8% 73.2% 1.17VirginiaBeach 45 34 75.5% 78.8% 0.95SI. Louis 545 360 66.0% 50.1% 1.31Long Beach 153 119 77.7% 49.5% 1.56EI Paso 127 46 36.2% 26.3% 1.37
TABLE 6: Index of white representation in police specialty units calculated with the localpopulation.
Note:Data were obtained through a questionnaire mailed to the office of the Chief of Police or the officeof the municipal Director of personnel (or equivalent) in the 50 largest cities in the United States.Eighteen (18) cities or 36% returned completed questionnaires. The index of white representation iscalculated by dividing the percent of white officers in elite police specialty units by the percent ofwhites in the local population. An index approaching 1.0 indicates that a police department and orcity is closer to achieving a representation of white police officers assigned to elite specialty unitsequal to their proportion in the local population. The white population of a city is derived from the1990 census of the population.
42

OChi
.Hou
2 ODe!. ', ODal
1,8.San,61 1 <;<; 1,64 , 1 <;R
1.6,
i') ONew
~-. 1 IQ I 1.37 .Den
1.4 1.29 1.33 1 1 1,311.24 1.25 OFor
"T131.17
1.2 .Kan
11°,95 I!! San
OCol0,8 -
OCin
0,6 .Mia.Nas
0.4.Vir
0.2 - - .StLOLon
0Chi Hou Det Oaf San New Den For Kan San Col Cin Mia Nas Vir StL Lon EIP OEIP
FIGURE 7: Index of white representation in police specialty units calculated with the localpopulation,
Note:Data were obtained through a questionnaire mailed to the office of the Chief of Police or the officeof the municipal Director of personnel (or equivalent) in the 50 largest cities in the United States,Eighteen (18) cities or 36% returned completed questionnaires, The index of white representation iscalculated by dividing the percent of white officers in elite police specialty units by the percent ofwhites in the local population. An index approaching 1.0 indicates that a police department and orcity is closer to achieving a representation of white police officers assigned to elite specialty unitsequal to their proportion in the local population, The white population of a city is derived from the1990 census of the population.
43

Total Percentage Index ofTotal Number of of Hispanic Percentage Hispanic
Number of Hispanic officers in of Hispanic representationOfficers in officers in the in the within the
City Department Denartment denartment nonulation denartmentChicago 13,796 1,668 12.1% 8.1% 1.49Houston 5,429 957 17.6% 20.9% 0.84Detroit 4,033 129 3.1% 1.3% 2.38Dallas 2,859 382 13.3% 8.4% 1.58SanAntonio 1,882 784 41.6% 36.5% 1.13NewOrleans 1,024 32 1.9% 2.5% 0.76Denver 1,664 269 18.5% 11.7% 1.58Fort Worth 1,449 123 10.5% 7.8% 1.34KansasCity 1,165 46 3.6% 2.0% 1.8San Diego 1258 325 15.7% 9.7% 1.61Columbus 2,065 0 0.0% 78.0% 0Cincinnati 1779 0 0.0% 51.0% 0Miami 1,058 596 53.3% 56.3% 0.94Nashville 1,117 0 0.0% 69.0% 0VirginiaBeach 1,231 12 1.6% 2.2% 0.72St. Louis 725 17 1.0% 98.0% 1.02LongBeach 1,576 154 18.0% 10.1% 1.78EI Paso 855 726 70.8% 51.8% 1.36
TABLE 7: Index of HIspame representatron m police departments.
Note:Data were obtained through a questionnaire mailed to the office of the Chief of Police or the officeof the municipal Director of personnel (or equivalent) in the 50 largest cities in the United States.Eighteen (18) cities or 36% returned completed questionnaires. The index of Hispanicrepresentation is calculated by dividing the percent of Hispanic officers in a police department bythe percent of Hispanics in the local population. An index approaching 1.0 indicates that a policedepartment and or city is closer to achieving a representation of Hispanic police officers equal totheir proportion in the local population. The Hispanic population of a city is derived from the 1990census of the population.
44

DClii
IIHou
2.5 2.38 y DOe!
DDal
II San
2 } DNew1.8 1.78. II Den
1.58 1.58 1.61 I DFor.49 , , .~
1.5 ~ IIKan. 1.34 1.36IIISan
1.13 DCol_.~ - I· 1.02
1 f-----. -0:9-r---- DCin0.84
0.760.72 IIMia
IINas
0.5 1---+ ...,p I~ IIVir
I.- IIS1L
DLon0 0 F40 DEIP,
Chi Hou Det Oaf San New Den For Kan San Col Cin Mia Nas Vir StL Lon EIP
FIGURE 8: Index of Hispanic representation in police departments.
Note:Data were obtained through a questionnaire mailed to the office of the Chief of Police or the officeof the municipal Director of personnel (or equivalent) in the 50 largest cities in the United States.Eighteen (18) cities or 36% returned completed questionnaires. The index of Hispanicrepresentation is calculated by dividing the percent of Hispanic officers in a police department bythe percent of Hispanics in the local population. An index approaching 1.0 indicates that a policedepartment and or city is closer to achieving a representation of Hispanic police officers equal totheir proportion in the local population. The Hispanic 'population of a city is derived from the 1990census of the population.
45

TotalTotal Number
Number of Percentage Total Iudex ofof Hispanic of Number of Percentage Hispanic
Officers officers Hispanic Hispanic of Hispanic representationin in omcersin officers in officers in within
Specialty Specialty Specialty the the SpecialtyCity Units Units Units department department Units
Chicago 1,635 146 8.9% 1,668 12.1% 0.73Houston 699 115 16.4% 957 17.6% 0.93Detroit 1,622 40 2.4% 129 3.1% 0.77Dallas 459 51 IJ.l% 382 13.3% 0.83SanAntonio 260 119 45.7% 784 41.6% 1.09NewOrleans 154 0 0.0% 32 1.9% 0.00Denver 170 37 21.7% 269 18.5% J.l7FortWorth 96 13 13.5% 123 10.5% 1.28KansasCity 403 6 1.4% 46 3.6% 0.38SanDiego 212 24 11.3% 325 15.7% 0.71Columbus 140 0 0.0% 0 0.0% 0.00Cincinnati 289 0 0.0% 0 0.0% 0.00Miami 374 204 54.5% 596 53.3% 1.02Nashvi1le 409 0 0.0% 0 0.0% 0.00VirginiaBeach 45 I 2.2% 12 1.6% 1.37St. Louis 545 4 73.0% 17 1.0% 0.73LongBeach 153 24 15.6% 154 18.0% 0.86EI Paso 127 73 57.4% 726 70.8% 0.81
TABLE 8: Index of Hispanic representation in police specialty units.
Note:Data were obtained through a questionnaire mailed to the office of the Chief of Police or the officeof the municipal Director of personnel (or equivalent) in the 50 largest cities in the United States.Eighteen (18) cities or 36% returned completed questionnaires. The index of Hispanicrepresentation is calculated by dividing the percent of Hispanic officers in police specialty units bythe percent of Hispanic police officers in the police department. An index approaching 1.0 indicatesthat a police department and or city is closer to achieving a representation of Hispanic policeofficers assigned to elite specialty units equal to their proportion in the police department. TheHispanic population of a city is derived from the 1990 census of the population.
46

ncu.Hou
1.40 :', ~ " oDelIA1.28 oDal
120 ," , .San1.09 R
" 1.02 oNew1.00
~~ ~
,k~ir ' .Den0.93
0.77°·830.86
0.81o For
0.80 !-- ~r ~
I--- ~ .Kan.73.0.71
0.73, 11IISan
0.60~ ~ ~ ticot
. ticnI·
0.40 ~ ..0.38 ~ . .Mia.Nas
~ 11" _ .Vir0.20
.StL
~0.000.00 M 1 IiIILon
0.00 fdII' oEIPChi Hou Det Dal San New Den For Kan San Col Cin Mia Nas Vir StL Lon EIP
FIGURE 9: Index of Hispanic representation in police specialty units.
Note:Data were obtained through a questionnaire mailed to the office of the Chief of Police or the officeof the municipal Director of personnel (or equivalent) in the 50 largest cities in the United States.Eighteen (18) cities or 36% returned completed questionnaires. The index of Hispanicrepresentation is calculated by dividing the percent of Hispanic officers in police specialty units bythe percent of Hispanic police officers in the police department. An index approaching 1.0 indicatesthat a police department and or city is closer to achieving a representation of Hispanic policeofficers assigned to elite specialty units equal to their proportion in the police department. TheHispanic population of a city is derived from the 1990 census of the population.
47

TotalTotal Number of Perceutage
Number of Hispanic of Hispanic Percentage of Index of HispanicOfficers in officers in officers in Hispanic in representation
Specialty Specialty Specialty the within SpecialtyCity Units Units Units popnlation Units
Chicago 1,635 146 8.9% 8.1% 1.09Houston 699 115 16.4% 20.9% 0.78Detroit 1,622 40 2.4% 1.3% 1.84Dallas 459 51 11.1% 8.4% 1.32SanAntonio 260 119 45.7% 36.5% 1.25NewOrleans 154 0 0.0% 2.5% 0Denver 170 37 21.7% 11.7% 1.85Fort Worth 96 13 13.5% 7.8% 1.73KansasCity 403 6 1.4% 2.0% 0.7San Diego 212 24 11.3% 9.7% 1.16Columbus 140 0 0.0% 78.0% 0Cincinnati 289 0 0.0% 51.0% 0Miami 374 204 54.5% 56.3% 0.96Nashville 409 0 0.0% 69.0% 0VirginiaBeach 45 I 2.2% 2.2% ISt. Louis 545 4 73.0% 98.0% 0.74LongBeach 153 24 15.6% 10.1% 1.54EI Paso 127 73 57.4% 51.8% 1.12
TABLE 9: Index of Hispanic representation in pohce specialty umts calculated with the localpopulation.
Note:Data were obtained through a questionnaire mailed to the office of the Chief of Police or the officeof the municipal Director of personnel (or equivalent) in the 50 largest cities in the United States.Eighteen (18) cities or 36% returned completed questionnaires. The index of Hispanicrepresentation is calculated by dividing the percent of Hispanic officers in elite police specialty unitsby the percent of Hispanics in the local population. An index approaching 1.0 indicates that a policedepartment and or city is closer to achieving a representation of Hispanic police officers assigned toelite specialty units equal to their proportion in the local population. The Hispanic population of acity is derived from the 1990 census of the population.
48

2..-r'~c-c-""""''"'"'"''i"""",c-"""""'''''''''c-c-'''''''''c-c-c-'''''''''''''''''''''''c-,."..,,.c-rl;t
1.8 1.73
1.851.84
1.2
DChi.HouDOe!DOal.SanDNew.OenDFor.KanIISanDColDCin.Mia.Nas.Vir.SILDLonDEIP
FIGURE 10: Index of Hispanic representation in police specialty units calculated with the localpopulation.
Note:Data were obtained through a questionnaire mailed to the office of the Chief of Police or the officeof the municipal Director of personnel (or equivalent) in the 50 largest cities in the United States.Eighteen (18) cities or 36% returned completed qnestionnaires. The index of Hispanicrepresentation is calculated by dividing the percent of Hispanic officers in elite police specialty unitsby the percent of Hispanics in the local population. An index approaching 1.0 indicates that a policedepartment and or city is closer to achieving a representation of Hispanic police officers assigned toelite specialty units equal to their proportion in the local population. The Hispanic population of acity is derived from the 1990 census of the population.
~--I1.6
1.4 1.321.25
0.8
0.6
0.4
0.2
oChi San Den Col VirDet Kan Mia Lon
49

THE RACIAL REPRESENTATION OF THE POLICE DEPARTMENTS:
Figure II examines the distribution of police departments which had a
disproportionate under-representation index below (1.00) of black, white, and
Hispanic police officers when calculated with the local population. Of the 18 police
departments in the study, black police officers had the highest number 15 or
(83.3%) of police departments with an index below (1.00). Hispanic police officers
followed with 7 or (38.8%). White police officers had the lowest number of police
departments I or (5.5%) with an index below (1.00).
Figurel2 examines the distribution of police departments that had a
disproportionate under-representation index below (1.00) of black, white, and
Hispanic police officers in elite police specialty units, when calculated with the
local population. Of the three racial groups of police officers, black police officers
had the highest number 15 or (83.3%) of police departments with an index below
(1.00). Hispanic police officers followed with 7 or (38.8%). White police officers
had the lowest number at I or (5.5%).
Figure 13 displays the distribution of police departments which a had
representation index less than (1.00) for black, white, and Hispanic police officers
in elite police specialty units when calculated with police officers assigned to
general patrol duties. Of the 18 police departments used in the study, 6 or (33.3%)
had an index than (1.00) for white officers. 10 or (55.5%) of the police
departments had an index less than (1.00) for black officers. Lastly, 5 or (33.3%)50

of the police departments had an index less than (1.00) for Hispanic officers. Note:
in figure 13 three police departments were not used in the index calculation for
Hispanic police officers, due to the lack of Hispanic representation within the
police departments ..
Figure 14 illustrates the indexes of white, black and Hispanic police officer's
representation within the 18 police departments used in this study and the local
population. white police officers = to 1.31, black police officers = to .72, and
Hispanic police officers are = to 1.12.
Figure 15 illustrates the indexes of white, black, and Hispanic police officer's
representation within the 18 police department's elite police specialty units and the
employees of the police departments not assigned to the elite police specialty units.
The indexes are as follows: white police officers = 1.11, black police officers =
1.04, and Hispanic police officers = .70.
Figure 16 illustrates the indexes of white, black, and Hispanic police officer's
representation within 18 police departments used in the study, and the local
population. The indexes are as follows: white police officers = 1.36, black police
officers = .78, and Hispanic police officers = .94.
51

83.3%90.0%
80.0%
70.0%
60.0%
50.0% IJBlack
.Hispanic
40.0% IJWhite
30.0%
20.0%
10.0%
0.0%Black Hispanic White
FIGURE II: Police departments with a disproportionate (under-Representation) of police officersby race compared to the local population
52

83.3%90.0%
80.0%
70.0%
60.0%
50.0% DBlack
.Hispanic
40.0% DWhite
30.0%
20.0%
10.0%
0.0%
Black Hispanic White
FIGURE 12: Departments with police specialty units having a disproportionate (under-Representation) of police officers by race compared to the local population
53

70.0%
60.0%
50.0%
40.0%
30.0%
20.0%
10.0%
66.6%
0.0%
OBlack.HispanicOWhite
Black Hispanic White
FIGURE 13: Departments with police specialty units having a disproportionate (under-Representation) of police officers by race compared to police officers in the department
54

1.31
0.8
FIGURE 14: Police officers race representation by index: Department compared to racerepresentation in the local population
1.4
1.2
0.6
ClBlack~~~-l. Hispanic
ClWhite
0.4
0.2
oBlack Hispanic White
55

1.2
0.8
0.6
DBlack
• HispanicDWhite
0.4
02
oBlack Hispanic White
FIGURE 15: Police officers race representation by index: Police specialty units compared to racerepresentation in the department
56

1.36
1.4
DBlack
• Hispanic
DWhite
1.2
08
06
0.4
0.2
oBlack Hispanic White
FIGURE 16: Police officers race representation by index: Police specialty units compared to racerepresentation in the local population
57

THE CHIEF OF POLlCE FACTOR:
The 18 police departments used in this study, all have a chief of police that is
responsible for the daily operational procedures and management of their police
department. The racial demographics of the chiefs of police are as follows: 9 or
50% of the chiefs of police are white, 7 or 38.8% are black, and 2 or 11.1% are
Hispanic.
WHITE CHIEFS OF POLlCE:
The data for white chiefs of police indicated the following: 9 or 100% of the
white chiefs of police had an over-representation of white police officers employed
at their police departments compared to whites within the local population.
Moreover, 6 or 66.6% of the police departments with white chiefs of police had an
over-representation of white police officers assigned to elite police specialty units,
compared to the number of white police officers employed at the police
department, and not assigned to an elite police specialty unit. Lastly, 7 or 88.8% of
the police departments with white chiefs of police had an over-representation of
white police officers assigned to elite police specialty units, compared to the
percentage of whites in the local population.
The data indicated that 7 or 77.7% of the police departments
with white chiefs of police had an under-representation of black police officers
employed at the police departments and assigned to elite police specialty units
disproportionate to the percentage of blacks within the local population.58

Furthermore, 6 or 66.6% of the police departments with white chiefs of police had
an under-representation of black police officers assigned to elite police specialty
units, disproportionate to the percentage of black police officers employed at the
police departments.
The data for police departments with white chiefs of police indicated that 3 or
33.3% of the police departments had an under-representation of Hispanic police
officers disproportionate to the percentage of Hispanic police officers employed at
the police departments, and Hispanics within the local population. Lastly, the data
indicated that Hispanic police officers were under-represented in 4 or 44.4% of the
police department's elite police specialty units, disproportionate to the Hispanic
representation within the police department.
BLACK CHIEFS OF POLICE
The data for black chiefs of police indicated the following: I or 14.2% of the
police departments with a black chief of police had an over-representation of black
police officers employed at the police department compared to the percentage of
blacks within the local population.
The data indicated that 7 or 100% of the police departments that employed a
black chief of police had an under-representation of black police officers assigned
to elite police specialty units, disproportionate to the percentage of blacks within59

the local population.
Moreover, the data implied that 5 or 71.4% of the police departments with a
black chief of police had an over-representation of black police officers assigned to
elite police specialty units, compared to the percentage of black police officers
within the police department and not assigned to an elite police specialty unit.
The data indicated that of the police departments that employed a black chief of
police, 7 or 100% of the police departments had an over-representation of white
police officers within the police department and assigned to elite police specialty
units compared to the percentage of whites within the local population.
Furthermore, the data implied that 4 or 57.1% of the police departments with a
black police chief had an over-representation of white police officers assigned to
elite police specialty units when compared to the percentage of white police
officers within the department and not assigned to an elite police specialty unit.
The data indicated that of the police departments with a black chief of police, 4
or 57.1% ofthe police departments had an under-representation of Hispanic police
officers employed within the police department and assigned to elite police
specialty units, compared to the percentage of Hispanics within the local
population. Lastly, 5 or 100% of the police departments with a black chief of
police, had an under-representation of Hispanic police officers assigned to elite
police specialty units, disproportionate to the percentage of Hispanic police officers
employed by the police department as sworn officers. Note: 2 of the police
60

departments with black chiefs of police were not utilized in the aforementioned
calculation, due to the lack of Hispanic police officer's representation within the
police departments.
HISPANIC CHIEFS OF POLICE:
The data indicated that of the police departments that employed a Hispanic chief
of police, I or 50% of the police departments had an over-representation of white
police officers employed within the department and assigned to elite police
specialty units, compared to the percentage of whites within the local population.
Moreover, 2 or 100% of the police departments that employed a Hispanic police
chief, had an over-representation of white police officers assigned to elite police
specialty units, compared to the percentage of white police officers employed by
the police department, and not assigned to an elite police specialty unit.
The data for the police departments that employed a Hispanic police chief,
indicated that I or 50% of the police departments had an over-representation of
black police officers assigned to elite police specialty units when compared to the
percentage of blacks within the local population. The data also implied that 1 or
50% of the police departments that had a Hispanic police chief, had an over-
representation of black police officers assigned to elite police specialty units when
compared to the percentage of black police officers within the police department,
and not assigned to an elite police specialty unit.61

The data also indicated that 2 or 100% of the police departments that had a
Hispanic police chief, had an over-representation of Hispanic police officers
employed by the department as sworn police officers and assigned to elite police
specialty units when compared to the percentage of Hispanics within the local
population.
Mite police chiefswhite polce officers:65.3black polce officers: 14.4Hspanc police officers: 17.5
TABLE 10
black police chiefswhite police officers:48.7black polce officers: 33.5Hspanc police officers: 5.1
Hispanic police chiefswhite police officers: 47.5black police officers: 6.0Hispanic police officers:44.6
Average percent of police officers by race, employed at police departments with
white, black, and Hispanic police chiefs.
Mite police chiefswhite polce officers:68.1black polce officers: 13.6Hspanc police officers:l7.2
Table 11
black police chiefswhite police officers: 61.9black police officers: 33.3Hspane policer officers: 4.06
Hispanic police chiefswhite polce officers: 53.9black polce officers: 6.7Hispanic police officers:39.5
Table IIillustrates the average percentage of police officers by race assigned to
elite police specialty units within the 18 police departments used in this study.
The data in tables I0 and II indicates that the representation percentage of
police officers who are of the same race as the chief of police, is increased among
the police officers employed within the police departments, and assigned to elite62

police specialty units within the police departments. The data implies that the
aforementioned concept is consistent for white, black, and Hispanic police officers.
The data implies that police chiefs who hold the highest position of authority
within a given police department, have the ability use their authority, discretion,
and power to influence the selection process of new police officers hired in the
police department and increase the number of police of the same race as the chief
of police who are to selected as members of elite police specialty units.
The increased representation numbers of police officers who are of the same
race as the chief of police within a police department, and selected as members of
elite police specialty units, is viewed in the law enforcement community as " taking
care of your own". For the most part, this procedure is tolerated by other police
officers who are not of the same race as the police chief. However, as the research
suggests, when police officers not of the same race as the chief of police perceive
that their representation within the police department, promotional advancement,
and membership in elite police specialty units is decreasing or not improving at a
satisfactory rate, resentment, envy, and law suits alleging racial bias,
discrimination, reverse discrimination, and disparate treatment begin to emerge.
63

CHAPTER 6
DISCRIMINA nON LAWSUITS:
As the research indicated, 5 or 27.7% of the police departments used in this
study have had law suits filed against the organization alleging racial bias,
discrimination, or reverse discrimination, by police officers within the police
department. ( Black Police In America. 1996 ).
In 1974, given the sordid history of racial discrimination in the city of Detroit's
police department, in which 19% of the police force was black, in a city where the
majority of the local population was black, the mayor of Detroit who was black,
implemented an affirmative action plan in which the police department promoted a
black officer for every white officer that was promoted. In effect, this was a quota
system of promoting officers.
This system of promoting encountered several problems. Just as in other cities,
white police officers resisted the affirmative action plan to promote black and white
police officers on a quota basis. In 1977, the Detroit Police Officers Association
(DPOA) filed a lawsuit to block the plan and force the city to promote police
officers strictly on the basis of "merit" and seniority, rather than by quota.
(Black Police In America. p99.1996).
The city of Houston police department had a long history of discriminating
against and limiting the promotional opportunities of black police officers. Blacks
of the force remained second-class officers assigned exclusively to Houston's black
64
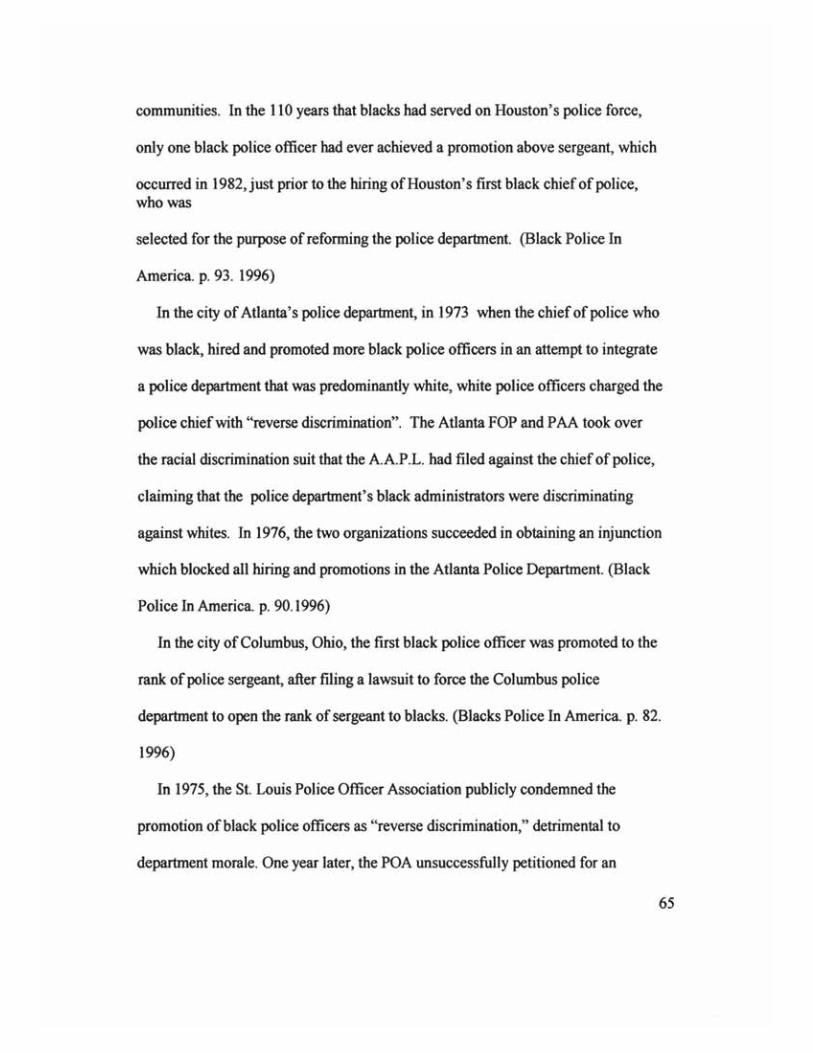
communities. In the 110 years that blacks had served on Houston's police force,
only one black police officer had ever achieved a promotion above sergeant, which
occurred in 1982,just prior to the hiring of Houston's first black chief of police,who was
selected for the purpose of reforming the police department. (Black Police In
AJnerica. p. 93. 1996)
In the city of Atlanta's police department, in 1973 when the chief of police who
was black, hired and promoted more black police officers in an attempt to integrate
a police department that was predominantly white, white police officers charged the
police chief with "reverse discrimination". The Atlanta FOP and PAA took over
the racial discrimination suit that the AAP.L. had filed against the chief of police,
claiming that the police department's black administrators were discriminating
against whites. In 1976, the two organizations succeeded in obtaining an injunction
which blocked all hiring and promotions in the Atlanta Police Department. (Black
Police In America, p. 90.1996)
In the city of Columbus, Ohio, the first black police officer was promoted to the
rank of police sergeant, after filing a lawsuit to force the Columbus police
department to open the rank of sergeant to blacks. (Blacks Police In America, p. 82.
1996)
In 1975, the St. Louis Police Officer Association publicly condemned the
promotion of black police officers as "reverse discrimination," detrimental to
department morale. One year later, the POA unsuccessfully petitioned for an
65

injunction to block promotions made by the police board. (Black Police In
AJnerica.p98.1996)
In 1967, Newark's predominantly white police force had expressed its
resentment toward the appointment of the department's first black police captain,
because they felt that he received his appointment only because of his race.(Black
Police In America, p.85. 1996).
In the South, Miami's MCPBA filed one of the earliest lawsuits charging a
police department with racial discrimination in hiring and promotion. Members of
the MCPBA requested compensation for the department's failure to provide them
police training and for the many years that the department had regulated them to a
separate facility. (Black Police In America. p.78. 1996)
A white police officer accused in the beating of a black undercover officer who
was mistaken for a murder suspect was fired in connection with the beating which
occurred in 1995. The black police officer was working undercover in the city's
Roxbury neighborhood when he was allegedly mistaken for a murder suspect
during a foot chase and beaten severely by several white officers. The black police
officer suffered a concussion, egg-sized contusions on his head, multiple facial cuts
and kidney damage and spent the next six months out of work. The city of Boston
agreed to pay nearly 1.3 million dollars to the black police officer to settle a civil
rights lawsuit against the city and the police department. (Boston Cop Fired in
Police Beating. Associated Press I.1999)
A federal judge refused to throw out a lawsuit against New York City alleging66

that a police department specialty unit unlawfully stops and frisks young black and
Latino men based on their skin color. The street crimes unit is an elite squad of
police officers whose goal is to reduce violent crime and remove illegal firearms
from the streets. The unit came under intense scrutiny after killing an unarmed
black immigrant who died in a hail of 41 bullets as he stood in his apartment
building. (Judge refuses to dismiss race suit against NYC.Reuters Limited.
p.1.1999)
Bedlam breaks out in Louisville, Kentucky after the Louisville police
department's chief of police is fired after awarding medals of valor to two police
officers who shot and killed a black man who tried to run down the officers in a
stolen car. (American Police Beat p.54 2000)
If teachers and trainers are role models, then the Oregon Police Academy is a
breeding ground for racists. Recently, officials at the state's academy in
Monmouth, Oregon admitted that three senior officers, all instructors, ridiculed and
harassed a student because he was Jewish. The harassment included sarcastic
remarks about circumcision, eating pork, and drugged-out Jews saluting Adolf
Hitler and admiring his mustache. (Minorities and the law: Police academy breeds
racism. The Rap Sheet: p 54. 1997)
Lawmakers try to get out of a decree that aimed to increase the number of
black police officers. The Fayetteville, NC, city council's fight over the police
department will not stop plans to free the city from a 1974 court order that calls for
67

a fixed percentage of black police officers to be hired and promoted. The order, a
consent decree filed in US District Court, in response to a complaint made by black
police officers, directed the Fayetteville police department to increase hiring and
promotion of blacks until they (blacks) made up at least 30% of the total police
force and 30% of the captains and lieutenants. (Fayetteville Observer-Times 1997)
The Illinois State Police have been caught practicing "reverse discrimination"
under the guise of affirmative action. A US District Judge ruled that as many as
5000 non-minority officers and officer-applicants were illegally denied either
promotions within the State Police, or the opportunity for a job with the State
Police. (Illinois State Police guilty of reverse discrimination: Adversity. Net. 1999)
16 non-minority deputies in Georgia's Futon County Marshall's department
were forced to sue this Georgia police department for reverse discrimination. The
court found that the sheriff who is a black female, and the Futon County, Georgia
Sheriff's department were guilty of practicing "reverse discrimination" and "anti-
white diversity" policies in this Georgia police department. The court found that
the sheriff's policies systematically excluded qualified "non-minority" employees
of the department from advancement solely for racial reasons. (Black Female
Sheriff Hires Her Own: Adversity. Net. 1996)
In Danbury, Connecticut, the city's retired and current black police officers are
taking the city to court, claiming that officials violated a 1994 federal court
settlement ordering the Danbury police department to hire more black police
officers. (The News-Times: p1.l997)68

In 1994, almost 200 black and Hispanic police officers in the city of Chicago's
police department filed a federal lawsuit contesting a controversial sergeants exam
that the plaintiffs maintain will turn back the clock to the discrimination of 1973.
(Jet .Oct. p.19. 1994)
"Race will be the problem of the 20th century," said WEB. DuBois almost 90
years ago. As the research indicates, discrimination and nepotism continue to exist
in law enforcement. The data indicates that in recent years, blacks have obtained
political power within large metropolitan cites and achieved high level managerial
positions in police departments across the United States. However, black police
officers continue to be an under-represented minority within law enforcement. and
subjected to discrimination.
BLACK POLICE PERSONALITIES:
The constant struggle of the black police officer to prove himself and his ability
as a police officer, in order to gain equality, respect, and the confidence of his peers
and supervisors, is a taxing drain on the officer physically, emotionally, and
psychologically. This in turn, can cause the black police officer who is trying to
advance to the status of becoming a member of an elite specialty unit to work
harder and appear to be increasingly more dedicated than his peers. As the research69

suggests, this type of work ethic can cause resentment, envy, and jealously, thereby
causing the officer to be black-balled and excluded from advancing within the
police department.
This relentless pursuit to proves one's self, in order to become a member of an
elite police specialty unit, can have a destructive and devastating effect on the life
and career of the black police officer. If he is unsuccessful in achieving his goal of
becoming a member of an elite police specialty unit, and subsequently speaks out
against and criticizes the establishment or the status quo, he is labeled a militant,
quickly isolated and singled out for oppressive destructive attracts by his
counterparts. He is then termed out of control and a renegade officer not having the
team player concept, which is considered "the kiss of death" within the law
enforcement community, thereby making him an undesirable and unwanted
candidate for the elite police specialty units.
The data suggests that the personalities of black police officers assigned to elite
police units can be categorized into four different personality types.
I. (The Sell-Out). An individual with the "sell-out" personality has completely
discarded his racial identity and heritage in order to fit in with the majority. This
individual exhibits selfish characteristics and only cares about himself and his
upward mobility and advancement within the police department. This individual is
concerned with how he is perceived by the majority, and continues to seek their
approval and confidence. Individuals having the "sell-out" personality oftentimes
70

betray and deceive other black police officers not having the "sell-out" personality
in order to show and demonstrate their loyalty and allegiance to the majority, and
move up the ladder of success within the police department.
2. (The Adaptive Assimilator) Having the personality of an "adaptive
assimilator" allows an individual to have the ability to assume the values,
ideologies, and beliefs of the dominate majority, and institute them as his own. A
person having the "adaptive assimilator" personality, changes his beliefs, views,
and opinions according to whichever group is dominant and in control. This
personality type is noted for inconsistency and lack of direction. However, a person
having the "adaptive assimilator" personality is tolerated and viewed as no threat to
the majority or dominant group.
3. (The Non-Conformist) A person with this personality type maintains his own
identity and heritage. This individual remains independent of the dominate group.
A person with the "non-conformist" personality is primarily concerned with
surviving and performing his job responsibilities at the highest level. This person is
content with his job placement, and not concerned with moving up the ladder of
success within the police department. A person with a "non-conformist" personality
is tolerated by the majority or dominate group, because of their exceptional job
performance and work production. However, persons having this type of
personality are viewed by the majority or dominate group as a possible threat to the
fundamental cohesiveness of the unit.
4. (The Rebellious Non-conformist) A person having this personality type is71

independent of the majority or dominate group. This individual challenges
decisions that are perceived to be unfair or biased. A person having the "rebellious
non-conformist" personality, oftentimes speaks out both publicly and privately
against racial and discriminatory injustices. This individual maintains a relentless
pursuit of obtaining racial equality and fairness with the majority or dominate
group. A person with this personality type is primarily concerned with fair
treatment and equal opportunity for success and advancement for members of his
own race, and less concerned with the stigma attached to him, or the consequences
that may be directed toward him by members of the dominate group. It
is this personality type that is viewed by members of the dominate group, as a
constant threat to the status quo and considered the most dangerous.
It is the "non-conformist and rebellious non-conformist" personalities that many
black police officers fit into, and can identify with. There are also many black
police officers that fit in and can identify with the "sell-out and adaptive
assimilator" personalities. It is those police officers who fit into the "sell-out and
adaptive assimilator" personalities that the dominate group are more
comfortable with, and are subsequently selected as members of elite police
specialty units more often than police officers that have "non-conformist or
rebellious non-conformist" personalities.
It is perceived that police officers with "non-conformist and rebellious non-
conformist" personalities threaten the status quo of the police special unit, thereby
72

making these police officers less likely to be considered as desirable applicants in
the selection process for members of elite police specialty units.
Lastly, police officers having "non-conformist and rebellious non-conformist"
personalities, do oftentimes manage to become members of elite police specialty
units by over -coming the internal barriers which had previously excluded them
from elite police specialty units. This is achieved through lawsuits, persistent
application and highly publicized occupational related accomplishments as police
officers. Also, through the intervention of friends, anonymous sources, or a
compassionate interested person sharing the same beliefs as the police officer, in aposition
of power having the decision making authority to assign police officers to elite
police specialty units.
T-TEST CONCLUSIONS
TABLE 12BLACKSSam Ie Statistics
Mean N Std. Dev Std. Error Hest sig. Representat-Mean ion
18 .0000 .0000 .000 UNDER18 .1845 4.349E-02
73

TABLE 13
WHITESSam Ie Statistics
Mean N
18 .0000
Std.Deviation
Std. ErrorMean
1.0000 .0000
T-test sig. Representat-ion
.000 OVER1.3144 18 .1928 4.544E-02
TABLE 14
mSPANICSSam Ie Statistics
Mean Std. ErrorMean.0000
T-test Representationsi ..422 EQUAL
.1572
A series oft-tests were conducted to determine if the difference between black,
white, and Hispanic representation within the police departments and police
specialty units was significant, utilizing the calculation ofless than (.05) as the
74

indicator of equality. The results are displayed in tables 12, 13, and 14.
TABLE 15
t-test fOlEquality 0
Meansd Sig. (2
tailed
Pecentage of Blacks 2.679 16 .016In DepartmentPecentage of Blacks 3.228 16 .005.n SpeciallY UnitsIndependent Samples Test
TABLE 16
~oefficienls Unstandardizec Standardizec Sig.Coefficients Coefficients
E Std. Bet~Erro
Constanl\ -11.56€ 7.970 -1.451 .167Percentage of Population that is .9OC .096 1.00~ 10.265 .OOC~IackISlack Chief 3.23 3.652 .08 .885 .39CNote: a Dependent Vanable: % of Blacks In the Department
TABLE 17
~oefficients Unstandardizec Standardize Sig.Coefficients d
CoefficientsB Std. Erro Beta
Constant) 2.18E 8.934 .24E .810Percentage of .78.:. .108 .891 7.24 • .000Population that is~IackSlack Chief -1.996 4.094 -.060 -.46€ .633Note. a Dependent Vanable. % of Blacks In Specialty Units
75

Utilizing data related to black police chiefs and the percentage of blacks within
the local population, I was unable to determine which had the greater influence on
the number of black police officers represented in police departments and specialty
units. In order to determine which had the greatest influence on black
representation within police departments and police specialty units, a historical
analysis and intensive interviews must be conducted.
Influence of the Race of the Chief:
Question I: Do Black Chiefs influence the PERCENTAGE of blacks employed in
department or specialty units?
Answer: Yes. Departments with Black Chiefs were significantly more
likely to have more blacks in the department and in the specialty units.
Yet, how does percentage of the city population that is Black influence
the percentage of blacks employed in the department or specialty units.
o Cities with a higher black population tend to have Black
o Chiefs and higher percentages of blacks in the department and
o specialty units.
o KEY CONCLUSION: A multiple regression analysis
o illustrated that percentage of Blacks in the city population
o provides a better explanation for why Blacks are more likely to
o be in the department or in specialty units.
76

SUMMARY AND CONCLUSIONS
The research and data obtained in this study provided mixed findings and failed
to produce a sufficient amount of convincing evidence to prove or disprove that
discrimination and nepotism exists within police specialty units or was a major
factor for the under representation of black police officers in police departments
and elite police specialty units. The research indicated that black police officer's
representation within police departments and police specialty units was dependent
upon three factors: I. black representation within the local population, 2. black
representation within the police department, and 3. the race of the police chief
The research indicated that minority representation within police specialty units
and police departments, when compared to the local population appeared to be the
lowest. However, minority representation did increase when calculated with
representation within the department. Based on the findings of the research, it
appears that the race of the police chief and the representation of Black Americans
within the local population provided the strongest influence and had the greatest
impact on the proportionate numbers of black police officers assigned to police
specialty units and employed within the police departments ..
An analysis of the data failed to provide a clear explanation for black police
officer's over-representation and high index calculations within the police
departments and police specialty units that participated in this study, and displayed
a higher degree of equality. In order to determine if black police officer's
77

representation within police departments and police specialty units is the result of
the increased numbers of blacks within the local population, or the result of having
a black police chief in charge of the organization, a historical analysis of the police
department's personnel data, combined with personal interviews of police officers
and chiefs of police in addition to examining census data must be preformed.
The research indicated that black police officers have encountered
discrimination and racism for decades, when confronted with the various
components criminal justice system and while actingin the official capacity of
police officers. However, the research failed to present a correlation between the
history of the criminal justice system and the disproportionate number of black
police officers assigned to police specialty units.
Based on the data and research ofthis study, it appears that discrimination and
nepotism exists within the law enforcement community, and act as barriers for
advancement within the police organization. However, unlike the years of the past,
discrimination and nepotism are less tolerated, consequently there are many
avenues available to obtain a multitude of resolutions.
The research suggests, that black police officers have the best opportunity of
becoming members of elite police specialty units in police departments that have
a black chief of police and in cities that have a high representation of blacks within
the in the local population.
78

BIBLIOGRAPHY
Adversity. Net. "Illinois State Police Guilty of Reverse Discrimination" April 7th
(1998).
Adversity. Net. "Black Female Sheriff Hires Her Own" Aug 17th (1997).
Alex, Nicholas. (1969) Black In Blue. New York: Meredith Publishing
Ali, Karen. (I997)."Black Police Officers Protest Hiring". The News-Times 14th
June sec I.
Ali, Karen (I 997)."Men Testify About Police Job Denials In Discrimination case".
The News-Times 25th Sept sec I.
American Police Beat. " Bedlam Breaks Out In Lewisville After Popular ChiefIs
Fired By Mayor" April (2000).
American Police Beat. "Minority Cops Fight To Keep Affirmation Action
Policies". July (2000).
Billings, Andrew. (1968). Black Families In White America. Englewood Cliffs,
N.J: Prentice-Hall Publishing.
Cashmore, E. (1991). Out Of Order: Policing Black People. Routlege, London And
New York.
Chambers, Bradford. (1968). Chronicles of Black Protest. New York: The New
American Library Publishing.
Charles, Nick and Coleman, Chrisena. " Badge Of Racism". Emerge Sept (1995).
79

Childs, Wesner.''NAACP Report Outlines Allegations Of Discrimination By
Police". Dec 20th (1996).
Clark, Kenneth. (1965). Dark Getto: Dilemmas Of Social Power: New York:
Harper and Row Publishing. Conley, John B. Historical Perspective And Criminal
Justice.
Journal Of Criminal Justice Education: vol4. nO.2. Fall (1993).
Dunlaney, Marvin W. (1996). Black Police In America. Indianapolis: Indiana
University Press Publishing.
Finch, Tom. "192 Minority Police Officers File Suit In Chicago Alleging Bias in
Sergeants Examination". Jet Oct (1994).
Fuller, Charlie (1998). The Art Of Undercover. Youngsville, NC: Law
Enforcement Associates Inc. Publishing.
Johnson, Ben. "Fighting Culture Misinformation About African-Americans".
(1993). Los Angeles Times. sec. I
Markowitz, Michael W. and Jones-Brown Delores D. (2000). The System In Black
and White. Westport CN: Praeger Publishers.
Moss, Gary."City's Effort To Rescind Hiring Order Continues:" Fayetteville
Observer-Times. Feb. (1997).
Presidents Commission.(l967). The Challenge of Crime InA Free Society.
Washington, DC: United States Gov. Printing.
80

Quarles, Benjamin.(1964). The Negro In The Making Of America. New
York:Collier Publishing.
Reuters Limited. (1999). "Judge Refuses to Dismiss Race Suit Against NYC".
secl.
Rumler, John. " Minorities and The Law : Police Academy Breeds Racism". The
Rap-sheet. Jan (1997) . sec.IS.
U.S. Bureau of Census. (1991). Statistical Abstracts of the United States.
Washington: U.S. Government Printing Office.
U.S. Bureau of Justice Statistics Sourcebook (1998) .. Washington: U.S.
Government Printing Office.
U.S. Department of Justice. Bureau of Justice Statistics (2000). Washington: U.S.
Government Printing Office.
U.S. Department of Justice . FBI Statistics (1992) Washington: U.S. Government
Printing Office.
West, Cornel .(1993) Race Matters. Boston, Mass: Beacon Publishing.
81


![Ellen Johnson Sirleaf and Nepotism: Re-emergence of Tubman ...massaquoijacob.files.wordpress.com/2015/09/2867-ellen-johnson... · commentators[4] accused her of “nepotism”, and](https://static.fdocuments.us/doc/165x107/5f7dbe480dd9c05f674b01a3/ellen-johnson-sirleaf-and-nepotism-re-emergence-of-tubman-commentators4-accused.jpg)