Discrimination A Review of Three Methods: Testing
63
Discrimination Testing A Review of Three Methods: A Review of Three Methods: Maximizing Confidence in Maximizing Confidence in Internal Results Internal Results Janette Pool, Gwen Williams, Tom Carr, Alexa Williams Society of Sensory Professionals Conference October 2010
Transcript of Discrimination A Review of Three Methods: Testing

Discrimination
TestingA Review of Three Methods: A Review of Three Methods:
Maximizing Confidence in Maximizing Confidence in
Internal ResultsInternal Results
Janette Pool, Gwen Williams,
Tom Carr, Alexa Williams
Society of Sensory Professionals Conference
October 2010

Goal of this ResearchGoal of this Research
2
Examine various tools/methods that can
be used for internal discrimination testing
• Compare effectiveness
• Understand the pros/cons
• Establish Best Practices and Recommendations

Research StrategyResearch Strategy• 3 Types of Tests
– Triangle
– Signal Detection Testing (SDT)
– Pick-2
• 3 levels of differences
– no difference
– moderate difference
– large difference
• 2 panels
– Trained
– Untrained
• 2 product categories
– Salted Potato Chips (low variability)
– Seasoned Tortilla Chips (high variability)
3 34 discrimination tests total!34 discrimination tests total!

Presentation FlowPresentation Flow
4
• Defining Discrimination Testing
• Overview of each test
– Triangle Test
– Signal Detection Test (SDT)
– Pick-2
• Review other research design details
• Results
• Recommendations

Discrimination TestingDiscrimination Testing
–– What is it?What is it?
5
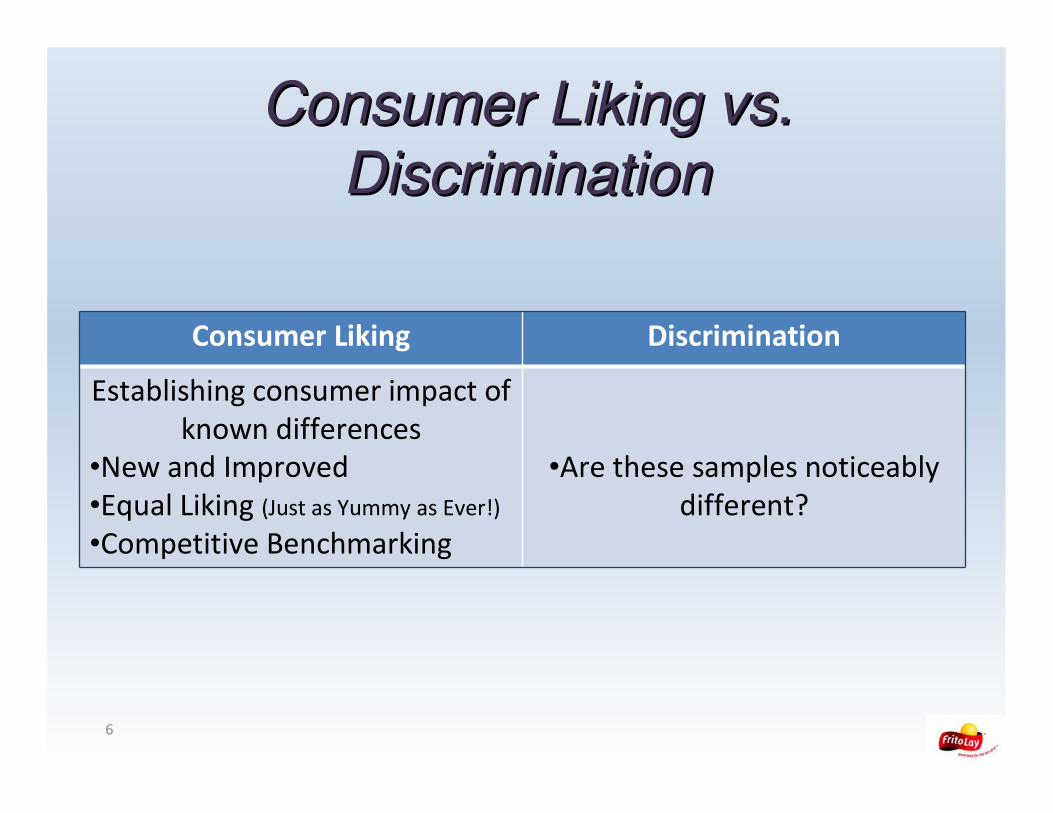
Consumer Liking vs. Consumer Liking vs.
DiscriminationDiscrimination
6
Consumer Liking Discrimination
Establishing consumer impact of
known differences
•New and Improved
•Equal Liking (Just as Yummy as Ever!)
•Competitive Benchmarking
•Are these samples noticeably
different?

When do we use When do we use
Discrimination Testing?Discrimination Testing?
• Formulation Changes
• New ingredient supplier
• Process changes
7

8
The ultimate goal is to go The ultimate goal is to go
unnoticed.unnoticed.
Discrimination testing is used to determine if there is a
detectable difference between products.

Overview of Methods Overview of Methods
EvaluatedEvaluated
9
Triangle
Signal Detection
Pick 2

Triangle TestTriangle Test
10

Triangle Test OverviewTriangle Test Overview
• Triangle is fairly standard discrimination test
method within Sensory Industry.
11
“One of these things is not like
the other things. One of these
things just doesn’t belong.”

Triangle Test OverviewTriangle Test Overview
• Evaluator is presented with 3 samples.
– Two hidden controls
– One test sample
• Evaluator is asked to select the sample that is
different
12

Triangle Test ExampleTriangle Test Example
13

Triangle Test ExampleTriangle Test Example
14

Analysis for TriangleAnalysis for Triangle
• The evaluator has 1/3 chance of getting
correct answer by guessing
• The analysis compares the percentage of
correct responses vs. expected value of 33%
15

Pros Cons
• Simple Test
• Minimal samples
• Widely used
• High probability of guessing
(1/3) = limited sensitivity
• Ignore product variability
Pros/Cons of the TrianglePros/Cons of the Triangle
16

Signal Detection Test (SDT)Signal Detection Test (SDT)
17
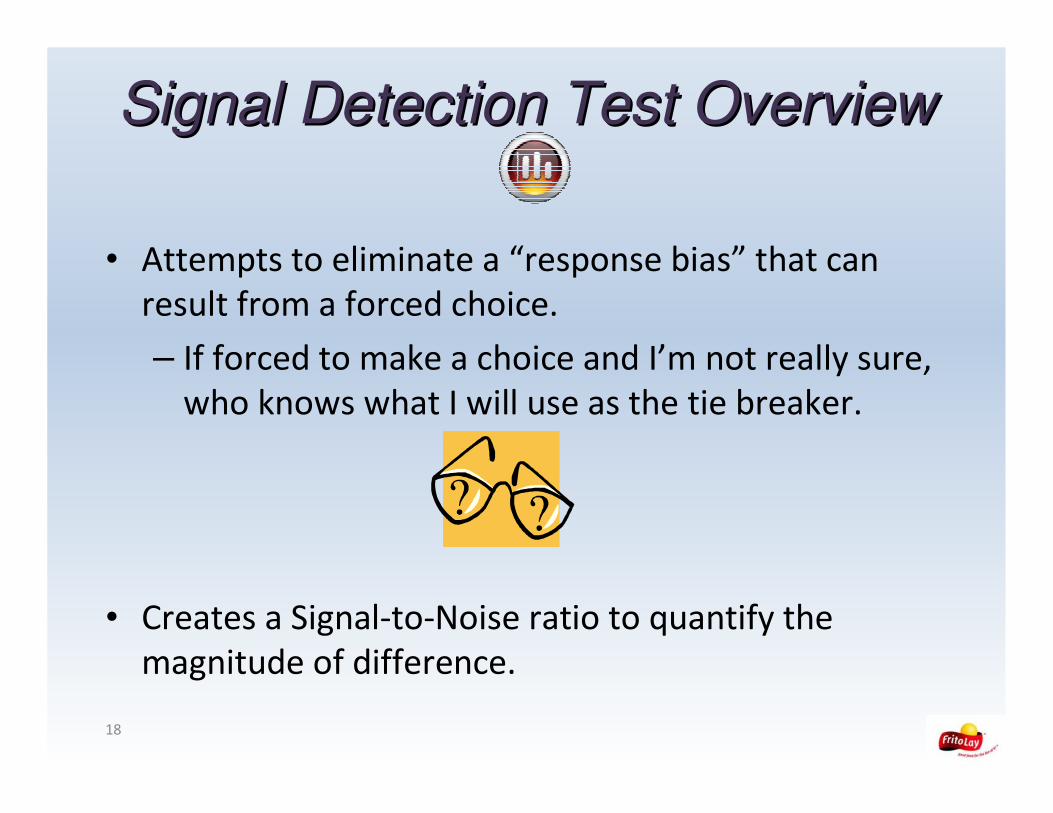
Signal Detection Test OverviewSignal Detection Test Overview
• Attempts to eliminate a “response bias” that can
result from a forced choice.
– If forced to make a choice and I’m not really sure,
who knows what I will use as the tie breaker.
• Creates a Signal-to-Noise ratio to quantify the
magnitude of difference.
18
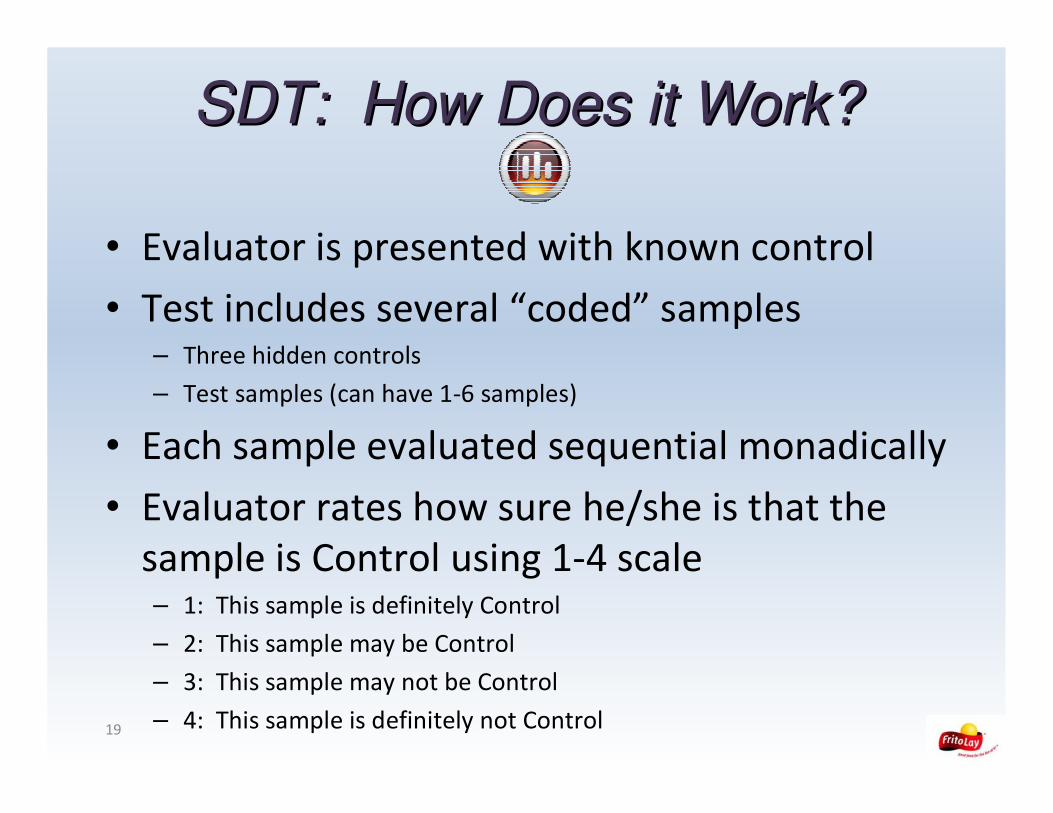
SDT: How Does it Work?SDT: How Does it Work?
• Evaluator is presented with known control
• Test includes several “coded” samples– Three hidden controls
– Test samples (can have 1-6 samples)
• Each sample evaluated sequential monadically
• Evaluator rates how sure he/she is that the
sample is Control using 1-4 scale– 1: This sample is definitely Control
– 2: This sample may be Control
– 3: This sample may not be Control
– 4: This sample is definitely not Control19

Signal Detection Test ExampleSignal Detection Test Example
20
Control

Signal Detection Test ExampleSignal Detection Test Example
21
Control Test
1: Definitely control
2: May be control
3: May not be control
4: Definitely not control

Signal Detection Test ExampleSignal Detection Test Example
22
Control
Hidden
Control
#1
1: Definitely control
2: May be control
3: May not be control
4: Definitely not control

Signal Detection Test ExampleSignal Detection Test Example
23
Control
Hidden
Control
#2
1: Definitely control
2: May be control
3: May not be control
4: Definitely not control

Signal Detection Test AnalysisSignal Detection Test Analysis
Across all evaluators
• Distribution of ratings for hidden controls
determined (“Noise”)
• Distribution of ratings for each test sample
determined (“Signal”)
• Compare two distributions to create a signal-
to-noise ratio called R-index.
• p-value and d’ for the R-index calculated
24

Pros Cons
•Gives Magnitude of
Difference
•No guessing or forced choice,
“I’m not sure” valid answer
•Multiple samples can
incorporate product
variability
• Test and analysis is more
involved and complex
• Requires more samples
(especially of control)
Pros/Cons of SDTPros/Cons of SDT
25

Pick 2Pick 2
26

Pick 2 BackgroundPick 2 Background
• Developed internally by Frito Lay in 2005– Similar to the method of Tetrads
– Validated extensively with consumers, n=72
• Existing internal discrimination tests did not
always produce results consistent with
consumers– Large external tests, n=200-300
– Internal tests said “No Difference”; Consumers said “Different”
• Believed a discrimination test with a lower
“guessing rate” would be more sensitive27

Pick 2 OverviewPick 2 Overview
• Evaluator is given a known control
• Evaluator is also given four samples
– Two hidden controls
– Two test samples
• The evaluator selects the two samples he/she
believes to be closest to the known control.
28

Pick 2 OverviewPick 2 Overview
29

Pick 2 OverviewPick 2 Overview
30
A B DC

Pick 2 OverviewPick 2 Overview
31
A B DC

Pick 2 AnalysisPick 2 Analysis
32
• There is a 1/6 chance of guessing correctlyAB AC AD
BC BD CD
• Analysis compares percentage of correct
responses vs. expected value of 1/6 (16.7%)
A B DC

Pros Cons
• Lower guessing probability
so more sensitive
• Multiple samples can
incorporate product
variability
• Test is more complex
• Requires more samples
Pros/Cons of Pick 2Pros/Cons of Pick 2
33

34
Triangle
Signal Detection
Pick 2

Other Research Design DetailsOther Research Design Details
35

The EvaluatorsThe Evaluators
• Trained Panel (n=10)– Trained in Spectrum Method
– Average 4 yrs experience
– Same panel used for all tests
– Had prior experience with SDT, but not Pick 2 or
Triangle
• Untrained panel (n=20)– Frito Lay employees
– Screened for product usage
– Participated in one test per product category36

The ProductsThe Products
All testing utilized Salted Potato Chips (PC) and
Seasoned Tortilla Chips (TC), both with two
levels of toast
37

How can you be sure about the How can you be sure about the
difference between the products difference between the products
are moderate and large?are moderate and large?
38

39
N=120 frequent users
Each consumer completed two tests: (PC, TC)
Each test contained 3 products: “Control”, “Mod”, “Big”
Consumer ValidationConsumer Validation

Consumer Reaction Consumer Reaction ––
Control vs. Moderate DifferenceControl vs. Moderate Difference
40
Preference
For the Product with Moderate Differences:
•Parity liking scores, but directionally lower•Preference directionally lower, may be significant
PC
TC

Consumer Reaction Consumer Reaction ––
Control vs. Large DifferenceControl vs. Large Difference
41
Preference
For the Products with Large Differences:
•Significant differences in liking scores•Significantly lower preference
PC
TC

Consumer Evaluation of Consumer Evaluation of
ProductsProducts
Name Sample Description Consumer Evaluation
Control • Control Product.
• Representative of in-market
design.
Mod • Moderate difference from
control.
• Represents the boundary of
acceptable in-market product
• Parity OA, FA
• OA, FA, Pref all trend lower
Big • Large differences from control.
• Represents product that would
be unacceptable for in-market
product.
• OA and/or FA sig. lower
• Pref significantly lower

ResultsResults
43

Comparing the Methods Comparing the Methods –– dd’’
• Using d’ to compare methods– Higher d’ values = more sensitive method
– d’ > 1 indicates a difference exists
– d’ = infinity notated as d’= 6 for charting purposes
• Did we get the correct
conclusion?• No difference for “control” vs. “control” product
• Difference for “control” vs. “mod”, “control” vs.
“big”
44

Trained PanelTrained Panel(N=10)(N=10)
45

Trained Panel Trained Panel ––
No DifferenceNo Difference
46• With trained panel, all three tests correctly concluded “No Difference”
d’va
lue
s
Different
Not Different
Triangle SDT Pick 2
PC 0.6228 – No Diff 0.4692 – No Diff 0.5155 – No Diff
TC 0.6228 – No Diff 0.6394 – No DIff 0.5155 – No Diffp-v
alu
es
α =
0.0
5

Trained Panel Trained Panel ––
Moderate DifferenceModerate Difference
47
• Pick -2 and SDT had consistently correct results
• Comparing d’ values, Pick-2 most sensitive
d’va
lue
s
Different
Not
Different
Triangle SDT Pick 2
PC 0.0034 – Sig Diff 0.0009 – Sig Diff 0.0000– SigDiff
TC 0.7009 – No Diff 0.0000– Sig Diff 0.0000– Sig Diffp-v
alu
es
α =
0.0
5

Trained Panel Trained Panel ––
Large DifferenceLarge Difference
48
• Trained panel detected large difference with ease with all methods
• Pick 2 most sensitive
d’va
lue
s
Different
Not
Different
p-v
alu
es
α =
0.0
5 Triangle SDT Pick 2
PC 0.0004 – Sig Diff 0.0000 – Sig Diff 0.0000– Sig Diff
TC 0.0000 – Sig Diff 0.0000– Sig Diff 0.0000– Sig Diff

Trained Panel Results Trained Panel Results
49
Solid Line = PC
Dashed Line = TC
Pick 2
SDT
Triangle
• Pick 2 is most sensitive
• SDT yields correct results and has acceptable sensitivity
• Triangle is not consistently correct (n=10)
Pick 2
Triangle
SDT
Incorrect Conclusion

Untrained PanelUntrained PanelN=20N=20
50

Untrained Panel (N=20) Untrained Panel (N=20) ––
Moderate DifferenceModerate Difference
51
• Triangle has highest d’ values• Anecdotal evidence suggests that SDT and Pick 2 were a more difficult test for untrained evaluators
• p-values suggest that TC results not significant
d’va
lue
s
Different
Not
Different
p-v
alu
es
α =
0.0
5 Triangle SDT Pick 2
PC 0.0116 – Sig Diff 0.0140 – Sig Diff 0.2650– No Diff
TC 0.1248 – No Diff 0.2832– No Diff 0.3930– No Diff

Untrained Panel Untrained Panel ––
Large DifferenceLarge Difference
52
d’va
lue
s
Different
Not
Different
• d’ comparison indicates Triangle is only reliable test
• p-value data suggests all results significant
p-v
alu
es
α =
0.0
5 Triangle SDT Pick 2
PC 0.0002 – Sig Diff 0.0000 – Sig Diff 0.0079– Sig Diff
TC 0.0009 – Sig Diff 0.0343– Sig Diff 0.0479– Sig Diff

Untrained Panel Results Untrained Panel Results
53
Solid Line = PC
Dashed Line = TC
Pick 2
SDT
Triangle
• Triangle test is simple and is the best method for untrained tasters
Pick 2
Triangle
SDTIncorrect Conclusion

Trained vs. Untrained PanelsTrained vs. Untrained Panels
54
Triangle
Test
SDT
Pick 2
• In general, the trained
panel is the more
sensitive tool for
detecting differences,
and this is with half
the evaluators of the
untrained panel.
• For moderate
differences with a
highly variable
product, a low n,
even with highly
trained tasters, is
risky on a Triangle.

SDT SDT –– Replicate or Not?Replicate or Not?
Determining Best Practices for
SDT – Sidebar Research
• The control is replicated three times• Is there benefit to replicating the test
samples as well?• Replication = more reads = more sensitive
• Replication = more samples = more fatigue

SDT SDT –– Replicate or Not? Replicate or Not? (Trained Panel Data)(Trained Panel Data)
56
• Replicating the samples does not seem to increase
sensitivity, possibly due to fatigue

57
RecommendationsRecommendations

RecommendationsRecommendations
• If trained panel available, use them. They are
more sensitive and accurate.
– Recommend Pick 2 best method for single sample
• Most sensitive
• Allows for some product variability to be introduced
– If have multiple samples to compare, can use SDT
• Do not replicate test samples
58

Recommendations, conRecommendations, con’’tt
59
• If Trained panel not available and you must
use an untrained panel
– Use triangle to keep test simple
– Use more than 20 respondents (minimum of 36
typical rule of thumb)
• In addition to p-values to determine statistical
significance, have guidelines to establish
meaningful differences
– % Detectors or d’ for Triangle, Pick 2
– R-Index for SDT

Recommendations Recommendations ––
Quick Reference ChartQuick Reference Chart
60
Triangle SDT Pick-2
Pros: Simple, only 3
samples
Con: May not be as
sensitive
Pros: Can do multiple
samples; includes
variability
Con: More complex
task and analysis;
may see effects
of fatigue
Pros: Most sensitive;
includes some
variability
Con: More complex
task
Untrained
evaluators
Single sample to
compare
Have several pulls
or multiple samples

Special ThanksSpecial Thanks
61
• Co-Authors Alexa Williams, Tom
Carr, and Gwen Williams
• Our internal Diagnostic Panel
• Kristine Guidry/Inside Taste –
Recruiting our untrained panelists

Questions?Questions?62

ReferencesReferences
63
Ennis, D.M. (1993). The Power of Sensory Discrimination Methods. The
Journal of Sensory Studies, 8, 353-370.
Ennis, J.M., D.M. Ennis, D. Yip, & M. O’Mahony. (1998). Thurstonian
Models for the Variants of the Method of Tetrads. British Journal of
Mathematical and Statistical Psychology, 51, 205-215.
O’Mahony, M. (1992). Understanding discrimination tests: a user friendly
treatment of response bias, rating and ranking R-index test and their
relation ship to signal detection. Journal of Sensory Studies, 7, 1-47.
Meilgaard, M., G.V. Civille, & B.T. Carr. (2005). Overall Difference Tests:
Does a Sensory Difference Exist Between Samples? In Sensory
Evaluation Technique, 4th ed., CRC Press, 59-98.
Rousseau, B. (2006). Indices of Sensory Difference: R-Index and d’.
IFPress, 9 (3), 2-3.