Discrete Element Modeling for Flows of Granular...
9
Discrete Element Modeling for Flows of Granular Material Eldin Wee Chuan Lim and Chi-Hwa Wang Department of Chemical and Biomolecular Engineering, National University of Singapore, 4 Engineering Drive 4, Singapore 117576. Prepared for presentation at the 2004 AIChE Annual Meeting Austin, Texas, November 7-12. Copyright © Wee Chuan Lim and Chi-Hwa Wang September, 2004 AIChE shall not be responsible for the statements or opinions contained in papers or printed in its publications
Transcript of Discrete Element Modeling for Flows of Granular...

Discrete Element Modeling for Flows of Granular Material
Eldin Wee Chuan Lim and Chi-Hwa Wang
Department of Chemical and Biomolecular Engineering, National University of Singapore, 4 Engineering Drive 4, Singapore 117576.
Prepared for presentation at the 2004 AIChE Annual Meeting
Austin, Texas, November 7-12.
Copyright © Wee Chuan Lim and Chi-Hwa Wang
September, 2004
AIChE shall not be responsible for the statements or opinions contained in papers or printed in its publications

Abstract The pneumatic transport of granular material is a common operation frequently
employed to transport solid particles from one location to another. It is well established in the literature that different flow regimes can arise in such transportation processes depending on the system geometry and operating conditions used. In this work, the pneumatic transport of solid particles in both vertical and horizontal conveying lines was studied numerically using a discrete element model coupled with computational fluid dynamics. The trajectory of every individual particle was followed by numerical integration of Newton's Law and interphase interactions were accounted for by a fluid-particle drag force model. The simulation outputs corresponded well with reported experimental observations in terms of the different flow regimes obtained at different operating conditions. In the vertical pneumatic conveying simulations, two different flow patterns corresponding to the experimentally observed dispersed flow and plug flow regimes were obtained at different gas velocities and solid mass loadings. Similarly, the homogeneous flow, stratified flow, moving dunes and slug flow regimes previously reported to occur in horizontal pneumatic conveying depending on the operating conditions used were also reproduced computationally in this work. Introduction
The pneumatic transport of granular material is a common operation frequently employed to transport solid particles from one location to another. Depending on the system geometry, gas velocities and material properties of the solid particles to be transported, such transportation processes can take place in different modes usually referred to as dense or dilute-phase conveying. Numerical modeling of pneumatic conveying systems plays an important role in improving our understanding of such systems. One of the commonly used approaches to pneumatic conveying modeling is the Eulerian/Lagrangian method where particles are tracked in a Lagrangian frame of reference either individually or as groups with identical properties known as parcels (Tashiro et al., 1997; Huber and Sommerfeld, 1998). An alternative approach has been Computational Fluid Dynamics (CFD) with two-fluid continuum models to represent the gas and solid phases as two interpenetrating continua (Levy, 2000). Further, the technique of particle dynamics simulation has also been widely used for investigations of granular and gas-solid systems. In particular, the Discrete Element Method (DEM) originally developed by Cundall and Strack (1979) for describing the mechanical behavior of assemblies of discs and spheres, has been successfully applied by many research workers in various areas of engineering interests. Tsuji et al. (1992) carried out numerical simulations of horizontal pneumatic conveying of solid particles using DEM coupled with CFD and showed that particles moved in the form of plugs in the conveying pipe. Several research workers have also applied the same approach to the simulation of two-dimensional fluidized beds (Tsuji et al., 1993; Xu and Yu, 1997; Mikami et al., 1998; Kaneko et al., 1999; Rhodes et al., 2001).
Despite the large number of work reported on gas-solid systems, there have been relatively fewer attempts at modeling the various flow regimes in vertical and horizontal pneumatic conveying systems. As such, the objective of this study was to apply the technique of combining DEM with CFD to the numerical simulation of such systems. The emphasis has been on reproducing computationally the different types of solid flow patterns and behaviors observed experimentally under different operating conditions. Mathematical Model
The translational and rotational motions of individual solid particles are governed by Newton’s laws of motion:

( )∑=
+++=N
1ji,fiij,dij,c
ii fgmff
dtdvm (1)
∑=
=ω N
1jij
ii T
dtdI (2)
where mi and vi are the mass and velocity of particle i, N is the number of particles in contact with this particle, fc,ij and fd,ij are the contact and viscous contact damping forces respectively, ff,i is the fluid drag force due to an interstitial fluid, Ii is the moment of inertia of particle i, ωi is its angular velocity and Tij is the torque arising from contact forces which will cause the particle to rotate.
A linear force-displacement model was implemented for calculating the contact and damping forces depicted in Eq. 1. Following the methodology of Cundall and Strack (1979), the normal and tangential force components are calculated separately according to the following equations:
( ) iij,ni,nij,cn nf δκ−= (3) ( ) iij,ti,tij,ct tf δκ−= (4) ( ) iiri,nij,dn nnvf ⋅η−= (5)
( ) ( )[ ]jjiiiiri,tij,dt RRttvf ×ω−×ω+⋅η−= (6) where fcn,ij, fdn,ij and fct,ij, fdt,ij are the normal and tangential components of the contact and viscous contact damping forces respectively, κn,i, δn,ij, ni, ηn,i and κt,i, δt,ij, ti, ηt,i are the spring constants, displacements between particles, unit vectors and viscous contact damping coefficients in the normal and tangential directions respectively, vr is the relative velocity between particles and Ri and Rj are the radii of particles i and j respectively. If
ctanff ij,cnij,ct +φ> then ‘slippage’ between the two contacting surfaces is simulated by a
Coulomb-type friction law, ctanff ij,cnij,ct +φ= where tanφ is analogous to the coefficient of friction and c is a measure of cohesion between the two contacting surfaces.
The fluid drag force model due to Di Felice (1994) which is applicable over a wide range of particle Reynolds numbers was used for evaluating the fluid drag force term in Eq. (1). The equations in this model are shown as follows:
χ−ε= ii,0fi,f ff (7) ( )iiii
2ifi,0di,0f vuvuRc5.0f −−πρ= (8)
( )⎥⎥⎦
⎤
⎢⎢⎣
⎡ −−−=χ
2Relog5.1
exp65.07.32
i,p10 (9)
2
5.0i,p
i,0d Re8.463.0c ⎟⎟⎠
⎞⎜⎜⎝
⎛+= (10)
f
iiifi,p
vuR2Re
µ−ρ
= (11)
where ff0,i is the fluid drag force on particle i in the absence of other particles, χ is an empirical parameter, εi is the local average porosity in the vicinity of particle i, cd0,i is the drag coefficient, Rep,i is the Reynolds number based on particle diameter, ρf is the fluid density, µf is the fluid viscosity and ui is the fluid velocity.
A rolling friction model was also incorporated into the code to simulate resistances against rolling motion in terms of a torque which opposes the rotation of a particle:
( ) iij,cnri fM ωµ−= (12) where Mi is the torque which opposes rotation of the particle, µr is the rolling friction coefficient and ωi denotes the direction of the angular velocity vector of the particle.
The collision time at every time step during a collision process was evaluated accurately according to Eq. (13):
( ) ( ) ( )[ ]2r
2222r
2yxyx
vbaRvbvavbvav +−++++
−=τ∆ (13)
where ∆τ is the collision time, a = xj – xi, b = yj – yi, R = Ri + Rj, (xi, yi) and (xj, yj) are Cartesian coordinate pairs representing the positions of particles i and j respectively.
The numerical procedure for particle dynamics simulation involves alternating between integration of Newton’s second law and the force-displacement model. In order to enhance the numerical stability of the code, the Verlet algorithm (Verlet, 1967) was used for time integration of Newton’s law and evaluation of particle positions and velocities. The equations involved in this algorithm are given as follows:
( ) ( ) ( ) 2
i
iiii t
mFtx2ttxttx ∆++∆−−=∆+ (14)
( ) ( ) ( )t2
ttxttxttv iii ∆
∆−−∆+=∆+ (15)
where xi is the position of particle i represented by Cartesian coordinates, Fi is the total forces acting on the particle equal to the sum of all terms on the right hand side of Eq. (1) and ∆t is the time step used.
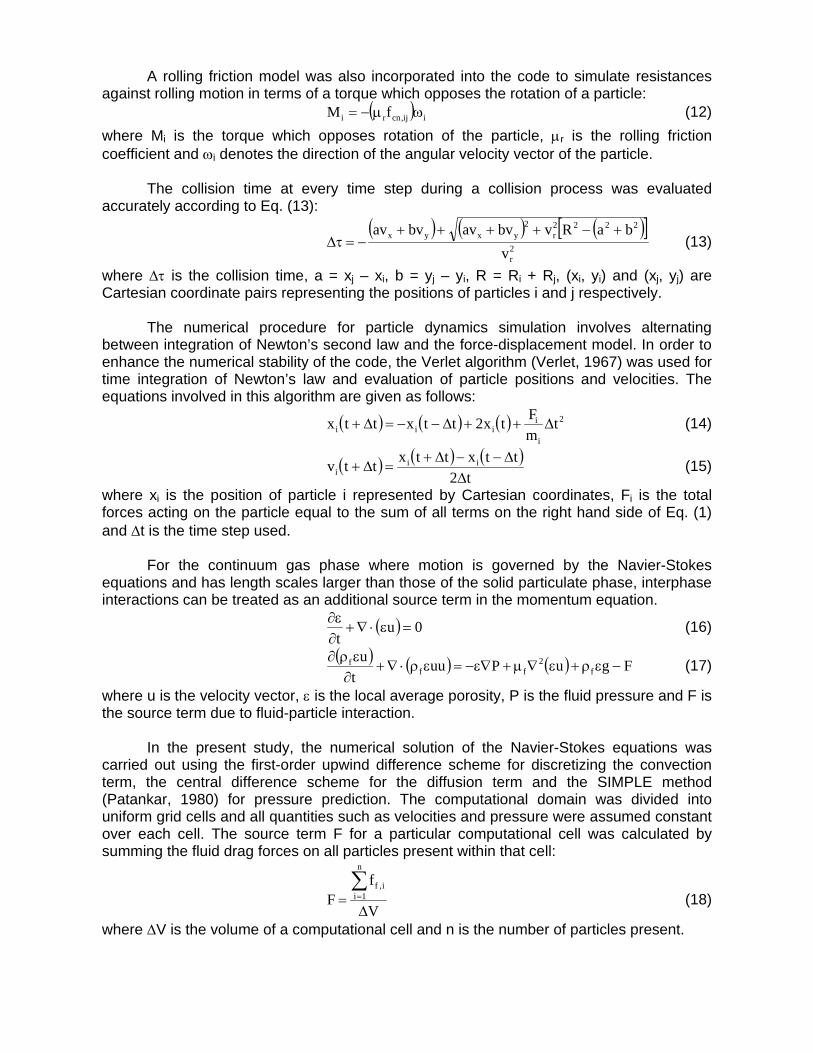
For the continuum gas phase where motion is governed by the Navier-Stokes equations and has length scales larger than those of the solid particulate phase, interphase interactions can be treated as an additional source term in the momentum equation.
( ) 0ut
=ε⋅∇+∂ε∂ (16)
( ) ( ) ( ) FguPuut
uf
2ff
f −ερ+ε∇µ+∇ε−=ερ⋅∇+∂ερ∂ (17)
where u is the velocity vector, ε is the local average porosity, P is the fluid pressure and F is the source term due to fluid-particle interaction.
In the present study, the numerical solution of the Navier-Stokes equations was carried out using the first-order upwind difference scheme for discretizing the convection term, the central difference scheme for the diffusion term and the SIMPLE method (Patankar, 1980) for pressure prediction. The computational domain was divided into uniform grid cells and all quantities such as velocities and pressure were assumed constant over each cell. The source term F for a particular computational cell was calculated by summing the fluid drag forces on all particles present within that cell:
V
fF
n
1ii,f
∆=∑= (18)
where ∆V is the volume of a computational cell and n is the number of particles present.

The local average porosity in the vicinity of a particle εi was calculated from the ratio of volumes of all particles located within the nine nearest computational cells to the total volume of these cells (Eq. 19).
V9
V1
k
1ii
∆−=ε∑= (19)
where k is the total number of particles in nine computational cells for a two-dimensional system and Vi is the volume of particle i. In both Eqs. (18) and (19), the volume of a computational cell ∆V was calculated based on a pseudo-three-dimensional geometry assumption whereby the ‘thickness’ of the computational domain in the spanwise direction was assumed to be equal to the particle diameter used. Simulation Conditions
The geometry of the pneumatic conveying system and type of particles used in the present simulations were based on the experimental work of Rao et al. (2001) and Zhu et al. (2003) (Table 1). The gas velocities considered were in the ranges 14 m s-1 – 24 m s-1 and 10 m s-1 – 30 m s-1 for the vertical and horizontal pneumatic conveying simulations respectively because these would include all flow regimes observed for the two systems. The numbers of particles used were 500, 1000, 1500 and 2000 corresponding to overall solid concentrations α, of 0.08, 0.16, 0.24 and 0.32 respectively where α is defined as the overall volume fraction of particles divided by the volume fraction of particles at maximum packing which is generally taken to be 0.65. In all simulations performed, particles were first allowed to settle freely under gravity for 0.5 s and form a packing at the ‘bottom’ of a vertical pipe or a heap in a horizontal pipe before gas flow was initiated. Periodic boundary conditions were applied to the solid phase to simulate an open flow system while a uniform gas velocity profile was maintained at the inlet. Table 1 Material properties and system parameters Shape of particles Spherical Type of particles Polypropylene Number of particles 500, 1000, 1500, 2000 Particle diameter, d 2.8 × 10⁻³ m Particle density, ρp 1123 kg m-3 Spring constant in force model, κ 5.0 × 10³ N m-1 Viscous contact damping coefficient, η 0.35 Coefficient of friction 0.3 Gas density, ρf 1.205 kg m-3 Gas viscosity, µf 1.8 × 10⁻⁵ N s m-2 Pipe diameter 0.04 m Pipe length 1.0 m Computational cell size 4 mm × 4 mm Simulation time step, ∆t 10-7 s Results and Discussion Vertical pneumatic conveying
The combined CFD-DEM model was first used for the numerical simulation of pneumatic conveying of granular material in a vertical pipe. From the simulation outputs obtained, two distinct types of flow regimes could be identified. Figure 1a shows the case where the solid concentration was 0.08 and the gas velocity was 14 m s-1. Particles are seen to be distributed throughout the entire length of the pipe. This kind of flow pattern is
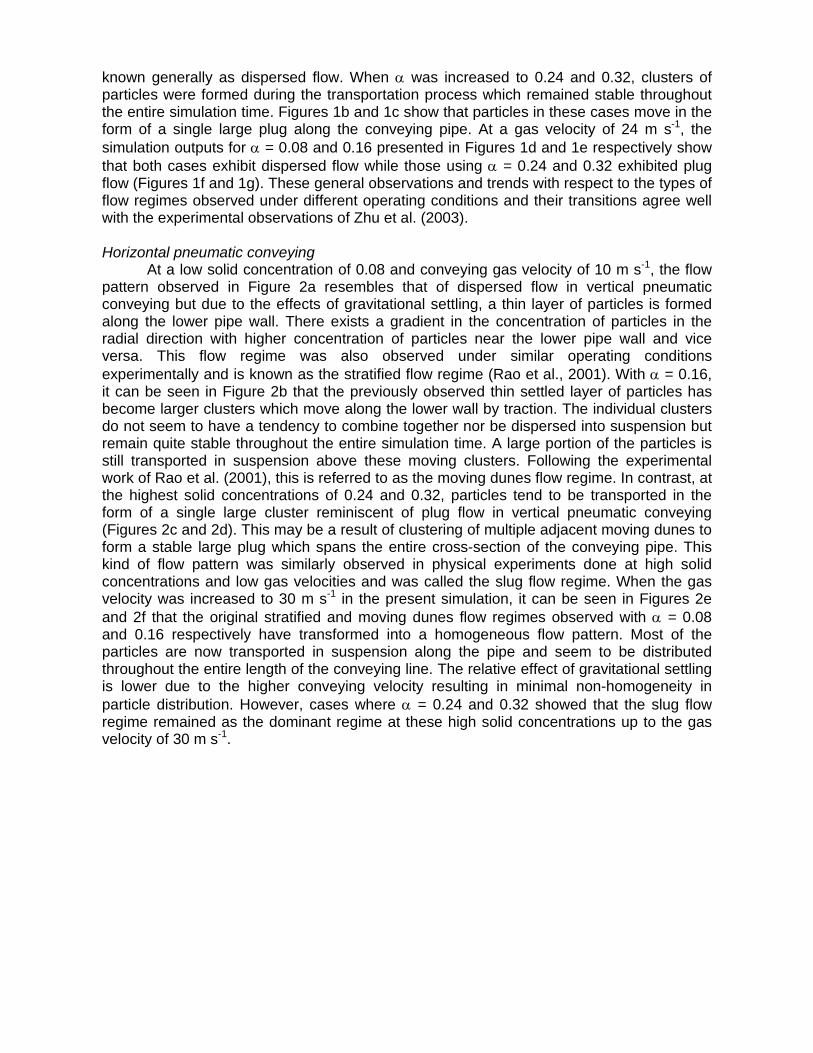
known generally as dispersed flow. When α was increased to 0.24 and 0.32, clusters of particles were formed during the transportation process which remained stable throughout the entire simulation time. Figures 1b and 1c show that particles in these cases move in the form of a single large plug along the conveying pipe. At a gas velocity of 24 m s-1, the simulation outputs for α = 0.08 and 0.16 presented in Figures 1d and 1e respectively show that both cases exhibit dispersed flow while those using α = 0.24 and 0.32 exhibited plug flow (Figures 1f and 1g). These general observations and trends with respect to the types of flow regimes observed under different operating conditions and their transitions agree well with the experimental observations of Zhu et al. (2003). Horizontal pneumatic conveying
At a low solid concentration of 0.08 and conveying gas velocity of 10 m s-1, the flow pattern observed in Figure 2a resembles that of dispersed flow in vertical pneumatic conveying but due to the effects of gravitational settling, a thin layer of particles is formed along the lower pipe wall. There exists a gradient in the concentration of particles in the radial direction with higher concentration of particles near the lower pipe wall and vice versa. This flow regime was also observed under similar operating conditions experimentally and is known as the stratified flow regime (Rao et al., 2001). With α = 0.16, it can be seen in Figure 2b that the previously observed thin settled layer of particles has become larger clusters which move along the lower wall by traction. The individual clusters do not seem to have a tendency to combine together nor be dispersed into suspension but remain quite stable throughout the entire simulation time. A large portion of the particles is still transported in suspension above these moving clusters. Following the experimental work of Rao et al. (2001), this is referred to as the moving dunes flow regime. In contrast, at the highest solid concentrations of 0.24 and 0.32, particles tend to be transported in the form of a single large cluster reminiscent of plug flow in vertical pneumatic conveying (Figures 2c and 2d). This may be a result of clustering of multiple adjacent moving dunes to form a stable large plug which spans the entire cross-section of the conveying pipe. This kind of flow pattern was similarly observed in physical experiments done at high solid concentrations and low gas velocities and was called the slug flow regime. When the gas velocity was increased to 30 m s-1 in the present simulation, it can be seen in Figures 2e and 2f that the original stratified and moving dunes flow regimes observed with α = 0.08 and 0.16 respectively have transformed into a homogeneous flow pattern. Most of the particles are now transported in suspension along the pipe and seem to be distributed throughout the entire length of the conveying line. The relative effect of gravitational settling is lower due to the higher conveying velocity resulting in minimal non-homogeneity in particle distribution. However, cases where α = 0.24 and 0.32 showed that the slug flow regime remained as the dominant regime at these high solid concentrations up to the gas velocity of 30 m s-1.

Figure 1 (a) Dispersed flow α = 0.08, gas velocity = 14 m s-1 (b) Plug flow α = 0.24, gas velocity = 14 m s-1 (c) Plug flow α = 0.32, gas velocity = 14 m s-1 (d) Dispersed flow α = 0.08, gas velocity = 24 m s-1 (e) Dispersed flow α = 0.16, gas velocity = 24 m s-1 (f) Plug flow α = 0.24, gas velocity = 24 m s-1 (g) Plug flow α = 0.32, gas velocity = 24 m s-1
(a) (b) (c) (d) (e) (f) (g)

Figure 2 (a) Stratified flow α = 0.08, gas velocity = 10 m s-1 (b) Moving dunes α = 0.16, gas velocity = 10 m s-1 (c) Slug flow α = 0.24, gas velocity = 10 m s-1 (d) Slug flow α = 0.32, gas velocity = 10 m s-1 (e) Homogeneous flow α = 0.08, gas velocity = 30 m s-1 (f) Homogeneous flow α = 0.16, gas velocity = 30 m s-1 Conclusions
A combined CFD-DEM model was developed and used for the numerical simulation of pneumatic conveying of granular material in both vertical and horizontal pipes in this study. The results obtained were in good agreement with previously reported experimental observations in terms of the types of flow patterns arising at different operating conditions used. In vertical pneumatic conveying, particles tend to be dispersed throughout the pipe at high gas velocities and low solid concentrations. On the other hand, particles tend to cluster together and move in the form of a dense plug when gas velocities are low or solid concentrations are high. These flow patterns have been referred to as the dispersed and plug flow regimes respectively. In horizontal pneumatic conveying, the simulations also show the presence of homogeneous or slug flow regimes where particles are distributed along the length of the pipe or packed together as a large cluster respectively. In addition, due to the effects of gravitational forces which cause particles to settle towards the bottom wall of the horizontal pipe, the stratified and moving dunes flow regimes where particles are transported by traction along the pipe wall are observed at low gas velocities and solid concentrations. These various flow regimes and their corresponding operating conditions have been represented in the form of phase diagrams. Acknowledgements This study has been supported by the National University of Singapore under the grant number R-279-000-095-112. Literature Cited Cundall, P. A., and O. D. L. Strack, “A discrete numerical model for granular assemblies,” Geotechnique, 29, 47 (1979). Di Felice, R, “The voidage function for fluid-particle interaction systems,” Int. J. Multiphase Flow, 20, 153 (1994).
(a)
(b)
(c)
(d)
(e)
(f)

Huber, N., and M. Sommerfeld, “Modelling and numerical calculation of dilute-phase pneumatic conveying in pipe systems,” Powder Technol., 99, 90 (1998). Kaneko, Y., T. Shiojima, and M. Horio, “DEM simulation of fluidized beds for gas-phase olefin polymerization,” Chem. Eng. Sci., 54, 5809 (1999). Levy, A., “Two-fluid approach for plug flow simulations in horizontal pneumatic conveying,” Powder Technol., 112, 263 (2000). Mikami, T., H. Kamiya, and M. Horio, “Numerical simulation of cohesive powder behavior in a fluidized bed,” Chem. Eng. Sci., 53, 1927 (1998). Patankar, S. V., Numerical Heat Transfer and Fluid Flow, Hemisphere, New York (1980). Rao, S. M., K. Zhu, C.-H. Wang, and S. Sundaresan, “Electrical capacitance tomography measurements on the pneumatic conveying of solids,” Ind. Eng. Chem. Res., 40, 4216 (2001). Rhodes, M. J., X. S. Wang, M. Nguyen, P. Stewart, and K. Liffman, “Study of mixing in gas-fluidized beds using a DEM model,” Chem. Eng. Sci., 56, 2859 (2001). Tashiro, H., X. Peng, and Y. Tomita, “Numerical prediction of saltation velocity for gas-solid two-phase flow in a horizontal pipe,” Powder Technol., 91, 141 (1997). Tsuji, Y., T. Kawaguchi, and T. Tanaka, “Discrete particle simulation of two-dimensional fluidized bed,” Powder Technol., 77, 79 (1993). Tsuji, Y., T. Tanaka, and T. Ishida, “Lagrangian numerical simulation of plug flow of cohesionless particles in a horizontal pipe,” Powder Technol., 71, 239 (1992). Verlet, L., “Computer “Experiments” on classical fluids. I. Thermodynamical properties of Lennard-Jones molecules,” Phy. Rev., 159, 98 (1967). Xu, B. H., and A. B. Yu, “Numerical simulation of the gas-solid flow in a fluidized bed by combining discrete particle method with computational fluid dynamics,” Chem. Eng. Sci., 52, 2785 (1997). Zhu, K., S. M. Rao, C.-H. Wang, and S. Sundaresan, “Electrical capacitance tomography measurements on vertical and inclined pneumatic conveying of granular solids,” Chem. Eng. Sci., 58, 4225 (2003).