Discover Paris Region’s dynamism · Paris Region Key Figures 2012 is a guide providing you with...
32
Transcript of Discover Paris Region’s dynamism · Paris Region Key Figures 2012 is a guide providing you with...


1
The PREDA also provides a great deal more information on its website www.paris-region.com and will be delighted to help you to locate and develop your business in the Paris Region.
The CRCI coordinates the region’s network of four Chambers of Commerce and Industry, advising and supporting businesses and offering a wide range of products and services relating to start-ups, innovation, economic intelligence, international development and training: www.paris-iledefrance.cci.fr
The IAU île-de-France continually monitors trends within the Paris Region, and in relation to international developments. Its website offers a range of information including data-bases and interactive maps: www.iau-idf.fr
Welcome to the Paris Region!
Discover Paris Region’s dynamism and diversity
Every year, the Paris Region Economic Development Agency (PREDA), the Paris - Ile-de-France Regional Chamber of Commerce and Industry (CRCI) and the Paris Region Urban Planning & Development Agency (IAU île-de-France) publish the latest key figures for the Paris Region, one of the world’s leading economic regions.
This document draws on the latest available published data.Paris Region Key Figures 2012 is a guide providing you with the statistics and maps you need when:- evaluating Paris Region’s offer within the
wider French and European environment,- gathering detailed information for your mar-
ket research relating to potential investment projects in the Paris Region.
We hope that this booklet will enable you to discover the exceptional potential of the Paris Region, highlighting its unique dynamism and diversity.
This booklet was produced by:- the Paris - Ile-de-France Regional Chamber of Commerce and Industry (CRCI Paris - Ile-de-France),
Chairman: Yves Fouchet, Chief Executive Officer: Pierre Lahoche- the Paris Region Urban Planning & Development Agency (IAU île-de-France), Managing Director:
François Dugeny- the Paris Region Economic Development Agency (PREDA), Chairman: Jean-Claude Detilleux,
Chief Executive Officer: Denis TersenPublication Manager: Pierre Lahoche, Chief Executive Officer of CRCI Paris - Ile-de-France.Coordination/design/editorial: Martine Delassus (CRCI Paris - Ile-de-France); Florence Humbert (PREDA); Anne-Marie Roméra (IAU île-de-France); Julie Veaute (PREDA).Maps and charts: Pascale Guery (IAU île-de-France).Translation: Activaction
Layout, cover page and printing: Technic Imprim - Médian Impressions - 91942 Les Ulis - France.
© Copyright CRCI Paris - Ile-de-France / IAU île-de-France / PREDA – February 2012
PEFC/10-31-1963

2

3
ContentsDiscover ........................................................................................................................ 04
Population .................................................................................................................. 06
Education ..................................................................................................................... 08
Employment ............................................................................................................ 10
Research and Development ....................................................... 12
Economic environment ........................................................................ 16
Corporate events and tourism ............................................... 20
Transport .................................................................................................................... 22
Real estate ............................................................................................................... 24
Quality of life .......................................................................................................... 26

4
Discover
DiscoveR PaRis Region

Recr
eatio
n on
the
Cham
p de
Mar
s (7
5) ©
Par
is To
uris
t Offi
ce /
Phot
ogra
pher
: Dav
id L
efra
nc
5
Discover
Paris Region economic highlights
The Paris Region compared to Franceand to the european Union 27
Surface area (km2)1 12,012Population as at 01-01-2011 (inhabitants)1 11,867,000Population density in 2011 (inhab/km²)1 988GDP in 2009 (million E)1 552,100GDP in 2009 (E per capita)1 47,000Exports in 2010 (million E)2 68,000Imports in 2010 (million E)2 119,000Number of companies* in 20101 822,000Number of businesses* in 20101 936,300Business creations in 20101 150,400Business closures in 20101 9,700Total number of jobs (salaried + non salaried) in 20091 5,955,000Unemployment rate (Q3 2011)1 8.3
Employment in public and private research in 20093 143,700
Jobs created by FDI in 20104 8,400
Number of students in 2010-20115 618,800
Airport traffic in 2011 (thousands of passengers)6 88,100
International high-speed train traffic in 2010(thousands of passengers)7
17,500
Office space in 2011 (thousand m2)8 50,000
Paris Region / European Union 27 Paris Region / France
Population1
(inhabitants)
Employment2 (jobs)
GDP2
Employment in public and private research2 (full-time jobs)
Public and private researchexpenditure2 (E)
5%
2.4%
2.7%
4.7%
5.8%
7.1%
36.5%
39.6%
23.2%
29.5%
18.3%
10% 15% 20% 25% 30% 35% 40% 45%0
•9competitivenessclusters•395tradeshowsandover260conventions
in2010•Theworld’sleadingtouristdestination
The Paris Region is alsoSources: Insee, French Ministry of Education, Eurostat
1201122009
Sources: 1Insee (French Institute of Statistics) 2Paris Region Customs department
3French Ministry of Research4Invest in France Agency – PREDA
5French Ministry of Education 6Aéroports de Paris
7SNCF 8ORIE
* Répertoire des Entreprises et des Etablissements (Companies and Businesses listing), entire range
Cité
des
Scie
nces
et d
e l’I
ndus
trie
(75)
© P
aris
Tour
ist O
ffice
/ Ph
otog
raph
er: J
acqu
es L
ebar

eURoPe’s MosT PoPULaTeD Region
•11.9millioninhabitantsin2011,accountingfor:
- 18.3% of the French population - 2.4% of the EU-27 total
•Up6.9%from2001to2011,i.e.3.0pointsabovetheEU-27 average (up 3.9%)
•Upby760,000inhabitantsover10years
•5citiesexceeding100,000inhabitants:Paris, Boulogne-Billancourt, Saint-Denis, Montreuil, Argenteuil
6
Population
Population density of european Union regions in 2010*
Paris
Pla
ge (P
aris
Beac
h) ©
Par
is To
urist
Offi
ce /
Phot
ogra
pher
: Mar
c Be
rtran
d
Source: Eurostat1Inner + Outer London , 2009
The eU’s 5 most densely populated regions in 2010
(inhabitants per km2)
Brussels Capital Region (BE) 6,767
London1 (UK) 4,869
Vienna (AT) 4,290
Berlin (DE) 3,860
West Midlands (UK) 2,927
Paris Region (FR) ranks at no.19 982
Rand
o Ro
ller ©
Par
is To
urist
Offi
ce -
Phot
ogra
pher
Am
élie
Dup
ont

a yoUng Region
•Highbirthrate:15per1,000comparedtotheEUaverage(11 per 1,000) and the French average (13 per 1,000)
•56%oftheregion’sinhabitantsareunder40yearsold(2009)
7
Population
•11.9millioninhabitants•Europe’smostpopulatedregion•Ayoung,cosmopolitanregion
P a r i s R e g i o n
Paris Region France European Union0-19 25.9 24.8 21.520-39 29.9 25.8 27.540-59 26.7 27.2 28.260-74 11.2 13.5 14.875 and over 6.3 8.7 8.0
Source: Eurostat
(as %)
a cosMoPoLiTan Region
•12%ofthepopulationisofnon-Frenchnationality,representing 1.4 million inhabitants (2008)
Source: Insee (French Institute of Statistics)
Algeria189,265•13%
Morocco140,627•10%
Portugal225,663•16%
United Kingdom20,318•1%
Germany19,482•1%
Other EU 27 nationalities197,882•14%
China53,195•4%
Japan11,795•1%
India10,433•1%
Other Asian nationalities
157,592•10%
United States16,276•1%
Brazil6,241•0.5%
Canada4,929•0.5%
Other American nationalities44,076•3%
Other African nationalities346,870•24%
Asia total:233,015•16%
America total:71,522•5%
Europe total:463,345•32%
Africa total:676,762•47%
non-French nationals living in the Paris Region in 2008
ESSE
C (9
5) ©
ESS
EC -
Phot
ogra
pher
: A. C
héziè
res
Population by age group in 2009

8
Education
HighereducationD 618,800 students within the Paris Region, including 342,400 enrolled in universitiesLEVEL THELMDSYSTEM(LicenceMasterDoctorate)
Universities grandes Écoles1
Business schoolsengineering schools
other institutions(high-schools,
specialist schools)9 (+9 years) State diploma of doctor of medicine
8 DOCTORATE (+8 years)
Doctorate (PhD)
76 (+6 years) State diploma of doctor of dental surgery
State diploma of doctor of pharmacy Master of Business Administration
(MBA) Specialist master’s (MS)
5 MASTER (+5 years)
Research master’s Professional master’s Engineering degree
Engineering degree Master of Science (MSc) Business school diplomas Grandes écoles degrees
Diplomas from specialist schools (health, social, tourism, art, architecture, etc.)
4
3 LICENCE (+3 years)
Licence (bachelor’s) Licence professionnelle
(professional bachelor’s)2 (+2 years) University diploma in technology (DUT)2
Preparation for competitive entrance exam to the Grandes écoles – CPGE2
Highertechnicalcertificate– BTS2
1Completion of secondary school + baccalaureate = access to higher education Secondary education: 11 to 18 years old D 1,000,100 students in the Paris Region Primary education: 3 to 10 years old D 1,157,300 students in the Paris Region
Sources: EduFrance, French Ministry of Higher Education and Research 2010-20111The Grandes Écoles are specifically French institutions. They are extremely selective and offer education of a very high standard.
2DUT = University Diploma of Technology; CPGE = Preparatory classes for Grandes Écoles; BTS = Technical Sections.
The French education system - an overviewSa
inte
-Gen
eviè
ve li
brar
y (7
5) ©
Par
is To
urist
Offi
ce-P
hoto
grap
her A
lain
Pot
igno
n
THe HigHesT concenTRaTion oF HigHeR eDUcaTion sTUDenTs in eURoPe
•1st region in the EU in terms of higher education students
• 618,800studentsenrolledinhighereducationin 2010-2011
• 17universitieslocatedon23sitesacrosstheregionand55 public and private Grandes Écoles1

9
Education
•Educationaldynamismstemmingfromuniversitygroupings
•Majorinvestmentsmadeintoresearchandeducation
•Astronginternationalstudentpresence
P a r i s R e g i o n
Higher education in the Paris Region in 2012
a sTUDenT Region oPen To THe woRLD
•11foreigninstitutions,representing6countries:Germany, Great Britain, Italy, Japan, the USA and Spain
•22multiculturalschools:American,Arab,Dutch,English,German, Italian, Japanese, Norwegian, Polish, Portuguese, Spanish and Swedish
•Foreignstudentsaccountfor22%ofthetotalstudentpopulation in Paris Region universities
woRLD-cLass HigHeR eDUcaTion insTiTUTions
•Excellenceinnaturalsciencesandmathematics:Université Paris-Sud 11, Université Pierre et Marie Curie and ENS Paris ranked among the world’s top 100 universities in the Shanghai Academic Ranking of World Universities
•Leadingbusinessschools:HECParis,INSEAD,ESCPEurope, ESSEC and Skema are among the best European business schools, according to the Financial Times
•7schoolsteachingexecutiveleadersoftheworld’stop500 companies, according to the école des Mines ranking: HECParis,ÉcolePolytechnique,ENA,SciencesPoParis,INSEAD, Mines ParisTech and école des Ponts ParisTech
a sTRong eDUcaTionaL anD ReseaRcH neTwoRK
•TheParisRegionhas7majorPRESclusters(Pôlesde Recherche et d’Enseignement Supérieur) bringing together universities, Grandes écoles and research centres:
- Paris-Est, located in the Eastern Paris Region focused on health and society, cities and the environment
- ParisTech: Paris Institute of Science and Technology, assembling 12 of the most prestigious French Grandes écoles
- UniverSud Paris, located in the Southern Paris Region, devoted to science
- 4 PRES clusters located in central Paris: Université ParisCité,SorbonneUniversitésandHESAM(HigherStudies – Sorbonne – Arts and Trades), which are multidisciplinary, and Paris Sciences et Lettres - Quartier Latin focused on experimental sciences, social studies and artistic creation
• OperationCampus:E2b were allotted to the Paris Region in view of a substantial investment in its university real-estate
•InitiativesofExcellence:aE7.7b national scheme aiming at achieving the emergence in France of 8 world-class, multidisciplinary centres of excellence. 4 out of 8 selected projects involve the Paris Region

10
Employment
a sUBsTanTiaL eMPLoyMenT Basin
• 5,955,000jobsin2009
• Shareoftheworkingpopulation:61%in2010
• Averageannualemploymentgrowthratefrom1999to2009: 1.3%
• 84%ofjobsin2010wereintheservicessector
UneMPLoyMenT LeveL coMPaReD To FRance anD THe eU
• 493,700unemployedin2011
• Unemploymentrate:8.3%(Q32011)
employment in Paris Region from 1999 to 2009
Unemployment level from 2008 to 2011
Unemployment rate of Paris Region compared with other european Regions in 2010
6,200,000
6,000,000
5,800,000
5,600,000
5,400,000
5,200,0001999 2000 2001 2002 2003 2004 2005 2006 2007 2008 2009
8.3
7.2
8.4 8.9
7.8
9.5 9.7
8.9 9.6
Paris Region France UE
2008 2009 2010 2011
7.0
9.7
17.3 16.1
8.9 9.0
5.9
9.6
BrusselsCapital
Region (BE)
Greater Madrid
(ES)
Paris Region
(FR)
London (UK)
Hessen (DE)
European Union average(27 countries)
Source: INSEE (French Institute of Statistics)
2008, 2009, 2010: year average; 2011: Q3Source: INSEE (French Institute of Statistics) and Eurostat
Source: Eurostat
Million jobs
(as %)
(as %)
Paris Region European Union
employed population 100.0 100.0
By age 15 - 29 18.7 20.2 30 - 49 55.4 53.0 50 and over 25.9 26.8
By socio-economic group Managers, higher professional workers 29.9 Intermediate professional workers 26.0 Non-manual workers 25.3 Manual workers 13.2 Other 5.6
BReaKDown oF eMPLoyMenT in THe PaRis Region in 2010
• 30%oftheemployedpopulationweremanagersandhigher professional workers
• Morethan40%oftheworkingpopulationhadahighereducation qualification
Sources: INSEE (French Institute of Statistics) and Eurostat
(as %)

Household income in european Union regions in 2008
Aero
pole
(95)
©Sé
bast
ien
Le C
lézio
- Da
tago
ra -
Hubs
tart
Paris
11
Employment
•Ahighlyactivepopulation•Ahighproportionofexecutivesandmanagers
P a r i s R e g i o n
London2 (UK) 30,197
Paris Region (FR) 30,084
Vlaams-Brabant Province (BE) 29,652
Oberbayern (DE) 28,906
Hovedstaden(DA) 28,635 Source: Eurostat
1Net primary income balance2Inner + Outer London
Top eU regions in terms of household income in 20081
Average annual gross
salary (E)
Change 2008/2007
(as %)Managers, higher professional workers 70,198 2.0Intermediate professional workers 35,749 3.0Non-manual workers 24,234 2.8Manual workers 24,941 3.7Paris Region 40,700 3.1France 32,045 3.1
Source: INSEE (French Institute of Statistics)
average annual gross salary in the Paris Region in 2008
•TheaverageannualgrosssalaryisE40,700.
(in euros per capita)

12
Research and Development
THe PaRis Region: eURoPean LeaDeR in R&D
• Europe’sn°1regionintermsofR&Dcapabilityandexpenditure in 2009:
- 143,700 people working in research, including 91,600 researchers
º Public: 56,600 jobs from which 60% of researchers º Private: 87,100 jobs from which 66% of researchers - p16.9b of R&D expenditure, broken down into p11b
for private research and p5.9b in public research
• 4,900 French patents filed within the Paris Region in 2010
• TheleadingregionintheamountofEuropeanpatentsfiled (2008 rankings), and more particularly so in three major fields: Pharmaceuticals/Biotechnology (11% of European patents were filed by the Paris Region), Electronics/Electricity (8%) and Instrumentation (6%)
Top eU regions in terms of total R&D personnelin 2009 (full-time employment)
Paris Region (FR)
Oberbayern(DE)
Stuttgart(DE)
GreaterMadrid (ES)
Rhône-Alpes(FR)
143,669
63,67956,798 54,760 54,149 46,422
London(UK)
european Research and Development expenditure by region in 2009
Paris Region (FR) 16,898Stuttgart (DE) 8,549Oberbayern (DE) 8,067Darmstadt (DE) 5,373Rhône-Alpes(FR) 5,054London (UK) 3,486
Source: Eurostat
(€ million)
Sources: Eurostat and Ministry of Higher Education and Research
Top eU regions in terms of R&Dexpenditure in 2009

13
Research and Development
Cluster name Sector Website MembersNumber
of projects financed
Total investments (€ million)
Total public sector funding
(€ million)
advancitySustainable urban development, housing and construction, mobility, eco-technologies
www.advancity.eu 247 107 230 100
asTech Business aviation, space transportation. Propulsion systems and equipment. www.pole-astech.org 200 28 144 66
cap DigitalParis Region ICT, digital content technologies en.capdigital.com/ 650 350 650 325
cosmetic valley Perfumes and cosmetics www.cosmetic-valley.com 252 73 120 25
elastopole Rubber and polymers www.elastopole.com 94 14 30 13
Finance innovationBanks and investment companies, insurance, investment management, services to the finance sector
www.finance-innovation.org 244 28 26 11
Medicen Innovative therapies and advanced technologies in healthcare www.medicen.org 200 163 372 176
Mov’eo Automotive sector, public transport, road safety and environment www.pole-moveo.org 315 128 485 214
systematic Paris Region Systems and ICT www.systematic-paris-region.org 601 317 1,400 520
ToTaL 2,803 1,208 3,457 1,450
Sources : Advancity, ASTech, Cap Digital, Cosmetic Valley, Elastopole, Finance innovation, Medicen, Mov’eo, Systematic
•Europe’sno.1regionforR&Dexpenditure•Europe’sno.1regionforR&Dpersonnel
(full-timeequivalent)
P a r i s R e g i o n
9 coMPeTiTiveness cLUsTeRs enHancing innovaTion
9 competitiveness clusters bringing together business, research centres and training institutions to unlock synergies and stimulate the emergence of collaborative and, above all, innovative projects in the face of increased global competition
Paris Region competitiveness clusters in 2011
© P
SA P
euge
ot C
itroe
n - P
atric
k Le
gros
Incu
bate
ur d
’ent
repr
ises
Past
eur B
ioto
p (7
5)
© A
RD -
Deni
s Bo
urge
s - T
enda
nce
Flou
e

The Paris Region network of Chambers of Commerce and Industry (CCIs)
The Paris Region network of Chambers of Commerce and Industry includes five state-supervised organisations coordinated by 252 business leaders who work for them on a voluntary basis, serving the region’s 593,000 businesses and their employees. The network has a total of 5,150 employees, 55% of them involved in training.
The CCIs’ products and services offer meets the needs of businesses at all the key stages of their development:
The key missions of the Chambers of Commerce and Industry (CCIs): ■ Supporting businesses as they grow
The missions of the Paris - Ile-de-France Regional Chamber of Commerce and Industry (CRCI) are:– to represent the CCIs’ position on regional policies concerning businesses and training;– to coordinate the network of four CCIs.
■ innovation: from awareness-raising to supporting the conversion of research into innovative products.Industrial property, connecting businesses and finance providers, research centres, educational institutions, consultancies, etc. The CCIs are members of the Enterprise Europe Network, a network supporting the innovations of European SMEs, with a presence across more than 40 countries.
■ market intelligence: information serving growth. The CCIs provide companies with qualified data on both French and international markets, constituting a hub of vital strategic information covering a range of areas: technology, competition, regulatory/legal issues, standards and socio-economic trends. ➜ Providing key market intelligence to more than 500 SMEs* and staging more than 30 information events and workshops every year.
■ sustainable development: from information and updates on new regulations to environmental diagnoses.➜ More than 2,000 SMEs attend information events on the environment and sustainable development, while more than 1,200 companies are involved in networks coordinated by the CCIs (eco-business, environment/sustainable development managers).
■ international growth: providing information, facilitating contacts - by country or by sector.The website www.iledefrance-international.fr is a key strategic resource offering Paris Region businesses the practical information they need to expand into international markets. ➜ Launched in December 2009, this web portal helps business managers to: • find the answers to their questions simply and easily;• identify contacts;• access many useful links to our partners’ websites: CCI,
Ubifrance, UCCIFE, Coface, Oséo, INPI, CCEF, Customs, etc.
■ funding requirements: from raising awareness of capital requirements to coordinating contacts with private investors.Every year the CCIs stage conferences and workshops that raise awareness of public and private funding requirements. In recent years, business conferences (Techninnov, Finance Innov) and lunches with venture capitalists (ConnectVC) have been organised to put businesses in the seed, venture capital or development stage in touch with targeted private investors (Business Angels, funds and venture capital firms). CCI advisers assist entrepreneurs in their efforts to secure investment, providing them with advice at all stages of their development.
*The reference year for all figures cited is 2009

The Paris Region network of Chambers of Commerce and Industry (CCIs)
CCI colleges and institutions offer 200 training courses covering all market sectors, including foundation level, in-service and apprenticeship training, from vocational qualifications (CAP – the Certificat d’Aptitude Professionnelle) through to doctorate level:
The CCIs actively encourage companies to locate to the region and promote their dynamism and international expansion by voicing their needs to both the regional and national authorities with regard to:
■ foundation courses, developed to meet the needs of businesses: 14,000 students, 15,000 apprentices and pre-apprentices trained in CCI institutions in Paris Region and internationally.
■ in-service training tailored to companies’ skills development needs, delivered to more than 46,000 course participants.
■ the development of transport infrastructure improving accessibility for businesses and their employees;
■ regional planning applying the principle of mixed-use development, combining housing, employment and services in effectively interconnected economic hubs which can drive regional development.
■ Training young people and company employees
■ Making the region more attractive
For more information and a solution tailored to your specific needs, contact your relevant Chamber of Commerce and Industry:
• Chambre régionale de commerce et d’industrie Paris - Ile-de-France: www.paris-iledefrance.cci.fr
• Chambre de commerce et d’industrie de l’Essonne: www.essonne.cci.fr
• Chambre de commerce et d’industrie de Paris: www.ccip.fr
• Chambre de Commerce et d’industrie Seine-et-Marne: www.seineetmarne.cci.fr
• Chambre de commerce et d’industrie de Versailles Val-d’Oise / Yvelines: www.versailles.cci.fr

16
Economic environment eURoPe’s weaLTHiesT Region
•GDP:p552,100 million in 2009 (p558,300 in 2008)
•No.1EUregionforGDPinvalue:4.7%oftheEUtotaland 29.5% of French national GDP in 2009
•GDPpercapita:p47,000 in 2009
•822,000companiesand936,300businessesin2010
gDP of european Union regions per inhabitant in 2008
Top eU regions in terms of gDP in value in 2008
Paris Region (FR)
London1 (UK)
Lombardy (IT)
Catalonia (ES)
Greater Madrid
(ES)
Rhône-Alpes (FR)
202,823193,172 187,324
558,330
387,445
328,222
Oberbayern (DE)
182,535
Source: Eurostat1Inner + Outer London
(€ million)
ADP
Le D
ôme
© S
ébas
tien
Le C
lézio
- Da
tago
ra -
Hubs
tart
Paris
Lieu
du
desig
n - P
aris
© G
eron
imo
17
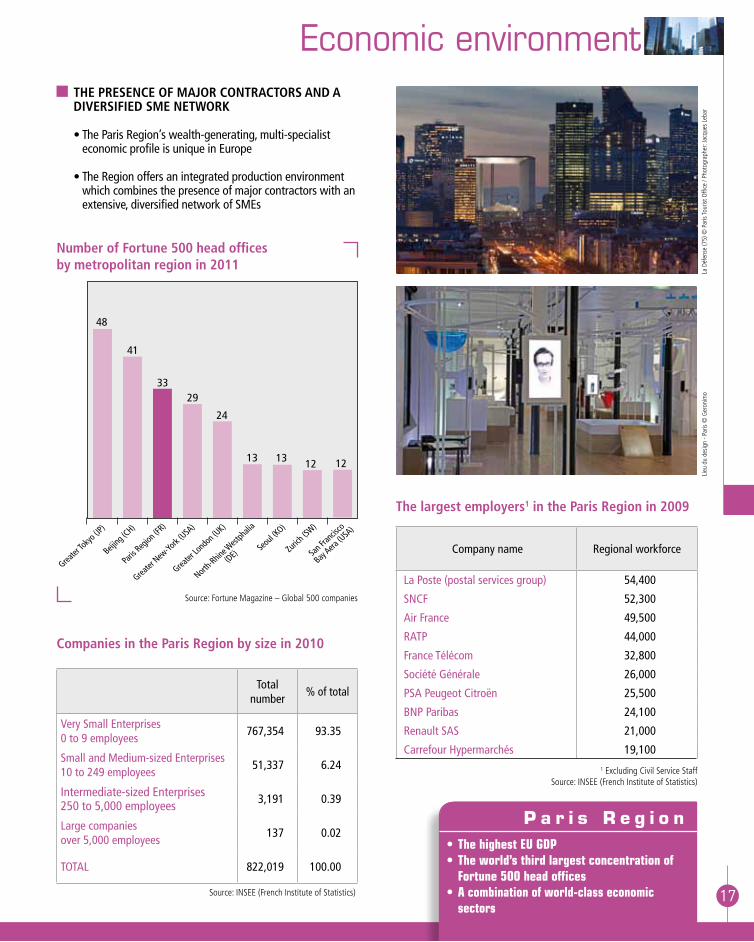
Economic environment THe PResence oF MaJoR conTRacToRs anD a DiveRsiFieD sMe neTwoRK
•TheParisRegion’swealth-generating,multi-specialisteconomic profile is unique in Europe
•TheRegionoffersanintegratedproductionenvironmentwhich combines the presence of major contractors with an extensive, diversified network of SMEs
companies in the Paris Region by size in 2010
The largest employers1 in the Paris Region in 2009
number of Fortune 500 head offices by metropolitan region in 2011
Greater
Tokyo
(JP)
Paris R
egion
(FR)
Greater
New-Yo
rk (USA
)
Greater
Lond
on (U
K)
Beijing
(CH)
North-R
hine W
estph
alia
(DE)Seo
ul (KO
)
Zurich
(SW)
41
3329
24
13 13
San Fr
ancis
co
Bay Aera
(USA
)
48
12 12
Source: Fortune Magazine – Global 500 companies
Totalnumber
% of total
Very Small Enterprises0 to 9 employees
767,354 93.35
Small and Medium-sized Enterprises 10 to 249 employees
51,337 6.24
Intermediate-sized Enterprises250 to 5,000 employees 3,191 0.39
Large companiesover 5,000 employees
137 0.02
TOTAL 822,019 100.00
Source: INSEE (French Institute of Statistics)
•ThehighestEUGDP•Theworld’sthirdlargestconcentrationof
Fortune500headoffices•Acombinationofworld-classeconomic
sectors
P a r i s R e g i o n
La D
éfen
se (7
5) ©
Par
is To
urist
Offi
ce /
Phot
ogra
pher
: Jac
ques
Leb
ar
Company name Regional workforce
La Poste (postal services group) 54,400
SNCF 52,300
Air France 49,500
RATP 44,000
France Télécom 32,800
Société Générale 26,000
PSA Peugeot Citroën 25,500
BNP Paribas 24,100
Renault SAS 21,000
CarrefourHypermarchés 19,1001 Excluding Civil Service Staff
Source: INSEE (French Institute of Statistics)

18
Economic environment
a DiveRsiFieD seRvices-BaseD econoMy
• Grossvalueaddedbysectorin2009:services87%,industry 12%, farming and food processing 1%
• ParisRegionkeysectorsofexcellenceandleaders - Aeronautics – Space – Defence: Dassault Aviation,
EADS, Safran - Automotive: PSA Peugeot Citroën, Renault - B2B Services: Accenture, Gide Loyrette - Corporate Meetings and Events: Reed Midem, Viparis - Eco-business, Energy: GDF SUEZ, Veolia, Total - Farming and Food: Danone, Nestlé, Pernod Ricard-Fashion,DesignandLuxury:Hermès,LVMH,L’Oréal,
Christian Dior, PPR - Finance: BNP Paribas, Crédit Agricole, Société Générale - Information and Communication Technology:
Alcatel-Lucent, Apple, Google, Microsoft, Orange, Thales, Vivendi
- Life Sciences: GlaxoSmithKline, Guerbet, Sanofi-Aventis - Logistics: FedEx, Geodis - Tourism: Accor, Disneyland® Paris
• TheSocialEconomyisacrucialsectorintheParisRegion
Paris Region specialisation index compared with France as a whole in 2010
value added by main economic sectors in 2009
€ million % of total
agriculture and foodprocessing 3,319 0.7
industry 60,568 12.2 Construction 19,775 4.0 Consumer goods 12,756 2.6 Capital goods 9,079 1.8 Energy 8,876 1.8 Intermediate goods 6,981 1.4 Automotive industry 3,101 0.6
services 434,231 87.1 B2B services 121,744 24.4 Finance and real estate 117,183 23.5 Education, healthcare, social welfare, civil service
81,817 16.4
Wholesaling / retailing 45,975 9.2 Business-to-Consumer services 41,867 8.4 Transport 25,645 5.2ToTaL 498,118 100.0
Source: Pôle emploi (French Job Centre)Note: The following diagram shows the sectors in which the Paris Region has a
specialisation index above 1. A specialisation index over 1 indicates a higher degree of specialisation in the Paris Region than in France as a whole.
Information and
communications
Finance Real estate Hotels and
restaurants
Other service activities
2.3
Science andtechnology
services;administrativeand support
services
1.7
1.4 1.3
1.21.1
Snec
ma,
Saf
ran
Gro
up -
Villa
roch
e (7
7) ©
ARD
Thie
rry A
rdou
in -
Tend
ance
Flo
ue

Economic environment
19
Main international trading partners in 2010
FDi in the Paris Region: the main countries of origin in 2010
Exports Imports
Value (€ million)
% Value (€ million)
%
Germany 7,061 10.5 Germany 18,531 15.6
USA 6,511 9.6 China 15,854 13.3
Italy 5,359 7.9 Belgium 12,527 10.5
United Kingdom 4,816 7.1 USA 8,608 7.2
Spain 4,104 6.1 Spain 8,066 6.8
Belgium 3,825 5.7 Italy 7,091 6.0
Switzerland 3,143 4.7United Kingdom
5,638 4.7
China 2,034 3.0 Netherlands 3,931 3.3
Netherlands 1,748 2.6 Japan 3,419 2.9
Hong-Kong 1,456 2.2 Switzerland 2,658 2.2
Source: Direction Interrégionale des Douanes d’Ile-de-France (Paris Region customs department).
Countries of origin
Jobs FDI
Number % of total Number % of total
USA 2,441 29.0 60 24.7
Ireland 1,350 16.0 3 1.2
Japan 863 10.3 12 4.9
United Kingdom 558 6.6 26 10.7
Germany 405 4.8 20 8.2
Spain 356 4.2 12 4.9
China 326 3.9 22 9.1
Sweden 317 3.8 11 4.5
India 310 3.7 5 2.1
Netherlands 267 3.2 6 2.5
Other 1,222 14.5 66 27.1
ToTaL 8,415 100.0 243 100.0
Sources: Invest in France Agency and PREDA
sUBsTanTiaL coMMeRciaL LinKs wiTH eURoPe anD oTHeR econoMic aReas (2010 DaTa).
• Exports:p67.6b / Imports: p119.1b
• Mainproductsexported:automotivemanufacturingproducts (11%), pharmaceutical products (9%) and aerospace industry products (8%)
• Mainproductsimported:automotivemanufacturingproducts (12%) and natural hydrocarbons (9%)
• Foreigntradepartners: - On a regional basis, the European Union is the Paris
Region’s 1st trading partner with 49% of total exports and 59% of total imports
- On a nation-by-nation basis, the Paris Region’s foremost customer and supplier is Germany with 11% of total exports and 16% of total imports
eURoPe’s n°2 Region in TeRMs oF FoReign DiRecT invesTMenTs (FDi) in 2010
•The 16,700 subsidiaries of international groups account for 14% of total employment in the region
•Over 240 foreign companies getting established in 2010
•8,400 jobs created by international investments in 2010
•Mainexportproducts:automotivemanufacturingproducts,pharmaceuticalproducts,aerospaceindustryproducts
•Europe’sn°2regionforthenumberofFDIsattracted
P a r i s R e g i o n
Micr
osof
t - Is
sy-le
s-M
oulin
eaux
(92)
©
ARD
Gill
es C
oulo
n - T
enda
nce
Flou
e

Corporate events and tourism
20
eURoPe’s n°1 DesTinaTion FoR MeeTings anD eXHiBiTions inDUsTRy in 2010
• ThelargestexhibitioncapacityinEurope:over680,000m²
• 395tradeshows,189opentothegeneralpublic
• 97,000exhibitingcompanies,28%ofwhichwereinternational
• 10millionvisitorsgenerating€4.1b for the local economy
• InternationalparticipationinParisRegiontradeshows:
- Professional tradeshows: 25% of visitors
- 70% of international visitors come from Europe (50% from bordering countries of France and 20% from other European countries), 15% from Asia and 8% from America
conference and exhibition centres in the Paris Region in 2011
Paris Nord Villepinte
Palais des congrès de Paris
Paris Nord Villepinte
Paris Le Bourget
CNIT La Défense
Palais des congrès de Paris
Cité des sciences et de l'industrie
Maison de la Chimie
Les EsselièresVillejuif
Exhibition centre
Seating capacity Gross exhibition area
fewer than 1,500 places less than 50,000 m2
between 50,000 and 100,000 m2
over 100,000 m2
between 1,500 and 3,000 places
over 3,000 places
Conference centre
La grande halle de la Villette
Palais des Arts et des CongrèsIssy-les-Moulineaux
S
C
Issy l
Source: IDF médi@© IAU îdF
10 km 0
Professional meetings and events in Paris Region in 2011
Disney Convention Centres
Top international tradeshows (with over 80,000 visitors) in 2010 (in thousands)
Mondia
l de l
’Automob
ile
Intern
ation
al Agri
cultu
ral Sh
ow
Paris
Trad
e Fair
Interc
lima +
Elec
Home &
Buildin
g
The N
autic
Show
Maison
& O
bjet P
aris
SIAL T
he G
lobal
Food
Mark
etplac
e
Paris
Air Sho
w Le Bou
rget*
1,263
639 609
308227
184
Batimat*
160
Premièr
e Clas
se, W
ho’s N
ext
141 92 81
Parc
des
exp
ositi
ons
du B
ourg
et -
Sein
e-Sa
int-D
enis
(93)
©
ARD
Pas
cal A
imar
- Te
ndan
ce F
loue
Source: CCIP - *2009

overnight hotel stays in the european Union in 2010*
Corporate events and tourism
21
•Europe’sleadingcorporateeventsandtourismdestination
•66millionhotelovernightstays•10milliontradeshowvisitorswelcomed
everyyear
P a r i s R e g i o n
ToURisM is one oF THe Region’s LeaDing econoMic secToRs in 2010
• Theworld’sn°1touristdestination:31.7millionhotelarrivals
• Touristspending:€11b
• 505,000jobsinthetourismsectorand71,000tourismbusinesses
THe woRLD’s LeaDing Region in TeRMs oF HoTeL caPaciTy
• 2,400hotelsand148,000rooms,i.e.13%and25%ofthe French national offer
• Theworld’sn°1regionintermsofovernightstays: 65.8 million with foreign visitors accounting for 51%
• Themeetingsandexhibitionsindustryrepresented46%of hotel nights
Paris Region (FR) 65,800,000Canary Islands (ES) 50,000,000Balearic Islands (ES) 48,400,000London (UK) 45,500,000Catalonia (ES) 45,300,000
Source: Eurostat
The most visited attractions in the Paris Region in 2010
VisitorsDisneyland® Paris 15,000,000Notre-Dame de Paris (1) 13,650,000Sacré-Cœur de Montmartre (1) 10,500,000Louvre Museum 8,346,000Eiffel Tower 6,700,000Palace and Park of Versailles 6,087,600
(number of nights)
a woRLD-RenowneD HisToRicaL HeRiTage
•3,800historicalmonuments,including4UnescoWorldHeritageSites:thePalaceandParkofVersailles,thebanks of the Seine in Paris, the Palace and Park of Fontainebleau, and the town of Provins
•250museumsandexhibitionvenuesand4nationaltheatres including La Comédie Française and 3 opera houses (Opéra Garnier, Opéra Bastille and Opéra Comique), as well as 1,000 cinemas
•3ofEurope’smostvisitedmuseums:LouvreMuseum,Centre Pompidou and Orsay Museum
Top eU regions in terms of overnight hotel stays in 2010
(1) estimatedSource: Paris Ile-de-France Tourist Board
Basin
of S
atur
ne -
Park
of V
ersa
illes (
78) ©
Em
man
uel B
lum
, IAU
îdF

Nou
veau
x m
oyen
s de
tran
spor
t (75
) ©
Par
is To
urist
Offi
ce -
Phot
ogra
pher
Am
élie
Dup
ont
Tram
way
(75)
© P
aris
Tour
ist O
ffice
- Ph
otog
raph
er M
arc
Bertr
and
22
Transport
Transports projects in the Paris Region
^
^
^
^
^
VERSAILLESCHANTIERS
NANTERREUNIVERSITÉ EVANGILE
POMPADOUR
St-Cyr
Massy-Palaiseau
Epinay-sur-Orge
Saclay
Sénart
St-Quentin-en-Yvelines
Saint-Germain-en-Laye
St-Rémy-Les-Chevreuse
Villeneuve-St-Georges
SartrouvilleArgenteuil
Epinay-Villetaneuse
Sevran-Livry
Noisy-Champs
Chelles-Gournay
Champigny-le-Plant
Villejuif IGR
Aéroport d'Orly
Saint-Cloud
Saint-Denis- Pleyel
Brétigny
Evry-Courcouronnes Lieusaint-Moissy
Val-de-Fontenay
Parc-desExpositions
Villiers-Le-Bel
Pierrefitte-Stains
AéroportCDG
Achères-Ville
Dourdan
Melun
Sevran-Beaudottes
Le Vert-deMaisons
LesArdoines
IssyBFM
Clamart
Rueil-Malmaison
Clichy-Montfermeil
Boulogne-Pont de Sèvres
JUVISY-SUR-ORGE
Le Bourget
La Défense
Noisy-le-GrandMont d'Est
© IAU îdF 2011
5 km0
Sources : MOS 2008, IAU-îdF - STIF - CRIF - Atlas cartographique, Schéma d'ensemble, SGP
Multimodal hub
Projects in the Marshalling Plan and the Special Department/Region Contract (CPRD)
Reserved lanes for public transport
RER modernisationRailway project and tram/train
Metro extensionTramway
Existing network
MetroTramwayReserved lanes for public transport
RER and Transilien network
Greater Paris Express Project
Other orbital automated metro project/ station
^ Station maintained as a safeguard
Greater Paris transport network / station
Transport projects in the Paris Region
a cLean, MULTiMoDaL inTRa-RegionaL TRansPoRT neTwoRK
•Railnetwork: - 1,830 km in regional railway lines, 390 stations and
5,700 trains daily, with 170,000 km of track travelled in 2010
- Amount of train journeys made daily: 2.5 million
•14Métrolines–3.8millionjourneysmadedaily
•3lightraillines–280,000journeysmadedaily
•351busroutes–3millionjourneysmadedaily
•2,100kmofcyclelanes
•23,600 Velib self-service bicycles available from 1,750 pick-up points
•A public service providing self-serve electric cars, called “Autolib”: 250 vehicles and 250 rental stations installed since December 2011
•ParisisthesecondBestCityinEuropeintermsofinternaltransport according to Cushman & Wakefield’s European Cities Monitor (2011)
•Share of public transport in commuting: 29% in 2008
The Greater Paris Express network: It represents 175 km of railway calling at 72 stations, linking major economic hubs and international airports, facilitating direct travel from suburb to suburb and considerably reducing travel time. The project is part of an overall transport rallying scheme.

within 2 hours of Paris
330 million consumers
Mer de Norvège
Mer
Noire
Mediterranean Sea
Atlantic Ocean
North Sea
Carte d'Europe05/09/2011
3h501h201h20
0h55
3h181h15
1h40
1h50
1h35
1h30
1h30
2h001h40
2h05
2h151h20
3h051h10
3h051h20
Dublin
Brussels
London
Madrid
Geneva
Frankfurt
Riga
Lisbon
Copenhagen
Bratislava
Ljubljana
Budapest
Sofia
Bucarest
Milano
Barcelona
Marseille
Roma
ISLANDE
Algiers Tunis
AmsterdamWarsaw
Athènes
Berlin
Vienna
Vilnius
Prague
OsloStockholm
Helsinki
MunichParis RegionParis Region
N
0 300 miles
Moscow ................... 3 h 30Tel Aviv .................... 4 h 25New York ................. 8 hShanghai ............... 10 h 50San Francisco........ 11 h 25Tokyo...................... 11 h 25Sao Paulo............... 11 h 45
Aéro
port
Paris
Cha
rles-
de-G
aulle
(95)
© E
mile
Lui
der -
La
Com
pany
pou
r Aér
opor
ts d
e Pa
ris
Transport
a MaJoR eURoPean RoaD neTwoRK
• 1st motorway hub in Europe, with 600 km of motorways
• 10,000 km of roads
eURoPe’s 2nd LaRgesT inLanD PoRT
• 70harboursand500kmofwaterwaysin2011
• 10multimodalplatforms(rail/road/river)
• Nearly7,680kmofnavigablewaterwaysandcanals
• Fluvialandmaritimefreight:21milliontonnesin2010
• Seine-NordEuropeCanalscheduledtoopenin2016
a PioneeR in THe eURoPean HigH-sPeeD neTwoRK
•ConnectionsbetweenairportplatformsandtheTGV(high-speed trains): 58 cities linked daily
• 17.5millionpassengerstravelledtoEuropeandestinations by TGV from the Paris Region in 2010
eURoPe’s 2nd RanKing aiRPoRT sysTeM
• Paris-CharlesdeGaulle/Paris-Orlyinternationalairports:ranked respectively 2nd and 11th in Europe in terms of passenger traffic. Paris-Le Bourget Airport is Europe’s n°1businessairport
• 88.1millionpassengersen2011: - Paris-Charles de Gaulle: 61 million passengers - Paris-Orly: 27.1 million passengers
• Aircargoandpost:2.5milliontonnesin2010
Source: PREDA
The Paris Region connected to the world
23
•Adenseandintegratedfreightandtransportnetwork
•Ahigh-speedraillinkconnectingtoEurope’smajorcities
P a r i s R e g i o n

24
Real estate eURoPe’s LeaDing coMMeRciaL ReaL esTaTe
• 50millionm2 (539 million sq.ft) office space
• 30millionm2 (323 million sq.ft) in business space
• 29millionm2 (312 million sq.ft) in warehouse space
• 3.6millionm2 (38 million sq.ft) in available office space
PaRis Region ReaL esTaTe veRy aTTRacTive in 2011
• Europe’sno 2 real estate investment market with E11.2 b invested
• Officeordersplaced:
- 2.4 million m² (26.3 million sq. ft) in the Paris Region
- 2 million m² (21.2 million sq. ft) in Central Paris
LogisTics: PaRis Region, a eURoPean LogisTics cenTRe
• Warehousespaceofferforlogisticsactivities: 29 million m² (312 million sq. ft) in 2011, with over 1.2 million m² (13 million sq. ft) currently available
• Warehousespaceordersplacedin2011:1.02millionm²(10.9 million sq. ft)
• Extremelycompetitiverents:primerentsin2010,excluding tax and building charges: Paris Region, under E53perm²peryear,HamburgE63, Brussels E68, Madrid E72, Amsterdam E92, London E155
office take-up: european comparisons in 2010 and 2011
Source: Immostat(1)1m2 = 10.8 sq.ft
million m2 (1)
Central Paris(FR)
Central London (UK)
Munich(DE)
Frankfurt (DE)
Berlin (DE)
Brussels (BE)
Madrid (ES)
Milan (IT)
2011
2010
2.0
1.8
1.5
1.0
0.6
0.9
0.5 0.5 0.6
0.5 0.5
0.30.4
0.3 0.3 0.3
Hote
l Des
carte
s - L
es M
urea
ux (7
8) ©
Vin
cent
Gol
lain
Plat
e-fo
rme
de G
enne
villi
ers
(92)
© P
ort A
uton
ome
de P
aris

25
Real estate
•No.1inEuropeforofficespace•Adynamicregionforreal-estateinvestment•AprimeEuropeanlogisticshub
P a r i s R e g i o n
Business activity areas in 2011
Hôte
l d’e
ntre
prise
s du
Gen
opol
e (9
1) ©
Gen
opol
e, A
. da
Silva
aPPRoPRiaTe HosTing soLUTions in 2012
• 51businessincubators,including12thatareespeciallysuited to international companies
• 134businesscentres
nUMeRoUs oPPoRTUniTies insiDe BUsiness acTiviTy aReas
• 1,300businessactivityareasin2011
• 26,800hectares,includingcloseto2,300hectaresavailable

26
Quality of life
a gReen Region
• 80% of the total regional area is composed of nature areas dedicated mostly to agriculture and forest
• 23%oftheregioniscoveredbyforest,i.e.279,950hectares (81,000 hectares are accessible to the public, including the 23,000-hectares Forest of Fontainebleau, listed as a Unesco biosphere reserve)
• 35siteslistedNatura2000inJanuary2012.Natura2000 is a European network of designated natural habitats singled out for the quality, rarity or vulnerability of their animal and plant species. Its aim is to safeguard biological diversity within the European Union
• 4regionalnatureparks(plus2moreunderway):1/5thofthe total regional area
Major open spaces in the Paris Region in 2011
THe onLy HeaLTH sysTeM oF iTs KinD in THe woRLD, as weLL as nUMeRoUs sPoRTs FaciLiTies
•Lifeexpectancy:79.1yearsformenand84.8yearsforwomen
•Franceranks13thworldwideintermsoflifeexpectancy
•Europe’sno.1hospitalnetwork(AssistancePublique-HôpitauxdeParis:37hospitalsand22,000beds)
•400swimmingpools,3,000sportcomplexes,3,000turfpitches (football, rugby, etc.), 400 equestrian centres, and 100 golf courses

27
Quality of life
•Agreenregion:80%oftheareaisdevotedtoopenspaces
•Aqualityoflifeacknowledgedworldwide
P a r i s R e g i o n
Percentage of days during the year 2010 when the air quality was:
an eco-ResPonsiBLe PoPULaTion
Paris Region citizens and local authorities are concerned by environmental issues:
• 4 public agencies in charge of monitoring the Region environment: - Airparif for air pollution - Bruitparif for noise pollution - Natureparif to protect biodiversity - Ordif for waste management
• A Climate Plan was adopted by the Paris Regional Council aiming at a fourfold reduction of C02 emissions by 2030
• Paris Region greenhouse gas emissions total nearly 79 million tonnes of C02 equivalent, representing 7.2 tonnes of CO2 equivalent per capita
• Greenhouse gas emissions breakdown: transport 48%, residential 19%, industry 21%, tertiary sector 12%
• Energy use: 25.3 million toe, representing 2.1 million toe per capita
• Energy use breakdown: transport 44%, residential 29%, tertiary sector 19%, industry 8%
• The Paris Region is a European leader in geothermal energy
• Ecological footprint: 5.17 global hectare per capita in 2010
Very good or good Average Poor or very poor78.9% 12.6% 8.5%
The calculation of the air quality index is based on levels of the pollutants NO2, O2 and SO2, as well as particles (PM10)
Source: Airparif
RenowneD, invenTive anD veRy TasTy gasTRonoMy
•RungisInternationalMarket:theworld’sbiggestfreshproduce market
•48%oftheareadevotedtofarming
•Organicfarming:closeto5,700hectaresand110certified or converting outfits, up 26% from 2008 to 2009
•TheFrench“gastronomicmeal”waslistedontheRepresentativeListofIntangibleCulturalHeritageofHumanitybyUnescoinlate2010
•82restaurantswithoneormoreMichelinstars
a DiveRsiFieD HoUsing oFFeR
• 5,380,000homes,73%locatedinapartmentbuildingsand 27% individual homes
• 29sustainabledistrictswithintheParisRegion,accredited by the government and/or region and characterised by: -Higher-than-averagepopulationdensity - Mixed-use development (housing, shops, businesses), - Town planning that provides extensive public transport or soft mobility - Good connections to surroundings urban centres - Eco-friendly town planning or real estate development
(green buildings, geothermal energy, rainwater harvesting, etc.)
average rental value as at 01-01-2011
ParisInner
SuburbsOuter
Suburbs
Paris Region average
Average surface area (m2) 51 53 61 54Average monthly rental (E) 1,019 808 774 883Average monthly rent (E per m2) 20.1 15.2 12.8 16.4
Paris
Pla
ge -
Bass
in d
e La
Ville
tte (7
5)
© P
aris
Tour
ist O
ffice
- Ph
otog
raph
er A
mél
ie D
upon
t
Source: Observatoire des loyers de la région parisienne (OLAP, Paris Region monitoring agency)

IGN
Scan
25/
IAU
îdF
C. L
auté
/IAU
îdF
A 200-strong multidisciplinary team with expertise covering all aspects of planning
Analysis, ideas, projectsIn organisational terms, IAU île-de-France has six main specialist divisions - sustainable planning,
urban and regional development, mobility and transport, urban and rural environment, the economy
and local development, demographics and housing - plus a number of dedicated units (documentation
centre, communication, health, urban safety, and sport).
Project management for development plans in Paris RegionIAU île-de-France works closely with the regional authorities, assisting them in drawing up
their development plans: exploring challenges and development options, promoting participatory
processes and public enquiries, and producing draft development plans.
Networks, partnerships, missions abroadIAU île-de-France is constantly adapting to a changing environment, looking to the future and pinpointing
the long-term changes expected in the region. It is actively involved in a wide range of networks
and partnerships, giving it access to additional resources and expertise. IAU île-de-France has been already
active in around 40 countries through contracts and cooperation agreements.
An information hub and communications resourceIn the framework of its public relations policy, IAU île-de-France also produces a wide range of publications,
available online at www.iau-idf.fr
IAU île-de-France has developed various databases integrated within its regional geographical information
system (RGIS) and this information is available on its website in the form of interactive maps.
IAU île-de-FranceParis Region Urban Planning & Development Agency