Disc shaped compact tension (DCT) specifications...
135
Disc Shaped Compact Tension (DCT) Specifications Development for Asphalt Pavement Andrea Schokker, Principal Investigator Department of Civil Engineering University of Minnesota Duluth JUNE 2019 Research Project Final Report 2019-24 • mndot.gov/research RESEARCH SERVICES & LIBRARY
Transcript of Disc shaped compact tension (DCT) specifications...

Disc Shaped Compact Tension (DCT) Specifications Development for Asphalt Pavement
Andrea Schokker, Principal InvestigatorDepartment of Civil EngineeringUniversity of Minnesota Duluth
JUNE 2019
Research ProjectFinal Report 2019-24
• mndot.gov/researchRESEARCH SERVICES & LIBRARY

To request this document in an alternative format, such as braille or large print, call 651-366-4718 or 1-800-657-3774 (Greater Minnesota) or email your request to [email protected]. Pleaserequest at least one week in advance.

Technical Report Documentation Page 1. Report No. 2. 3. Recipients Accession No.
MN/RC 2019-24
4. Title and Subtitle 5. Report Date
Disc shaped compact tension (DCT) specifications development for asphalt pavement
June 2019 6.
7. Author(s) 8. Performing Organization Report No.
Eshan V. Dave, Mirkat Oshone, Andrea Schokker and Chelsea E. Bennett 9. Performing Organization Name and Address 10. Project/Task/Work Unit No.
Department of Civil and Environmental Engineering University of New Hampshire 33 Academic Way, Durham NH 03824
CTS #2015015 11. Contract (C) or Grant (G) No.
(C) 99008 (wo) 162
13. Type of Report and Period Covered12. Sponsoring Organization Name and Address
Minnesota Department of Transportation Office of Research & Innovation395 John Ireland Boulevard, MS 330 St. Paul, Minnesota 55155-1899
Final Report 14. Sponsoring Agency Code
15. Supplementary Notes
http:// mndot.gov/research/reports/2019/201924.pdf 16. Abstract (Limit: 250 words)
The disc-shaped compact tension (DCT) fracture energy test has been shown to discriminate between asphalt mixtures with respect to their thermal cracking potential. This research refines the DCT fracture energy testing procedure, identifies needed adjustments in asphalt mixture to increase fracture energy, determines the suitability of DCT-test-based parameters as indicators of reflective cracking, and proposes threshold values to lower the potential for premature reflective cracking in asphalt overlays. A number of recommendations have been developed to implement outcomes of this research as well as to fill knowledge gaps identified through this study.
17. Document Analysis/Descriptors 18. Availability Statement
Fracture tests, Test procedures, Asphalt mixtures, Recommendations, Thermal degradation, Cracking, Overlays (Pavements), Improvements, Pavements
No restrictions. Document available from: National Technical Information Services, Alexandria, Virginia 22312
19. Security Class (this report) 20. Security Class (this page) 21. No. of Pages 22. Price
Unclassified Unclassified 135

DISC SHAPED COMPACT TENSION (DCT) SPECIFICATIONS DEVELOPMENT FOR ASPHALT PAVEMENT
FINAL REPORT
Prepared by:
Eshan V. Dave and Mirkat Oshone Department of Civil and Environmental Engineering University of New Hampshire
Andrea S. Schokker Department of Civil Engineering University of Minnesota Duluth
Chelsea E. Bennett Office of Materials and Road Research Minnesota Department of Transportation
June 2019
Published by:
Minnesota Department of Transportation Office of Research & Innovation 395 John Ireland Boulevard, MS 330 St. Paul, Minnesota 55155-1899
This report represents the results of research conducted by the authors and does not necessarily represent the views or policies of the Minnesota Department of Transportation, the University of Minnesota, or the University of New Hampshire. This report does not contain a standard or specified technique.
The authors, the Minnesota Department of Transportation, the University of Minnesota, or the University of New Hampshire do not endorse products or manufacturers. Trade or manufacturers’ names appear herein solely because they are considered essential to this report.

ACKNOWLEDGMENTS
This research study would not have been possible without the contribution of a number of individuals. We sincerely acknowledge significant efforts from Joe Voels and Shongtao Dai (technical lead for the project) from MnDOT Office of Materials and Road Research for their continuous input during the course of this study as well as for undertaking extensive laboratory testing campaigns. The MnDOT Bituminous Office and specifically John Garrity provided substantial support to this study. All their efforts are sincerely acknowledged. The support and feedback of the project technical advisory panel members (specifically David Van Deusen, Eddie Johnson, Eyoab Zegeye and Luke Johanneck) is very much appreciated.
We would also like thank the Minnesota DOT Research Services Section for their help in administration of this project, especially Katie Fleming (administrative liaison for the project). Finally, we would like to thank the staff at University of Minnesota’s Center for Transportation Studies (CTS) for all their help during the course of the project.
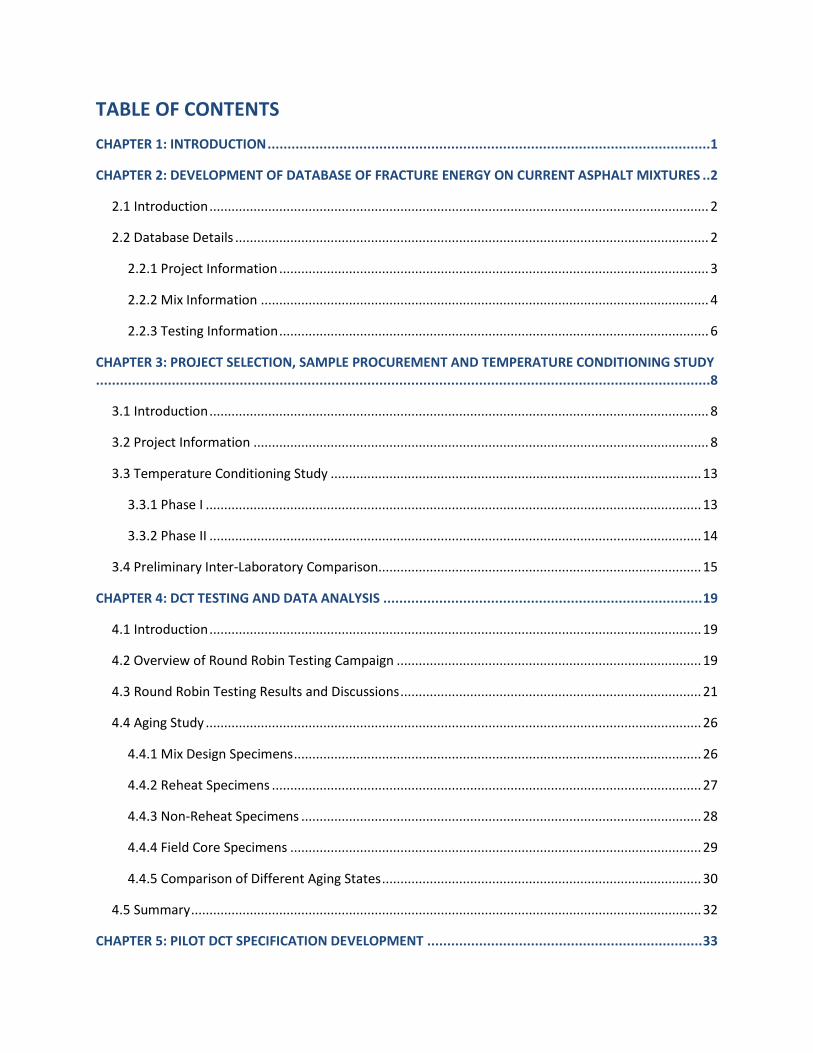
TABLE OF CONTENTS
CHAPTER 1: INTRODUCTION ...............................................................................................................1
CHAPTER 2: DEVELOPMENT OF DATABASE OF FRACTURE ENERGY ON CURRENT ASPHALT MIXTURES ..2
2.1 Introduction ........................................................................................................................................ 2
2.2 Database Details ................................................................................................................................. 2
2.2.1 Project Information ..................................................................................................................... 3
2.2.2 Mix Information .......................................................................................................................... 4
2.2.3 Testing Information ..................................................................................................................... 6
CHAPTER 3: PROJECT SELECTION, SAMPLE PROCUREMENT AND TEMPERATURE CONDITIONING STUDY..........................................................................................................................................................8
3.1 Introduction ........................................................................................................................................ 8
3.2 Project Information ............................................................................................................................ 8
3.3 Temperature Conditioning Study ..................................................................................................... 13
3.3.1 Phase I ....................................................................................................................................... 13
3.3.2 Phase II ...................................................................................................................................... 14
3.4 Preliminary Inter-Laboratory Comparison ........................................................................................ 15
CHAPTER 4: DCT TESTING AND DATA ANALYSIS ................................................................................ 19
4.1 Introduction ...................................................................................................................................... 19
4.2 Overview of Round Robin Testing Campaign ................................................................................... 19
4.3 Round Robin Testing Results and Discussions .................................................................................. 21
4.4 Aging Study ....................................................................................................................................... 26
4.4.1 Mix Design Specimens ............................................................................................................... 26
4.4.2 Reheat Specimens ..................................................................................................................... 27
4.4.3 Non-Reheat Specimens ............................................................................................................. 28
4.4.4 Field Core Specimens ................................................................................................................ 29
4.4.5 Comparison of Different Aging States ....................................................................................... 30
4.5 Summary ........................................................................................................................................... 32
CHAPTER 5: PILOT DCT SPECIFICATION DEVELOPMENT ..................................................................... 33

5.1 Introduction ...................................................................................................................................... 33
5.2 Statistical Analysis to Recommend Reproducability Limits for DCT Fracture Energy ...................... 33
5.3 Pilot DCT Specification ...................................................................................................................... 34
CHAPTER 6: EFFECT OF MIX DESIGN PARAMETERS ON LOW TEMPERATURE CRACKING PERFORMANCE........................................................................................................................................................ 36
6.1 Introduction ...................................................................................................................................... 36
6.2 Mix Parameters ................................................................................................................................ 36
6.3 Data Extent ....................................................................................................................................... 37
6.4 Data Analysis Methodology .............................................................................................................. 39
6.4.1 Explore and Remove Outliners .................................................................................................. 39
6.4.2 Determine Significance of Mix Design Variables ....................................................................... 39
6.4.3 Determine Pearson Correlation Coefficient .............................................................................. 39
6.5 Results and Discussion ...................................................................................................................... 40
6.5.1 Statistical Significance between Mix Variables and Fracture Energy ........................................ 40
6.5.2 Pearson Correlation Coefficients of Mix Design Variables and Fracture Energy ...................... 41
6.6 SUMMARY......................................................................................................................................... 45
CHAPTER 7: DETERMINATION OF SUITABLE NUMBER OF REPLICATES FOR DCT FRACTURE ENERGY TEST........................................................................................................................................................ 46
7.1 Introduction ...................................................................................................................................... 46
7.2 Terminology ...................................................................................................................................... 46
7.3 Measurement Variability .................................................................................................................. 47
7.4 Statistical Evaluation of Measurement Variability ........................................................................... 50
7.4.1 One Sample t-test ...................................................................................................................... 50
7.4.2 Two Sample t-test ..................................................................................................................... 52
7.4.3 Comparison of Mean Difference ............................................................................................... 53
7.5 Summary ........................................................................................................................................... 57
CHAPTER 8: EVALUATION OF REFLECTIVE CRACKING PERFORMANCE OF ASPHALT OVERLAYS AND ITS DEPENDENCE ON DCT FRACTURE ENERGY AND ASPHALT OVERLAY THICKNESS ................................. 58
8.1 Introduction ...................................................................................................................................... 58

8.2 Reflective Cracking Distress in Asphalt Overlays .............................................................................. 58
8.3 Pavement Sections ........................................................................................................................... 58
8.4 Reflective Cracking Performance Measures ..................................................................................... 59
8.5 Cracking Performance of Study Sections .......................................................................................... 61
8.5.1 Summary of Pavement Sections and Reflective Cracking Performance of Overlays ................ 64
8.6 Comparisons of Field Cracking Performance, Overlay Thickness and Fracture Energy ................... 64
8.6.1 Effect of Overlay Thickness on Cracking Performance .............................................................. 64
8.6.2 Effects of Fracture Energy on Cracking Performance ............................................................... 65
8.7 Summary ........................................................................................................................................... 69
CHAPTER 9: SENSITIVITY OF ASPHALT OVERLAY REFLECTIVE CRACKING PERFORMANCE TO DCT FRACTURE ENERGY USING FINITE ELEMENT SIMULATIONS ................................................................ 71
9.1 Introduction ...................................................................................................................................... 71
9.2 Pavement Reflective Cracking Finite Element Model ...................................................................... 71
9.2.1 Cohesive Zone Fracture Model ................................................................................................. 72
9.2.2 Finite Element Pavement Model ............................................................................................... 76
9.2.3 Simulation Post-Processing ....................................................................................................... 82
9.3 Pavement Sections and Simulation Scenarios .................................................................................. 85
9.3.1 Pavement Sections .................................................................................................................... 85
9.3.2 Simulated Asphalt Mix Fracture Energy Levels ......................................................................... 87
9.4 Discussions of Simulation Results ..................................................................................................... 89
9.4.1 Predicted Performances of Individual Pavement Sections ....................................................... 89
9.4.2 Determination of Recommended Fracture Energy Thresholds for Overlays ............................ 95
9.4.3 Comparisons of the Simulation based Fracture Energies Recommendations with the Field Performance based Fracture Energy Recommendations .................................................................. 96
9.5 Summary ........................................................................................................................................... 97
CHAPTER 10: PROJECT SUMMARY, CONCLUSIONS AND RECOMMENDATIONS FOR FUTURE RESEARCH........................................................................................................................................................ 99
REFERENCES .................................................................................................................................. 102

APPENDIX A: RESULTS OF DCT TESTING OF ROUND ROBIN SPECIMENS AT THE UNIVERSITY OF NEW HAMPSHIRE .......................................................................................................................................1
APPENDIX B: DCT PILOT SPECIAL PROVISION ......................................................................................1

LIST OF FIGURES
Figure 2-1 DCT Result Database Screenshot including column headings and input information of tested specimens ..................................................................................................................................................... 2
Figure 2-2 DCT Result Database Screenshot including column headings and input information of tested specimens ..................................................................................................................................................... 2
Figure 2-3 DCT Result Database Screenshot including column headings and input information of tested specimens ..................................................................................................................................................... 3
Figure 2-4 DCT Result Database Screenshot including column headings and input information of tested specimens ..................................................................................................................................................... 3
Figure 2-5 DCT Result Database Screenshot including column headings and input information of tested specimens ..................................................................................................................................................... 3
Figure 3-1 Project Locations ....................................................................................................................... 12
Figure 3-2 Phase II DCT Results for All 3 Temperature Conditioning Scenarios ......................................... 15
Figure 3-3 Preliminary Inter-Laboratory Testing Results ............................................................................ 18
Figure 4-1 MnDOT Approved Validator and Validator Loaded in DCT Testing Chamber ........................... 20
Figure 4-2 Round Robin Results for All Projects ......................................................................................... 22
Figure 4-3 Round Robin Results: Projects with PG XX-34 Binder................................................................ 22
Figure 4-4 Round Robin Results: Projects with PG XX-28 Binder................................................................ 23
Figure 4-5 Peak Loads from Round Robin Results of All Labs ..................................................................... 25
Figure 4-6 Typical Notch Fabrication by Braun Intertec (left) and AET (right) ........................................... 26
Figure 4-7 Aging Study Mix Design Specimen Average Fracture Energy Results ........................................ 27
Figure 4-8 Aging Study Reheat Specimen Average Fracture Energy Results .............................................. 28
Figure 4-9 Aging Study Non-Reheat Specimen Average Fracture Energy Results ...................................... 29
Figure 4-10 Aging Study Field Core Specimen Average Fracture Energy Results ....................................... 30
Figure 4-11 Aging Study Fracture Energy Comparisons for Mix Design, Non-reheat, and Reheat Specimens ................................................................................................................................................... 31
Figure 5-1 Average Fracture Energy from Projects with XX-34 Binder with 450 J/m2 shown as dashed line .................................................................................................................................................................... 35
Figure 6-1 Frequency Distribution Plot for Distribution of Fracture Energies in Database ........................ 38
Figure 6-2 Pearson Correlation Coefficient between Mix Variables and Fracture Energy ......................... 42

Figure 7-1 Different Pail Combinations Representing 4, 8 and 12 Replicate Scenarios ............................. 47
Figure 7-2 Percent Differences between High & Low Average Fracture Energy ........................................ 48
Figure 7-3 Percent Difference between Overall Fracture Energy & High/Low Fracture ............................ 49
Figure 7-4 Percent Differences between Overall Coefficient of Variation and High or Low Coefficient of Variation for Fracture Energies ................................................................................................................... 50
Figure 7-5 One Sample t-test Result ........................................................................................................... 52
Figure 8-1 Field Transverse Cracking Performance Data for TH 2 Pavement Section ................................ 60
Figure 8-2 (a) Average Total Transverse Cracking Rate (b) Average Total Transverse Cracking Rate Normalized with Pavement Thickness ........................................................................................................ 62
Figure 8-3 (a) Maximum Transverse Cracking Rate (b) Maximum Transverse Cracking Rate Normalized with Pavement Thickness ........................................................................................................................... 63
Figure 8-4 (a) Total Transverse Cracking Performance Index (TCTotal) (b) TCTotal Normalized with Pavement Thickness.................................................................................................................................... 64
Figure 8-5 Comparison between Overlay Thickness and Maximum Transverse Cracking Rate ................. 65
Figure 8-6 Comparison between Overlay Thickness and Average Transverse Cracking Rate .................... 65
Figure 8-7 Comparison between DCT Fracture Energy and Maximum Transverse Cracking Rate ............. 66
Figure 8-8 Comparison between DCT Fracture Energy and Average Transverse Cracking Rate ................ 67
Figure 8-9 Comparison between DCT Fracture Energy and Transverse Cracking Performance Index (TCTotal) ...................................................................................................................................................... 67
Figure 8-10 Comparison between Total Fracture Resistance of Overlay (Product of DCT Fracture Energy of the Mix and Overlay Thickness) and Transverse Cracking Performance Index (TCTotal) ...................... 69
Figure 9-1 (a) Typical Crack in Asphalt Pavement (b) CZM Concept (displaying the fracture behavior near crack tip) and (c) Schematic Illustration of CZ (material strength (σc), critical displacement (δcr), normal displacement jump (δn) and correspondent traction (tn) along a cohesive surface) .................................. 74
Figure 9-2 Bilinear Cohesive Law (presented in terms of non-dimensional effective displacement and non-dimensional effective traction) ........................................................................................................... 76
Figure 9-3 Finite Element Model Schematics, Finite Element Mesh and Attributes .................................. 78
Figure 9-4 EICM Prediction of Pavement Temperatures ............................................................................ 81
Figure 9-5 Schematic Showing a Beam in 3-point Bending Configuration with Regions of Cracking and Softening ..................................................................................................................................................... 83
Figure 9-6 Opening Displacement along CZ Elements for the Beam Example and Use of Opening Displacement to Determine Extent of Cracking and Damage (Softening).................................................. 84

Figure 9-7 Impact of Equivalent Overlay Fracture Energy on Extent of Damaged and Cracked Overlay Thickness for Trunk Highway 15 Pavement Section ................................................................................... 90
Figure 9-8 Effects of Fracture Energies of Individual Lifts on Overlay Thickness Damage and Cracking for Trunk Highway 15 Pavement Section (plot shows performance of each lift when fracture energy of other lift is held constant) .................................................................................................................................... 91
Figure 9-9 Impact of Equivalent Overlay Fracture Energy on Extent of Damaged and Cracked Overlay Thickness for Trunk Highway 14 Pavement Section ................................................................................... 92
Figure 9-10 Effects of Fracture Energies of Individual Lifts on Overlay Thickness Damage and Cracking for Trunk Highway 14 Pavement Section (plot shows performance of each lift when fracture energy of other lift is held constant) .................................................................................................................................... 92
Figure 9-11 Impact of Equivalent Overlay Fracture Energy on Extent of Damaged and Cracked Overlay Thickness for Interstate 90 Pavement Section ........................................................................................... 93
Figure 9-12 Impact of Equivalent Overlay Fracture Energy on Extent of Damaged and Cracked Overlay Thickness for Trunk Highway 280 Pavement Section ................................................................................. 94
Figure 9-13 Effects of Equivalent Fracture Energies of Lifts 2 and 3 on Overlay Thickness Damage and Cracking for Trunk Highway 280 Pavement Section (plot shows combined performance of lifts 2 and 3 when fracture energy of UTBWC is held constant at 500 and 650 J/m2) ................................................... 94
Figure 9-14 Impact of Equivalent Overlay Fracture Energy on Extent of Damaged and Cracked Overlay Thickness for Interstate 94 Pavement Section ........................................................................................... 95
Figure 9-15 Effects of Fracture Energies of Individual Lifts on Overlay Thickness Damage and Cracking for Interstate 94 Pavement Section (plot shows performance of each lift when fracture energy of other lift is held constant) ............................................................................................................................................. 95

LIST OF TABLES
Table 3.1 Inter-Laboratory Comparison Project information ....................................................................... 9
Table 3.2 Fracture Energy Discrepancy Project Information ...................................................................... 10
Table 3.3 Fracture Energy Discrepancy Project Information ...................................................................... 11
Table 3.4 Phase I temperature conditioning scenarios .............................................................................. 14
Table 3.5 Preliminary Inter-Laboratory Testing Matrix .............................................................................. 17
Table 4.1 Round Robin Project Information ............................................................................................... 21
Table 4.2 Specimens Excluded from Analysis ............................................................................................. 24
Table 4.3 Average Percent Difference between Reheated and Non-reheated Specimens ........................ 32
Table 5.1 Reproducibility Limits with all Specimens Surviving Test ........................................................... 34
Table 6.1 Mix Parameters in MDR and TSS ................................................................................................. 37
Table 6.2 Overview of Mix Design Variables Used for the Study................................................................ 38
Table 6.3 Statistical Significance (p-values) between Mix Design Variables and Thermal Cracking Performance Parameter, Fracture Energy .................................................................................................. 41
Table 6.4 Significance of Pearson Correlation Coefficient between Mix Design Variables and Fracture Energy ......................................................................................................................................................... 43
Table 6.5 Comparison of Accepted Assumptions and Study Implication ................................................... 44
Table 7.1 One Sample t-test Summary ....................................................................................................... 51
Table 7.2 Percent Difference Between 4 and 16 Replicates ....................................................................... 54
Table 7.3 Percent Difference Between 8 and 16 Replicates ....................................................................... 55
Table 7.4 Percent Difference Between 12 and 16 Replicates ..................................................................... 56
Table 8.1 Pavement Sections used in Evaluation of Relationship between DCT Fracture Energy and Reflective Cracking Performance ................................................................................................................ 59
Table 8.2 Cracking Performance Measures ................................................................................................ 61
Table 8.3 Significance of Observed R2 Value (p-value) Between Fracture Energy and Overlay Thickness to Reflective Cracking Performance Measures ............................................................................................... 68
Table 8.4 Preliminary Recommendations for DCT Fracture Energy for Asphalt Overlays (provided as function of overlay thicknesses and the needed overlay performance) .................................................... 70
Table 9.1 Tabulated Results for Extent of Cracking and Softening in the Beam ........................................ 85
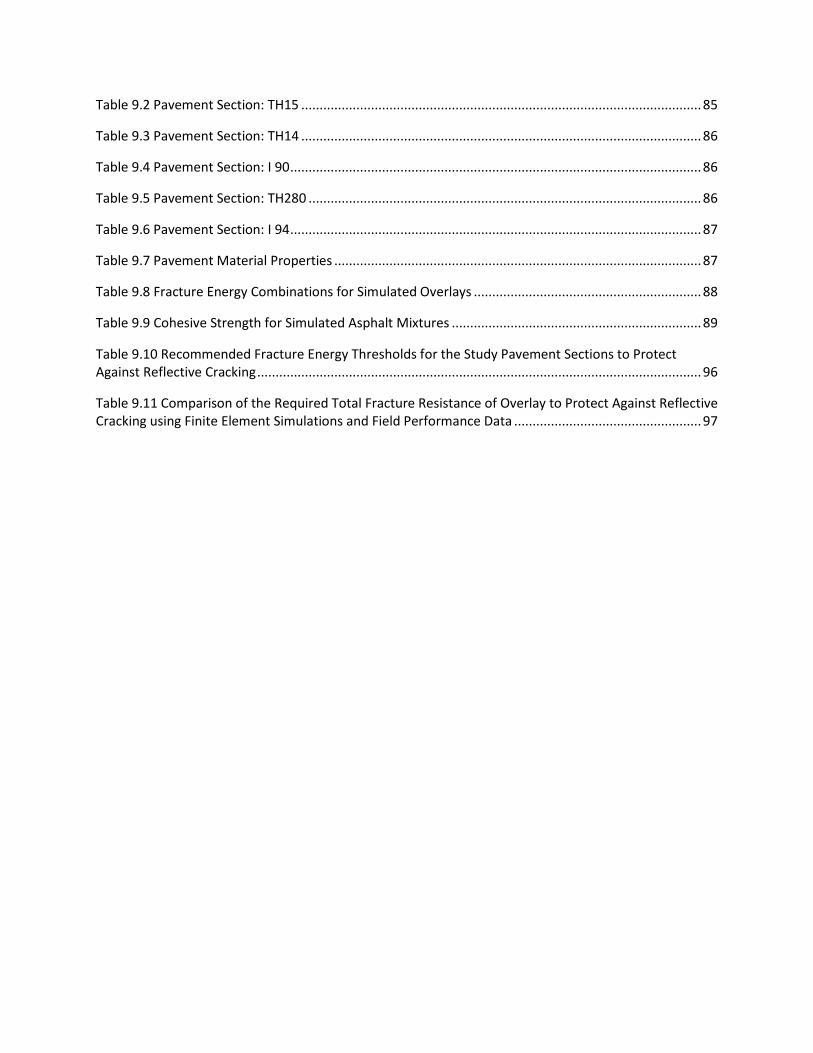
Table 9.2 Pavement Section: TH15 ............................................................................................................. 85
Table 9.3 Pavement Section: TH14 ............................................................................................................. 86
Table 9.4 Pavement Section: I 90 ................................................................................................................ 86
Table 9.5 Pavement Section: TH280 ........................................................................................................... 86
Table 9.6 Pavement Section: I 94 ................................................................................................................ 87
Table 9.7 Pavement Material Properties .................................................................................................... 87
Table 9.8 Fracture Energy Combinations for Simulated Overlays .............................................................. 88
Table 9.9 Cohesive Strength for Simulated Asphalt Mixtures .................................................................... 89
Table 9.10 Recommended Fracture Energy Thresholds for the Study Pavement Sections to Protect Against Reflective Cracking ......................................................................................................................... 96
Table 9.11 Comparison of the Required Total Fracture Resistance of Overlay to Protect Against Reflective Cracking using Finite Element Simulations and Field Performance Data ................................................... 97

EXECUTIVE SUMMARY
After 10 years of low-temperature cracking research, the Disc-Shaped Compact Tension (DCT) test emerged as the test to measure the fracture resistance of asphalt mixtures. The DCT test measures a mechanical property known as fracture energy. MnDOT conducted a DCT Low-Temperature Fracture Testing Pilot Project, which implemented a trial specification on five asphalt paving projects in 2013. Preliminary results were found to be promising, and the DCT Pilot Project identified several next steps for implementation. Many of these were undertaken in the research project that is discussed in this report.
The main objectives of the research study presented in this report are:
Refine the testing procedures for the DCT fracture energy test for improving test repeatability and reproducibility as well as the practicality of the test procedures
Identify the needed asphalt mixture adjustments (design parameters) to increase fracture energy
Determine suitability of DCT test-based parameters for their suitability as an indicator of reflective cracking performance and propose threshold values to lower the potential for premature reflective cracking in asphalt overlays
This research project was organized in the form of six research tasks. The first task focused on developing a database of DCT fracture energies and asphalt mix attributes. This allowed researchers to mine this database in subsequent tasks to conduct various statistical analyses for improving the DCT fracture energy testing procedures as well as to identify the most influential asphalt mix nominal properties with respect to fracture energy. Under tasks 2 and 3, a major sampling and testing effort was undertaken in conjunction with the MnDOT Office of Materials and Road Research in 2015 and 2016 to conduct a round-robin campaign for establishing repeatability and reproducibility of DCT test measurements as well as to conduct experimental studies on effects of aging and specimen temperature conditioning on the fracture energies of asphalt mixtures. The findings from experimental campaigns were used to propose pilot DCT specifications. Task 4 of this project focused on conducting analysis to recommend a suitable number of test replicates to minimize testing variability and increase reliability of measured fracture energies. This task also conducted statistical analyses to determine influential mix design parameters for providing guidance to mix specifiers and mix designers to improve thermal cracking performance of asphalt mixtures. The latter part of this research study undertook two efforts that focused on viability of using fracture energy as a reflective cracking performance measure. Under task 5, comparisons were made between field reflective cracking performance of asphalt overlays in Minnesota with fracture resistance determined using the DCT test. Initial thresholds for fracture energies of asphalt overlay mixtures were proposed in this task. In task 6, finite element analyses were conducted using five overlay pavement sections. The main objective of this effort was to conduct a parametric evaluation to determine the sensitivity of asphalt mixtures fracture energies on reflective cracking performance.
Key findings from the aforementioned research tasks are:
(1) The development of a performance test database is critical to successfully implement performance-based material specifications. The database can not only organize performance test results but also provides an opportunity for continued statistical analyses and test reliability evaluations.

(2) For fracture testing of asphalt mixtures at low temperatures, it is critical to monitor the temperature at the interior of the asphalt specimens and to have companion instrumented specimens that can be used to ensure that test specimens are at the correct temperature. Furthermore, the DCT fracture energy test was found to be fairly insensitive to the method used to cool test specimens from room temperature to test temperature.
(3) On the basis of round-robin testing efforts, a 90 J/m2 reproducibility limit for DCT fracture energy (when following MnDOT modified DCT test procedure) was established.
(4) The reheating of plant-produced loose asphalt mixtures to compact them was found to lower the fracture energy of asphalt mixtures.
(5) Testing of 12 replicate specimens was found to significantly lower variability and the differences between average and maximum and average and minimum fracture energy values from replicate specimens.
(6) An increase in the effective binder content and PG spread (difference between PG high and low-temperature grades) as well as lowering of recycled asphalt pavement (RAP) content and a low temperature grade is expected to increase fracture energy of asphalt mixtures.
(7) Total fracture resistance of overlay (product of fracture energy and overlay thickness) showed a good correlation with field reflective cracking performance of overlays. This finding was reaffirmed through the use of finite element pavement models. Furthermore, a total fracture resistance value of 50 J/m is expected to minimize the potential for reflective cracking in asphalt overlays.
Over the course of this research project, additional topics were identified that require further explorations. Recommendations for topics that are most mature in terms of immediate implementation and research need are summarized below:
(1) Routine use of the DCT fracture energy test as part of a quality assurance process during the mix production and pavement construction period has some challenges associated with the required turnaround time. Use of surrogate tests during the mix production period to ensure that the as-produced mix has similar composition and mechanical response as the mixture that has been optimized using fracture energy is one alternative to alleviate the challenge of the turnaround period to get results. Identification of a surrogate test and sensitivity of such a test to common mix production variables needs to be explored.
(2) DCT fracture energy test procedures record a number of physical quantities during the test, such as force, crack mouth opening displacement, and total displacement. Additional performance index parameters, such as flexibility index, fracture strain tolerance, rate dependent cracking index and DCT index have been proposed in recent years that utilize these physical quantities. Using the current MnDOT DCT database, these additional index parameters can be easily calculated and evaluated in terms of their suitability to predict field cracking performance of asphalt mixtures as well as to provide guidance to mix specifiers and designers.
(3) This study showed the viability of using fracture energy as an input in selection of asphalt mixtures for asphalt overlays as well as to guide the required overlay thickness. It was, however, found that the approach of varying fracture energy requirements for various overlay lifts might yield better optimality in terms of balancing costs and performance. The initial fracture energy recommendations for asphalt overlays to protect against premature reflective cracking needs further validation and pilot implementation. While a limited amount of extended validation will occur through an on-going National Road Research Alliance (NRRA) flexible team long-term research project, use of existing in-service pavement in Minnesota for further exploration is recommended.

1
CHAPTER 1: INTRODUCTION
This comprehensive report provides documentation of the research efforts that were undertaken during the MnDOT contract 99008 work order 162 (Disc Shaped Compact Tension (DCT) Specifications Development for Asphalt Pavement). Low-temperature cracking is the most prevalent pavement distress found in asphalt pavements in cold climates. As the temperature drops, the restrained pavement tries to shrink. Tensile stresses build to a critical point at which a crack is formed. Current specifications attempt to address this issue by requiring an asphalt binder with a certain low-temperature grade, i.e., xx-34. While this is a good start, it does not account for other factors such as asphalt mixture aggregate types and gradations, presence of recycled materials, and aggregate base and subgrade characteristics. Research has shown that binder tests alone are not sufficient to predict low-temperature cracking performance in the field; testing asphalt mixtures at temperatures relevant to the climatic conditions for the pavement locations is necessary to obtain a reliable performance prediction. Furthermore, mixture testing techniques should be based on fracture mechanics rather than stiffness and strength. While still a point of debate, the pavement support conditions (base and subgrade) may also play an important role in the extent of cracking and should be considered.
This report is organized in the same order as the tasks discussed above. Chapter 2 discusses the fracture energy database development and features, Chapter 3 provides information on the pavement projects that were sampled for round-robin and other experimental campaigns. Chapter 2 also discusses the experiment to make the specimen temperature conditioning process more robust and practical as well as the preliminary interlaboratory comparisons. Chapter 4 presents results from the round-robin testing campaign and reports on the experiment that was conducted to determine the effects of the sampling location and aging on fracture energy measurements. Chapter 5 provides the pilot DCT specifications on the basis of the round-robin campaign and aging study. The statistical analysis of the DCT database to determine impacts of various mix design parameters on DCT fracture energy is presented in Chapter 6, which is followed by the analysis to recommend the optimal number of test replicates to minimize result variability in Chapter 7. Chapter 8 discusses use of field cracking performances of 15 asphalt overlays in Minnesota to assess the viability of fracture resistance as a performance parameter. Threshold values for fracture resistance are also proposed in this chapter. Chapter 9 presents the details on the asphalt overlay finite element model and its use to determine sensitivity of overlay reflective cracking potential to changes in asphalt fracture energy of various overlay lifts. Recommendations made in Chapter 8 are also compared with simulation results in Chapter 9. Pertinent findings and recommendations from various research efforts are discussed in respective chapters, Chapter 10 provides a high-level summary of this research project, key findings and some recommendations for immediate implementation and research efforts.
During the course of this project, the research team was also consulted routinely by the MnDOT Office of Materials and Road Research staff on various topics associated with the DCT test procedures as well as DCT pilot specification. However, it is beyond the scope of this report to document the advisory efforts of the research team.

2
CHAPTER 2: DEVELOPMENT OF DATABASE OF FRACTURE ENERGY ON CURRENT ASPHALT MIXTURES
2.1 INTRODUCTION
This chapter of the report details a database that was constructed to record Disc Shaped Compact Tension (DCT) test results and mix design details of tested specimens. Development of this database was essential to have an organized system for saving the DCT test results as well as to conduct the additional research tasks that assessed impacts of various mix nominal properties on fracture energy as well as evaluation of the suitable number of test replicates.
2.2 DATABASE DETAILS
The DCT database contains both mix design and project information to monitor DCT results as well as any trends correlating fracture energy to mix design inputs or pavement performance. At the time of writing of this report, several thousand DCT test results have been stored in the database. The database resides at the MnDOT Office of Materials and Road Research.
As testing of DCT specimens and analysis of data continues (specifically those being tested as part of the inter-laboratory and fracture energy discrepancy studies as detailed in Tasks 2 thru 4), this information was populated into the database. Information included in the database can be seen in Figure 2-1 through Figure 2-5 which show screenshots of the column headings and input information in the database.
Figure 2-1 DCT Result Database Screenshot including column headings and input information of tested specimens
Figure 2-2 DCT Result Database Screenshot including column headings and input information of tested specimens

3
Figure 2-3 DCT Result Database Screenshot including column headings and input information of tested specimens
Figure 2-4 DCT Result Database Screenshot including column headings and input information of tested specimens
Figure 2-5 DCT Result Database Screenshot including column headings and input information of tested specimens
Information included in the database can be broken down into three categories: Project Information, Mix Information, and Test Information. Project information includes defining details of project location, ID’s correlating to specific test specimens, and the trunk highway the asphalt mix is designed for. Mix information includes mix design inputs for each asphalt specimen tested. Test information includes details of testing temperature and method of testing used. Detailed descriptions of each input are provided in series of sub-sections.
2.2.1 Project Information
Master Project ID: Unique number assigned by MnDOT research staff identifying the master project testing is being conducted for. Begins with the year project is started in, followed by a unique ID, i.e. 2014-01.
Sub-Project ID: Unique number assigned by MnDOT research staff identifying a sub-project within a master project. This number will be appended onto the Master Project ID, i.e. 2014-01-02 (with 02 being the sub-project ID).
Testing State: Identifies state from which DCT specimens were fabricated and tested.
Testing Lab: Identifies Lab from which DCT specimens were fabricated and tested.
TH (Trunk Highway): A Trunk Highway (TH) defines State Highways, U.S. Highways, and Interstates.
SP (State Project): State project numbers are assigned to identify a particular project within Minnesota. The first two numbers define the county the project is located in, with the next two numbers identifying the section of road within the county.
4
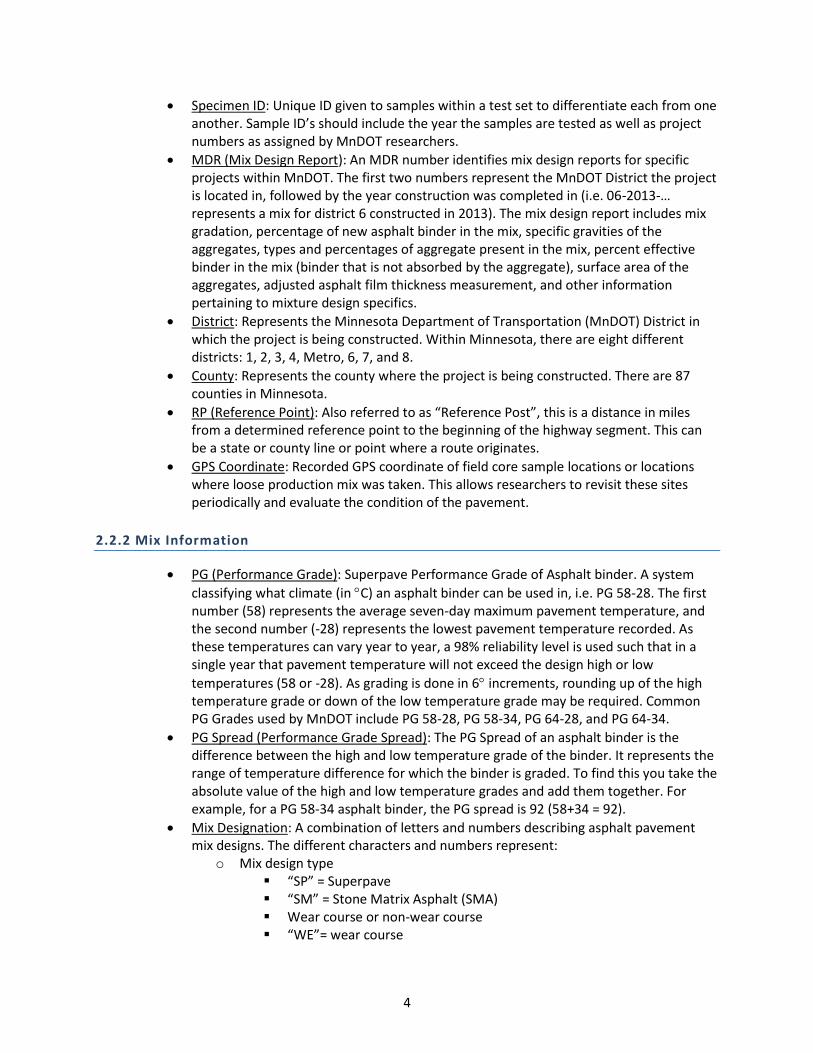
Specimen ID: Unique ID given to samples within a test set to differentiate each from one another. Sample ID’s should include the year the samples are tested as well as project numbers as assigned by MnDOT researchers.
MDR (Mix Design Report): An MDR number identifies mix design reports for specific projects within MnDOT. The first two numbers represent the MnDOT District the project is located in, followed by the year construction was completed in (i.e. 06-2013-… represents a mix for district 6 constructed in 2013). The mix design report includes mix gradation, percentage of new asphalt binder in the mix, specific gravities of the aggregates, types and percentages of aggregate present in the mix, percent effective binder in the mix (binder that is not absorbed by the aggregate), surface area of the aggregates, adjusted asphalt film thickness measurement, and other information pertaining to mixture design specifics.
District: Represents the Minnesota Department of Transportation (MnDOT) District in which the project is being constructed. Within Minnesota, there are eight different districts: 1, 2, 3, 4, Metro, 6, 7, and 8.
County: Represents the county where the project is being constructed. There are 87 counties in Minnesota.
RP (Reference Point): Also referred to as “Reference Post”, this is a distance in miles from a determined reference point to the beginning of the highway segment. This can be a state or county line or point where a route originates.
GPS Coordinate: Recorded GPS coordinate of field core sample locations or locations where loose production mix was taken. This allows researchers to revisit these sites periodically and evaluate the condition of the pavement.
2.2.2 Mix Information
PG (Performance Grade): Superpave Performance Grade of Asphalt binder. A system
classifying what climate (in C) an asphalt binder can be used in, i.e. PG 58-28. The first number (58) represents the average seven-day maximum pavement temperature, and the second number (-28) represents the lowest pavement temperature recorded. As these temperatures can vary year to year, a 98% reliability level is used such that in a single year that pavement temperature will not exceed the design high or low
temperatures (58 or -28). As grading is done in 6 increments, rounding up of the high temperature grade or down of the low temperature grade may be required. Common PG Grades used by MnDOT include PG 58-28, PG 58-34, PG 64-28, and PG 64-34.
PG Spread (Performance Grade Spread): The PG Spread of an asphalt binder is the difference between the high and low temperature grade of the binder. It represents the range of temperature difference for which the binder is graded. To find this you take the absolute value of the high and low temperature grades and add them together. For example, for a PG 58-34 asphalt binder, the PG spread is 92 (58+34 = 92).
Mix Designation: A combination of letters and numbers describing asphalt pavement mix designs. The different characters and numbers represent:
o Mix design type “SP” = Superpave “SM” = Stone Matrix Asphalt (SMA) Wear course or non-wear course “WE”= wear course

5
“NW” = non-wear course o Maximum aggregate size of mix (“A”= 9.5mm, “B” = 12.5 mm, “C” = 19.0 mm,
“D” = 4.75 mm, “E” = SMA) o Traffic level mix is designed for, reported as Equivalent Single Axel Loads (ESALS)
x 106 “2” = < 1.0 and shoulders “3” = 1-3 “4” = 3-10 “5” = 10-30 “6”= SMA
o Air void requirement of mix “30” = 3.0 % “40” = 4.0%
o Performance Grade (PG) of the binder for mix “A” = PG 52-34 “B” = PG 58-28 “C” = PG 58-34 “E” = PG 64-28 “F” = PG 64-34 “H” = PG 70-28 “L” = PG 64-22 “M” = PG 49-34
Contractor: Mix production contractor for the project.
% Binder: Percentage of asphalt binder present by weight of total mix. Typically, between 4 and 7%.
Add. AC (%): Percentage of new asphalt added to asphalt mixture.
Method of Percent Binder Determination: There are several methods to determine the percent binder in an asphalt mix:
o Extr. (Extraction): Determines asphalt content with use of a solvent which removes asphalt binder from aggregate in the mixture. Mass of the mix is taken before and after use of the solvent, with the difference being the percent of asphalt binder present.
o Ign. Oven (Ignition Oven): Determining asphalt binder content by burning off the asphalt in a sample in an ignition oven. The sample is weighed before it enters the oven and after to calculate percent binder.
o Lab: Determined when mixing an asphalt sample for gyratory compaction in the laboratory.
Binder Type: o Mod (Modified): Binder which has been modified in order to enhance
performance and longevity of asphalt pavements, improve stiffness to avoid rutting and cracking, to meet Superpave requirements at high and low temperatures, to utilize recycled waste materials such as roofing shingles, or to improve aggregate and asphalt binder adhesion.
o Neat: An unmodified asphalt binder.
Aggregate Size: Refers to the maximum aggregate size which represents the smallest sieve through which 100% of the aggregate sample particles pass. Measured in both mm and inches.

6
Traffic Level: A numerical value assigned to a roadway that is defined by the volume of traffic, represented by ESALS x 106, that a roadway is determined to experience over its lifetime.
o “2” = < 1.0 and shoulders o “3” = 1-3 o “4” = 3-10 o “5” = 10-30 o “6”= SMA
Design Air Voids: Percentage of air voids selected for design of asphalt mix.
Actual Air Voids: Percentage of actual air voids measured from a lab tested specimen (typically collected during mix production or from existing pavement).
% RAP (Recycled Asphalt Pavement): Percentage of recycled asphalt pavement present in the asphalt mixture. Introducing RAP into the asphalt mixture is a cost effective way to re-use waste material and also decreases amount of virgin aggregates and virgin binder needed.
% Recycled Binder: Percentage of recycled asphalt binder present in the asphalt mixture. This can be found by subtracting the percentage of new asphalt binder from the total binder present (both of these can be found in the mix design report (MDR)).
AFT Adjusted (Asphalt Film Thickness): An estimate of thickness of binder coating the aggregate (measured in microns). It is a function of effective binder and surface area of aggregate in sample as well as specific gravity of aggregates. Surface area is based on gradation and calculated surface area is adjusted according to specific gravity of aggregates. AFT is used to ensure there is an adequate amount of effective binder coating the aggregate.
VMA (Voids in Mineral Aggregate): Represents the volume fraction of air voids and effective asphalt binder in mix.
2.2.3 Testing Information
o Specimen Type: Defines the source of the DCT specimen. They can either come from field cores, production mix sampled from the project location and compacted, or from lab compacted mixes.
o Construction Type: Defines the type of construction used on projects where the DCT test is utilized. Construction types are abbreviated in the database as follows:
o SFDR: Stabilized full depth reclamation o FDR: Full depth reclamation o MNO: Mill and Overlay o New: New Construction
o Pavement Structure: Brief details of the pavement structure such as lift thickness and number of lifts.
o Test Temp.: The temperature the DCT specimens will be tested at. Test temperature is
10C warmer than the 98% reliability temperature as determined by LTPPBind 3.1 software. Past testing was done by using the 98% reliability PG low temperature grade for each project location. Future testing requires using the 98% reliability temperature of the project location to better determine the temperature the asphalt concrete will be exposed to.

7
o Fracture Energy: The area under the CMOD vs. Load curve divided by the area of the specimen that experiences cracking. This value, recorded as J/m2, is automatically calculated by DCT testing software and can be found in the raw data file recorded for each test.
o Max Load: The Maximum load or peak load (record as kN) the specimen experiences during DCT testing.
o Test Date: Records the date on which the DCT specimens are tested. o Test Procedure: Indicates which standard and methods were used while fabricating and
testing DCT specimens. o Asphalt Source: Refinery source of asphalt binder used in mix.
8
CHAPTER 3: PROJECT SELECTION, SAMPLE PROCUREMENT AND TEMPERATURE CONDITIONING STUDY
3.1 INTRODUCTION
This chapter contains details of asphalt mixes sampled by the University of Minnesota Duluth (UMD) and Minnesota Department of Transportation (MnDOT) Office of Materials and Road Research (OMRR) during the 2014 construction season. These mixes were used in a study for analyzing repeatability of DCT sample preparation, conditioning, and testing between four different labs. These labs include MnDOT, UMD, American Engineering Testing (AET), and Braun Intertec. This study analyzed sensitivity and variability associated with DCT testing conducted at different labs with different machinery and different operators fabricating and testing specimens.
A second study conducted in tandem with the repeatability study analyzed the fracture energy differences between mix design, production, and post-production stages. Samples from 8 projects throughout the state were obtained for this study. Four samples at mix design were made by the contractor and given to the research team. These specimens were made with dimensions of a TSR sample (95 mm thickness, 150 mm diameter, and 7% ± 0.5% air voids). During production, 4 gyratory pills were compacted on site by the contractor and 4 cylinders of loose mix at the same location were collected to be re-heated to make 4 additional pills. Lastly, 4 field cores were taken from the same location production mix was collected at. All testing for this second study will be conducted at the OMRR lab.
Finally, during the course of this task of the project, it was determined that there was a need to conduct a concurrent experiment on specimen temperature conditioning to determine suitable procedures to cool DCT test specimens to test temperature and also to lower test variability as well as to improve practicality of the test procedure. While this was not part of the original scope of the work for this project, due to its criticality, this sub task was included in the project (after consultation with project technical liaison).
3.2 PROJECT INFORMATION
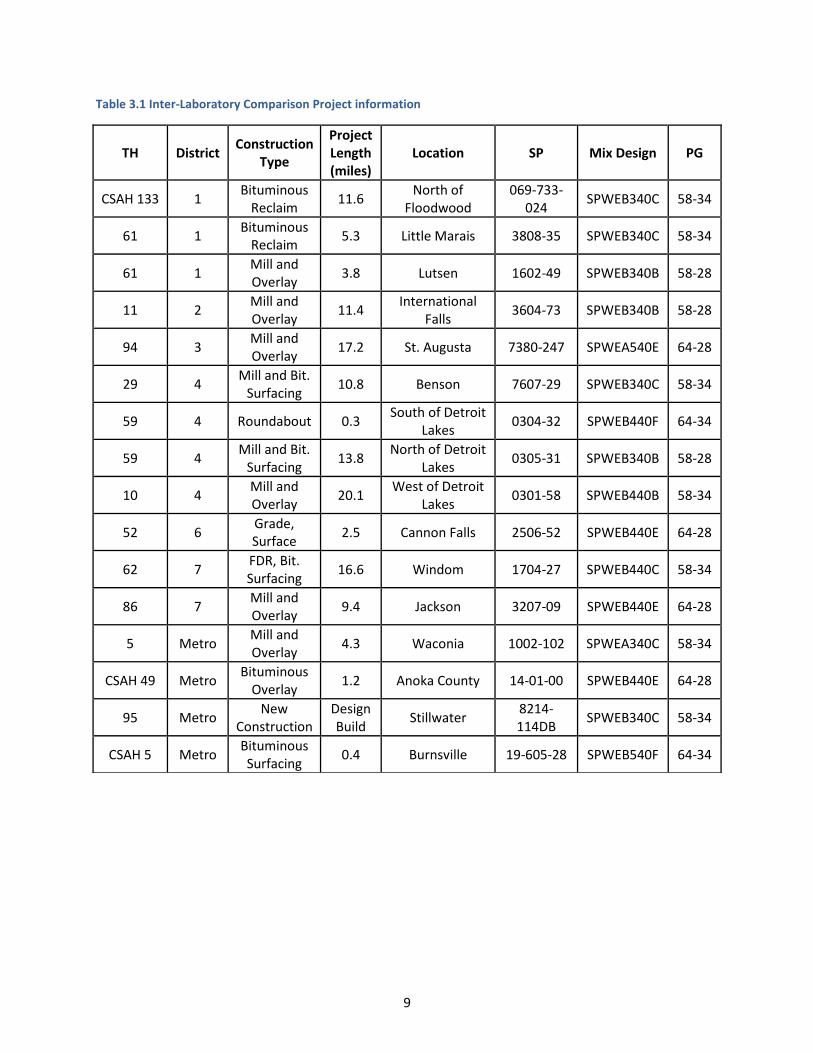
Samples from 16 locations throughout the state were obtained during the construction season of 2014 for the repeatability study. These locations represented differing construction types, PG binder grades, traffic levels, and climatic conditions. Detailed information of these projects can be found in Table 3.1.
Samples from 11 locations throughout the state were also obtained during the 2014 construction season for the study analyzing fracture energy differences between mix design, production, and post-production. These locations represented differing construction types, PG binder grades, traffic levels, and climatic conditions. Detailed information of these projects can be found in Table 3.2.
It should be noted that for some projects either mix design specimens or samples to be re-heated at the OMRR lab are absent. Samples from the four different stages of mix design, non-reheated production, reheated production, and field cores were obtained and tested for 8 of the projects. A summary of specimens collected for each project can be found in Table 3.3. Rows highlighted in green represent projects with samples collected from all four stages. Location of highway projects that were used for material sampling is shown in Figure 3-1. As it can be seen from this figure, the sampled mixtures represent a good geographical distribution within Minnesota.
9
Table 3.1 Inter-Laboratory Comparison Project information
TH District Construction
Type
Project Length (miles)
Location SP Mix Design PG
CSAH 133 1 Bituminous
Reclaim 11.6
North of Floodwood
069-733-024
SPWEB340C 58-34
61 1 Bituminous
Reclaim 5.3 Little Marais 3808-35 SPWEB340C 58-34
61 1 Mill and Overlay
3.8 Lutsen 1602-49 SPWEB340B 58-28
11 2 Mill and Overlay
11.4 International
Falls 3604-73 SPWEB340B 58-28
94 3 Mill and Overlay
17.2 St. Augusta 7380-247 SPWEA540E 64-28
29 4 Mill and Bit.
Surfacing 10.8 Benson 7607-29 SPWEB340C 58-34
59 4 Roundabout 0.3 South of Detroit
Lakes 0304-32 SPWEB440F 64-34
59 4 Mill and Bit.
Surfacing 13.8
North of Detroit Lakes
0305-31 SPWEB340B 58-28
10 4 Mill and Overlay
20.1 West of Detroit
Lakes 0301-58 SPWEB440B 58-34
52 6 Grade, Surface
2.5 Cannon Falls 2506-52 SPWEB440E 64-28
62 7 FDR, Bit. Surfacing
16.6 Windom 1704-27 SPWEB440C 58-34
86 7 Mill and Overlay
9.4 Jackson 3207-09 SPWEB440E 64-28
5 Metro Mill and Overlay
4.3 Waconia 1002-102 SPWEA340C 58-34
CSAH 49 Metro Bituminous
Overlay 1.2 Anoka County 14-01-00 SPWEB440E 64-28
95 Metro New
Construction Design Build
Stillwater 8214-114DB
SPWEB340C 58-34
CSAH 5 Metro Bituminous Surfacing
0.4 Burnsville 19-605-28 SPWEB540F 64-34

10
Table 3.2 Fracture Energy Discrepancy Project Information
TH District Construction
Type
Project Length (miles)
Location SP Mix Design PG
CSAH 133
1 Bituminous
Reclaim 11.6
North of Floodwood
069-733-024 SPWEB340C 58-34
61 1 Bituminous
Reclaim 5.3 Little Marais 3808-35 SPWEB340C 58-34
61 1 Mill and Overlay
3.8 Lutsen 1601-64 SPWEB340B 58-28
11 2 Mill and Overlay
11.4 International
Falls 3604-73 SPWEB340B 58-28
29 4 Mill and Bit.
Surfacing 10.8 Benson 7607-29 SPWEB340C 58-34
59 4 Roundabout 0.3 South of
Detroit Lakes 0304-32 SPWEB440F 64-34
59 4 Mill and Bit.
Surfacing 13.8
North of Detroit Lakes
0305-31 SPWEB340B 58-28
62 7 FDR, Bit. Surfacing
16.6 Windom 1704-27 SPWEB440C 58-34
86 7 Mill and Overlay
9.4 Jackson 3207-09 SPWEB440E 64-28
65 3A Mill and Overlay
20.2 Mora 3003-46 SPWEA340B 58-28
CSAH 3
3A Grading,
Bituminous Surfacing
6.1 Crosslake 18-603-22 SPWEA240B 58-28

11
Table 3.3 Fracture Energy Discrepancy Project Information
TH District Mix Design Pills Reheat Sample Non-reheat Sample Field Cores
CSAH 133 1 √ √ √ √
61 1 √ NONE √ √
61 1 √ √ √ √
11 2 NONE NONE √ √
29 4 √ √ √ √
59 4 NONE √ √ √
59 4 √ √ √ √
62 7 √ √ √ √
86 7 √ √ √ √
65 3A √ √ √ √
CSAH 3 3A √ √ √ √

12
Figure 3-1 Project Locations
13
3.3 TEMPERATURE CONDITIONING STUDY
As samples were collected from projects around the state in the fall of 2014, a concurrent investigation of DCT testing was being executed. Upon reviewing the ASTM D3713-13 specification for DCT testing it was found that the time required for temperature conditioning of DCT specimens before testing was very broad and could potentially lead to large variations in temperature conditioning times between testing labs and technicians.
In ASTM D7313-13, it is required that “specimens shall be placed in a temperature controlled chamber for a minimum of 8 h and a maximum of 16 h at the desired test temperature. The temperature shall be
within ± 0.2C (±4F) throughout the conditioning and testing times.” One aspect of the ASTM specification that needed to be addressed was how to cool the specimens to the desired test temperature. It is not stated as to how the specimens should be brought down to desired test temperature (i.e. at a controlled rate, take specimens at room temperature put into a freezer at test temp, etc.). It was also noted that the 8-hour window between the minimum and maximum conditioning time proposed by ASTM was very broad and decreased practicality of testing. With the minimum conditioning time being 8 hours, a technician would either need to program the chambers to start at a certain time before the workday began to be able to test during the day or be required to work an 8+ hour day to condition and test specimens. This also does not account for any potential malfunctions with the equipment or chambers.
Another main goal of the study was to create a more defined temperature conditioning specification which every testing lab would be able to execute. The 8 hour testing window suggested by ASTM potentially created large variances in conditioning time between labs and introduces testing bias due to potential differing conditioning times.
The conditioning study consisted of two phases, which will be discussed. It should be noted that this was not original task of project. It was found to be important to investigate as changes to the specification could increase the ease and practicality of testing of specimens.
3.3.1 Phase I
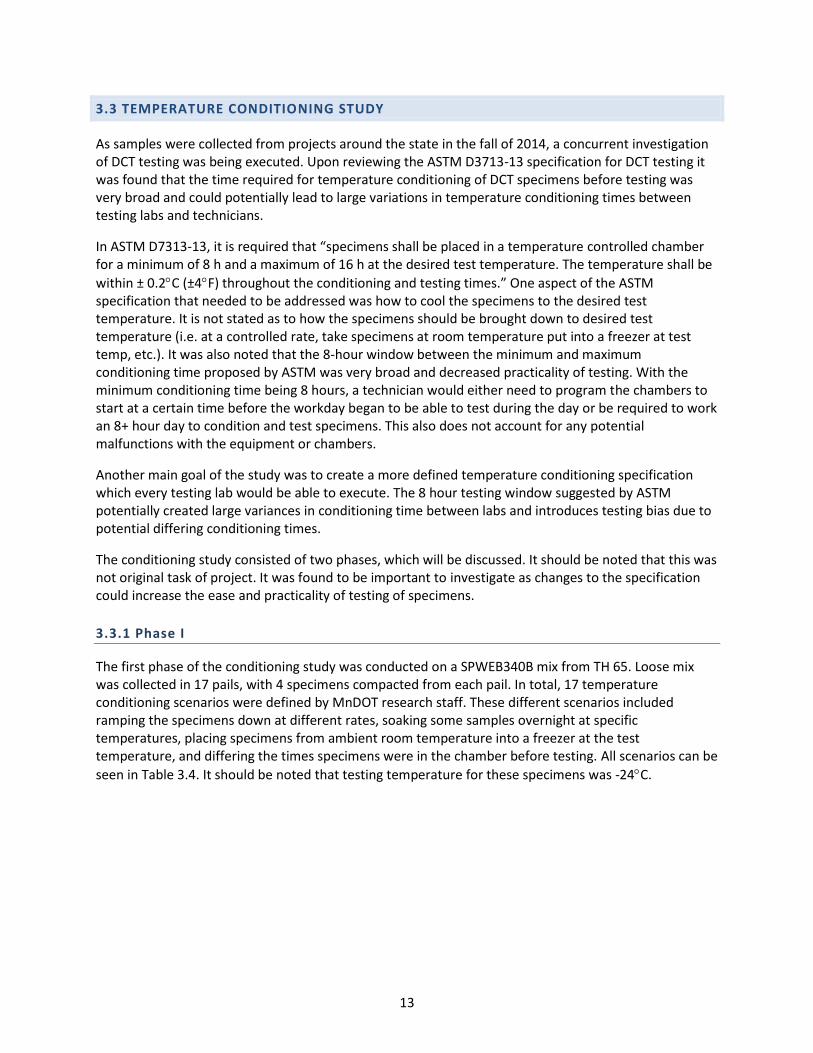
The first phase of the conditioning study was conducted on a SPWEB340B mix from TH 65. Loose mix was collected in 17 pails, with 4 specimens compacted from each pail. In total, 17 temperature conditioning scenarios were defined by MnDOT research staff. These different scenarios included ramping the specimens down at different rates, soaking some samples overnight at specific temperatures, placing specimens from ambient room temperature into a freezer at the test temperature, and differing the times specimens were in the chamber before testing. All scenarios can be
seen in Table 3.4. It should be noted that testing temperature for these specimens was -24C.
14
Table 3.4 Phase I temperature conditioning scenarios
Pail 1 Soaked overnight @
5°C (1°C/6min) Pail 7
Soaked @ test temp. min. 1 hour (1°C/3min.)
Pail 13 Placed from
ambient to freezer @ -24°C
Pail 2 Ramped to -24°C
(1°C/6min) Pail 8
Soaked @ test temp. min. 4 hours (1°C/3min.)
Pail 14 Placed from
ambient to freezer @ -24°C
Pail 3 Soaked overnight @
5°C (1°C/6min) Pail 9
Placed from ambient to freezer @ -24°C
(2014-008-09) Pail 15
Placed from ambient to freezer
@ -24°C
Pail 4 Ramped to -24°C @
1°C/3min. Pail 10
Placed from ambient to freezer @ -24°C
(1°C/3min.) Pail 16
Placed from ambient to freezer
@ -24°C
Pail 5 Ramped to -24°C @
1°C/2min. Pail 11
Soaked overnight @ 19°C, min. soak 8 hours (1°C/3min.)
Pail 17 Placed from
ambient to freezer @ -24°C
Pail 6 Placed from ambient
to freezer @ -24°C Pail 12
Soaked overnight @ 19°C, min. soak 12 hours (1°C/3min.)
It should be noted that this initial phase of the study was conducted with many scenarios to refine understanding between any differences in conditioning time. This allowed for the researchers to define a smaller test set of desired scenarios to further investigate in phase II of the study.
3.3.2 Phase II
After testing specimens and analyzing results from phase I, 3 scenarios were chosen to be further investigated in phase II of the study. These scenarios were: 1) Ramping down the specimens to the test
temperature at a controlled rate of 1/3 C/min, with total time in freezer being 3 hours before testing could begin. 2) Placing specimens from ambient room temperature into a conditioning chamber already
at the desired test temperature of -24C. Specimens must reach -24C within 1 hour, with total time in
freezer being 2 hours before testing could begin. 3) Soaking specimens overnight at +19C and then
soaking the specimens for 9 hours at test temperature of -24C before the start of testing. It should be
noted specimens are not ramped down at a controlled rate to -24C. This scenario was chosen to represent the required temperature conditioning as per ASTM specifications. For brevity, the remainder of the deliverable will refer to scenario 1 as referred to as “ramp”, scenario 2 as “ambient”, and scenario 3 as “soaked”.
Loose mix was collect from a project for CSAH 3 in Crosslake, MN for phase II testing. The mix consisted of 16 pails of type SPWEA240B. From these pails, 4 specimens were compacted from each. These specimens were randomized into 16 groups to be tested by MnDOT, with 3 specimens to be tested in each group. It should however be noted that all 4 specimens compacted from pail 1 were tested before the randomization of specimens occurred, resulting in MnDOT testing 49 specimens (15 groups of 3

15
specimens and 1 group of 4 specimens). The ramp and soaked scenarios consisted of 5 test sets, while the ambient scenario consisted of 6 test sets.
After testing of specimens for all 3 conditioning scenarios, a data analysis was conducted, with the results seen in Figure 3-2. The results in Figure 3-2 represent the average fracture energies calculated from each scenario with the first bar representing the ambient specimens, the second representing the ramped specimens, and the third representing the soaked specimens. As can be seen, there was very little difference in average fracture energies between all three scenarios.
Figure 3-2 Phase II DCT Results for All 3 Temperature Conditioning Scenarios
From this phase it was found that there was only a 2 J/m2 difference in average results between ambient specimens and ramped specimens. To improve ease and practicality of testing, as this was one of the main goals of the study, it was determined that taking specimens from room temperature into a conditioning chamber already at the desired test temperature was a more feasible option from an operation stand point versus the other two scenarios. Ramping down specimens at a controlled rate and then warming the cooling chambers back to room temperature before the next set of conditioning and testing could begin requires the equipment to be continually turned on and off and also adds to the amount of time needed to condition specimens. Soaking the specimens also required significantly more time as they remained in the conditioning chamber for 9 hours before testing.
It was found that there is no significant effect on fracture energy results based on the method of conditioning specimens based on the 3 scenarios investigated in phase II. Additional testing within MnDOT consisted of conditioning specimens by placing them from room temperature into a cooling chamber already at the desired test temperature. Results from the temperature conditioning study greatly increased the ease and practicality of the DCT test.
3.4 PRELIMINARY INTER-LABORATORY COMPARISON
As a significant amount of effort was spent on identifying a more practical and efficient testing scheme, specimen preparation was delayed. The remainder of testing was undertaken in spring 2015 and those results are discussed and presented in the next chapter that summarizes task-3 of this project.

16
Although testing for the round robin study was not completed in task-2 of the project, some inter-laboratory comparison testing on specimens tested at both UMD and MnDOT labs was completed within task-2. This comparison testing was to further investigate findings from the second phase of the conditioning study as to whether there a difference in fracture energy existed between specimens brought down to test temperature at a controlled rate versus placing them from room temperature into a conditioning chamber that’s already at test temperature and allowing them to reach test temperature within an allotted time.
In an effort to investigate potential differences in DCT results based on temperature conditioning scenarios between UMD and MnDOT labs, 5 buckets of loose asphalt mix were collected from a project on I-94 near St. Augusta, MN. The buckets were sent to UMD to compact 4 specimens from each. The 20 compacted specimens were labeled based on which pail they were compacted from. Distribution of specimens was randomized, as seen in Table 3.5, with 10 samples tested by UMD and 10 by MnDOT. Material tested between the labs and the lab which compacted the specimens was the same, but the preparation (cutting) and testing of the specimens was done by each respective lab.

17
Table 3.5 Preliminary Inter-Laboratory Testing Matrix
Lab Sample ID Test Temp. (°C) Temp. Conditioning Scenario
MnDOT
1B
-12
Room Temperature2
2C
3D
4A
5C
UMD
1A
Ramped1
2B
3C
4D
5B
MnDOT
1D
-24
Room Temperature2
2A
3B
4C
5A
UMD
1C
Ramped1
2D
3A
4B
5D 1Ramped = Cooled at a controlled rate of 1/3° C/min to test temperature. 2Room Temp = Specimens placed from room temperature into conditioning chamber at test temperature.
As is noted in Table 3.5, UMD conditioned specimens by ramping them down to test
temperature at a controlled rate of 1/3 C/minute. Total time in freezer before testing for UMD specimens was 3 hours. MnDOT’s method of temperature conditioning consisted of taking specimens at room temperature and placing them into the conditioning chamber which was already at the desired test temp. Specimens were required to reach the test temperature within 1 hour, with total time in freezer being 2 hours before testing could begin.

18
Figure 3-3 Preliminary Inter-Laboratory Testing Results
This inter-laboratory comparison of specimens prepared by different labs and conducting differing
temperature conditioning of specimens showed very little variability in results at both -24C and -12C, as seen in Figure 3-3, with blue representing MnDOT results and red UMD. Average fracture energies of
specimens differed by 11.6 J/m2 at -24C and 28.6 J/m2 at -12C. These results showing little variability between fracture energy results based on the method of conditioning specimens before testing further support the conclusion found in Phase II of the conditioning study. As no significant difference is observed, selecting the more practical conditioning scenario of placing specimens from ambient room temperature into a cooling chamber is viable and reinforced by these results.

19
CHAPTER 4: DCT TESTING AND DATA ANALYSIS
4.1 INTRODUCTION
Task-3 of the research project focused of testing and analysis of all specimens collected during the 2014 construction season. This chapter details both a round robin style testing campaign and an aging study that were conducted during the project.
During the 2014 construction season, loose asphalt mix was collected from 16 projects throughout the state of Minnesota for a “Round Robin” repeatability and reproducibility study conducted between four testing labs. Details on the sampled mixtures as well as locations are discussed in Chapter 3 of this report. The objective of the experimental campaign was to distribute compacted specimens of the same asphalt mixture to participating labs and have each complete both specimen preparation and testing. These results were then sent to the Minnesota Department of Transportation (MnDOT) Office of Materials and Road Research (OMRR) for data analysis to determine test repeatability and reproducibility limits. The four participating labs included MnDOT OMRR, American Engineering Testing (AET), Braun Intertec, and the University of Minnesota Duluth (UMD). From each of the 16 projects, 16 pills were compacted with 4 distributed to each lab for testing, totaling in 256 total specimens compacted. These results greatly aided in the development of the DCT Pilot Specifications.
Although UMD was originally planned to undertake testing as one of the participating labs, unforeseen circumstances caused this to not be possible. Therefore, only three labs successfully finished testing per the MnDOT Modified testing procedure. All data analysis herein completed by MnDOT OMRR was done only on results completed by Braun Intertec, AET, and MnDOT OMRR.
A separate “Aging” study was conducted in tandem with the Round Robin study to analyze fracture energy differences between mix design, production, and post-production stages. The production stage consisted of both reheated and non-reheated specimens, and post-production specimens consisted of field cores. The material for this study was collected from 11 projects throughout the state during the 2014 construction season with four gyratory specimens compacted at each stage (mix design, production, and post-production). This study was completed to further investigate findings from a pilot DCT implementation study completed in 2012 which showed a drop in fracture energy occurring between mix design and production.
4.2 OVERVIEW OF ROUND ROBIN TESTING CAMPAIGN
In preparation of Round Robin testing, both the OMRR bituminous lab and District 3’s Baxter lab compacted specimens from loose mix for all 16 projects. All loose mix collected was plant produced and collected either from the windrow or at the plant.
Prior to specimen fabrication and testing, a meeting was held between OMRR staff and each respective lab to go over testing procedure and MnDOT modifications to ASTM D7313-13, referred to as “ASTM D7313-13/MnDOT Modified”. All modifications made to ASTM D7313-13 were reviewed by AET, Braun, and UMD with questions or clarifications answered. A visit was also made to each lab to verify temperature measurement systems of DCT testing chambers were within MnDOT Modified standards.
At each visit a Validator was also loaded into the DCT testing chamber and ran in each machine. A Validator is a MnDOT approved device made of high-grade aluminum and fabricated similar to a DCT specimen with two core holes and notch, as seen in Figure 4-1. There is a known displacement for each

20
validator when a 3 kN load is applied. They are loaded into DCT testing chambers and ran at least once a month or after a maximum of 100 tests, whichever occurs first, to ensure each DCT testing system (software, hardware, hydraulics, etc.) is operating correctly.
Figure 4-1 MnDOT Approved Validator and Validator Loaded in DCT Testing Chamber
In Spring of 2014, both AET and Braun Intertec were delivered 64 specimens for testing (4 specimens from 16 projects). Testing by MnDOT, AET, and Braun was completed in June of 2015 with a total of 192 samples tested. As UMD was unable to complete testing, 64 samples were left untested. The testing at UMD was incomplete due to the equipment not meeting the requirements of MnDOT Modified specifications. These samples were later delivered to the University of New Hampshire and the results of that testing effort is discussed in Appendix A of this report. It should be noted that the University of New Hampshire lab was not validated using the MnDOT procedure and thus those results are only provided for purpose of completeness, they were not used in development of the DCT pilot specifications.
Standard test temperature for DCT specimens was previously recommended by the phase I and II low temperature cracking pooled-fund studies to be 10°C warmer than the PG low temperature limit. However, for the test temperature to more accurately reflect the actual environment the pavement will be exposed to when placed in the field, temperature for DCT testing is recommended to be 10°C warmer than the asphalt binder PGLT required for 98% reliability as determined by LTPPBind 3.1 software. For example, if the 98% reliability at a particular location is -31 °C the test temperature would be -21 °C. This method was used to determine test temperature for Round Robin specimens. Project information, including test temperature, can be seen in Table 4.1.

21
Table 4.1 Round Robin Project Information
Roadway Mix Designation Traffic Level
PG Grade Aggregate Size
(in.) % RAP Test Temp (°C)
TH 59 Roundabout
SPWEB440F 4 64-34 ¾ 16% -23.7
TH 59 N. D.L. SPWEB340B 3 58-28 ¾ 30% -24.3
CSAH 133 SPWEB340C 3 58-34 ¾ 18% -25.9
TH 61 Little Marais
SPWEB340C 3 58-34 ¾ 15% -22.1
TH 61 Lutsen SPWEB340B 3 58-28 ¾ 25% -23.2
TH 11 SPWEB340B 3 58-28 ¾ 11% -27
TH 29 SPWEB340C 3 58-34 ¾ 18% -20.5
TH 52 SPWEB440E 4 64-28 ¾ 15% -21.1
TH 62 SPWEB440C 4 58-34 ¾ 15% -18.7
TH 86 SPWEB440E 4 64-28 ¾ 25% -18.2
TH 5 SPWEA340C 3 58-34 ½ 20% -20.7
I-94 SPWEA540E 5 64-28 ½ 28% -21.3
CSAH 49 SPWEB440E 4 64-28 ¾ 25% -20.4
TH 10 SPWEB440B 4 58-34 ¾ 30% -23.3
CSAH 5 SPWEB540F 5 64-34 ¾ 15% -20.9
TH 95 SPWEB340C 3 58-34 ¾ 20% -20.1
4.3 ROUND ROBIN TESTING RESULTS AND DISCUSSIONS
Once all testing was completed by each lab, results were compiled for analysis. Figure 4-2 shows average fracture energy results for all 16 projects tested. The red horizontal line indicates 400 J/m2 fracture energy. It should be noted this fracture energy value of 400 J/m2 was determined from phase II of the pooled fund study as a minimum fracture energy value for projects of traffic level <10 Million ESALS (which account for a majority of projects in Minnesota). As the DCT Pilot Specification was planned to be used only on new or reconstruction projects with XX-34 binder, Round Robin results were separated by PG binder grade to investigate how XX-34 binders performed and if they met the 400 J/m2 threshold value. It should be noted that for Round Robin testing there was no inherent bias in average fracture energy results between labs. Figure 4-3 shows PG XX-34 binder average results and Figure 4-4 shows PG XX-28 average results. Results represent the average of a 4 specimen test set.
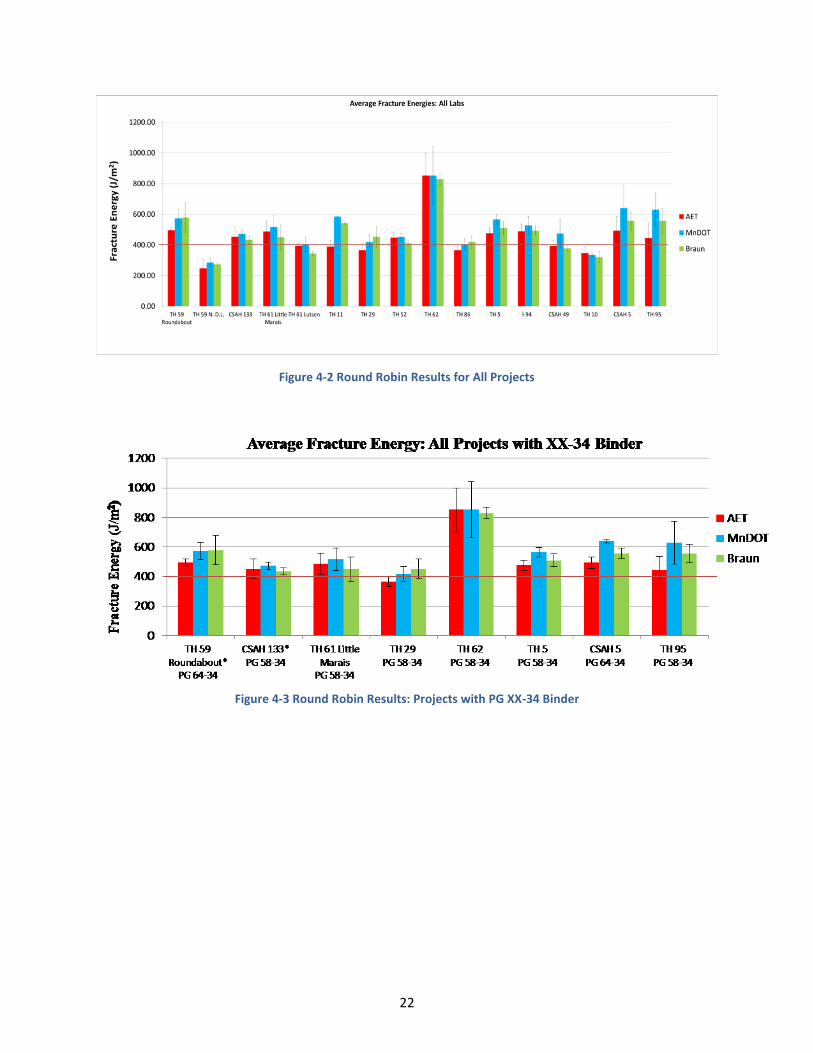
22
Figure 4-2 Round Robin Results for All Projects
Figure 4-3 Round Robin Results: Projects with PG XX-34 Binder

23
Figure 4-4 Round Robin Results: Projects with PG XX-28 Binder
0
100
200
300
400
500
600
700
TH 59 N. D.L.*PG 58-28
TH 61 Lutsen*PG 58-28
TH 11*PG 58-28
TH 52*PG 64-28
TH 86PG 64-28
I-94PG 64-28
CSAH 49*PG 64-28
TH 10*58-28
Fra
ctu
re E
ner
gy
(J
/m2)
Average Fracture Energies: All Projects with XX-28 Binder
AET
MnDOT
Braun
In some instances, not all four specimens in a test set successfully completed testing. Some projects had what is referred to as a specimen with “no post-peak data” which is a specimen that did not successfully complete a full testing cycle. It should be noted that testing is terminated once the load pulling a specimen in tension reaches a post-peak value of 0.1 kN. This is done to ensure a specimen does not completely separate into two halves, which would cause damage to the DCT testing equipment. A specimen with no post-peak data can be caused by several factors. One of these factors could be crack propagation during testing that intercepts a large piece of aggregate or RAP and causes the load pulling on the specimen to drop below the allowed post-peak value of 0.1 kN, which prematurely terminates testing. Another cause of specimens with no post-peak data are specimens tested at a temperature very close to the glass transition temperature of the asphalt binder (typically close to the low temperature PG grade of the binder, for example a XX-28 binder tested at -27°C), creating a very brittle specimen with an uncontrolled crack propagations during the test.
As specimens with no post-peak data did not successfully complete testing, they were not used to calculate average fracture energy of that mix. Projects with specimens excluded during average fracture energy calculations can be seen in Table 4.2. It should be noted that Braun experienced a higher number of specimens excluded from calculations, followed by MnDOT and AET respectively. The notch preparation techniques used by the labs varied slightly. Through investigation of the test specimens it was found that the specimens tested by Braun had different procedure for notch cutting, this is further discussed in detail later in this memo. The different notch preparation technique could have contributed to higher number of specimens that experienced brittle failures in the test.
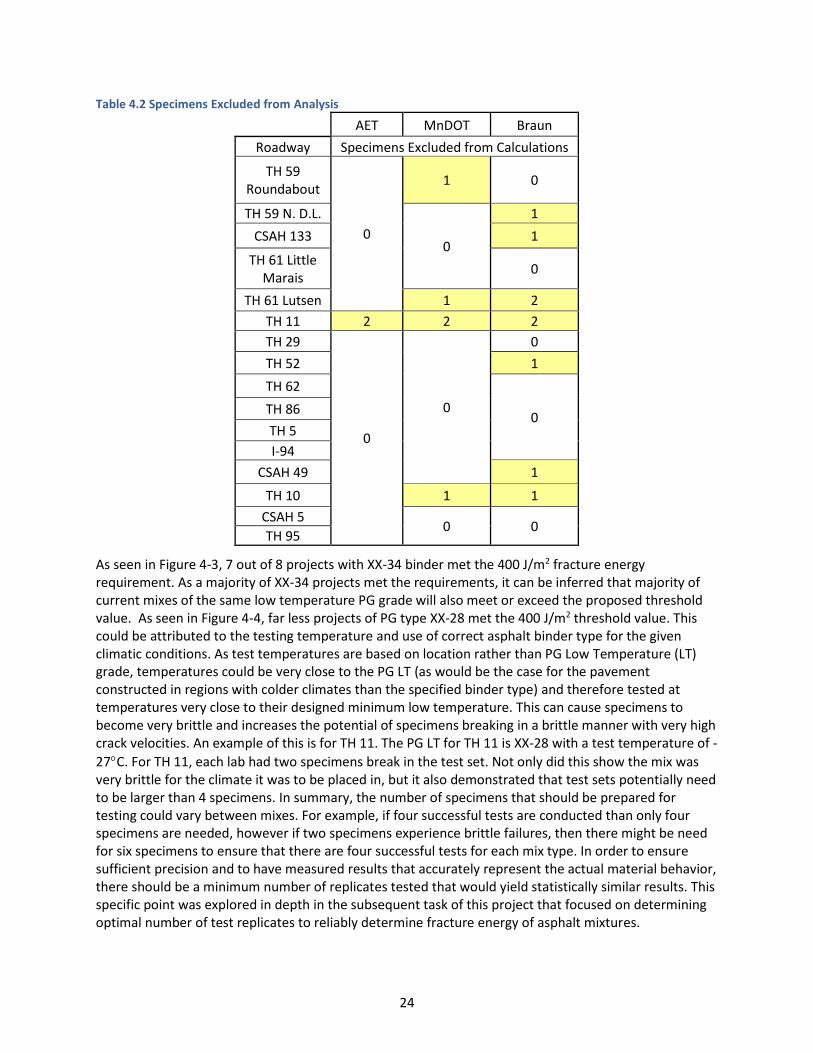
24
Table 4.2 Specimens Excluded from Analysis
AET MnDOT Braun
Roadway Specimens Excluded from Calculations
TH 59 Roundabout
0
1 0
TH 59 N. D.L.
0
1
CSAH 133 1
TH 61 Little Marais
0
TH 61 Lutsen 1 2
TH 11 2 2 2
TH 29
0
0
0
TH 52 1
TH 62
0 TH 86
TH 5
I-94
CSAH 49 1
TH 10 1 1
CSAH 5 0 0
TH 95
As seen in Figure 4-3, 7 out of 8 projects with XX-34 binder met the 400 J/m2 fracture energy requirement. As a majority of XX-34 projects met the requirements, it can be inferred that majority of current mixes of the same low temperature PG grade will also meet or exceed the proposed threshold value. As seen in Figure 4-4, far less projects of PG type XX-28 met the 400 J/m2 threshold value. This could be attributed to the testing temperature and use of correct asphalt binder type for the given climatic conditions. As test temperatures are based on location rather than PG Low Temperature (LT) grade, temperatures could be very close to the PG LT (as would be the case for the pavement constructed in regions with colder climates than the specified binder type) and therefore tested at temperatures very close to their designed minimum low temperature. This can cause specimens to become very brittle and increases the potential of specimens breaking in a brittle manner with very high crack velocities. An example of this is for TH 11. The PG LT for TH 11 is XX-28 with a test temperature of -
27C. For TH 11, each lab had two specimens break in the test set. Not only did this show the mix was very brittle for the climate it was to be placed in, but it also demonstrated that test sets potentially need to be larger than 4 specimens. In summary, the number of specimens that should be prepared for testing could vary between mixes. For example, if four successful tests are conducted than only four specimens are needed, however if two specimens experience brittle failures, then there might be need for six specimens to ensure that there are four successful tests for each mix type. In order to ensure sufficient precision and to have measured results that accurately represent the actual material behavior, there should be a minimum number of replicates tested that would yield statistically similar results. This specific point was explored in depth in the subsequent task of this project that focused on determining optimal number of test replicates to reliably determine fracture energy of asphalt mixtures.

25
The average peak load for each project can be seen in Figure 4-5. A bias in the results from Braun can be observed with consistently higher values for maximum load, the MnDOT and AET results following this trend in the respective order. After reviewing testing and fabrication methods, one difference between Braun and the other testing labs dealt with cutting of the notch. Both AET and MnDOT OMRR had cut 100% of the notch with a band saw resulting in a notch ≤ 1.5 mm in width. An alternative method of notch fabrication used by Braun and allowed by ASTM D7313-MnDOT Modified states “To expedite fabrication, a larger notch width can be used to cut up to 90% or notch length with the remaining cut being 1.5 mm (0.06 in.) in width”. In some specimens the 10% of the notch cut by a smaller band saw resulted in the end of the notch being skewed or deviated, as seen in Figure 4-6. This difference in notch fabrication could explain higher peak load results. The size and angle of notch is very important for any fracture test. Any deviation in notch or blunting of notch (larger width at the notch tip) typically results in greater strain energy to be stored in specimen prior to mobilization of the energy in formation of crack through crack propagation. The probability of brittle fracture in specimen increases substantially due to presence of blunt notch or due to deviation of notch. On basis of the results obtained from this study, for future testing to reduce fabrication variables between labs and technicians, all notches will be required to be ≤ 1.5 mm in width for 100% of notch length.
Figure 4-5 Peak Loads from Round Robin Results of All Labs

26
Figure 4-6 Typical Notch Fabrication by Braun Intertec (left) and AET (right)
4.4 AGING STUDY
An experimental study on aging of asphalt mixtures was developed in order to further investigate results seen in a previous study conducted in 2013. The DCT Low Temperature Fracture Testing Pilot Project was a study consisting of DCT specimens tested at both mix design and production on 5 projects throughout the state. It was found that a noticeable drop in fracture energy between mix design and production occurred in 4 of the 5 projects. It should be noted that the project with no drop in fracture energy from mix design to production did not have specimens tested during mix design.
As part of the current project an evaluation was conducted, referred to herein as the Aging Study, on mixes from 11 projects throughout the state. The goal was to procure specimens at mix design, production (re-heated and non re-heated), and post-production (field cores) to further investigate any decrease in fracture energy between mix design and production stages, as was found in 2013. Four specimens from each stage were fabricated and all testing was conducted by MnDOT OMRR staff.
Mix design specimens were supplied to MnDOT from each respective contractor. At production, mix was collected by the contractor and it was requested that four specimens be compacted immediately after sampling, accounting for four non-reheated specimens. Remaining loose mix collected at the same time as the non-reheated specimens was saved and obtained by MnDOT to be re-heated and compacted at a later date. This was done to investigate possible effects on facture energy caused by reheating material after collection. The location where production mix was collected was marked by the contractor for MnDOT staff to later obtain field cores.
Out of 11 round-robin testing projects, specimens were collected at mix design, production, and post-production from 6 projects. These include CSAH 133, TH 61 Lutsen, TH 65, TH 62, TH 86, and CSAH 3. Results of all tests are detailed in the following sections.
4.4.1 Mix Design Specimens
For mix design, all but one project’s test set consisted of 4 specimens. TH 61 Lutsen consisted of 5 specimens tested. Fracture energy at mix design for all three PG XX-34 projects met and exceeded the 400 J/m2 threshold value. For PG XX-28 projects, only one out of four projects met 400 J/m2. All projects

27
except TH 61 Lutsen and CSAH 3 had all specimens successfully complete testing. One specimen had no post-peak data out of the 5 specimen test set for TH 61 Lutsen and three out of 4 specimens for CSAH 3 had no post-peak data. The results are shown in Figure 4-7.
Figure 4-7 Aging Study Mix Design Specimen Average Fracture Energy Results
0
100
200
300
400
500
600
700
800
900
TH 59Roundabout
PG 64-34
CSAH 133PG 58-34
TH 61 LutsenPG 58-28
TH 65PG 58-28
TH 62PG 58-34
TH 86PG 64-28
CSAH 3PG 58-28
Fra
ctu
re E
ner
gy (
J/m
2)
4.4.2 Reheat Specimens
For reheated specimens, a majority of projects had test sets of 5 specimens, with CSAH 133 (8 specimens), TH 61 Lutsen (4 specimens), and CSAH 3 (4 specimens) having varying test set numbers. TH 61 Lutsen, TH 65, and CSAH 3 had one specimen with no post-peak data and TH 59 experience 2 specimens with no post-peak data.
The results for reheated specimens are shown Figure 4-8. Out of the projects of PG type XX-34, two of the three exceeded 400 J/m2 while TH 29 was very close with fracture energy of 395 J/m2. Two out of five projects of PG type XX-28 exceeded 400 J/m2.

28
Figure 4-8 Aging Study Reheat Specimen Average Fracture Energy Results
0
100
200
300
400
500
600
700
800
900
1000
TH 59 N. D.L.PG 58-28
CSAH 133PG 58-34
TH 61 LutsenPG 58-28
TH 65PG 58-28
TH 29PG 58-34
TH 62PG 58-34
TH 86PG 64-28
CSAH 3PG 58-28
Fra
ctu
re E
ner
gy (
J/m
2)
4.4.3 Non-Reheat Specimens
For non-reheated specimens, test sets varied from four (TH 59 Roundabout, CSAH 133, TH 11, TH 65, TH 62, TH 86, and CSAH3), five (TH 59 N.D.L. and TH 29), and seven (TH 61 Little Marais and TH 61 Lutsen). Of those test sets, CSAH 133, TH 61 Little Marais, and TH 11 had 1 specimen that had no post-peak data, TH 59 N.D.L. had two specimens with no post-peak data, CSAH 3 had three with no post-peak data, and TH 61 Lutsen had 5 specimens with no post-peak data.
The results are shown in Figure 4-9. Of the projects of PG type XX-34, four of five averaged above 400 J/m2. Of projects PG type XX-28, two of six projects averaged above 400 J/m2.

29
Figure 4-9 Aging Study Non-Reheat Specimen Average Fracture Energy Results
0
200
400
600
800
1000
1200
TH 59Roundabout
PG 64-34
TH 59 N. D.L.PG 58-28
CSAH 133PG 58-34
TH 61 LittleMarais
PG 58-34
TH 61 LutsenPG 58-28
TH 11PG 58-28
TH 65PG 58-28
TH 29PG 58-34
TH 62PG 58-34
TH 86PG 64-28
CSAH 3PG 58-28
Fra
ctu
re E
ner
gy (
J/m
2)
4.4.4 Field Core Specimens
The results from testing of field cored specimens are presented in this section. Since the field cores are not required for verification of production mix in the DCT Pilot Specification, results found in the aging study are primarily for comparisons purposes and to draw conclusions regarding effects of short term field aging on DCT fracture energies. These results were not used in the development of specification recommendations. The average fracture energies from field core specimens are presented in Figure 4-10.

30
Figure 4-10 Aging Study Field Core Specimen Average Fracture Energy Results
4.4.5 Comparison of Different Aging States
A summary of all average results from testing for the aging study is shown in Figure 4-11. The results from the aging study were considered in development of the DCT Pilot Specifications (discussed in Chapter 5 of this report).
Overall, no trend of decreasing fracture energy from mix design to production, as witnessed during the 2013 study, was found during the aging study conducted here. However, a trend between reheated and non-reheated samples was evident in 6 out of 8 projects. Non-reheated samples tended to have higher fracture energies than the re-heated samples. It is hypothesized that the reheating of material introduced additional aging of the mix, causing a decrease in fracture energy. For the 6 projects where non-reheated specimens had higher fracture energy, non-reheated specimens tested on average 11% higher than those reheated, as seen in Table 4.3. For the other two mixtures there was an increase in fracture energy after aging, while for one mixture the increase is relatively small (8%), one of the mixture showed a 52% increase. In general, it can be seen that 6 out of the 8 mixture show variation between reheat and no reheat samples to be smaller than or comparable to inherent fracture energy variability of material (typically in order of 10%). The two mixes with significantly different value of fracture energies before for non-reheat and reheat specimens indicate that continued evaluation of this topic is needed and future efforts should continue to undertake comparative testing of non-reheat and reheat specimens.

31
Figure 4-11 Aging Study Fracture Energy Comparisons for Mix Design, Non-reheat, and Reheat Specimens
0
100
200
300
400
500
600
700
800
900
1000
1100
TH 59Roundabout
PG 64-34
TH 59 N. D.L.PG 58-28
CSAH 133PG 58-34
TH 61 LittleMarais
PG 58-34
TH 61 LutsenPG 58-28
TH 11PG 58-28
TH 65PG 58-28
TH 29PG 58-34
TH 62PG 58-34
TH 86PG 64-28
CSAH 3PG 58-28
Fra
ctu
re E
ner
gy (
J/m
2)
Mix Design
No-Reheat
Reheats

32
Table 4.3 Average Percent Difference between Reheated and Non-reheated Specimens
4.5 SUMMARY
This chapter discussed results from a round robin style testing campaign and separate aging study in support of developing pilot DCT specifications for MnDOT. Key findings from the testing campaigns is as following:
Test sets larger than four specimens must be required to account for specimens that fail in brittle manner with no controlled crack growths past the peak load. Over the course of this project and through pilot implementation efforts, better recommendations for number of test specimens were be developed (discussed in later chapters).
A majority of asphalt mixtures with PG type XX-34 met and/or exceeded the 400 J/m2 threshold value in both the round robin and aging studies.
Full length (100 %) of the notch for DCT specimens should be cut using band saw,
resulting in a notch width of 1.5 mm.
Reheated production material resulted in lower fracture energy than non-reheated material in 6 out of 8 projects. Reheating potentially ages loose mixture and decreases fracture energy.
Drop in fracture energy between mix design and production as found in the 2013 study was not evident in the aging study undertaken in this project.
Project Non reheat Reheat % Difference
TH 59 N. D.L. PG 58-28
284.82 274.86 3%
CSAH 133 PG 58-34
625.78 436.95 30%
TH 61 Lutsen PG 58-28
373.59 304.94 18%
TH 65 PG 58-28
313.55 476.75 -52%
TH 29 PG 58-34
364.63 395.32 -8%
TH 62 PG 58-34
841.12 812.03 3%
TH 86 PG 64-28
456.41 424.23 7%
CSAH 3 PG 58-28
288.63 277.60 4%
Avg. % Difference between Non-reheated and Reheated Specimens
11%

33
CHAPTER 5: PILOT DCT SPECIFICATION DEVELOPMENT
5.1 INTRODUCTION
This chapter describes two activities conducted during the task 4 of the study, namely update of the DCT results database and development of the DCT performance specifications.
Chapter 4 of this report discussed the round-robin testing campaign as well as the aging study. The results from these efforts added 509 DCT results to the fracture energy database. The Round Robin Study data was statistically analyzed and used to determine a reproducibility limit between contractor and agency results. These findings are further discussed in this chapter. The pilot specification was implemented during the 2016 construction season.
5.2 STATISTICAL ANALYSIS TO RECOMMEND REPRODUCABILITY LIMITS FOR DCT FRACTURE ENERGY
A statistical analysis on the round robin dataset was completed to determine reproducibility limits for the DCT Pilot Specification. Reproducibility is the ability of a test or gage, used by multiple operators, to consistently reproduce the same measurement of the same part, under the same conditions. In the case of the DCT Pilot Specification, it was crucial to statistically determine reproducibility limits between separate labs to determine an acceptable range of differences in results between contractor and agency.
To determine between lab reproducibility limits, the Interlaboratory Testing Program from the Saskatchewan Ministry of Transportation Procedures Manual was used. This manual provides a step by step directions for statistically determining reproducibility and repeatability limits between labs for testing done on the same material with the same test procedure. In order to use this method, test results are required from at least 3 labs and at least 3 materials of varying nature must be tested. As 3 labs participated and 16 projects were tested with differing mix designs, aggregate, asphalt binder source, etc., this was a valid and practical application of the method.
Once all calculations were complete, reproducibility limits for all 16 projects were determined. Out of 16 projects, 8 had all 4 specimens survive the test at each lab. Specimens that survive DCT testing are defined as not breaking before testing is completed. A specimen breaking can be caused by several factors including crack propagation during testing that meets a large piece of aggregate or RAP or specimens tested at a temperature very close to the mixes low temperature PG Grade (ex. a XX-28
binder tested at -27C). To determine a reproducibility limit for the DCT Pilot Specification, only projects that had all 4 specimens survive testing at all labs were considered. These projects and their determined reproducibility limits can be seen in Table 5.1.

34
Table 5.1 Reproducibility Limits with all Specimens Surviving Test
Route Reproducibility Limit (J/m2)
TH 86 53.34
I-94 58.43
TH 5 63.95
TH 29 79.59
TH 61 Little Marais 88.30
CSAH 5 134.48
TH 95 142.54
TH 62 163.46
To determine a reproducibility limit for the DCT Pilot Specification, reproducibility results for projects with all 4 specimens surviving testing were sorted from least to greatest, as seen in Table 5.1. From the sorted list, TH 61 (Little Marais) was chosen as a project that best represented the median value within the group of results. To be conservative, the chosen reproducibility limit was rounded up to 90 J/m2. This value represents the allowable difference between contractor and agency DCT test results. Should the difference in results exceed 90 J/m2, the agency’s results will be the accepted value. It should be noted though that the contractor must still meet the minimum fracture energy threshold value based on the mix’s traffic level.
5.3 PILOT DCT SPECIFICATION
Based on past research as well as the results from the Round Robin repeatability study, a DCT Pilot Specification was developed for the 2016 construction season, which was used as a special provision to 2360 Plant Mixed Asphalt Pavement. This specification was used only on wearing course (top 4 inch of pavement), and only on projects with new construction or reconstruction. As only new or reconstruction projects were intending to use the pilot specification, the asphalt binder used on these projects were of type PG XX-34. As discussed in chapter 3, almost all projects from the Round Robin study containing PG XX-34 binder passed the required 400 J/m2 threshold. The 400 J/m2 minimum fracture energy value mixes must meet was recommended by the low-temperature cracking pooled fund study and is based on traffic level of the mix.
The DCT Pilot Special Provision can be found in Appendix B of this report. Key points in the pilot specification include:
DCT testing required at mix design and before initial production of the wearing course can begin.
Fracture energy requirements at mix design are dependent on the traffic level of mix and are higher than requirements at production.
o Level 2-3 mixes/PG XX-34 must meet 450 J/m2 o Level 4-5 mixes/PG XX-34 must meet 500 J/m2
Fracture energy requirements at production are dependent on traffic level of mix. o Level 2-3 mixes/PG XX-34 must meet 400 J/m2
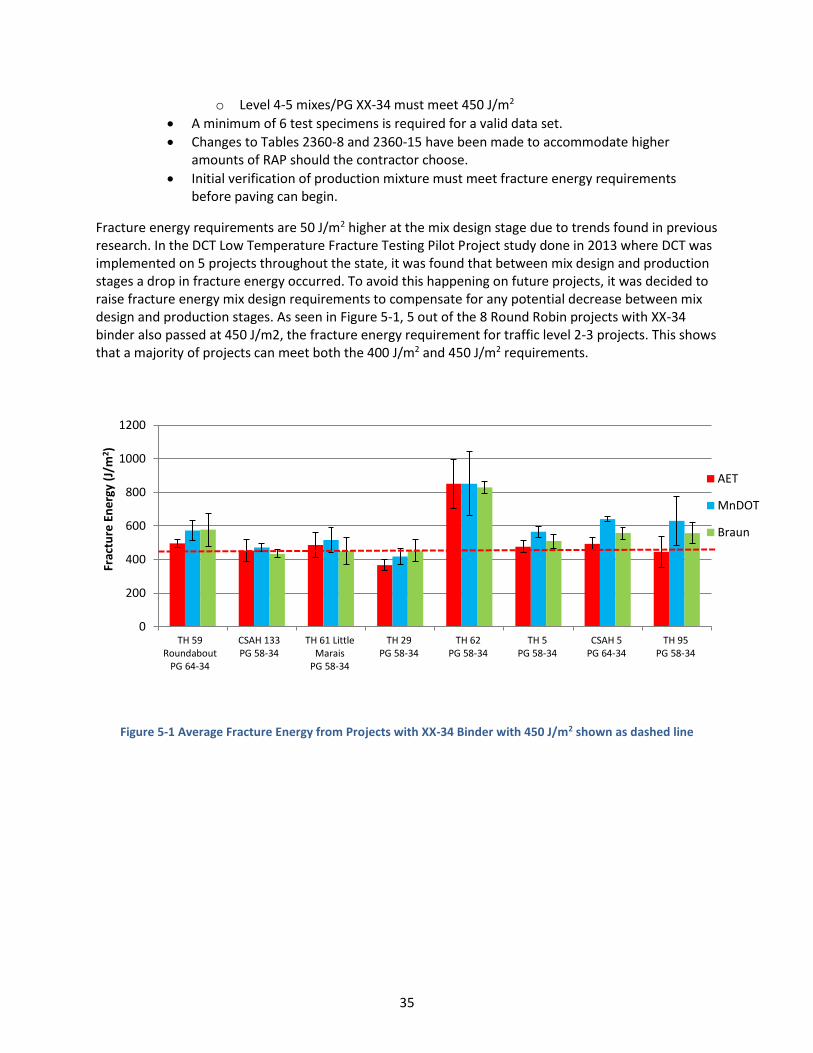
35
o Level 4-5 mixes/PG XX-34 must meet 450 J/m2
A minimum of 6 test specimens is required for a valid data set.
Changes to Tables 2360-8 and 2360-15 have been made to accommodate higher amounts of RAP should the contractor choose.
Initial verification of production mixture must meet fracture energy requirements before paving can begin.
Fracture energy requirements are 50 J/m2 higher at the mix design stage due to trends found in previous research. In the DCT Low Temperature Fracture Testing Pilot Project study done in 2013 where DCT was implemented on 5 projects throughout the state, it was found that between mix design and production stages a drop in fracture energy occurred. To avoid this happening on future projects, it was decided to raise fracture energy mix design requirements to compensate for any potential decrease between mix design and production stages. As seen in Figure 5-1, 5 out of the 8 Round Robin projects with XX-34 binder also passed at 450 J/m2, the fracture energy requirement for traffic level 2-3 projects. This shows that a majority of projects can meet both the 400 J/m2 and 450 J/m2 requirements.
Figure 5-1 Average Fracture Energy from Projects with XX-34 Binder with 450 J/m2 shown as dashed line
0
200
400
600
800
1000
1200
TH 59Roundabout
PG 64-34
CSAH 133PG 58-34
TH 61 LittleMarais
PG 58-34
TH 29PG 58-34
TH 62PG 58-34
TH 5PG 58-34
CSAH 5PG 64-34
TH 95PG 58-34
Frac
ture
En
erg
y (J
/m2 )
AET
MnDOT
Braun

36
CHAPTER 6: EFFECT OF MIX DESIGN PARAMETERS ON LOW TEMPERATURE CRACKING PERFORMANCE
6.1 INTRODUCTION
Mix specifiers and producers strive to design and produce mixtures that meet established threshold values for fracture energy by adjusting their mix design variables. Current adjustments are mainly employed on mix design variables that are included in the specification and controlled through current quality control and acceptance procedures. Due to lack of reliable guidance, the adjustment of mix design variables is usually a trial and error process. Therefore, this research effort was designed to obtain a better understanding on the topic to provide guidance to mix specifiers and producers on changes they should consider making on the composition of asphalt mixture to achieve specification requirements as it relates to fracture energy.
The objective of the research effort discussed in this chapter was to identify mix design variables that potentially affect the thermal cracking performance properties of asphalt mixtures. Databases developed by Minnesota Department of Transportation (MnDOT) with data from 90 mixtures were used to determine the statistical significance and correlation between common mix design variables, including recycled asphalt amount, mix volumetric properties and binder grade, to fracture energy.
6.2 MIX PARAMETERS
The master database comprises information categorized into three major parts: (1) mix design report (MDR), (2) test summary sheet (TSS) and, (3) DCT test data. MDR data consists of asphalt mix design information submitted to MnDOT for approval before placing mixtures in the field whereas the test summary sheet comprises data collected as part of QA process from samples collected to determine the acceptance of mixes during actual production. It should be noted that results based on analysis done on MDR data is not considered in drawing conclusions since the focus of testing in this project was on actual production mixtures that correspond to the data collected on TSS. DCT test data includes typical information collected during the test such as number of replicates, test temperature, replicate’s fracture energy, replicate peak load, average fracture energy and average peak load. Number of replicates tested for a specific mix range from 12 to 16. In this study, the average fracture energy corresponding to each mixture is used for the statistical analysis. Table 6.1 is presented to show the breadth of information available as part of MDR and TSS in the master database. It also displays the mix parameters obtained for this study from the database. A short description of the parameters follows.

37
Table 6.1 Mix Parameters in MDR and TSS
Mix Parameters
TSS MDR
Actual % RAP, Actual Adj. AFT, Actual VMA, Actual Binder Content (Pb), Effective
Binder Content (Pbe), Actual Field Test Air Voids
% RAP, Adj. AFT, VMA, VFA, Effective binder content, Dust-to-Binder Ratio, PG
grade
6.3 DATA EXTENT
The frequency distribution plot presented in Figure 6-1 depicts ranges of fracture energy values used in the study. This shows the wide range of fracture energy measurements used in the analysis and subsequently the increased confidence in the validity of the study’s conclusions.
Adjusted Asphalt Film Thickness (AFT) – determines the effective asphalt volume in asphalt mixtures. It depends on the aggregate surface area and bulk specific gravity of the mixture.
Air Void Level (AV) – Amount of air in between coated aggregate particles in the final compacted mixture.
o Design Air Void Level – Target air void specified during mix design. o Actual Air Void Level – Air void level determined based on data collected during
mix production or placement.
Voids in the mineral aggregate (VMA) – is the air void space that exist between aggregate particles including spaces filled with asphalt in a compacted mixture. It represents the total available space in a mixture to accommodate air void and asphalt.
Voids filled with asphalt (VFA)– represents the portion of space between aggregates that is filled with asphalt in a compacted mixture.
Percent binder – percentage of asphalt binder in a mixture.
Performance Grade (PG) – is a term used to categorize a binder based on the Superpave binder grading system. The system was originally developed in the early 1990’s during the Strategic Highway Research Program (SHRP). Binders are graded based on stated requirements at different testing temperatures.
PG low temperature (PGLT) – is the low temperature performance grade of a binder and the number corresponds to the allowable minimum pavement design temperature of the area the binder can be utilized.
PG high temperature (PGHT) – is the high temperature performance grade of a binder and the number indicates the average-seven-day maximum pavement design temperature of the area the binder can be utilized.
PG spread (PG) – the difference between the low and high temperature grade of a binder. This represents the actual range of temperature the binder can be used without compromising its performance.

38
Figure 6-1 Frequency Distribution Plot for Distribution of Fracture Energies in Database
To determine the effect of mix design variables on fracture energy, the DCT database developed in this project containing various information for 90 mixtures and their corresponding fracture energy measurement determined from approximately 1170 DCT tests is utilized. The data includes virgin asphalt content, total binder content, effective binder content, air void, recycled asphalt pavement amount, asphalt film thickness, PG low temperature, PG high temperature and PG spread. The DCT data is from testing conducted on production material that correspond to the data collected at construction stage. DCT test specimen production and testing is carried out following the test procedure of ASTM D7313-13/MnDOT Modified specification. Number of replicates tested for a specific mix range from 12 to 16. DCT test information available in the database includes number of replicates, test temperature, replicate’s fracture energy, replicate peak load, average fracture energy and average peak load. Table 6.2 is presented to show the breadth of information available as well as the mix design variables considered for the study.
Table 6.2 Overview of Mix Design Variables Used for the Study
Performance Criteria
Mix design variable Acronym Range of mix variable
Fracture Energy
Virgin asphalt content Pb, V 3-5%
Total binder content Pb 4-6%
Effective binder content Pbe 4.0-5.5%
Air voids AV 3-5%
Recycled asphalt pavement content % RAP 10 to 30%
Voids in the mineral aggregate VMA 13-16
Asphalt film thickness AFT 7-10
PG low temperature PGLT -22 to -34
PG high temperature PGHT 52 to 64
PG spread (PGHT-PGLT) PG 86 to 98
Nominal maximum aggregate size NMAS 9.5, 12.5mm

39
6.4 DATA ANALYSIS METHODOLOGY
This section describes the data collection approach and statistical analysis performed to determine the effect of different mix variables on the thermal cracking performance parameters. The mix description in the database is used to identify the different mixtures and map mix variable and test information to a specific mix. For each mixture, the average values of the parameters were calculated and used for analysis. The statistical analysis is done in three phases described below using JMP® statistical software package.
6.4.1 Explore and Remove Outliners
Exploring and removing outliers is an important part of statistical analysis particularly due to anticipated errors during data measurement and collection. The step is vital as inclusion of outliers in a statistical analysis could cause bias in the conclusions drawn from the analysis. In this study, JMP® is used to locate the outliers by employing the Mahalanobis distance approach. A recent study by Nemati and Dave (2017) used similar approach for removing outliers in complex modulus datasets. Outliers were consequently removed from the input file. It should be noted that the fracture energy measurements obtained from MnDOT database contained only three outliers. The presence of the small number outliers confirms that low variability was encountered during DCT testing.
6.4.2 Determine Significance of Mix Design Variables
Step wise regression analysis was used to evaluate the significance of different mix design variables on thermal cracking properties of asphalt mixture. The analysis makes inference about a larger population to recognize mix design variables with a statistically significant effect on fracture energy. This is accomplished by performing stepwise regression analysis and assessing p-values. The p-value provides information on the probability of the existence of relationship between different mix design variables and thermal cracking properties as it relates to fracture energy. The conclusions drawn from this analysis will inform mix specifiers and producers about the most important mix design variables related to thermal cracking properties.
Throughout the analysis, the null hypothesis assumes that there is no statistically significant relationship between the variables and the thermal cracking evaluation parameter. For this study, the common practice of utilizing p-value < 0.05 is adopted and the null hypothesis is rejected for a p-value <0.05 indicating the parameter has contributed significantly to the thermal cracking performance of a mixture. In other words, the relatively low p-value indicates the presence of a mathematical relationship between the mix parameter and fracture property such that a linear function of this parameter can predict the fracture property of the mixture within a 95% confidence level of the parameter data.
6.4.3 Determine Pearson Correlation Coefficient
In this study, the Pearson correlation is used to understand how the thermal cracking properties of mixtures, specifically fracture energy, are affected by changes in mix design variables. The Pearson correlation factor is the most widely known type of correlation and is used to measure the degree of relationship between linearly related variables and the direction of the relationship based on the data provided. Based on the strength of the relationship, the value of the correlation coefficient varies between +1 and -1. A correlation of +1 indicates a linear positive relationship whereas -1 indicates a linear negative (inverse) relationship between the variables. As the correlation factor moves towards

40
zero from both directions, the relationship becomes weaker. The analysis is done in JMP® by pairing the results of a mix variable to the corresponding fracture energy measurement. Based on the correlation factor obtained, the relationship is defined as weak/strong and the direction of the impact is identified.
6.5 RESULTS AND DISCUSSION
6.5.1 Statistical Significance between Mix Variables and Fracture Energy
The p-values from stepwise regression analysis corresponding to different mix variables and fracture energy are presented in Table 6.3. The p-values indicate whether a statistically significant relationship between mix design variables and fracture energy exists (designated as “Yes”) or not (designated as “No”). Overall, the p-values corresponding to mix design variables were low indicating a statistically significant relationship between the mix design variables and fracture energy. The exception to this are recycled asphalt content (p=0.093) and nominal maximum aggregate size (p=0.830) which have a higher p-value than the significance threshold. It should be noted that the majority of mixes in the database have 30% recycled binder content and the high p-value observed could be artifact of this fact. Based on the result, it is concluded that mix specifiers and producers can consider changing PG low and high temperature grades, PG spread, voids in the mineral aggregate, asphalt film thickness, air void, virgin asphalt content, effective binder content and total binder content to adjust mixes to achieve set threshold values effectively.
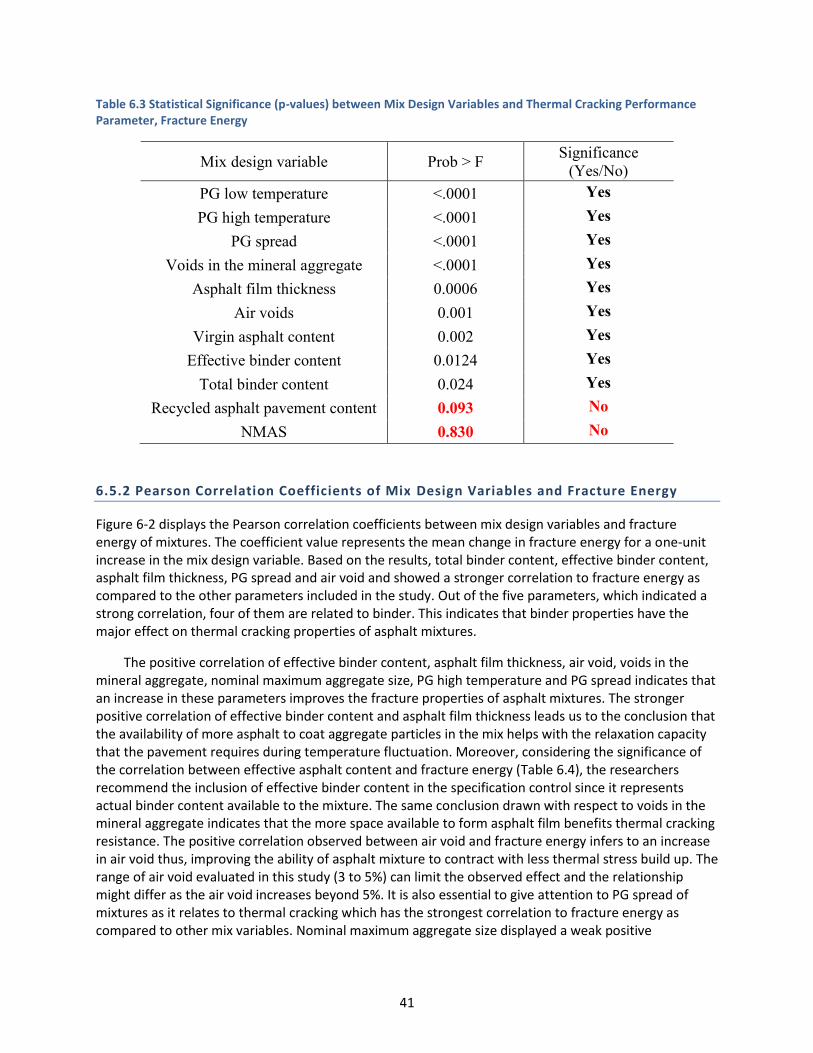
41
Table 6.3 Statistical Significance (p-values) between Mix Design Variables and Thermal Cracking Performance Parameter, Fracture Energy
Significance Mix design variable Prob > F
(Yes/No)
PG low temperature <.0001 Yes
PG high temperature <.0001 Yes
PG spread <.0001 Yes
Voids in the mineral aggregate <.0001 Yes
Asphalt film thickness 0.0006 Yes
Air voids 0.001 Yes
Virgin asphalt content 0.002 Yes
Effective binder content 0.0124 Yes
Total binder content 0.024 Yes
Recycled asphalt pavement content 0.093 No
NMAS 0.830 No
1
6.5.2 Pearson Correlation Coefficients of Mix Design Variables and Fracture Energy
Figure 6-2 displays the Pearson correlation coefficients between mix design variables and fracture energy of mixtures. The coefficient value represents the mean change in fracture energy for a one-unit increase in the mix design variable. Based on the results, total binder content, effective binder content, asphalt film thickness, PG spread and air void and showed a stronger correlation to fracture energy as compared to the other parameters included in the study. Out of the five parameters, which indicated a strong correlation, four of them are related to binder. This indicates that binder properties have the major effect on thermal cracking properties of asphalt mixtures.
The positive correlation of effective binder content, asphalt film thickness, air void, voids in the mineral aggregate, nominal maximum aggregate size, PG high temperature and PG spread indicates that an increase in these parameters improves the fracture properties of asphalt mixtures. The stronger positive correlation of effective binder content and asphalt film thickness leads us to the conclusion that the availability of more asphalt to coat aggregate particles in the mix helps with the relaxation capacity that the pavement requires during temperature fluctuation. Moreover, considering the significance of the correlation between effective asphalt content and fracture energy (Table 6.4), the researchers recommend the inclusion of effective binder content in the specification control since it represents actual binder content available to the mixture. The same conclusion drawn with respect to voids in the mineral aggregate indicates that the more space available to form asphalt film benefits thermal cracking resistance. The positive correlation observed between air void and fracture energy infers to an increase in air void thus, improving the ability of asphalt mixture to contract with less thermal stress build up. The range of air void evaluated in this study (3 to 5%) can limit the observed effect and the relationship might differ as the air void increases beyond 5%. It is also essential to give attention to PG spread of mixtures as it relates to thermal cracking which has the strongest correlation to fracture energy as compared to other mix variables. Nominal maximum aggregate size displayed a weak positive

42
correlation. This could be due to use of fracture energy only to evaluate wear courses that resulted in only two nominal maximum aggregate size levels (9.5 and 12.5mm) to be included in the analysis.
The statistical analysis performed indicated that total virgin binder, total binder content, recycled asphalt content, and PG low temperature grade have a negative impact on fracture energy implying an increase in these variables results in a potential for thermal cracking related problems. While the total binder contents (Pb and Pb, v) have negative effect, the effective binder content (Pbe) has positive effect on fracture energy. The authors believe that the presence of binder from RAP in the total binder content could be the cause for the observed negative impact of total binder content on fracture energy. The total virgin binder accounts for absorbed asphalt in addition to the effective asphalt content. In most cases increment in absorbed asphalt content is related to finer aggregate which is hypothesized as the reason for the impact of virgin binder on fracture energy in a negative manner. The effective binder content is the available binder content in the mixture and having positive contribution to thermal cracking performance. Negative effect of RAP amount agrees with other studies showing aged binder from RAP having negative effects on thermal cracking performance. Negative effect of increasing PG low temperature grade is expected, as PGLT lowers (a better low temperature grade) the fracture energy improves.
Figure 6-2 Pearson Correlation Coefficient between Mix Variables and Fracture Energy
-0.35
-0.24-0.18 -0.18
0.04
0.170.22
0.27 0.310.37
0.46
-0.6
-0.4
-0.2
0
0.2
0.4
0.6
Pb PGLT % RAP Pb, v NMAS PGHT VMA AFT AV Pbe ΔPG
Pears
on
Corr
elati
on
Coef
fici
ent
Mix Design Variable

43
Table 6.4 Significance of Pearson Correlation Coefficient between Mix Design Variables and Fracture Energy
Mix Variables Acronym Correlation Probability
PG spread PG 0.0003
Total Binder Content Pb 0.017
Effective binder content Pbe 0.018
Air void AV 0.038
Asphalt film thickness AFT 0.072
PG low temperature PGLT 0.070
Voids in the mineral aggregate VMA 0.151
PG high temperature PGHT 0.199
Recycled asphalt pavement content % RAP 0.233
Virgin asphalt content Pb, V 0.239
Nominal maximum aggregate size NMAS 0.790
1
In Table 6.5 accepted basic assumptions regarding the effect of each of the mix variables on thermal cracking performance are compared to the implication from the study with respect to fracture energy and Glover-Rowe parameter. This is particularly important to identify theories that are perceived incorrectly and summarize the findings from the study based on an extensive statistical analysis to understand the effect of mix variables on thermal cracking performance of asphalt mixtures.

44
Table 6.5 Comparison of Accepted Assumptions and Study Implication
PG Spread
Thermal cracking resistance is expected to improve with increase in PG spread. A higher PG spread could be partly attributed to a low PGLT grade which is associated to better performance in thermal cracking
Met assumption. PG spread showed a positive correlation to fracture energy. This conclusion is accompanied by a low correlation probability indicating higher confidence in the result
PGLT A lower binder grade is specified to ensure good thermal cracking performance
Met assumption. A lower binder grade is associated to better thermal cracking performance
PGHT
For binders with the same PGLT grade, a binder with a lower PGHT grade is expected to be softer and as a result is anticipated to perform better in the field
Did not meet assumption. The result showed that an increase in PGHT grade improves thermal cracking performance. This relationship was found less reliable and further study is needed to verify the conclusion
RAP content An increase in RAP content is expected to impact the thermal cracking resistance in a negative manner due to aged binder from RAP
Met assumption. RAP content showed a negative correlation to fracture energy
Total and virgin binder content
In general, an increase in total and virgin binder content is expected to increase the thermal cracking performance by increasing the relaxation capacity of asphalt mixture
Did not meet assumption. Both total and virgin binder content showed a negative correlation to fracture energy. For total binder content, this could be due to the aged binder from RAP that is accounted in the total binder content. The binder from RAP could have a counter effect and as a result could result in an overall negative implication on thermal cracking performance. The correlation probability for virgin asphalt content indicated low reliability of the finding. Therefore, further study is needed to validate the result
Effective binder content, asphalt film thickness and voids in the mineral aggregate
The availability of more asphalt to coat aggregate particles in the mix due to increase in effective binder content, asphalt film thickness and voids in the mineral aggregate is expected to help with relaxation property resulting in better thermal cracking performance
Met assumption. The result indicated the positive impact of an increase in these variables on thermal cracking performance. The result from the correlation probability showed the more confidence of the conclusion drawn as it relates to effective binder content and asphalt film thickness

45
6.6 SUMMARY
This chapter of the project discusses a statistical investigation into the effects of different mix design variables on thermal cracking performance properties of asphalt mixtures in terms fracture energy. Primary objective of this work is to provide insight and tools to mix designers and specifiers in terms of effects of mix properties on performance properties. Fracture energy provides a measure of crack resistance when thermal stresses approaches and exceeds material strength. This effort utilized 90 mixtures from the DCT database. A stepwise regression analysis, which accounts for a broader population, is used to determine statistical significance between the different mix variables and fracture energy. The Pearson correlation coefficient was determined to quantify and gain insight to the direction and extent of effect that a mix variable would have on fracture energy. Based on the results of this study, the following conclusions can be drawn:
• The p-values from stepwise regression analysis indicated a significant relationship between fracture energy and PG low temperature grade, PG high temperature grade, PG spread, voids in the mineral aggregate, asphalt film thickness, air void, virgin asphalt content, effective binder content and total binder content. This indicates that manipulation of any of these parameters could have a potential effect on thermal cracking performance. The extent of the impact is variable and assessed through correlation analysis.
• The result from Pearson correlation coefficient indicated stronger correlation of binder related mix design variables (total binder content (negative), effective binder content (positive), asphalt film thickness (positive), PG spread (positive)) to fracture energy as compared to the other mix design variables. This verifies the vital role binder plays in thermal cracking performance.
• Effective binder content, asphalt film thickness, air void, voids in the mineral aggregate, PG high temperature and PG spread showed a positive correlation to fracture energy implying an increase in one or more of these variables is expected to result in improved thermal cracking performance. However, a negative correlation is observed between total virgin binder, total binder content, RAP content, and low temperature grade with fracture energy. The correlation probability corresponding to PG spread, total binder content, effective binder content and air void were found to be lower than the threshold, implying that these variables can be employed confidently to obtain required fracture energy level. The results support consideration for using effective binder content to improve thermal cracking performance as opposed to total binder content.

46
CHAPTER 7: DETERMINATION OF SUITABLE NUMBER OF REPLICATES FOR DCT FRACTURE ENERGY TEST
7.1 INTRODUCTION
MnDOT is moving towards incorporating DCT test as one of the requirements in the specification to evaluate low temperature cracking resistance of asphalt mixtures. This is accomplished by measuring fracture energy of asphalt mixtures and comparing the values to the minimum threshold value. The current specification requires DCT testing to be performed during mix design and mix design is accepted if meets minimum fracture energy of requirement of 450 J/m2 for traffic levels 1, 2 and 3 or 500 J/m2 for levels 4 and 5. Similarly, during production phase, mix is required to meet fracture energy of 400 J/m2 for traffic levels 1, 2 and 3 or 450 J/m2 for levels 4 and 5. Due to the variability associated with all mechanical tests on heterogeneous materials such as asphalt mixtures, typically a certain number of replicates are tested and the results from the replicates are averaged to increase the confidence in the conclusion drawn from the experiment. While it is known that increasing the number of replicates improves the precision in the result and helps to detect outliners, the increased time and effort required to perform the experiments constrain the number of replicates in most studies. Therefore, when establishing the number of replicates required for a certain test the effort required for carrying out the test should be balanced against the quality of data.
With this aim, the research activities discussed in this chapter undertook an effort to determine the number of replicates required to obtain an accurate and precise fracture energy measurement. The study seeks to establish the number of replicates required during DCT testing to obtain a fracture energy measurement that is representative of the mixture and unbiased in terms of results from small enough sample size. It strives to reduce measurement variability to an acceptable level and enable producers and agencies to be confident when they reject or accept mixes based on measurements from the test. In this study, measurements based on different number of replicates were assessed to observe their impact on the conclusion reached based on the experimental result. The outcome from this study were used to make decision on the number of replicates which has been subsequently incorporated into the MnDOT modified DCT performance specifications.
7.2 TERMINOLOGY
The following terminologies are used in the discussion as defined below based on a discussion with MnDOT.
• The term “Pail Set” is used to refer all specimens produced from mixture in a bucket (pail)
• “Pail Replicates” refers to individual specimens produced from a pail of mixture (typically four “Pail Replicates” are produced from a pail of mixture)
• “Specimen” generically refers to any individual specimen produced from any pail
Overall, 23 different mixtures were used for this study. A total of four pails were used to produce four Pail replicates from each, overall producing 16 specimens for each mixture type. DCT testing was conducted on all 368 (16×23) specimens to determine the fracture energy of the mixtures. Different investigations explained in detail below were performed to determine the number of replicates required to improve measurement variation and increase measurement precision.

47
7.3 MEASUREMENT VARIABILITY
A total of 16 replicates (4 Pail Sets, 1 Pail Set = 4 Pail Replicate) were tested for each mixture to determine their respective fracture energy. Pail replicates were combined in different ways to produce 4 (individual pail), 8 (combining two pails) and 12 (combining 3 pail) replicates. This is done to simulate different replicate scenarios and examine how measurement variability changes based on the number of total replicates tested for a mixture. The three combinations used to produce 4, 8 and 12 replicates for a specific mix are explained below; the procedure is illustrated in Figure 7-1.
Figure 7-1 Different Pail Combinations Representing 4, 8 and 12 Replicate Scenarios
Using the different pail combinations, the percent difference between the low and high fracture energy was calculated for each scenario of 4, 8 and 12 replicates, Equation 1. This is done to obtain the maximum difference between replicates for one, two and three pail combinations. It should be noted that the different pail combinations produce different sets corresponding to 4, 8 and 12 replicates for a specific mix. The value from each set is averaged for each mix to allow comparison between the maximum difference value for different pail combinations.
𝑀𝑎𝑥𝑖𝑚𝑢𝑚 𝐷𝑖𝑓𝑓𝑒𝑟𝑒𝑛𝑐𝑒 = 𝐻𝑖𝑔ℎ 𝐺𝑓𝐴𝑣𝑔
− 𝐿𝑜𝑤 𝐺𝑓𝐴𝑣𝑔
𝐻𝑖𝑔ℎ 𝐺𝑓𝐴𝑣𝑔 [1]
Figure 7-2 displays the maximum difference for one, two and three pails combinations corresponding to the 23 mixtures. The maximum difference ranges from 3 to 25% for one pail combination (4 replicate), 2 to 14% for two pail combination (8 replicates) and 1 to 9% for the three pail combination (12 replicates). The result indicated that the maximum difference between replicates reduces as the number of replicates increase from 4 to 12. This in general indicates testing higher number replicates results in reduction of overall difference between replicate measurements.
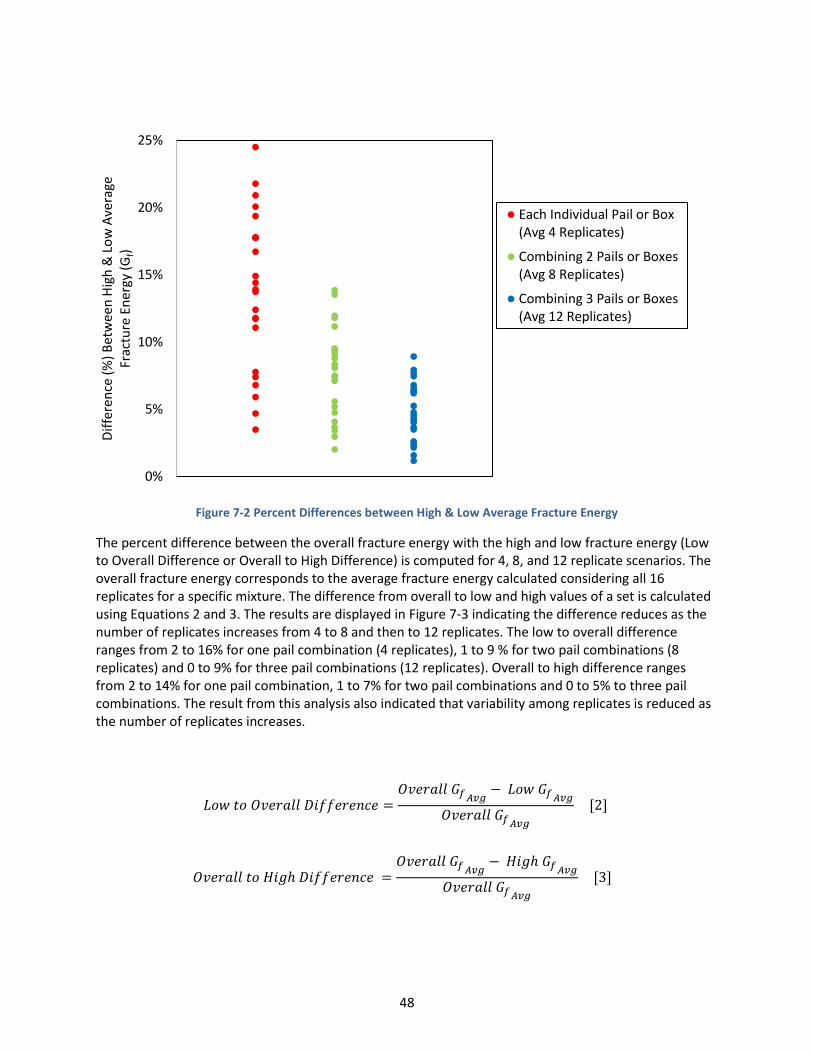
48
Figure 7-2 Percent Differences between High & Low Average Fracture Energy
0%
5%
10%
15%
20%
25%
Dif
fere
nce
(%
) B
etw
een
Hig
h &
Lo
w A
vera
ge
Frac
ture
En
ergy
(G
f)
Each Individual Pail or Box(Avg 4 Replicates)
Combining 2 Pails or Boxes(Avg 8 Replicates)
Combining 3 Pails or Boxes(Avg 12 Replicates)
The percent difference between the overall fracture energy with the high and low fracture energy (Low to Overall Difference or Overall to High Difference) is computed for 4, 8, and 12 replicate scenarios. The overall fracture energy corresponds to the average fracture energy calculated considering all 16 replicates for a specific mixture. The difference from overall to low and high values of a set is calculated using Equations 2 and 3. The results are displayed in Figure 7-3 indicating the difference reduces as the number of replicates increases from 4 to 8 and then to 12 replicates. The low to overall difference ranges from 2 to 16% for one pail combination (4 replicates), 1 to 9 % for two pail combinations (8 replicates) and 0 to 9% for three pail combinations (12 replicates). Overall to high difference ranges from 2 to 14% for one pail combination, 1 to 7% for two pail combinations and 0 to 5% to three pail combinations. The result from this analysis also indicated that variability among replicates is reduced as the number of replicates increases.
𝐿𝑜𝑤 𝑡𝑜 𝑂𝑣𝑒𝑟𝑎𝑙𝑙 𝐷𝑖𝑓𝑓𝑒𝑟𝑒𝑛𝑐𝑒 =𝑂𝑣𝑒𝑟𝑎𝑙𝑙 𝐺𝑓𝐴𝑣𝑔
− 𝐿𝑜𝑤 𝐺𝑓𝐴𝑣𝑔𝑂𝑣𝑒𝑟𝑎𝑙𝑙 𝐺𝑓𝐴𝑣𝑔
[2]
𝑂𝑣𝑒𝑟𝑎𝑙𝑙 𝑡𝑜 𝐻𝑖𝑔ℎ 𝐷𝑖𝑓𝑓𝑒𝑟𝑒𝑛𝑐𝑒 =𝑂𝑣𝑒𝑟𝑎𝑙𝑙 𝐺𝑓𝐴𝑣𝑔
− 𝐻𝑖𝑔ℎ 𝐺𝑓𝐴𝑣𝑔
𝑂𝑣𝑒𝑟𝑎𝑙𝑙 𝐺𝑓𝐴𝑣𝑔 [3]
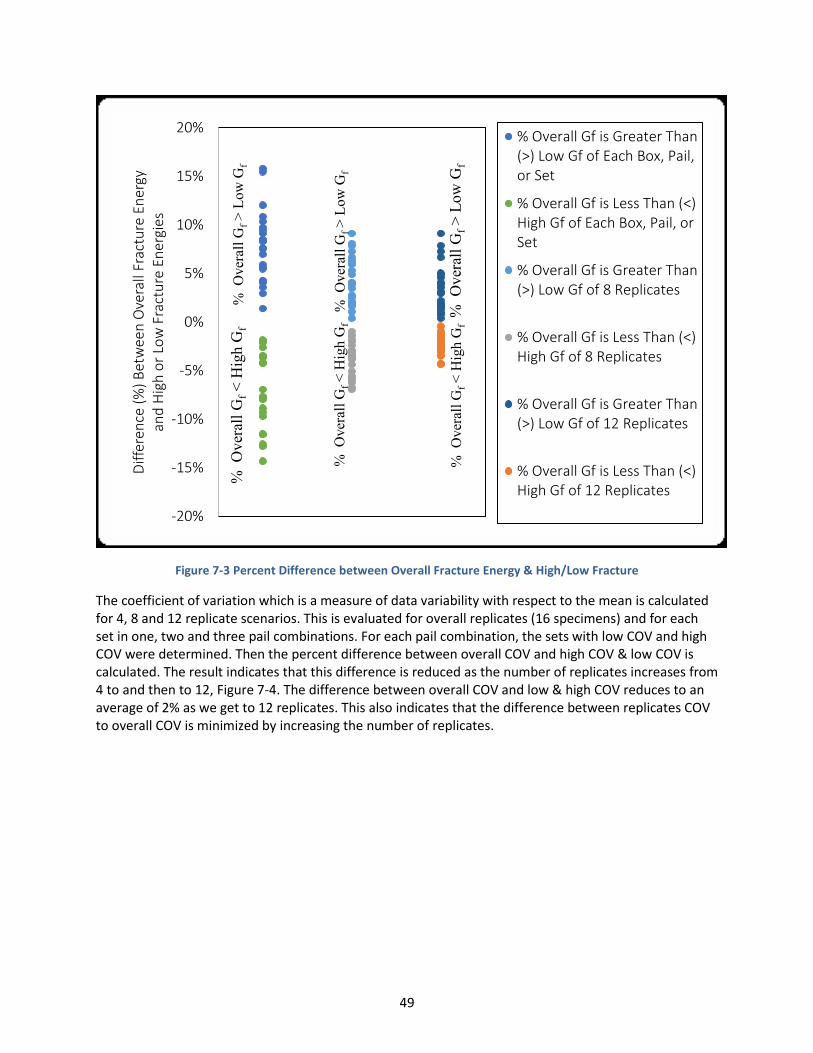
49
Figure 7-3 Percent Difference between Overall Fracture Energy & High/Low Fracture
-20%
-15%
-10%
-5%
0%
5%
10%
15%
20%D
iffe
ren
ce (
%)
Bet
wee
n O
vera
ll Fr
actu
re E
ner
gy
and
Hig
h o
r Lo
w F
ract
ure
En
ergi
es
% Overall Gf is Greater Than(>) Low Gf of Each Box, Pail,or Set
% Overall Gf is Less Than (<)High Gf of Each Box, Pail, orSet
% Overall Gf is Greater Than(>) Low Gf of 8 Replicates
% Overall Gf is Less Than (<)High Gf of 8 Replicates
% Overall Gf is Greater Than(>) Low Gf of 12 Replicates
% Overall Gf is Less Than (<)High Gf of 12 Replicates
% O
ver
all
Gf>
Lo
w G
f
% O
ver
all
Gf>
Low
Gf
% O
ver
all
Gf>
Lo
w G
f
% O
ver
all
Gf<
Hig
h G
f
% O
ver
all
Gf<
Hig
h G
f
% O
ver
all
Gf<
Hig
h G
f
The coefficient of variation which is a measure of data variability with respect to the mean is calculated for 4, 8 and 12 replicate scenarios. This is evaluated for overall replicates (16 specimens) and for each set in one, two and three pail combinations. For each pail combination, the sets with low COV and high COV were determined. Then the percent difference between overall COV and high COV & low COV is calculated. The result indicates that this difference is reduced as the number of replicates increases from 4 to and then to 12, Figure 7-4. The difference between overall COV and low & high COV reduces to an average of 2% as we get to 12 replicates. This also indicates that the difference between replicates COV to overall COV is minimized by increasing the number of replicates.

50
Figure 7-4 Percent Differences between Overall Coefficient of Variation and High or Low Coefficient of Variation for Fracture Energies
-10
-8
-6
-4
-2
0
2
4
6
8
10
Dif
fere
nce
(%
) B
etw
een
Ove
rall
CO
V H
igh
or
Low
CO
V f
or
Frac
ture
En
ergi
es
% Overall COV is Greter Than(>) Low COV of Each Box, Pail,or Set
% Overall COV is Less Than (<)High COV of Each Box, Pail, orSet
% Overall COV is Greater Than(>) Low COV of 8 Replicates
% Overall COV is Less Than (<)High COV of 8 Replicates
% Overall COV is Greater Than(>) Low COV of 12 Replicates
% Overall COV is Less Than (<)High COV of 12 Replicates
% O
ver
all
CO
V>
Lo
w C
OV
% O
ver
all
CO
V <
Hig
hC
OV
% O
ver
all
CO
V <
Hig
hC
OV
% O
ver
all
CO
V <
Hig
hC
OV
% O
ver
all
CO
V>
Lo
w C
OV
% O
ver
all
CO
V>
Lo
w C
OV
7.4 STATISTICAL EVALUATION OF MEASUREMENT VARIABILITY
7.4.1 One Sample t-test
A one sample t-test is performed on fracture energy values obtained from different pail combinations representing 4, 8 and 12 replicate scenarios. The analysis is done in JMP® using Analyze/compare Means/One-Sample t-test command. The one sample t-test is used to test the fracture energy obtained assuming different replicate numbers to the well-established threshold value of 400 J/m2. The population mean from each of 4, 8 and 12 replicates was compared to the hypothesized value of 400J/m2 to determine the level of confidence for an alternative hypothesis which assumes the population mean is greater than 400J/m2. For mixtures with population mean greater than the threshold value, results which indicted 95% (P<0.05) confidence are counted from Figure 7-5 for mixtures with sample mean greater than 400J/m2. The numbers and percentages are summarized in Table 7.1 for each set of one, two and three pail combinations. The result indicates that for a test with 4 replicates, we can confidently tell for an average of 10 mixtures out of 17 (59%) whether they meet the minimum threshold value or not even if their estimated population mean is greater than 400J/m2. In other words, there is 41% probability that there can be false positive or negative due to use of four replicates. With 8 replicates the confidence grows to 76% (13 out of 17) and with 12 replicates to 88% (on average 15

51
mixtures from 17). Thus, the probability of error is reduced to 24 and 12% due to use of 8 and 12 replicates respectively. This indicates that as the number of replicates increase to 12 the false positive rate is very low resulting in true representation of the population.
Table 7.1 One Sample t-test Summary
Pail combination No of mixtures (p<0.05) or
confident in results of % of mixtures (p<0.05) or confidence in percentage
Probability of error
One Pail combination (4 replicates)
10/17 specimens 59% 41%
Two Pail combination (8 replicates)
13/17 specimens 76% 24%
Three Pail combination (12 replicates)
15/17 specimens 88% 12%

52
Figure 7-5 One Sample t-test Result
7.4.2 Two Sample t-test
Two-sample t-test is used to determine if there is a statistical significant difference in mean response between 16 replicates and other sets of replicates considered in this study. This is done to statistically compare the variation in population mean as the number of replicates change from 16 to 4, 8 and 12. It should be noted that population mean from each pail combination is compared to the 16 replicates. However, the t-test results indicated that there is no statistically significant difference between the means since the 4, 8 and 12 replicates were a subset of the 16 replicates. For future analysis, if a separate set of replicates are used this could give information on whether there is a statistically significant difference between 16 replicates and the other replicate scenarios considered in this study.

53
7.4.3 Comparison of Mean Difference
The population mean for 4,8,12 and 16 scenarios were determined based on the test data provided for each using JMP®. Then the percent difference of each mean with respect to the 16 replicates mean is determined using Equation 4. This is done to see how the mean from the 16 replicate result changes as the replicate number changes to 4, 8, and 12 replicates. The result indicated that the population mean deviates by 9%, 5% and 3% from the 16 replicates specimen as the number of replicates changes to 4, 8 and 12 replicates respectively, Table 7.2, Table 7.3, and Table 7.4.
∑𝑀𝑒𝑎𝑛(16 𝑟𝑒𝑝)− 𝑀𝑒𝑎𝑛(4, 8 𝑜𝑟 12 𝑟𝑒𝑝) )𝑀𝑒𝑎𝑛(16 𝑟𝑒𝑝)
% 𝐷𝑖𝑓𝑓𝑒𝑟𝑒𝑛𝑐𝑒 𝑏𝑒𝑡𝑤𝑒𝑒𝑛 𝑚𝑒𝑎𝑛𝑠 = [4] 𝑛
Where n = total number of combinations for 4, 8 or 12 replicate scenarios

54
Table 7.2 Percent Difference Between 4 and 16 Replicates
Different Combinations of 4 Replicates 4-1 4-2 4-3 4-4
Mean
STD % Diff b/n 4 & 16 replicates
Mean
STD % Diff b/n 4 & 16 replicates
Mean
STD % Diff b/n 4 & 16 replicates
Mean STD % Diff b/n 4 & 16 replicates
% Diff b/n 4 & 16 replicates, Avg.
300 29 2.0 283 35 3.7 323 16 9.9 278 56 5.4 9.9 269 17 9.1 292 16 1.4 301 1.6 1.7 327 17 10.5 10.5 288 47 2.0 298 50 1.4 279 30 5.1 316 42 7.5 7.5 263 15 0.4 236 21 10.6 271 22 2.7 287 27 8.7 10.6 287 26 7.7 363 41 16.7 298 32 4.2 296 29 4.8 16.7 482 87 1.9 469 90 0.8 481 105 1.7 459 93 3.0 3.0 503 94 2.1 464 86 9.7 558 208 8.6 529 113 2.9 9.7 476 99 2.6 480 51 3.4 448 17 3.4 451 31 2.8 3.4 537 78 14.3 463 79 1.5 472 102 0.4 406 64 13.6 14.3 429 26 7.1 478 41 3.5 468 83 1.3 7.1 493 136 10.5 386 22 13.5 463 78 3.8 441 87 1.1 13.5 458 59 1.1 449 54 0.9 436 35 3.8 470 65 3.8 3.8 491 25 8.2 491 60 8.2 614 211 14.8 547 97 2.2 14.8 623 230 4.4 603 122 1.0 617 71 3.4 546 62 8.5 8.5 516 76 0.6 519 119 0.0 531 73 2.3 512 102 1.3 2.3 467 76 2.6 475 14 4.4 419 66 7.9 449 26 1.3 7.9 409 67 3.8 393 44 7.5 462 55 8.7 447 74 5.2 8.7 415 27 1.0 454 23 8.4 429 62 2.4 392 57 6.4 8.4 450 59 1.1 457 91 2.7 452 86 1.6 421 46 5.4 5.4 487 55 4.1 512 119 0.8 517 51 1.8 517 81 1.8 4.1 575 62 0.3 648 39 13.1 537 65 6.3 533 22 7.0 13.1 328 3 1.2 303 76 8.8 315 26 5.1 375 32 13.0 13.0 685 110 2.5 684 136 2.4 693 78 3.7 616 72 7.8 7.8
Average for 23 Mixtures
Average for 23 mixtures
8.9%

55
Table 7.3 Percent Difference Between 8 and 16 Replicates
Different Combinations of 8 Replicates
4-1 4-2 4-3 4-4 4-5 4-6
Mean % Diff b/n
4 & 16 replicates
Mean % Diff b/n 4
& 16 replicates
Mean % Diff b/n
4 & 16 replicates
Mean % Diff b/n 4
& 16 replicates
Mean % Diff b/n
4 & 16 replicates
Mean % Diff b/n 4
& 16 replicates
% Diff b/n 4 & 16 replicates,
Avg.
291 1.0 310 5.4 289 1.7 300 2.0 280 4.8 297 1.0 5.4 282 4.7 281 5.1 298 0.7 295 0.3 307 3.7 316 6.8 6.8 294 0.0 283 3.7 302 2.7 285 3.1 306 4.1 295 0.3 4.1 249 5.7 267 1.1 275 4.2 253 4.2 261 1.1 279 5.7 5.7 325 4.5 293 5.8 292 6.1 331 6.4 330 6.1 297 4.5 6.4 475 0.4 482 1.9 471 0.4 475 0.4 464 1.9 470 0.6 1.9 484 5.8 530 3.1 516 0.4 511 0.6 497 3.3 543 5.6 5.8 478 3.0 462 0.4 463 0.2 464 0.0 466 0.4 448 3.4 3.4 501 6.6 505 7.4 471 0.2 468 0.4 435 7.4 439 6.6 7.4 454 1.7 444 3.9 448 3.0 483 4.5 473 2.4 474 2.6 4.5 440 1.3 478 7.2 467 4.7 424 4.9 413 7.4 452 1.3 7.4 454 0.2 447 1.3 464 2.4 442 2.4 460 1.5 453 0.0 2.4 491 8.2 552 3.2 519 3.0 552 3.2 519 3.0 580 8.4 8.4 613 2.7 620 3.9 585 2.0 610 2.2 575 3.7 582 2.5 3.9 517 0.3 523 0.8 514 1.0 525 1.2 512 1.3 522 0.6 1.3 471 3.5 447 1.8 458 0.7 451 0.9 462 1.5 436 4.2 4.2 401 5.6 432 1.6 428 0.7 422 0.7 420 1.2 453 6.6 6.6 432 3.1 420 0.2 404 3.6 444 6.0 419 0.0 404 3.6 6.0 453 1.8 451 1.3 436 2.0 454 2.0 439 1.3 436 2.0 2.0 500 1.6 500 1.6 502 1.2 514 1.2 515 1.4 517 1.8 1.8 612 6.8 556 3.0 554 3.3 593 3.5 590 3.0 535 6.6 6.8 317 4.5 322 3.0 352 6.0 310 6.6 344 3.6 345 3.9 6.6 685 2.5 689 3.1 651 2.5 688 3.0 665 0.4 649 2.8 3.1
Average for 23 Mixtures 4.9%

56
Table 7.4 Percent Difference Between 12 and 16 Replicates
Different Combinations of 12 Replicates 4-1 4-2 4-3 4-4
Mean
STD % Diff b/n 4 & 16 replicates
Mean
STD % Diff b/n 4 & 16 replicates
Mean
STD % Diff b/n 4 & 16 replicates
Mean STD % Diff b/n 4 & 16 replicates
% Diff b/n 4 & 16 replicates, Avg.
292 42 0.7 298 40 1.4 287 39 2.4 300 30 2.0 2.4 306 21 3.4 298 30 0.7 295 28 0.3 286 19 3.4 3.4 296 40 0.7 292 38 0.7 300 43 2.0 288 39 2.0 2.0 264 31 0.0 273 22 3.4 262 29 0.8 257 24 2.7 3.4 319 45 2.6 294 27 5.5 315 46 1.3 316 46 1.6 5.5 470 88 0.6 474 87 0.2 470 82 0.6 477 86 0.8 0.8 517 138 0.6 530 135 3.1 499 93 2.9 508 134 1.2 3.1 460 36 0.9 458 56 1.3 469 62 1.1 468 61 0.9 1.3 447 81 4.9 472 94 0.4 469 88 0.2 491 86 4.5 4.9 476 58 3.0 454 60 1.7 458 55 0.9 459 42 0.6 3.0 430 70 3.6 466 96 4.5 440 97 1.3 447 95 0.2 4.5 452 50 0.2 455 52 0.4 459 55 1.3 448 47 1.1 1.3 550 136 2.8 550 133 2.8 509 67 4.9 532 130 0.6 4.9 589 87 1.3 595 135 0.3 591 144 1.0 615 141 3.0 3.0 521 91 0.4 520 77 0.2 516 91 0.6 522 83 0.6 0.6 450 41 1.1 447 56 1.8 464 44 2.0 457 57 0.4 2.0 431 62 1.4 437 64 2.8 416 62 2.1 417 58 1.9 2.8 421 52 0.5 409 45 2.4 416 62 0.7 431 35 2.9 2.9 443 72 0.4 441 61 0.9 443 64 0.4 453 72 1.8 1.8 515 82 1.4 506 60 0.4 506 82 0.4 504 76 0.8 1.4 573 69 0.0 548 52 4.4 585 64 2.1 587 70 2.4 4.4 334 53 0.6 339 35 2.1 338 49 1.8 316 39 4.8 4.8 662 98 0.9 662 88 0.9 662 104 0.9 687 102 2.8 2.8
Average for 23 Mixtures
Average for 23 mixtures
2.9%

57
7.5 SUMMARY
This chapter discusses the research effort on the DCT test replicate study. To establish the number of replicates required for DCT testing to obtain a large accuracy and precision in fracture energy measurements, different calculations and statistical analysis were performed with 4, 8 and 12 replicate scenarios using 16 replicate test results for 23 different asphalt mixtures. The results from all analysis indicated that measurement variability is minimized as the number of replicates increases from 4 to 8 and then to 12. For purposes of performance based specifications using DCT fracture energy, on basis of the results discussed in this chapter, 12 replicate specimens are recommended to ensure necessary accuracy and repeatability.
58
CHAPTER 8: EVALUATION OF REFLECTIVE CRACKING PERFORMANCE OF ASPHALT OVERLAYS AND ITS DEPENDENCE ON DCT FRACTURE ENERGY AND ASPHALT OVERLAY THICKNESS
8.1 INTRODUCTION
As part of the research study presented in this report, an exploration of the relationship between asphalt overlay reflective cracking performance and DCT fracture energy of asphalt mixtures was conducted. The scope of the work discussed in this chapter was to identify asphalt overlay pavement sections from previous and current research studies, obtain field cracking performance data from MnDOT pavement management system (PMS), and conduct analysis to compare reflective cracking performance with DCT fracture energy measurements. A total of 15 pavement sections for which the asphalt overlays have been previously tested using DCT test were identified. Various cracking performance measures were used to compare the reflective cracking performance with asphalt overlay thicknesses and DCT fracture energies. A new performance parameter for overlays is proposed that combines the overlay thickness with fracture energy to provide measure of total fracture resistance of the overlay.
8.2 REFLECTIVE CRACKING DISTRESS IN ASPHALT OVERLAYS
When an asphalt pavement overlay is placed on top of concrete or asphalt pavement, cracks in the pre-existing underlying layer reflect to the surface of the newly constructed pavement surface and are commonly referred as reflective cracks. These cracks are undesirable as they allow water to penetrate to the underlying layers and cause damage which in turn compromises the performance of a pavement. Through the years it has been observed that overlays usually exhibit a substantially shorter life span as compared to conventional asphalt pavements or pavements with full-depth reclamation (FDR), due to prevailing reflective cracks. For example, Dave et al. (2016) showed that for Minnesota pavements, an average reflective cracking rate of 16% per year for thin overlays as compared to 4% for sections with FDR. Due to high propensity for reflective cracking and thus substantially reduced life-span, researchers have undertaken efforts to develop performance measure that can be used to assess the reflective cracking performance of overlays. The DCT test was originally developed as a performance test for asphalt overlays (Wagoner et al., 2005).
As part of the current effort, this task investigates the existence of a relationship between fracture energy determined from DCT test and reflective cracking performance. This is done to see the potential of using fracture energy as an indicator for reflective cracking performance of asphalt mixtures. Distress data obtained from MnDOT Office of Materials and Road Research (OMRR) Pavement Management System and corresponding fracture energy measurement obtained from previous research projects for 15 overlay sections was used for the study.
8.3 PAVEMENT SECTIONS
In order to make comparisons between DCT fracture energy and reflective cracking performance of asphalt overlays, researchers reviewed current and past projects to determine pavement sections for which DCT fracture energy measurements are available. Thereafter, MnDOT OMRR was contacted to obtain field performance data from the MnDOT PMS for the sections that have been parts of the three previous research studies (MnDOT Contract 99008, Work Order 40, 72 and 100) as well as this project.
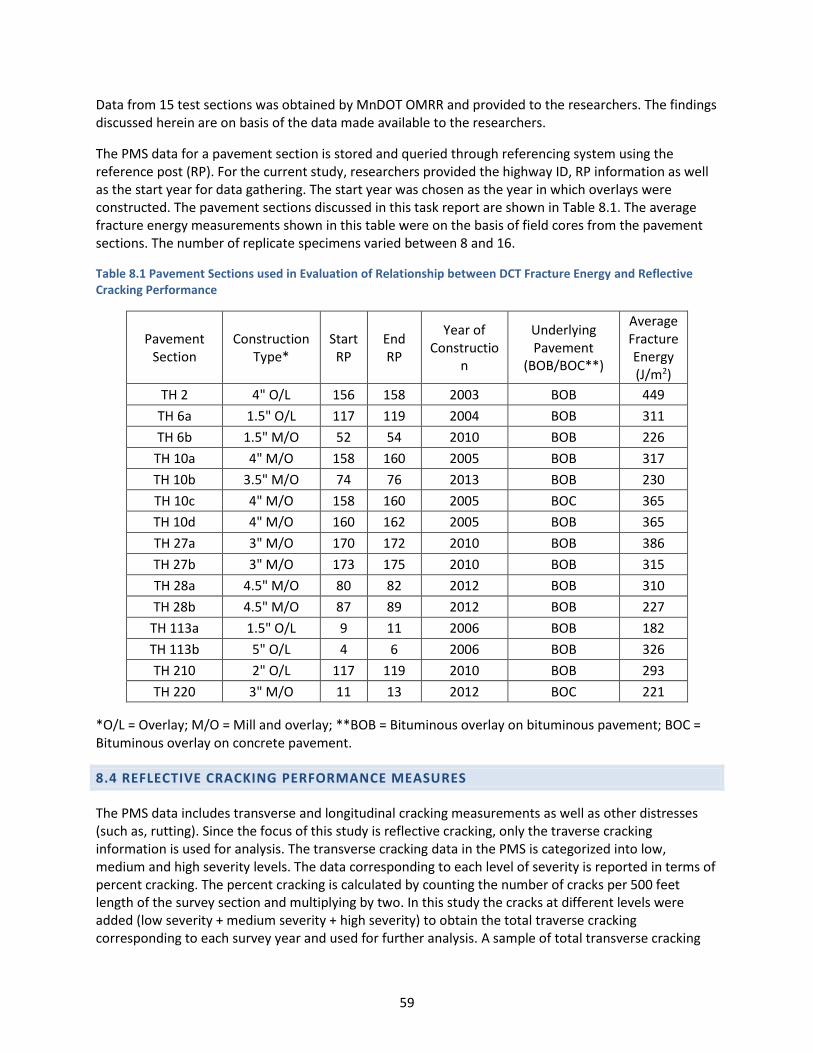
59
Data from 15 test sections was obtained by MnDOT OMRR and provided to the researchers. The findings discussed herein are on basis of the data made available to the researchers.
The PMS data for a pavement section is stored and queried through referencing system using the reference post (RP). For the current study, researchers provided the highway ID, RP information as well as the start year for data gathering. The start year was chosen as the year in which overlays were constructed. The pavement sections discussed in this task report are shown in Table 8.1. The average fracture energy measurements shown in this table were on the basis of field cores from the pavement sections. The number of replicate specimens varied between 8 and 16.
Table 8.1 Pavement Sections used in Evaluation of Relationship between DCT Fracture Energy and Reflective Cracking Performance
Pavement Section
Construction Type*
Start RP
End RP
Year of Constructio
n
Underlying Pavement
(BOB/BOC**)
Average Fracture Energy (J/m2)
TH 2 4" O/L 156 158 2003 BOB 449
TH 6a 1.5" O/L 117 119 2004 BOB 311
TH 6b 1.5" M/O 52 54 2010 BOB 226
TH 10a 4" M/O 158 160 2005 BOB 317
TH 10b 3.5" M/O 74 76 2013 BOB 230
TH 10c 4" M/O 158 160 2005 BOC 365
TH 10d 4" M/O 160 162 2005 BOB 365
TH 27a 3" M/O 170 172 2010 BOB 386
TH 27b 3" M/O 173 175 2010 BOB 315
TH 28a 4.5" M/O 80 82 2012 BOB 310
TH 28b 4.5" M/O 87 89 2012 BOB 227
TH 113a 1.5" O/L 9 11 2006 BOB 182
TH 113b 5" O/L 4 6 2006 BOB 326
TH 210 2" O/L 117 119 2010 BOB 293
TH 220 3" M/O 11 13 2012 BOC 221
*O/L = Overlay; M/O = Mill and overlay; **BOB = Bituminous overlay on bituminous pavement; BOC = Bituminous overlay on concrete pavement.
8.4 REFLECTIVE CRACKING PERFORMANCE MEASURES
The PMS data includes transverse and longitudinal cracking measurements as well as other distresses (such as, rutting). Since the focus of this study is reflective cracking, only the traverse cracking information is used for analysis. The transverse cracking data in the PMS is categorized into low, medium and high severity levels. The data corresponding to each level of severity is reported in terms of percent cracking. The percent cracking is calculated by counting the number of cracks per 500 feet length of the survey section and multiplying by two. In this study the cracks at different levels were added (low severity + medium severity + high severity) to obtain the total traverse cracking corresponding to each survey year and used for further analysis. A sample of total transverse cracking

60
over the 12-year service life for pavement section on TH 2 is presented in Figure 8-1. It can be seen from the plot that the automated cracking data collected for PMS has certain challenges associated with it, the amount of recorded cracking has fluctuated in this case. This section is presented as an example to show such inconsistency observed sometimes in the PMS records as it relates transverse cracking measurements.
Figure 8-1 Field Transverse Cracking Performance Data for TH 2 Pavement Section
0
10
20
30
0 5 10 15
Tran
sver
se C
rack
ing
(%)
Years in Service, Year
Since the focus of this study is on reflective cracking, different cracking measures that are representative of field cracking performance of overlays were calculated. Use of cracking performance measures as opposed to direct use of total amount of transverse cracking is essential as different pavement sections have been in service for different durations. The cracking measures considered in this study are average transverse cracking rate (ATCR), maximum transverse cracking rate (MTCR) and total transverse cracking performance index (TCTotal). Description of transverse cracking measures is presented in Table 8.2. Further detail on the cracking measures can be found in the report submitted by Dave et al., 2015.
For cracking data presented in Figure 8-1 for TH 2 pavement section, the total transverse cracking performance index (TCTotal) is the area under the percent cracking versus years in service (total cracking performance divided by the total year in service). For this case the value of TCTotal is 1.2%/year. Maximum transverse cracking rate is determined by picking the maximum difference between two consecutive years of service. For this case the maximum difference is observed between year 0 and 2 years and that is 12%/year. This parameter gives indication of the highest cracking a pavement experienced, for this case which happens to be in the first two years. Average total transverse cracking is the sum of total cracking divided by the number of service year which indicate the average rate of cracking by the pavement over the course of the pavement life.

61
Table 8.2 Cracking Performance Measures
Cracking Measure Description Unit
Average total transverse cracking rate
Sum of total transverse cracking (low + medium + high) normalized by service life
% cracking per year
Maximum transverse cracking rate
Maximum increase in total transverse cracking amounts (low + medium + high) between any two
consecutive years of service
% cracking per year
Total transverse cracking performance index
(TCTotal)
Sum of total transverse cracking (low + medium + high) work over the service life. Total area is then
normalized against by time (in years) for which pavement section has been in service
% cracking per year
8.5 CRACKING PERFORMANCE OF STUDY SECTIONS
The different cracking measures for the sections that are included in this study are presented in Figure 8-2, Figure 8-3, and Figure 8-4. Figure 8-2(a) shows the average total transverse cracking rate and Figure 8-2(b) shows the same data normalized with respect to overlay thickness (by multiplying overlay thickness to the cracking performance measure). For a majority of the pavement sections, the distress in terms of average total transverse cracking rate ranges between 10 and 20%/year. However, for sections such as TH6a and TH113a the average cracking rate is higher than 30%/year. It should be noted that both TH6a and TH113a are the thinnest overlays of the studies sections at 1.5-inch thickness. In general, the trend and the order of sections in terms of highest to lowest average cracking rate did change substantially with thickness normalization. For example, the 4-inch thick TH 10c overlay section has highest thickness normalized average cracking rate. It should be noted that thickness normalization assumes that each extra inch of overlay thickness has same impact towards cracking performance. Thus a 1.5-inch overlay is expected to have 37.5% cracking rate of that of 4-inch thick overlay for them to yield comparable normalized cracking rate.

62
Figure 8-2 (a) Average Total Transverse Cracking Rate (b) Average Total Transverse Cracking Rate Normalized with Pavement Thickness
The maximum transverse cracking rate is presented in Figure 8-3(a). The data is normalized with overlay thickness and is shown in Figure 8-3(b). The largest difference observed between two consecutive years reaches up to 60% for section such as TH 210. After thickness normalization, a substantial change in the order of performance was not seen between the study sections. As with average cracking rate, some of the thicker overlays (such as TH 10a and TH 10c both of which are 4-inch thick), have the worst performance as opposed to TH 210 which is only 2-inch thick.
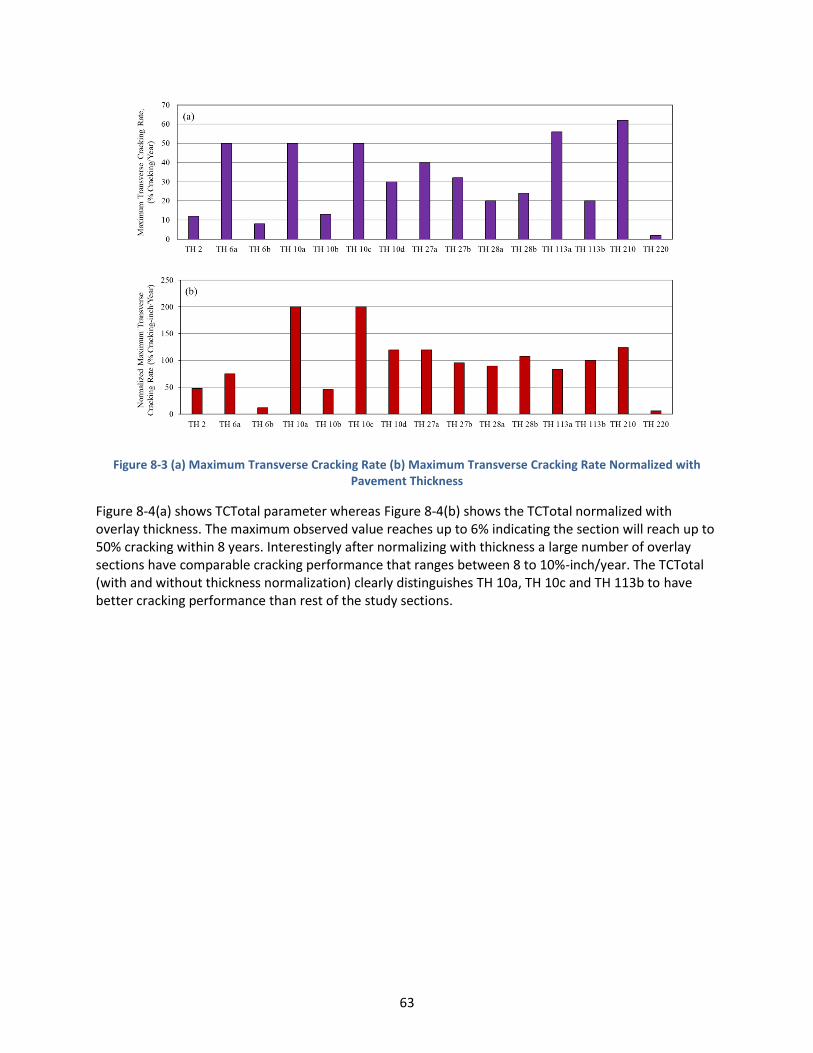
63
Figure 8-3 (a) Maximum Transverse Cracking Rate (b) Maximum Transverse Cracking Rate Normalized with Pavement Thickness
Figure 8-4(a) shows TCTotal parameter whereas Figure 8-4(b) shows the TCTotal normalized with overlay thickness. The maximum observed value reaches up to 6% indicating the section will reach up to 50% cracking within 8 years. Interestingly after normalizing with thickness a large number of overlay sections have comparable cracking performance that ranges between 8 to 10%-inch/year. The TCTotal (with and without thickness normalization) clearly distinguishes TH 10a, TH 10c and TH 113b to have better cracking performance than rest of the study sections.

64
Figure 8-4 (a) Total Transverse Cracking Performance Index (TCTotal) (b) TCTotal Normalized with Pavement Thickness
8.5.1 Summary of Pavement Sections and Reflective Cracking Performance of Overlays
Due to the difference in the total duration the different pavement sections has been in-service, different cracking performance measures such as ATCR, MTCR and TCTotal were calculated. Furthermore, the cracking performance of the study sections were presented based on comparison done by directly comparing the cracking measures as well as the cracking measures normalized with overlay thickness. An average of 10 to 20%/year total transverse cracking rate is observed for the majority of the sections, up to a 60% difference in cracking rate is observed between two consecutive years and up to 6% TCTotal was observed. In general, no significant change is observed in the performance trends among the sections following thickness normalization.
8.6 COMPARISONS OF FIELD CRACKING PERFORMANCE, OVERLAY THICKNESS AND FRACTURE ENERGY
This section describes the comparisons between the different cracking performance measures for the 15 asphalt overlay pavement sections with corresponding DCT fracture energy measurements and overlay thicknesses. The objective of this comparison is to explore relationship between the DCT fracture energy, overlay thicknesses and cracking performance of overlays. This is done to investigate the potential of using fracture energy measurement as an indicator for reflective cracking performance of asphalt mixtures.
8.6.1 Effect of Overlay Thickness on Cracking Performance
Figure 8-5 and Figure 8-6 show plots of the maximum and average cracking rates against the overlay thicknesses. Figure 8-5 indicates that the maximum cracking rate does not show a consistent trend with

65
overlay thickness, however as seen in Figure 8-6, the average cracking rate shows a moderately strong trend. It is not surprising to see this effect, where increasing overlay thicknesses show decreasing average transverse cracking rates.
Figure 8-5 Comparison between Overlay Thickness and Maximum Transverse Cracking Rate
Figure 8-6 Comparison between Overlay Thickness and Average Transverse Cracking Rate
8.6.2 Effects of Fracture Energy on Cracking Perform ance
In this section graphical comparisons are made between the DCT fracture energy and various field cracking performance measures. Figure 8-7 compares average DCT fracture energy for the overlays with maximum transverse cracking rates. As evident from the plot, there is minimal visual trend between these two variables. This is not entirely surprising, climatic variations between different years as well as

66
differing traffic levels play substantial role in the maximum cracking rate events over the life of an overlay. Furthermore, apart from one overlay mixture all other mixtures have a fracture energy value that is typically considered low from perspective of thermal cracking resistance. At present, a fracture energy value of 450 J/m2 is recommended to be used during the mx design process to provide sufficient protection against thermal cracking. Finally, as summarized in previous section, the thickness of overlay is also an influential parameter in controlling the reflective cracking performance, it is not considered in this initial comparison and would influence the lack of trend between fracture energy and maximum cracking rate. Later sections of this chapter utilizes combined effects of asphalt mixture’s cracking resistance and overlay thickness to explore effects of such combined parameter on overlay cracking performance.
Figure 8-7 Comparison between DCT Fracture Energy and Maximum Transverse Cracking Rate
Further comparison is made between the average transverse cracking rate to average DCT fracture energy in Figure 8-8. Similar to previous comparisons there is a lack of distinct trend between the two variables. A linear regression fit to the data shows an extremely weak correlation where increasing fracture energy lowers the average overlay cracking rate. Same discussion as with maximum transverse cracking rate on overlay thickness is also applicable here.

67
Figure 8-8 Comparison between DCT Fracture Energy and Average Transverse Cracking Rate
The third and final overall cracking performance measure, TCTotal, is compared with DCT average fracture energy in Figure 8-9. Of the three cracking performance measures, this shows the strongest correlation with the DCT fracture energy. It should also be noted that this performance index is most comprehensive and has been previously shown to be a better representation of actual performance in field in previous MnDOT research study (Dave et al. 2015). As expected, asphalt overlays with higher fracture energies indicate improved cracking performance. While the overall trend for TCTotal agrees with the expectation for DCT fracture energy, it should be noted that the strength of the linear regression based equation is fairly low.
Figure 8-9 Comparison between DCT Fracture Energy and Transverse Cracking Performance Index (TCTotal)
To determine the reliability of R2 values calculated above, a significance of R2 is determined using probability level (p-value) analysis. A p-value informs us the likeliness or unlikeliness of obtaining reported R2 values by chance, thus it allows us to determine whether there is relationship between the parameters or not. A smaller p-value indicates the higher reliability in the obtained R2 value, meaning there really is a relationship between the variables, whereas a higher p-value indicates that it is more

68
likely that the observed relationship is simply by chance. The calculated p-values between fracture energy, thickness, fracture energy and thickness combined, and different field cracking measures are summarized in Table 8.3. Values indicated in red and bold are below the significance threshold (in this case 0.05, meaning 95% confidence that a relationship exists) and are associated with higher reliability of the observed relationship.
Overall, the significance of R2 between fracture energy, overlay thickness as well as their combination to maximum transverse cracking rate is a lot higher than the minimum threshold indicating lower reliability of the observed relationships. For average transverse cracking rate, the values indicate high reliability of the relationship to both thickness and the combination. The TCTotal values are the lowest, indicating that it is unlikely these relationships are simply due to chance.
Table 8.3 Significance of Observed R2 Value (p-value) Between Fracture Energy and Overlay Thickness to Reflective Cracking Performance Measures
p-values
Variables Average Transverse
Cracking Rate Maximum Transverse
Cracking Rate
Total Transverse
Cracking
Fracture Energy 0.403 0.740 0.0703
Thickness 0.002 0.231 <0.0001
Fracture Energy*Thickness 0.016 0.498 0.0001
Since the overlay field cracking performance showed dependence on both the overlay thickness and the DCT fracture energy, researchers are proposing a combined parameter called “Total fracture resistance of overlay”. This parameter is the product of average DCT fracture energy of the asphalt mixture and the thickness of the overlay, thus it represents the required energy per unit width of the overlay. This parameter integrates material property of overlay with the structural contribution in terms of overlay thickness. Figure 8-10 presents a graphical comparison between the total fracture resistance of overlay and the field transverse cracking performance index. As seen from the plot, a good correlation is seen between these two variables. An exponential fitted function shows a correlation coefficient of above 0.70 which is typically considered fairly strong for relationships that include use of pavement field data.

69
Figure 8-10 Comparison between Total Fracture Resistance of Overlay (Product of DCT Fracture Energy of the Mix and Overlay Thickness) and Transverse Cracking Performance Index (TCTotal)
8.7 SUMMARY
This chapter discussed an exploration of comparing overlay thickness, DCT fracture energy and field cracking performance of overlays. Asphalt overlay thickness as well as DCT fracture energy showed moderate correlation with the TCTotal field cracking performance index. Neither showed correlation to maximum cracking rates and only overlay thickness showed weak correlation to average cracking rate. A combined overlay fracture resistance parameter is proposed that combines the overlay thickness and DCT fracture energy to provide a measure of total fracture resistance of the overlay per unit width. Since the identification of this parameter is on basis of only limited number of pavement section, continued exploration is strongly recommended. Subsequent tasks of this project will conduct further exploration as well as other parallel research efforts, such as the National Road Research Alliance’s long term research project (LT1) on asphalt overlay life curve development. On basis of the current results a preliminary recommendation is generated for the use by pavement engineers. The recommendations are designed in a tired manner, where depending on the highway criticality level in terms of acceptable cracking performances (as provided by TCTotal values of 1 and 2 %/year). A table (Table 8.4) is put together to provide overlay thickness and corresponding DCT fracture energy value recommendations for selected overlay thickness for each of the two performance levels. Some recommendations regarding mixture types to achieve these fracture energies are also shown in the table. Researchers acknowledge that some of the very thin overlays with very high performance needs (such as 20% cracking after 10 years of service for a 1 inch overlay thickness) yield fracture energy requirements that are excessively high. Nonetheless, the motivation behind such approach is that it allows material specifiers and pavement engineers an ability to conduct trade-off evaluations between thickness and material selection to minimize the project cost.

70
Table 8.4 Preliminary Recommendations for DCT Fracture Energy for Asphalt Overlays (provided as function of overlay thicknesses and the needed overlay performance)
Very High Performance Need (TCTotal = 1 %/year; Approx. 20% cracking at 10 years)
Selected Overlay Thickness (inch)
Recommended DCT Fracture Energy (J/m2)
Typical Asphalt Mixture Needs
1.5 972 Very highly modified binders (e.g. PG 70-34), 4.75
mm NMAS, high binder film thicknesses, no recycling.
2 729 Highly modified binders (e.g. PG 64-34), 4.75 NMAS,
no recycling.
2.5 583 Modified binders (e.g. PG 58-34), 9.5 mm NMAS,
finer gradations.
3 486 Modified binders (e.g. PG 58-34), 9.5 mm NMAS.
3.5 417 Unmodified binders (e.g. PG 58-28), 9.5 mm and
12.5 mm NMAS.
High Performance Need (TCTotal = 2 %/year; Approx. 40% cracking at 10 years )
Selected Overlay Thickness (inch)
Recommended DCT Fracture Energy (J/m2)
Typical Asphalt Mixture Needs
1 729 Highly modified binders (e.g. PG 64-34), 4.75 NMAS.
1.5 486 Modified binders (e.g. PG 58-34), 9.5 mm NMAS.
2 365 Unmodified binders (e.g. PG 58-28), 12.5 mm NMAS.
2.5 292 Unmodified binders (e.g. PG 58-28), 12.5 mm NMAS,
higher recycling.

71
CHAPTER 9: SENSITIVITY OF ASPHALT OVERLAY REFLECTIVE CRACKING PERFORMANCE TO DCT FRACTURE ENERGY USING FINITE ELEMENT SIMULATIONS
9.1 INTRODUCTION
After determining the viability of DCT fracture energy as a performance parameter for asphalt overlay reflective cracking using field distress data (as discussed in Chapter 8 of this report), a research effort was undertaken to reaffirming the suitability of asphalt mixture fracture energy as a reflective cracking performance parameter and to explore thresholds for DCT fracture energy for use in performance based specifications of overlay asphalt mixtures. The scope of this effort was to select asphalt overlay pavement sections for developing finite element simulation models, developing finite element models for selected pavement sections, conducting parametric evaluations using different fracture energy values for overlay mixtures and to determine suitable threshold for fracture energy that minimizes potential for reflective cracking. Five pavement sections were identified by working closely with the MnDOT Office of Materials and Road Research (OMRR). Reliance on finite element modelling is necessary to be able to simulate a large number of fracture energy combinations for various overlay structures and asphalt mixtures within those structures. Without use of simulation model, over 50 test sections would have been necessary to be constructed and monitored to obtain similar information.
The pavement sections were simulated using a critical cracking conditions approach with use of both thermal and tire loading conditions. The formation of damage and cracking in the overlay in the vicinity of existing joint or crack in underlying pavement was modeled using cohesive zone fracture model. For each simulated pavement section, a parametric evaluation was conducted by changing fracture energies of each asphalt mixture (lift) within overlay. The required fracture energies to minimize reflective cracking potential were also determined and compared with the findings for the field sections that are discussed in Chapter 8 of this report.
This chapter is divided into five sections. Details on the pavement reflective cracking finite element model is presented first, various pavement sections used in this study as well as the simulation scenarios are discussed next, thereafter pertinent results from simulations and corresponding findings are presented, and finally outcomes and recommendations are summarized.
9.2 PAVEMENT REFLECTIVE CRACKING FINITE ELEMENT MODEL
A prominent form of cracking in asphalt overlays is reflective cracking which has one of the most extensive damage and deterioration mechanism in the rehabilitated pavement systems. Construction of asphalt concrete overlays on a deteriorated pavement provides a cost effective and quick solution for improving the pavement ride quality. However, the lives of asphalt concrete overlay systems are usually much shorter than expected design life because of reflective cracking. Reflective cracking phenomenon is caused primarily due to extension of the existing cracks or discontinuity from the underlying deteriorated pavement into the overlay.
Numerous studies have been carried out over the past decades to obtain a better understanding of cracking mechanisms and to tackle the cracking problem in asphalt pavements. Prediction of cracking as a fracture-dominated phenomenon requires appropriate fracture tests and models. Most of research studies on asphalt concrete cracking have been geared towards experimental approaches and significant

72
advances have been made in developing asphalt concrete fracture tests, such as disc-shaped compact tension test (DCT), compact tension test (CT), single edge notched beam (SENB), and semi-circular bending test (SCB). On the modeling side, several fracture models have been introduced for asphalt concrete, and can be used in powerful finite element simulation to capture the combined effects of traffic and climate on crack initiation and propagation in asphalt pavements. These models directly utilize laboratory fracture test data.
9.2.1 Cohesive Zone Fracture Model
Crack nucleation, initiation, propagation, and other complex non-linear damage effects in asphalt concrete occur within the fracture process zone which is the region between the point of damaged material (no load bearing capacity) and the point of intact material (full load carrying capacity). Due to non-linear behavior of asphalt concrete in the fracture process zone, stress singularities in the vicinity of crack tip, and introduction of material separation, the conventional methods in fracture mechanics such as Linear Elastic Fracture Mechanics (LEFM) approach may not be a suitable technique to predict the damage occurring in that material. The LEFM approach can only be used where there is an initial crack (or crack-like defect) exists concurrent with a relatively small size of fracture process zone compared to the overall dimensions of the specimen. Work by Li and Marasteanu (2010) employed acoustic emissions method to determine size of fracture process zone (FPZ) in different types of asphalt mixtures at low temperatures. Results form that study indicates that FPZ for asphalt mixtures are in range of 1.5 inch or larger, thus invalidating direct application of LEFM for simulation of cracking in asphalt pavements where layer thicknesses typically range from 2 to 10 inch.
As an alternative, the Cohesive Zone Model (CZM) as a simple, yet powerful and computationally efficient phenomenological model has been successfully implemented to predict cracking in both homogeneous and nonhomogeneous materials. Compared to the classical LEFM approach and some other existing fracture models, CZM provides advantages of allowing spontaneous crack nucleation, crack branching and fragmentation, as well as mode-I and mixed-mode crack propagation without an external fracture criterion. The early conceptual works related to the cohesive zone model (CZM) was first proposed by Barenblatt in 1959 to study brittle fracture (Barenblatt 1959 & 1962). This followed by Dugdale (1960) who adopted a fracture process zone concept to investigate materials exhibiting plasticity. In 1994, an intrinsic potential-based model was introduced by Xu and Needleman (1994) where cohesive elements were inserted along either lines or regions in advance by means of the finite-element method following an exponential cohesive law. In their potential-based model, the traction initially increases as displacement between cohesive elements increases till it reaches a maximum and then it decays monotonically. Geubelle and Baylor (1998) and Espinosa and Zavattieri (2003) used a bilinear model to alleviate the artificial compliance due to the initial pre-peak slope of the intrinsic cohesive model. Their bilinear model reduced the compliance by adjusting the initial slope of the cohesive law. Camacho and Ortiz (1996) proposed a stress-based extrinsic cohesive law as an alternative cohesive model. In their model a new surface is adaptively created by duplicating nodes which were previously bonded.
To date, CZM has been successfully implemented in simulation of fracture for a wide range of materials including: metals, concrete, asphalt concrete, polymers, ceramics, composites. For asphalt concrete materials, one of the early application of cohesive zone model was by Soares et al. (2003) where they implemented CZM to simulate fracture mode I crack propagation within the indirect tension test (IDT) on asphalt concrete. Paulino et al. (2004) proposed an intrinsic potential energy-based cohesive model for asphalt concrete. They simulated crack propagation in the IDT sample with the cohesive parameters

73
calibrated from the SEN(B) test using a user-defined subroutine, UEL, in ABAQUS. A bilinear CZM to reduce compliance was implemented to asphalt concrete by Song et al. (2006). A number of other researchers have also applied CZM in simulation of asphalt concrete materials and provided substantial contributions in demonstrating its applicability and suitability for modeling of fracture in asphalt mixtures. As an example Kim and Aragão (2013) employed CZM for rate dependent microstructure modeling of fracture and Dave and Buttlar (2010a) used temperature dependent CZM for low temperature cracking simulations in asphalt pavements.
The CZM concept in the fracture mode I in asphalt concrete material is illustrated in Figure 9-1 where tn, δn, σc, and δcr denote normal traction, normal opening displacement, material strength, and displacement corresponding to zero traction (critical displacement), respectively. The point where traction is zero is defined as the “true crack tip” where material exhibits complete failure with no load carrying capacity. On the other hand, the point where the traction reaches maximum is defined as the “cohesive (fictitious) crack tip” where the material still has the full load carrying capacity without any damage. The region between the true crack tip and the cohesive crack tip where complicated fracture behaviors, including inelasticity, occur is called as the cohesive zone (or fracture process zone). Along this zone, crack nucleation, crack bridging and crack propagation occur. The schematic illustration of the relation between displacement jump and the traction along the process zone is depicted in Figure 9-1. The cohesive surfaces are joined together by a cohesive traction, which depends upon the displacement jump across crack faces. As the displacement jump increases due to an increase of external force or of compliance in structure, the traction first increases, reaches a maximum, and decays to zero.
One important material property used as an input for CZM is the fracture energy of asphalt concrete which is the amount of energy required per unit of newly created fracture surface area. To determine fracture energy for asphalt concrete for use within CZM framework, Wagoner et al. (2006) proposed two laboratory fracture tests, i.e. SEN(B) test and DC(T) test. To incorporate a CZM into the numerical scheme for dynamic fracture, the cohesive element is developed and positioned along the potential path or region of crack propagation, and attached to the volumetric elements, which follows a cohesive traction-separation relationship.

74
Figure 9-1 (a) Typical Crack in Asphalt Pavement (b) CZM Concept (displaying the fracture behavior near crack tip) and (c) Schematic Illustration of CZ (material strength (σc), critical displacement (δcr), normal displacement
jump (δn) and correspondent traction (tn) along a cohesive surface)
Xu and Needleman introduced an exponential form for the free energy potential between the displacement jump and the corresponding traction (Xu and Needleman 1994, Geubelle and Baylor 1998). The proposed model offers a computationally convenient description of the cracking process represented by a shape of constitutive model, material strength, and cohesive fracture energy. Despite the many successful applications of the potential based exponential cohesive law reported in the literature, the model inherently produces artificial compliance due to a pre-peak slope described in this cohesive law. Espinosa and Zavattieri formulated a bilinear model to reduce CZM compliance by providing an adjustable initial slope in the cohesive law (Espinosa and Zavattieri 2003). Non-dimensional effective displacement and effective traction are defined in the following:
2 2𝛿𝛿 = √
𝑛 𝛿𝑠( ) + ( ) (5)
𝑒 𝛿𝑐𝑟 𝛿𝑐𝑟
𝑡𝑒 = √𝑡2𝑛 + 𝑡
2𝑠 (6)

75
c is a critical displacement where complete separation, i.e. zero traction, occurs. As illustrated in Figure 9-2, the cohesive law in terms of non-dimensional effective displacement and effective traction has the following expression:
𝛿𝑒 𝜎𝑐 𝛿𝑒 < 𝛿𝑐𝑟 𝛿
𝑡 = 𝑐𝑟𝑒
1 − 𝛿𝑒 (7) 𝜎𝑐 𝛿𝑒 > 𝛿𝑐𝑟 { 1 − 𝛿𝑐𝑟
For unloading and reloading, the traction can be obtained from:
𝑡𝑢𝑡𝑒 = ( ) 𝛿𝑒 (8)
𝛿𝑢
The pre-peak region represents the elastic part of the intrinsic cohesive law whereas the softening portion after the peak load accounts for damages occurring in the fracture process zone, see Figure 9-2.
Notice that the parameter cr is non-dimensional displacement in which the traction is a maximum, and is incorporated to reduce the elastic compliance by adjusting the pre-peak slope of the cohesive law. In
other words, as the value of cr decreases, the pre-peak slope of the cohesive law increases and as a result, artificial compliance is reduced. The cohesive fracture energy is given as
1𝐺𝑐 = ( ) 𝛿𝑐𝑟𝜎𝑐 (9)
2

76
Figure 9-2 Bilinear Cohesive Law (presented in terms of non-dimensional effective displacement and non-dimensional effective traction)
9.2.2 Finite Element Pavement Model
A proper translation of field information to relevant simulation parameters is very important in achieving accurate pavement model predictions. For developing a finite element (FE) based pavement simulation model, it is necessary that the geometry, in-situ material properties, climatic and traffic conditions of actual pavement are correctly translated to the model. Previous research by Paulino et al. (2006), Dave et al. (2010b and 2010c) and Ahmed et al. (2013) substantially influenced the pavement reflective cracking model used in the present study. Specifically, Dave et al. (2010c) and Ahmed et al. (2013) have provided validations through use of accelerated pavement testing and monitoring of field sections for suitability of the modelling framework adopted in the present research.
This research uses a CZM based FE pavement model for analysis of asphalt overlays for evaluation of effects of fracture energy on predicted reflective cracking potential. In context of this type of simulations for reflective cracking performance prediction, this section provides some information on the key attributes of the model. The primary components associated with pavement simulation model include:
Finite element mesh;
Constitutive models for materials behavior;
Boundary conditions;
Loading conditions; and,
Post processing of results.

77
9.2.2.1 Finite Element Mesh
Finite element mesh is a physical representation of the pavement through use of elements that are connected as nodes. A finite element model can represent pavement structure as a three-dimensional body or a simplified two dimensional form can also be assumed. While, three-dimensional representation is substantially closer to actual pavement system, often times a two-dimensional representation is used for practicality (to limit simulation times). Figure 9-3(a) schematically shows a plane superimposed on the pavement system that is used as two-dimensional representation in the FE model. Typically, plane strain conditions are assumed to be applicable for this type of reduced model. In the present research work, four node quadrilateral (Q4) elements are used to represent the pavement structure. Figure 9-3(b) shows its finite element discretization along with zoomed in regions near the area of interest as well as various other attributes of the model. Note that in order to achieve computational efficiency a graded mesh is used. Graded mesh utilizes smaller sized elements in the area of interest and in areas with higher gradients of stresses, strains and deformations. In the region of interest, that is along the cohesive zone elements, the average element size is 1/32 inch (~0.7 mm). Since finite element method is approximation of the response of any body, the smaller the element sizes, the closer the representation of the continua. However, for large domains such as pavements, it is impractical to use very fine mesh throughout the simulated domain as it substantially increases the computational cost. Use of transition elements enable generation of graded meshes where element sizes go from smaller to larger as one moves away from areas of interest and high response gradients. In the example shown here, it can be seen that the element sizes are very large near the bottom of the model which represents soil subgrade as a high depth from surface.
(a) Schematic showing asphalt overlay on PCC pavement and the plane that is simulated in 2D simplification of pavement finite element model.
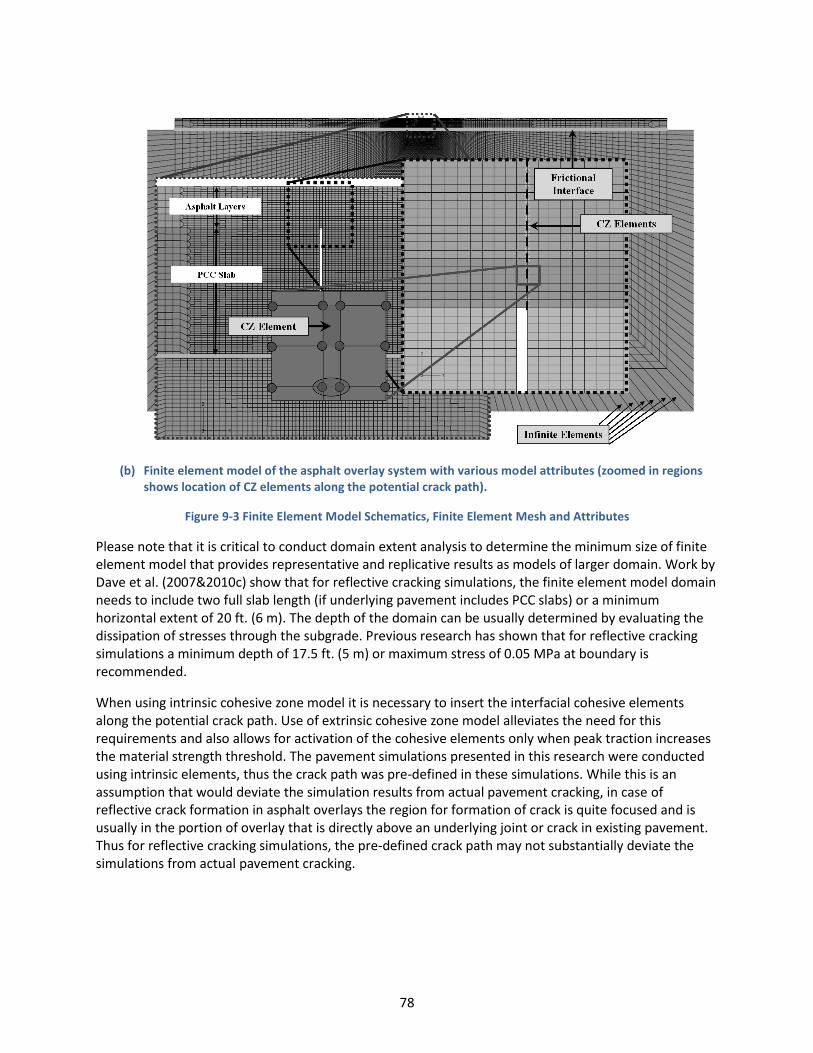
78
(b) Finite element model of the asphalt overlay system with various model attributes (zoomed in regions shows location of CZ elements along the potential crack path).
Figure 9-3 Finite Element Model Schematics, Finite Element Mesh and Attributes
Please note that it is critical to conduct domain extent analysis to determine the minimum size of finite element model that provides representative and replicative results as models of larger domain. Work by Dave et al. (2007&2010c) show that for reflective cracking simulations, the finite element model domain needs to include two full slab length (if underlying pavement includes PCC slabs) or a minimum horizontal extent of 20 ft. (6 m). The depth of the domain can be usually determined by evaluating the dissipation of stresses through the subgrade. Previous research has shown that for reflective cracking simulations a minimum depth of 17.5 ft. (5 m) or maximum stress of 0.05 MPa at boundary is recommended.
When using intrinsic cohesive zone model it is necessary to insert the interfacial cohesive elements along the potential crack path. Use of extrinsic cohesive zone model alleviates the need for this requirements and also allows for activation of the cohesive elements only when peak traction increases the material strength threshold. The pavement simulations presented in this research were conducted using intrinsic elements, thus the crack path was pre-defined in these simulations. While this is an assumption that would deviate the simulation results from actual pavement cracking, in case of reflective crack formation in asphalt overlays the region for formation of crack is quite focused and is usually in the portion of overlay that is directly above an underlying joint or crack in existing pavement. Thus for reflective cracking simulations, the pre-defined crack path may not substantially deviate the simulations from actual pavement cracking.

79
9.2.2.2 Material Behavior and Model Parameters
The bulk behavior (non-fracture related behavior) of asphalt concrete at low temperatures is viscoelastic. Viscoelastic materials have time, temperature and load-history dependent material properties. Use of viscoelastic material model for asphalt concrete material is very important to obtain reliable results from computer simulations. In the current work a generalized Maxwell model was used to represent relaxation modulus of asphalt concrete. The relaxation moduli used in the present research were either obtained from creep tests following AASHTO T322 specifications for indirect tensile creep and strength tests or through interconversion from complex modulus determined using the AASHTO T-342 specifications. The functional form of generalized Maxwell model is given as following:
N
i
iiEE1
)]/[exp()( Modulus, Relaxation (10)
Where,
Ei = Elastic coefficient of spring in ith Maxwell unit
Relaxation time of ith spring-dashpot pair, τi = ηi / Ei
ηi = Viscosity of ith dashpot
Reduced time, ξ = t / aT
t = time, aT = Time-temperature shift factor
Please note the parameters for the cohesive model depend on the model used in simulations. The two local fracture parameters, material strength (σc) and fracture energy (Ḡf) are discussed in later section along with other material properties.
Due to complex interplay between the traffic induced mechanical loading and climate induced thermal loading required thermo-viscoelastic simulations, it is important that the thermally induced straining of asphalt mixture is correctly characterized. Thermal straining in the present work is driven by coefficient of thermal expansion and contraction. All asphalt layers and PCC slabs in the FE models used in this research were provided with thermal expansion and contraction behavior.
PCC slabs, granular bases and subgrade materials in this research are modeled using a linear elastic material model. Typical values for elastic modulus and Poisson’s ratio were used on the basis of the classification of the soil and base types (presented later in this report). In the case of field section simulations, the use of an elastic model for the granular base and subgrade was deemed adequate due to the relatively low stress levels in the base and subgrade layers.
9.2.2.3 Boundary Conditions
As with any mechanical problem, boundary conditions of a pavement FE model are very important. In context of the work presented here, the three boundary conditions that are critical in full scale pavement model are the ones at the edges of the finite element domain, the ones between various pavement layers and finally translation of effects of load transfer devices (primarily dowels) between PCC slabs.

80
In the present work, infinite elements are used at the boundary of the finite element domain. These are indicated in Figure 9-3(b). Infinite elements allow representation of the semi-infinite nature of the soil subgrade. The interfaces between various pavement layers are important to simulate in realistic nature in order to avoid over or under constraining the model. The approach adopted in present work is to utilize frictional interfaces between various pavement layers. Frictional interfaces are simulated in the model by defining node pairs along which frictional sliding is allowed. A frictional interface coefficient controls the allowable sliding and shear traction translation and it has to be provided to the model as an input. This parameter is dependent on the interface between the layers, for example the interface between asphalt concrete and granular layer might have different value as opposed to granular base and soil subgrade. In the work presented here, the frictional interface coefficient is used as per recommendations developed in previous studies (Paulino et al., 2006, Bozkurt, 2000). These previous studies simulated pavement responses to falling weight deflectometer (FWD) and compared those with actual FWD measurements to determine the frictional coefficients.
In case of reflective cracking simulations of asphalt overlays on old rigid pavement, it is important to consider the load transfer devices in the existing pavement. Often times, the load transfer efficiency (LTE) is quite low and in those cases the present of load transfer devices can be ignored. However, in some instances there is relatively high LTE. In the approach presented here, the load transfer mechanism can be simulated through use of spring elements that join the two slabs. The stiffness of these elements are determined by conducting FE simulation of the model to replicate FWD testing. The spring stiffness are altered until the LTE in simulations match the LTE from FWD test. For the results presented in this report, the simulations were conducted with assumptions that there was minimal load transfer between slabs or along cracks in existing pavement. Please note that this still results in approximately 35% load transfer efficiency along the joints and cracks.
9.2.2.4 Loading Conditions
Pavements undergo relatively complicated loading conditions during the course of their service. Loads can be categorized as gravity loads, thermal loads, and tire loads. Gravity loads are imposed on the pavement from self-weight and are always present. It is important to include these in the simulations to ensure that the responses are reliable. In case of dynamic simulations, ignoring gravity loads can lead to substantial errors in calculated responses.
Thermal loads on the pavement structure are transient and depend on factors including air temperature, sunshine, precipitation etc. The thermal loads for various pavement sections in this study were evaluated using Enhanced Integrated Climatic Model (EICM) proposed by Larson and Dempsey (1997). EICM is also used in the AASHTOWare PavementME design system. EICM predicts the pavement temperature profiles as function of time and depth. Figure 9-4(a) shows pavement surface temperature along with the temperature at the bottom of the overlay (or top of existing PCC pavement). The pavement temperature profile through the thickness of asphalt overlay and PCC slab for a 24 hour duration is shown in Figure 9-4(b). For each of the five pavement sections used in this task (sections are discussed in detail in the next chapter), separate EICM simulations were conducted using climate data files form the AASHTOWare PavementME. Using this information that coldest pavement surface temperatures were chosen to determine the critical conditions for analysis.

81
Figure 9-4 EICM Prediction of Pavement Temperatures
(a) Temperature at overlay surface and bottom during the coldest predicted 5-day duration for a pavement.
(b) Temperature profile during critical cooling event
Feb09
-20 C
-10 C
0 C
10 C
20 C
Feb12Feb10 Feb11 Feb14Feb13
AC Surface Temperature
PCC Surface Temperature
0
5
10
15
20
25
30
-15 -10 -5 0 5 10
Temperature (C)
Dep
th (
mm
)
9:00 AM 10:00 AM 11:00 AM 12:00 PM 1:00 PM 2:00 PM
3:00 PM 4:00 PM 5:00 PM 6:00 PM 7:00 PM 8:00 PM
9:00 PM 10:00 PM 11:00 PM 12:00 AM 1:00 AM 2:00 AM
3:00 AM 4:00 AM 5:00 AM 6:00 AM 7:00 AM 8:00 AM
82
The approach used in the present work is to simulate the climatic events with the coolest pavement surface temperatures as well as the ones with the highest cooling rates. This simplification is made to limit the simulation times to matter of hours and days as opposed to weeks and months for analyzing single pavement site. These critical climatic conditions are chosen for two reasons: at lower temperatures asphalt mixture behavior is less relaxant and more brittle and at faster cooling rates asphalt mixture has less time to undergo stress relaxation. The temperature loads are applied to the model in terms of transient temperature values for each node in overlay and underlying pavement layers. Note that it is important to choose appropriate initial temperature conditions to ensure that the thermal stresses simulated in pavement structures are not too high. In the study discussed here the warmest pavement surface conditions in the preceding 5 days (120 hours) to the coolest surface temperature condition was chosen as initial condition. Furthermore, as it can be seen from Figure 9-4(b), there is a lag between the coldest asphalt overlay surface temperature and corresponding coldest temperature experienced by PCC slab. Thus, it is important to continue the simulation after the surface has experience the coolest temperature until the PCC slab also begins to undergo heating cycle.
Tire loads can be applied to pavement models by means of various approaches. The primary distinction is use of quasi-static versus dynamic loading conditions. This also has direct implication on the modeling scheme and the corresponding simulation times. The study presented here is conducted using quasi-static assumptions. This was necessary due to the duration of simulated pavement response which ranged from 60-120 hours. While dynamic simulations allow for closer representation of pavement response under the traffic loading conditions, the required simulation times would increase substantially if a duration of 120 hours was simulated. In the current study tire loads were discretized as number of point loads applied over the nodes using principle of equivalent work. Using this principle, the magnitude of point load at any node corresponds to the area of tire imprint covered by elements surrounding such node are calculated. This discretization procedure is based on the principle of equivalent work. This type of approach is especially important for loads applied in regions of varying element sizes. A tire pressure of 100 psi (700 kPa) was used as the magnitude of load. This was applied in form of load of 9 kip (40 kN). Due to use of quasi-static conditions the tire load was applied directly on top of the joint. While traditional cohesive zone approach is not designed for fatigue type of progressive damage accumulation, during the course of a cooling cycle, the formation of softened region and propagation of crack occurs gradually as temperature continues to drop. In order to capture this effect, the tire loads are applied to the model throughout the cooling cycle. For the approach discussed here, one set of tire loads are applied at each hour.
9.2.3 Simulation Post-Processing
The results from the finite element analysis of pavements can be obtained in number of different ways through post-processing. For simpler analysis stress contour plots are often generated and presented. Because of the complexity of pavement cracking analysis, a special scheme has been proposed to analyze and present the results. This sub-section presents an example to discuss the post-processing of cohesive zone based pavement simulation results.
As an example, a simulation of cracking for a beam loaded in 3-point bending is discussed, Figure 9-5 shows the schematics of the beam with the region of cracking and softening shown in zoomed section. Furthermore, it can be seen that a part of the height of the beam (y direction) has already been cracked and portion of the beam has already undergone damage (indicated by region in softening). The finite-element simulations provide the opening displacement for the cohesive elements that are inserted along the crack path. This information can be used to determine the portion of beam height that is

83
undamaged (portion above softened region), softened (damaged) and completely separated (cracked) as well as it is also possible to determine the extent of softening in softened region. Figure 9-6 shows the cohesive zone element opening displacement plot for the beam. On basis of the fracture properties of the material as well as the cohesive zone model used for simulations, the threshold displacements, i.e. δcc (corresponding to the softening (‘S’)) and δcr (corresponding to complete separation (‘C’)), can be determined and are also shown on Figure 9-6 for this example. Using those threshold displacements, the extent of cracking and softening can be determined, in the boundary value problem shown in Figure 9-5 with results shown in Figure 9-6, it can be seen that a crack (complete separation) 3.4-mm length from bottom of the beam has formed and the region between 3.4-mm and 7-mm has softening. The tabulated result for the current example of beam are shown in Table 9.1.
Figure 9-5 Schematic Showing a Beam in 3-point Bending Configuration with Regions of Cracking and Softening
Softening Region
x
y
Depth of crack
Depth of softening

84
Figure 9-6 Opening Displacement along CZ Elements for the Beam Example and Use of Opening Displacement to Determine Extent of Cracking and Damage (Softening)
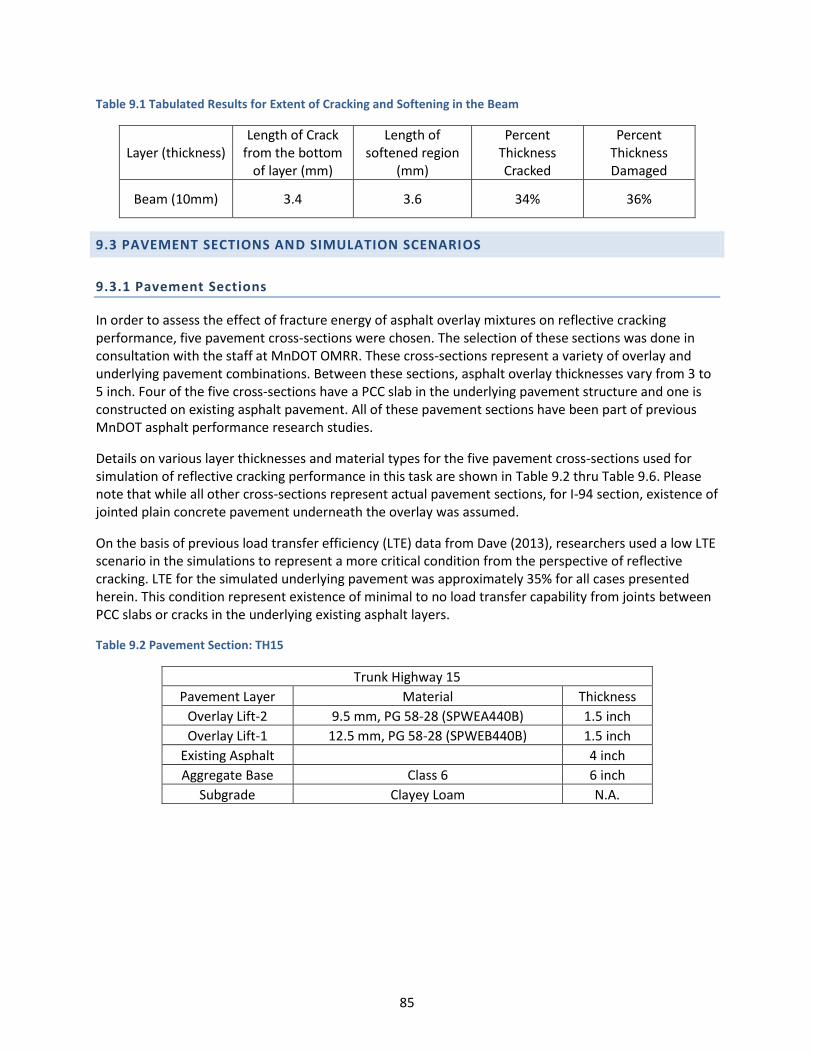
85
Table 9.1 Tabulated Results for Extent of Cracking and Softening in the Beam
Layer (thickness) Length of Crack
from the bottom of layer (mm)
Length of softened region
(mm)
Percent Thickness Cracked
Percent Thickness Damaged
Beam (10mm) 3.4 3.6 34% 36%
9.3 PAVEMENT SECTIONS AND SIMULATION SCENARIOS
9.3.1 Pavement Sections
In order to assess the effect of fracture energy of asphalt overlay mixtures on reflective cracking performance, five pavement cross-sections were chosen. The selection of these sections was done in consultation with the staff at MnDOT OMRR. These cross-sections represent a variety of overlay and underlying pavement combinations. Between these sections, asphalt overlay thicknesses vary from 3 to 5 inch. Four of the five cross-sections have a PCC slab in the underlying pavement structure and one is constructed on existing asphalt pavement. All of these pavement sections have been part of previous MnDOT asphalt performance research studies.
Details on various layer thicknesses and material types for the five pavement cross-sections used for simulation of reflective cracking performance in this task are shown in Table 9.2 thru Table 9.6. Please note that while all other cross-sections represent actual pavement sections, for I-94 section, existence of jointed plain concrete pavement underneath the overlay was assumed.
On the basis of previous load transfer efficiency (LTE) data from Dave (2013), researchers used a low LTE scenario in the simulations to represent a more critical condition from the perspective of reflective cracking. LTE for the simulated underlying pavement was approximately 35% for all cases presented herein. This condition represent existence of minimal to no load transfer capability from joints between PCC slabs or cracks in the underlying existing asphalt layers.
Table 9.2 Pavement Section: TH15
Trunk Highway 15
Pavement Layer Material Thickness
Overlay Lift-2 9.5 mm, PG 58-28 (SPWEA440B) 1.5 inch
Overlay Lift-1 12.5 mm, PG 58-28 (SPWEB440B) 1.5 inch
Existing Asphalt 4 inch
Aggregate Base Class 6 6 inch
Subgrade Clayey Loam N.A.

86
Table 9.3 Pavement Section: TH14
Trunk Highway 14
Pavement Layer Material Thickness
Overlay Lift-2 12.5 mm, PG 58-28 (SPWEB340B) 1.5 inch
Overlay Lift-1 12.5 mm, PG 58-28 (SPWEB340B) 1.5 inch
Existing Asphalt 5.75 inch
PCC Slab 7 inch
Subgrade Silty Clayey Loam N.A.
Table 9.4 Pavement Section: I 90
Interstate 90
Pavement Layer Material Thickness
Overlay Lift-1 12.5 mm, PG 64-28 (SPWEB440E) 3 inch
PCC Slabs 8 inch
Bituminous Stress Relief 1 inch
PCC Slab 8 inch
Subbase Class 5 3 inch
Subbase Class 4 3 inch
Subgrade Silty Clayey Loam N.A.
Table 9.5 Pavement Section: TH280
Trunk Highway 280
Pavement Layer Material Thickness
Overlay Lift-3 9.5 mm, PG 64-34 (SPWEA440F) 1.5 inch
Overlay Lift-2 9.5 mm, PG 64-34 (SPWEA440F) 1.75 inch
Overlay Lift-1 UTBWC (PMB) 0.75 inch
PCC Slab 9 inch
Base Class 5 3 inch
Subbase Class 4 9 inch
Subgrade Silty Clay N.A.

87
Table 9.6 Pavement Section: I 94
Interstate 94
Pavement Layer Material Thickness
Overlay Lift-2 12.5 mm, PG 70-28 (SPWEB540H) 2.5 inch
Overlay Lift-1 12.5 mm, PG 70-28 (SPWEB540H) 2.5 inch
PCC Slab*
8 inch
Base Class 6 12 inch
Subgrade Silty Clay Loam N.A.
* Actual section for I-94 does not consist of PCC slab.
The mechanical properties of various pavement materials, other than overlay mixtures, as used in simulations are provided in Table 9.7. The source of these values are also shown in the table. As discussed in previous chapter, the asphalt mixtures (overlays, ultra-thin bonded wear course, underlying existing asphalt layer and stress-relief interlayer) were simulated using linear viscoelastic material properties that are time, temperature and load history dependent. Since asphalt mixtures used in the present study were not available for lab testing, properties of asphalt mixtures closest the ones simulated here were used. The overlay mixtures evaluated in this study are similar to those tested and analyzed by Marasteanu et al. (2012) and Dave et al. (2017) for previous MnDOT research studies. Linear viscoelastic properties from these previous studies were utilized in the current project.
Table 9.7 Pavement Material Properties
Materials Elastic
Modulus (psi) Poisson's
Ratio
Coefficient of Thermal Expansion and Contraction
(/°C) Source
PCC Slab 4,600,000 0.20 1.00E-05 FHWA
Class 4 Agg. Base 26,000 0.35 na
MnPAVE Late Spring
Value
Class 5 Agg. Base 23,000 0.35 na
Class 6 Agg. Base 20,000 0.35 na
Clayey Loam 7,000 0.40 na
Silty Clayey Loam 6,100 0.40 na
Silty Clay 5,900 0.40 na
9.3.2 Simulated Asphalt Mix Fracture Energy Levels
Since the main focus of this task was to determine the sensitivity of asphalt overlay fracture energy on the expected reflective cracking performance, parametric evaluations were conducted for each of the five simulated pavement sections. Over the course of this task more than 100 finite element runs were conducted. The results from over 35 finite element simulations were utilized for assessing the primary objective of this research effort. For each traditional asphalt mix layers, fracture energies of 300, 400, 500, 600 and 700 J/m2 were simulated. For the ultra-thin bonded wear course (UTBWC) interlayer lift fracture energies of 500 and 650 J/m2 simulated. These fracture energy values for UTBWC were chosen on basis of previous research by Ahmed et al. (2012). When asphalt overlay consisted of multiple types

88
of asphalt mixtures (which was the case for four out of five simulated pavement sections), analyses were conducted by changing fracture energy of one lift at a time while others were held constant. Typically, 400 J/m2 of fracture energy was used as the constant value for an asphalt mix layer when fracture energy of other layer was changed. Various fracture energy combinations that were simulated for each of the five overlay sections are shown in Table 9.8.
Table 9.8 Fracture Energy Combinations for Simulated Overlays
Highway Overlay
Lift Material
Fracture Energy Combinations (J/m2)
1 2 3 4 5 6 7 8 9
TH 15
2 9.5 mm, PG 58-28
(SPWEA440B) 300 400 500 600 700 400 400 400 400
1 12.5 mm, PG 58-28
(SPWEB440B) 400 400 400 400 400 300 500 600 700
TH 14
2 12.5 mm, PG 58-28
(SPWEB340B) 300 400 500 600 700 400 400 400 400
1 12.5 mm, PG 58-28
(SPWEB340B) 400 400 400 400 400 300 500 600 700
I 90 1 12.5 mm, PG 64-28
(SPWEB440E) 300 400 500 600 700 na na na na
TH 280
3 9.5 mm, PG 64-34
(SPWEA440F) 300 400 400 400 450 500 na na na
2 9.5 mm, PG 64-34
(SPWEA440F) 400 400 450 400 450 500 na na na
1 UTBWC (PMB) 650 650 650 500 500 500 na na na
I 94
2 12.5 mm, PG 70-28
(SPWEB540H) 300 400 500 600 400 400 na na na
1 12.5 mm, PG 70-28
(SPWEB540H) 400 400 400 400 500 600 na na na
Apart from fracture energy, tensile strength of material is another input in the cohesive zone model. In the research presented here, cohesive strength values from previous studies on asphalt mixtures of similar origin were used (Marasteanu et al. 2012, Dave and Hoplin, 2015). Strength values for various asphalt mixtures in this study are provided in Table 9.9.

89
Table 9.9 Cohesive Strength for Simulated Asphalt Mixtures
Highway Overlay Lift Material Strength
(MPa)
TH 15 2 9.5 mm, PG 58-28 (SPWEA440B) 2.00
1 12.5 mm, PG 58-28 (SPWEB440B) 2.25
TH 14 2 12.5 mm, PG 58-28 (SPWEB340B) 2.25
1 12.5 mm, PG 58-28 (SPWEB340B) 2.25 I 90 1 12.5 mm, PG 64-28 (SPWEB440E) 2.50
TH 280
3 9.5 mm, PG 64-34 (SPWEA440F) 2.50
2 9.5 mm, PG 64-34 (SPWEA440F) 2.50
1 UTBWC (PMB) 2.00
I 94 2 12.5 mm, PG 70-28 (SPWEB540H) 3.00
1 12.5 mm, PG 70-28 (SPWEB540H) 3.00
9.4 DISCUSSIONS OF SIMULATION RESULTS
This section presents the discussion of finite element analysis results. The predicted asphalt overlay performance in terms of amount of softened (damaged) and cracked overlay thicknesses when simulated with the critical cracking conditions is discussed first. Results are provided for each pavement sections for various fracture energy combinations. Thereafter, recommendations for fracture energy thresholds are provided for the five study sections. Finally, comparisons are made between recommendations developed using finite element simulations and those made using field performance of asphalt overlays in Minnesota (discussed and presented in Chapter 8).
9.4.1 Predicted Performances of Individual Pavement Sections
9.4.1.1 Trunk Highway 15 (TH 15)
The results for each pavement section are presented in terms of the extent of the overlay thickness that was either damaged (softened) or cracked when a certain value of fracture energy was used for asphalt mixtures within that overlay. Since majority of pavement sections consist of multiple lift and often times with different type of mixtures, the results are presented in two ways. First the extent of overlay thickness damage and cracking is presented with respect to equivalent fracture energy of the overlay. The equivalent fracture energy of the overlay is determined by calculating a weighted average fracture energy with respect to the lift thicknesses as the weight functions. In terms of equation this is shown below in equation (11).
𝑛 𝑖𝑒𝑞. ∑ 𝐺
𝐺 = 𝑖=1 𝑓 × ℎ𝑖⁄𝑓 ∑𝑛 (11)
𝑖=1ℎ𝑖
Where,

90
𝐺𝑓𝑒𝑞.
= Equivalent fracture energy of the overlay;
𝐺𝑓𝑖 = Fracture energy of lift, i;
ℎ𝑖 = Thickness of the lift; and,
n = Number of lifts in the overlay.
For TH 15, the observations regarding effects of equivalent fracture energy with predicted amounts of asphalt overlay damage and cracking is shown in Figure 9-7. As discussed in Section 9.2.3, the damaged and cracked values shown in the results presented herein represent the expected level of damage and cracking in overlay over one joint/crack in underlying pavement. Furthermore, these value represent the amount of damage or crack as function of the thickness of overlay. These quantities have been shown in previous studies to provide a reliable estimate of the potential for reflective cracking.
As expected, the increasing equivalent fracture energy results in lowering of the amount of damage and cracking through overlay thickness. An interesting observation is that for a same equivalent fracture energy, different amounts of damage and cracking is predicted. A further exploration on this observation is discussed next in terms of fracture energies of individual lifts.
Figure 9-7 Impact of Equivalent Overlay Fracture Energy on Extent of Damaged and Cracked Overlay Thickness for Trunk Highway 15 Pavement Section
Lift specific damage and cracking amounts with respect to fracture energy changes is presented in Figure 9-8. The results in this figure show the extent of lift damage and cracking with respect to that lift’s fracture energy with assumption that the other lift’s fracture energy was held constant at 400 J/m2. Unlike previous figure, now there are not inconsistencies regarding differing predicted performances at a constant equivalent. Furthermore, the results plotted in Figure 9-8 revealed that the fracture energy of asphalt lift immediately above the joint is more critical and thus two equivalent fracture energies can result in differing performances depending on whether higher fracture energy mix was immediately above the joint or not. This is evident from the results of the percent cracked overlay thickness at fracture energy of 500 J/m2. When lift-1 (lift immediately above the joint) has fracture energy of 400 J/m2 and lift-2 has 500 J/m2 approximately 73% of overlay thickness is cracked, whereas when lift-1 has

91
fracture energy of 500 J/m2 and lift-2 has 400 J/m2, there is not crack through the overlay thickness. Thus, demonstrating the need for higher fracture energy mixture in the first lift of the overlay.
Figure 9-8 Effects of Fracture Energies of Individual Lifts on Overlay Thickness Damage and Cracking for Trunk Highway 15 Pavement Section (plot shows performance of each lift when fracture energy of other lift is held
constant)
9.4.1.2 Trunk Highway 14 (TH 14)
The amount of damage and cracking through overlay thickness for TH 14 with respect to the equivalent fracture energy of the overlay is presented in Figure 9-9. The results shown in this figure show that as the equivalent fracture energy of the overlay increases the extent of damage and cracking in the overlay decreases. As with TH 15 there are instances where the equivalent fracture energy of the whole overlay is same but the amount of predicted damage and cracking is different. Figure 9-10 shows the reflective cracking performances of individual lifts with respect to their corresponding fracture energy changes. The results presented in this figure reconfirm the need for high fracture energy mixtures for first lift of the overlay.

92
Figure 9-9 Impact of Equivalent Overlay Fracture Energy on Extent of Damaged and Cracked Overlay Thickness for Trunk Highway 14 Pavement Section
Figure 9-10 Effects of Fracture Energies of Individual Lifts on Overlay Thickness Damage and Cracking for Trunk Highway 14 Pavement Section (plot shows performance of each lift when fracture energy of other lift is held
constant)
9.4.1.3 Interstate 90 (I 90)
Overlay structure for I 90 was simulated with a single type of asphalt mixture, thus all of the three-inch thickness of overlay to be represented with same properties. Figure 9-11 shows the relationship between the asphalt mix fracture energy and the predicted amount of damage and cracking through the overlay thickness. For this pavement section a fracture energy of 600 J/m2 represented the threshold at which there was no macro-cracking in the asphalt mixture within the vicinity of joint. While there was no macro-crack prediction, approximately 67% of the overlay thickness was damages (softened) in instance. At 650 J/m2 there was no predicted damage as well.
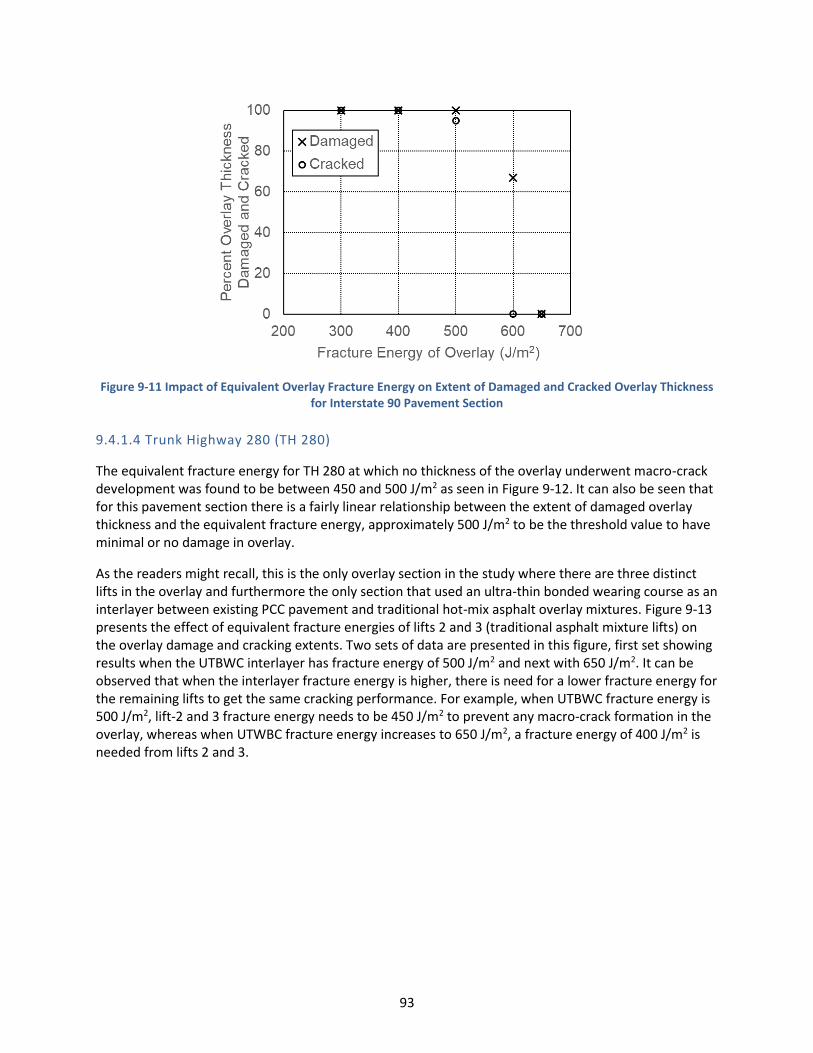
93
Figure 9-11 Impact of Equivalent Overlay Fracture Energy on Extent of Damaged and Cracked Overlay Thickness for Interstate 90 Pavement Section
9.4.1.4 Trunk Highway 280 (TH 280)
The equivalent fracture energy for TH 280 at which no thickness of the overlay underwent macro-crack development was found to be between 450 and 500 J/m2 as seen in Figure 9-12. It can also be seen that for this pavement section there is a fairly linear relationship between the extent of damaged overlay thickness and the equivalent fracture energy, approximately 500 J/m2 to be the threshold value to have minimal or no damage in overlay.
As the readers might recall, this is the only overlay section in the study where there are three distinct lifts in the overlay and furthermore the only section that used an ultra-thin bonded wearing course as an interlayer between existing PCC pavement and traditional hot-mix asphalt overlay mixtures. Figure 9-13 presents the effect of equivalent fracture energies of lifts 2 and 3 (traditional asphalt mixture lifts) on the overlay damage and cracking extents. Two sets of data are presented in this figure, first set showing results when the UTBWC interlayer has fracture energy of 500 J/m2 and next with 650 J/m2. It can be observed that when the interlayer fracture energy is higher, there is need for a lower fracture energy for the remaining lifts to get the same cracking performance. For example, when UTBWC fracture energy is 500 J/m2, lift-2 and 3 fracture energy needs to be 450 J/m2 to prevent any macro-crack formation in the overlay, whereas when UTWBC fracture energy increases to 650 J/m2, a fracture energy of 400 J/m2 is needed from lifts 2 and 3.

94
Figure 9-12 Impact of Equivalent Overlay Fracture Energy on Extent of Damaged and Cracked Overlay Thickness for Trunk Highway 280 Pavement Section
Figure 9-13 Effects of Equivalent Fracture Energies of Lifts 2 and 3 on Overlay Thickness Damage and Cracking for Trunk Highway 280 Pavement Section (plot shows combined performance of lifts 2 and 3 when fracture energy
of UTBWC is held constant at 500 and 650 J/m2)
9.4.1.5 Interstate 94 (I 94)
The simulation results from the fracture energy parametric evaluations agree with the results and discussion presented for other pavement sections. The effects of equivalent fracture energy on the potential for reflective cracking formation is shown in Figure 9-14. As with other sections, an increasing equivalent fracture energy lowered potential for reflective crack formation with a limit value of approximately 525 J/m2 for minimal reflective cracking potential.
As with other pavement sections, the higher fracture energy for lift-1 for this section also predicted lower reflective cracking potential (c.f. Figure 9-15). Lift-1 fracture energy of 600 J/m2 and lift-2 fracture

95
energy of 400 J/m2 corresponded to no macro-crack formation in the overlay, however even with these fracture energies there was substantial amount of damage (softening) predicted in the overlay. The next section of this report discusses the recommended fracture energy thresholds as determined using finite element simulations.
Figure 9-14 Impact of Equivalent Overlay Fracture Energy on Extent of Damaged and Cracked Overlay Thickness for Interstate 94 Pavement Section
Figure 9-15 Effects of Fracture Energies of Individual Lifts on Overlay Thickness Damage and Cracking for Interstate 94 Pavement Section (plot shows performance of each lift when fracture energy of other lift is held
constant)
9.4.2 Determination of Recommended Fracture Energy Thresholds for Overlays
In addition to the parametric evaluations that focused on determining the effects of asphalt mixture fracture energy on reflective cracking potential of overlays, fracture energies thresholds were also determined for each of the asphalt mixtures within the five pavement sections. The objective function for finding recommended fracture energy was such that there was no predicted damage (softening) or

96
crack formation in the overlay during the simulated critical cracking conditions. It is acknowledged that this is excessively conservative approach. Once again the critical conditions used in this research focused on simulation of five-day period with coldest pavement temperatures, furthermore, it should be noted that in order to build extra factor of safety the moduli values for base, subbase and subgrade layers were chosen from MnPAVE to represent late spring conditions.
The recommended fracture energy thresholds for the five cases studied herein are presented in Table 9.10. As discussed in the previous section, the required fracture energies for first lifts of overlays are greater than other lifts. The required fracture energy values for the first lift are higher than the currently recommended value of 450 J/m2 for wear courses to lower thermal cracking potential, however it should be noted that most of the overlays studied herein are fairly thin (3 inch) and they would require either a high fracture resistance or increased overlay structure to prevent reflective cracking. In the subsequent section of this report the recommended fracture energy thresholds form finite element analysis are compared with those that were determined on basis of field performance (discussed in Chapter 8 of this report).
Table 9.10 Recommended Fracture Energy Thresholds for the Study Pavement Sections to Protect Against Reflective Cracking
Highway Overlay
Lift Material
Recommended Fracture Energy to Minimize Reflective Cracking
Potential (J/m2)
TH 15 2 9.5 mm, PG 58-28 (SPWEA440B) 650
1 12.5 mm, PG 58-28 (SPWEB440B) 700
TH 14 2 12.5 mm, PG 58-28 (SPWEB340B) 450
1 12.5 mm, PG 58-28 (SPWEB340B) 700 I 90 1 12.5 mm, PG 64-28 (SPWEB440E) 650
TH 280
3 9.5 mm, PG 64-34 (SPWEA440F) 400
2 9.5 mm, PG 64-34 (SPWEA440F) 450
1 UTBWC (PMB) 650
I 94 2 12.5 mm, PG 70-28 (SPWEB540H) 450
1 12.5 mm, PG 70-28 (SPWEB540H) 600
9.4.3 Comparisons of the Simulation based Fracture Energies Recommendations with the Field Performance based Fracture Energy Recommendations
A previous task of this research project evaluated the required fracture energy for asphalt overlays to resist against reflective cracking in asphalt overlays. As discussed in chapter 8, field measured reflective cracking amounts have been correlated with overlay fracture energy. As with this the finite element based evaluations, an approach of finding equivalent fracture energy was used in that previous effort. Furthermore, a parameter called total fracture resistance of overlays has been proposed. This parameter is the product of average fracture energy of the asphalt mixture and the thickness of the overlay, thus it represents the required energy per unit width of the overlay. This parameter integrates material property of overlay with the structural contribution in terms of overlay thickness. This approach has been adopted to account for differences in overlay thicknesses between different sections.

97
A comparison between the total fracture resistance of overlay from field performance data for no cracking, low cracking (20% reflected cracks at 10 years) and moderate cracking (40% reflected cracks at 10 years) is made with the recommendations obtained using finite element simulations. It should be kept in mind that the simulations results are for “minimized reflective cracking potential” case whereby during the critical cracking conditions overlays were protected from any softening. These comparisons are presented in Table 9.11. A comparison of the recommendations from simulations and from field performance show a very good agreement for four of the five pavement sections where the required total fracture resistance of the overlay is approximately 50 J/m. For the I 94 pavement section, the finite element simulations recommended a substantially higher total fracture resistance of 67 J/m. This high requirement might be due to assumption of presence of PCC slabs underneath the overlay, which is not the case for the actual I 94 pavement section.
The independent agreement between field data based recommendations and finite element simulation based recommendations for the total fracture resistance of asphalt overlays provide a confidence in the proposed threshold values.
Table 9.11 Comparison of the Required Total Fracture Resistance of Overlay to Protect Against Reflective Cracking using Finite Element Simulations and Field Performance Data
Highway
Required Total Fracture Resistance of
Overlay from Simulations to
minimize reflective cracking potential
(J/m)
Required Total Fracture Resistance of Overlay using Field Performance Data (J/m)
(from Task-5)
Minimized Reflective Cracking Potential
Low Cracking (20% cracking at
10 years)
Moderate Cracking (40% cracking at 10
years)
TH 15 51.4 49.3 37.0 27.8
TH 14 43.8 49.3 37.0 27.8
I 90 49.5 49.3 37.0 27.8
TH 280 47.6 49.3 37.0 27.8
I 94 66.7 49.3 37.0 27.8
9.5 SUMMARY
Finite element models for five pavement sections were constructed. Sections were chosen to represent typical overlay configurations in Minnesota on moderate to high traffic roadways. Critical cracking conditions approach was adopted in this study whereby the coolest pavement temperature conditions were simulated. Asphalt mixtures were simulated using thermo-viscoelastic material behavior with cohesive zone fracture model. The cohesive zone model allows for modelling of softening and discrete crack within finite element framework. The reflective cracking finite element modeling approach used in this study has been previously used for simulation of reflective cracks in field sections as well as accelerated pavement test studies. Previous studies have provided validation of this modelling approach.
More than 35 finite element simulation runs were used to make observations regarding effectiveness of fracture energy of asphalt mixture as a reflective cracking performance parameter. As equivalent fracture energy of the overlay increases the potential for reflective cracking decreases. Fracture energy

98
threshold values were also determined for various mixtures used in the five pavement cross-sections that would result in minimal potential for reflective cracking. The required total cracking resistance of overlay (product of fracture energy and thickness of overlay) to minimize potential for reflective cracking matched well between those predicted using finite element simulations and those determined from field reflective cracking performance (discussed in chapter 8).
While the results presented in this chapter provides a clear support to the findings discussed in chapter 8, that the fracture energy of asphalt mixture has a very good relationship to the reflective cracking performance of asphalt overlays, it also reaffirms that the thickness of overlay has to be accounted for in recommending suitable fracture energy thresholds. Furthermore, the importance of the fracture energies of various overlay lifts was clearly evident in the results. Specifically, simulation results show that the fracture energy of the asphalt mix placed immediately above existing pavement (lift-1) has greatest impact on reflective cracking performance of the whole overlay system. At present, researchers recommend that the threshold values in terms of total fracture resistance of overlay that are proposed in chapter 8 be used for pilot implementation purposes. The currently ongoing NRRA Flexible Team Long Term study (LT1) on development of performance curves for asphalt overlays will conduct finite element analysis similar to those discussed in this task. That study is also evaluating the actual field performances of various MnROAD test cells. It is proposed that the outcomes of this study be compared with findings from NRRA study to validate the thresholds of DCT fracture energy for use as reflective cracking performance parameter.

99
CHAPTER 10: PROJECT SUMMARY, CONCLUSIONS AND RECOMMENDATIONS FOR FUTURE RESEARCH
This report documents various research activities that were undertaken through MnDOT contract 99008 work order 162 titled Disc Shaped Compact Tension (DCT) Specifications Development for Asphalt Pavement. This study was initiated to provide support to MnDOT in its implementation of performance-based specifications for asphalt mixtures that utilize the DCT fracture energy. Various research tasks were established to accomplish following objectives:
Refinement of the testing procedures for the DCT fracture energy test for improving test repeatability and reproducibility as well as to improve the practicality of test procedures.
Identification of asphalt mixture adjustments (design parameters) to increase fracture energy.
Determine suitability of DCT-test-based parameters for suitability their as reflective cracking performance indicators and propose threshold values to lower the potential for premature reflective cracking in asphalt overlays.
A number of conclusions have been drawn on the basis of the results and findings from various research activities over the course of this project. Major conclusions are summarized below:
The development of a performance test database, which is critical to successfully implement performance-based material specifications. The database can not only organize performance test results but also provide the opportunity for continued statistical analyses and test reliability evaluations. Furthermore, the database allows for agencies to have a continuous feedback loop to determine if the parameter thresholds need revisions.
For fracture testing of asphalt mixtures at low temperatures, it is critical to monitor temperature at the interior of the asphalt specimens and to have companion instrumented specimens that can be used to ensure that test specimens are at correct temperature. Furthermore, the DCT fracture energy test was found to be fairly insensitive to the method used to cool test specimens from room temperature to test temperature.
On the basis of round-robin testing efforts, a 90 J/m2 reproducibility limit for DCT fracture energy (when following MnDOT modified DCT test procedure) was established. This reproducibility value was based on testing conducted at three labs. The round-robin campaign undertaken in this project provides an excellent example of the extent of sampling, testing and analysis that was necessary prior to adopting a lab-test-based performance parameter for purposes of asphalt mix design and mix acceptance.
The reheating of plant-produced loose asphalt mixtures to compact them was found to lower the fracture energy of asphalt mixtures. There was no consistent trend observed between fracture energies of test specimens fabricated using lab-produced mix design samples and plant-production during the construction period. Average variations between various sample types (lab versus plant) and aging levels (no reheat, reheat and field cores) was found to be similar or less than the expected variability in the measured fracture energy of asphalt mixtures.

100
Testing of 12 replicate specimens was found to significantly lower variability and the differences between average and maximum and average and minimum fracture energy values from replicate specimens.
An increase in the effective binder content, PG spread (difference between PG high and low temperature grades), is expected to increase fracture energy, whereas lowering of RAP content and a low-temperature grade is expected to increase fracture energy of asphalt mixtures. These findings are aligned with those found in two previous MnDOT research studies (Contract 99008 work order 40 and contract 99008 work order 100).
The cohesive zone fracture theory based on the asphalt overlay finite element model provides an efficient and economical way to evaluate effects of the asphalt mix fracture energy on the reflective cracking potential of the overlay. Without use of such a modelling approach, a substantial number of pavement test sections would need to be constructed to conduct parametric evaluations.
The total fracture resistance of overlay (product of fracture energy and overlay thickness) showed a good correlation with the field reflective cracking performance of overlays. This finding was reaffirmed through use of finite element pavement models. Furthermore, a total fracture resistance value of 50 J/m is expected to minimize the potential for reflective cracking in asphalt overlays. This limit might yield fracture energy requirements that might be impractical for thinner overlays, thus pavement engineers are strongly recommended to optimize the overlay thickness and mix selection with respect to cost.
Over the course of this research project, additional topics were identified that require further explorations. Recommendations for topics that are most mature in terms of immediate implementation and research need are summarized below:
Routine use of the DCT fracture energy test as part of a quality assurance process during the mix production and pavement construction period has some challenges associated with the required turnaround time. Use of surrogate tests during the mix production period to ensure that the as-produced mix has a similar composition and mechanical response as the mixture that has been optimized using fracture energy is one alternative to alleviate the challenge of the turnaround period to get results. Identification of surrogate test and sensitivity of such a test to common mix production variables need to be explored.
DCT fracture energy test procedures record a number of physical quantities during the test, such as force, crack mouth opening displacement, and total displacement. Additional performance index parameters, such as flexibility index, fracture strain tolerance, rate dependent cracking index, and DCT index have been proposed in recent years that utilize these physical quantities. Using the current MnDOT DCT database, these additional index parameters can be easily calculated and evaluated in terms of their suitability to predict field cracking performance of asphalt mixtures as well as to provide guidance to mix specifiers and designers.
This study showed viability in the use of fracture energy as an input in selection of asphalt mixtures for asphalt overlays as well as to guide the required overlay thickness. It was, however, found that the approach of varying fracture energy requirements for various overlay lifts might yield better optimality in terms of balancing costs and performance. The initial fracture energy recommendations for asphalt overlays to protect against premature reflective cracking needs further validation and pilot

101
implementation. While a limited amount of extended validation will occur through an on-going NRRA flexible team long-term research project, use of existing in-service pavement in Minnesota for further exploration is recommended. Specifically, cost optimizations between mix selections and overlay thicknesses should be conducted to refine the recommendation of this research and to aid in implementation efforts.

102
REFERENCES
Ahmed, S., Dave, E. V., Buttlar, W. G., & Behnia, B. (2012). Compact tension test for fracture characterization of thin bonded asphalt overlay systems at low temperature. Materials and Structures, 45(8), 1207–1220.
Ahmed, S., Dave, E. V., Buttlar, W. G., & Exline, M. K. (2013). Cracking resistance of thin-bonded overlays using fracture test, numerical simulations and early field performance. International Journal of Pavement Engineering, 14(6), 540–552.
Barenblatt, G. (1959). The formation of equilibrium cracks during brittle fracture. General ideas and hypotheses. Axially-symmetric cracks. Journal of Applied Mathematics and Mechanics, 23(3), 622–636.
Barenblatt, G. I. (1962). The mathematical theory of equilibrium cracks in brittle fracture. Advances in Applied Mechanics, 7(1), 55–129.
Bozkurt, D. (2002). Three-Dimensional Finite Element Analysis to Evaluate Reflective Cracking Potential in Asphalt Concrete Overlays. Doctorate Dissertation, University of Illinois, Urbana.
Camacho, G. T., & Ortiz, M. (1996). Computational modeling of impact damage in brittle materials. International Journal of solids and structures, 33(20), 2899–2938.
Dave, E. V., Song, S. H., Buttlar, W. G., & Paulino, G. H. (2007). Reflective and thermal cracking modeling of asphalt concrete overlays. In Advance Characterization of Pavement and Soil Engineering Materials, London, UK: CRC Press.
Dave, E. V., & Buttlar, W. G. (2010a). Low temperature cracking prediction with consideration of temperature dependent bulk and fracture properties. Road Materials and Pavement Design, 11(sup1), 33–59.
Dave, E. V., & Buttlar, W. G. (2010b). Thermal reflective cracking of asphalt concrete overlays. International Journal of Pavement Engineering, 11(6), pp. 477–488.
Dave, E. V., Ahmed, S., Buttlar, W. G., Bausano, J. P., & Lynn, T. (2010c). Investigation of strain tolerant mixture reflective crack relief systems: an integrated approach. Journal of the Association of Asphalt Paving Technologists, 79, 119-159.
Dave, E. V. (2013). Design of Asphalt Overlays using Mechanistic Fracture Simulations. Final Report for MnDOT Agreement No. 02247. St. Paul, MN: Minnesota Department of Transportation.
Dave, E. V., & Hoplin, C. (2015). Flexible pavement thermal cracking performance sensitivity to fracture energy variation of asphalt mixtures. Road Materials and Pavement Design, 16(sup1), 423–441.
Dave, E.V., Hanson, C., Helmer, B., Dailey, J., Hoplin, C. (2015), Laboratory Performance Test for Asphalt
Concrete, Final Report for Work Order 40, Minnesota Department of Transportation, Research Services
Section. St. Paul, MN: Minnesota Department of Transportation.
Dave, E. V., Hoplin, C., Helmer, B., Dailey, J., Van Deusen, D., Geib, J., Dai, S., & Johanneck, L. (2016). Effects of mix design and fracture energy on transverse cracking performance of asphalt pavements in Minnesota. Transportation Research Record, 2576, 40-50, 2016. http://dx.doi.org/10.3141/2576-05

103
Dave, E. V., DeCarlo, C., Hoplin, C. M., Helmer, B., Dailey, J., & Williams, R. C. (2017). Impact of Low Asphalt Binder for Coarse HMA Mixes. Report Number MN/RC 2017-27. St. Paul, MN: Minnesota Department of Transportation, Research Services Section.
Nemati, R., & Dave, E. (2017). Nominal property based predictive models for asphalt mixture complex modulus (dynamic modulus and phase angle). Construction and Building Materials, 158, 308–319.
Dugdale, D. S. (1960). Yielding of steel sheets containing slits. Journal of the Mechanics and Physics of Solids, 8(2), 100–104.
Espinosa, H. D., & Zavattieri, P. D. (2003). A grain level model for the study of failure initiation and evolution in polycrystalline brittle materials. Part I: Theory and numerical implementation. Mechanics of Materials, 35(3), 333–364.
Geubelle, P. H., & Baylor, J. S. (1998). Impact-induced delamination of composites: A 2D simulation. Composites Part B: Engineering, 29(5), 589–602.
Kim, Y., Aragão, F. T. S. (2013). Microstructure modeling of rate-dependent fracture behavior in bituminous paving mixtures. Finite Elements in Analysis and Design, 63, 23–32.
Larson, G., & Dempsey, B. J. (1997). Enhanced integrated climatic model: Version 2.0. Report No. DTFA MN/DOT 72114. Minneapolis, MN: Minnesota Road Research Project and Federal Highway Administration.
Li, X., & Marasteanu, M. O. (2010). The fracture process zone in asphalt mixture at low temperature. Engineering Fracture Mechanics, 77(7), 1175–1190.
Marasteanu, M., Buttlar, W., Bahia, H., Williams, C., Moon, K. H., Teshale, E. Z., ... & Ahmed, S. (2012). Investigation of low temperature cracking in asphalt pavements national pooled fund study–phase II. Final Report. St. Paul, MN: Minnesota Department of Transportation.
Paulino, G. H., Song, S. H., & Buttlar, W. G. (2004). Cohesive zone modeling of fracture in asphalt concrete. In Proceedings of the 5th International RILEM Conference–Cracking in Pavements: Mitigation, Risk Assessment, and Preservation (pp. 63-70). Limoges, France.
Paulino, G. H., W. G. Buttlar, & Blankenship, P. B. (2006). GOALI: Reflective Crack Control Treatment and Design Procedures: A New Integrated Approach. National Science Foundation, (NSF) Project 0219566, Final Report. The National Academies, Washington DC.
Saskatchewan Ministry of Transportation. (1996). Interlaboratory testing program from the Saskatchewan Highways and Transportation Procedures Manual. Retrieved from http://www.highways.gov.sk.ca/304-3/.
Soares, J., de Freitas, F., & Allen, D. (2003). Considering material heterogeneity in crack modeling of asphaltic mixtures. Transportation Research Record: Journal of the Transportation Research Board, 1832, 113–120.
Song, S. H., Paulino, G. H., & Buttlar, W. G. (2006). A bilinear cohesive zone model tailored for fracture of asphalt concrete considering viscoelastic bulk material. Engineering Fracture Mechanics, 73(18), 2829–2848.

104
Wagoner, M., Buttlar, W., Paulino, G., & Blankenship, P. (2005). Investigation of the fracture resistance of
hot-mix asphalt concrete using a disc-shaped compact tension test. Transportation Research Record:
Journal of the Transportation Research Board, 1929, 183–192.
Xu, X. P., & Needleman, A. (1994). Numerical simulations of fast crack growth in brittle solids. Journal of the Mechanics and Physics of Solids, 42(9), 1397–1434.

APPENDIX A: RESULTS OF DCT TESTING OF ROUND ROBIN SPECIMENS AT THE UNIVERSITY OF NEW HAMPSHIRE

A-1
Research effort undertaken to refine the Disc Shaped Compact Tension (DCT) Specifications, four labs
participated in the "Round Robin" research to verify the repeatability and reproducibility of DCT test.
The labs were at MnDOT OM&RR, American Engineering Testing (AET), Braun Intertec, and the
University of Minnesota Duluth (UMD). Testing was completed in all labs except UMD and the results
were presented as part of Task 3. UMD was unable to complete testing due to their equipment not
meeting the MnDOT Modified specification requirement. Therefore, the specimens were delivered to
University of New Hampshire (UNH) and tested in September 2016.
Materials
According to the research objective of the Round Robin project, loose mix from 16 projects were
included in the study to verify the repeatability and reproducibility of DCT test. From loose mix
collected, 4 replicates (a total of 64 specimens) were compacted and delivered to each lab for testing.
Accordingly, testing of the 192 specimens was completed by MnDoT, AET, and Braun in June of 2015
and results were presented as part of Task-3 report. The remaining specimens not tested by UMD were
delivered to UNH for testing in September 2016. Contrary to the reported (in task 3 report) presence of
64 untested specimens to complete the UMD part of the study, only 30 specimens were delivered to
UNH for a reason not known at this stage. DCT testing on the specimens was completed at UNH. Mixture
and testing information is summarized in Table A-1.
Table A-1: Mixture and DCT Test Information.
Roadway PG Grade
Aggregate
Size (in)
% RAP Test Temp
(°C)
No. of
Replicates
TH 59 Roundabout 64-34 ¾ 16% -23.7 4
CSAH 133 58-34 ¾ 18% -25.9 4
TH 61 Little Marais 58-34 ¾ 15% -22.1 3
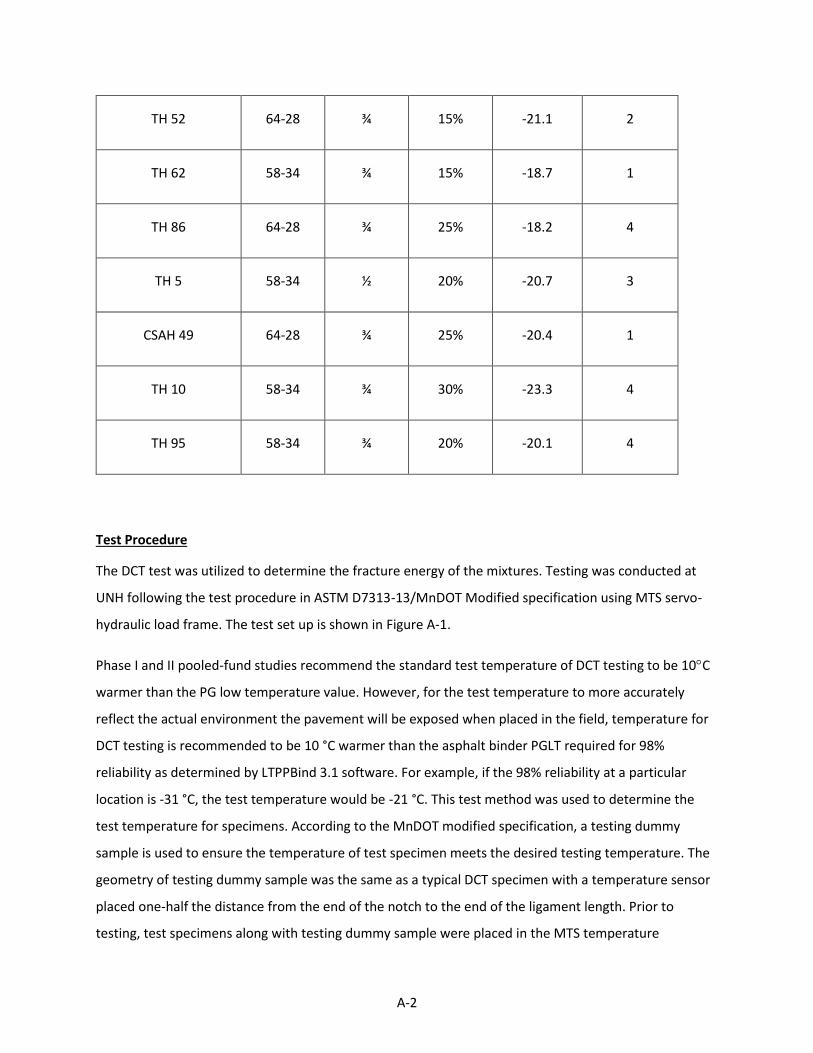
A-2
TH 52 64-28 ¾ 15% -21.1 2
TH 62 58-34 ¾ 15% -18.7 1
TH 86 64-28 ¾ 25% -18.2 4
TH 5 58-34 ½ 20% -20.7 3
CSAH 49 64-28 ¾ 25% -20.4 1
TH 10 58-34 ¾ 30% -23.3 4
TH 95 58-34 ¾ 20% -20.1 4
Test Procedure
The DCT test was utilized to determine the fracture energy of the mixtures. Testing was conducted at
UNH following the test procedure in ASTM D7313-13/MnDOT Modified specification using MTS servo-
hydraulic load frame. The test set up is shown in Figure A-1.
Phase I and II pooled-fund studies recommend the standard test temperature of DCT testing to be 10C
warmer than the PG low temperature value. However, for the test temperature to more accurately
reflect the actual environment the pavement will be exposed when placed in the field, temperature for
DCT testing is recommended to be 10 °C warmer than the asphalt binder PGLT required for 98%
reliability as determined by LTPPBind 3.1 software. For example, if the 98% reliability at a particular
location is -31 °C, the test temperature would be -21 °C. This test method was used to determine the
test temperature for specimens. According to the MnDOT modified specification, a testing dummy
sample is used to ensure the temperature of test specimen meets the desired testing temperature. The
geometry of testing dummy sample was the same as a typical DCT specimen with a temperature sensor
placed one-half the distance from the end of the notch to the end of the ligament length. Prior to
testing, test specimens along with testing dummy sample were placed in the MTS temperature

A-3
controlled chamber. Then, the chamber temperature is adjusted to the desired temperature. During this
process as recommended, the temperature of specimens and testing dummy did not exceed 1.20℃
colder than the desired temperature. Specimens and testing dummy remained in the temperature
controlled chamber for a minimum of two hours before commencing the test. After two hours
conditioning at desired temperature, the first specimen was installed in the MTS. Once the desired
testing temperature is reached, a tensile load is applied to the specimen at a constant CMOD rate of
1mm/min. During the test the temperature of testing dummy and chamber air was recorded in l second
interval. The test was completed when the post peak load level reduced to 0.1kN.
The data collected from the test was analyzed using a MATLAB code as well as Microsoft Excel to obtain
the fracture energy, peak load and some other indices of the mixtures. The indices are Normalized
Fracture Energy Index (Gf/m) and fracture strength (Sf) and are calculated based on the study titled
“Comprehensive Evaluation of Low Temperature Cracking Fracture Indices for Asphalt Mixtures", a
paper accepted for publication in AAPT 2017 Journal. The Normalized flexibility index is computed by
dividing the fracture energy by post-peak slope. Fracture strength (Sf) is calculated using peak load (Fmax)
and specimen geometry using the following equation.
𝑆𝑓 =2𝐹max (3𝐿−𝑎 )
𝑡×𝑎2 [1]

A-4
Figure A-1: Disc-shaped Compact Tension (DCT) Test Setup
Test Result and Discussion
The test results determined from DCT test are presented and discussed in this section. In the first
subsection, fracture energy and peak load computed from DCT tests performed at different labs are
compared. A through discussion was presented in the previous task report comparing the results from
AET, MnDOT, and Braun labs and therefore is not included here. The discussion in this report mainly
focusses on comparing the results from UNH to the other three labs. Then, subsequent section discusses
the various fracture index parameters computed based DCT tests performed at UNH.
Figure A-2 shows the average fracture energy and the amount of variation among replicates for the 10
different asphalt mixtures tested in the four labs. For the TH 62 and CSAH 49 roadway, only one
specimen was tested, therefore no data variability is shown. Mixtures with less than three replicates
specimens are indicated in a slash purple bar. The red horizontal line represents fracture energy of
400J/m2, a minimum requirement for projects of traffic level <10 Million ESALS (which is the case for the
majority of projects in Minnesota) according to the phase II of the pooled fund study. Generally,
mixtures tested at UNH exhibited lower fracture energy as compared to other labs with the exception of
mixture from CSAH 133 roadway. It should be noted that DCT testing in the other three labs were
completed in June of 2015 whereas as the testing at UNH was executed one year later. This additional
time gap between production and testing is anticipated to cause further aging resulting in the lower
fracture energy observed on the specimens tested at UNH.
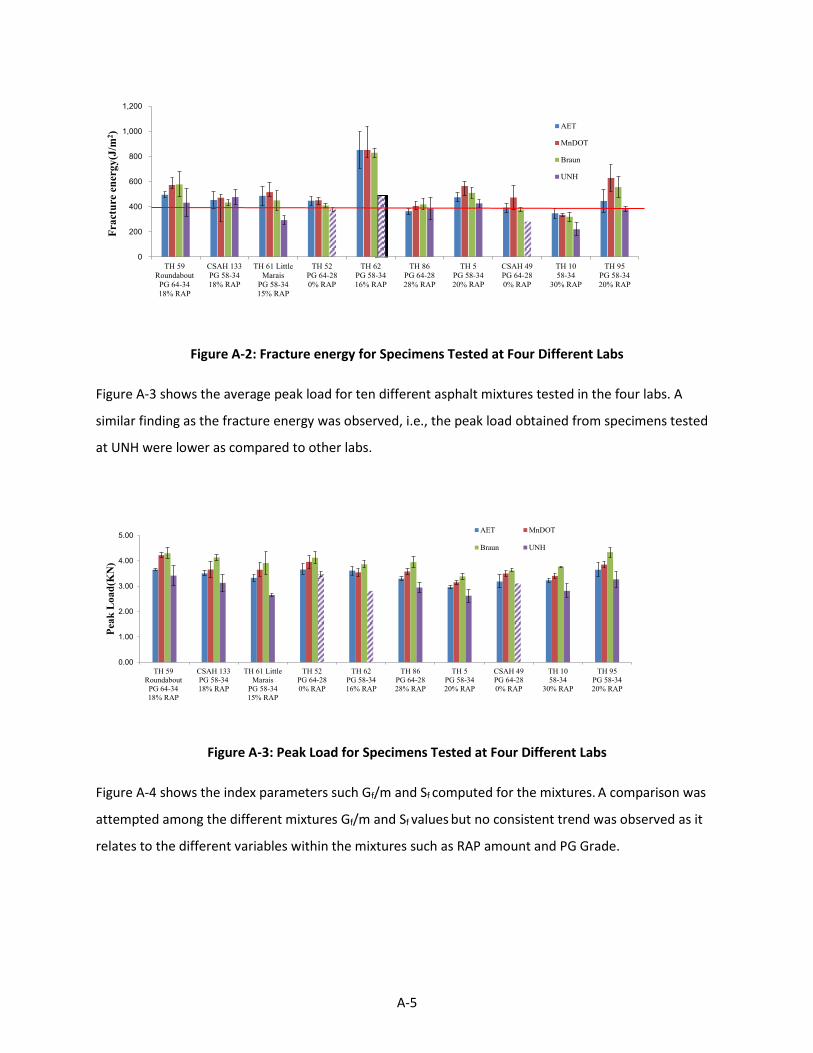
A-5
Figure A-2: Fracture energy for Specimens Tested at Four Different Labs
0
200
400
600
800
1,000
1,200
TH 59
Roundabout
PG 64-34
18% RAP
CSAH 133
PG 58-34
18% RAP
TH 61 Little
Marais
PG 58-34
15% RAP
TH 52
PG 64-28
0% RAP
TH 62
PG 58-34
16% RAP
TH 86
PG 64-28
28% RAP
TH 5
PG 58-34
20% RAP
CSAH 49
PG 64-28
0% RAP
TH 10
58-34
30% RAP
TH 95
PG 58-34
20% RAP
Fra
ctu
re e
ner
gy
(J/m
2)
AET
MnDOT
Braun
UNH
Figure A-3 shows the average peak load for ten different asphalt mixtures tested in the four labs. A
similar finding as the fracture energy was observed, i.e., the peak load obtained from specimens tested
at UNH were lower as compared to other labs.
Figure A-3: Peak Load for Specimens Tested at Four Different Labs
0.00
1.00
2.00
3.00
4.00
5.00
TH 59
Roundabout
PG 64-34
18% RAP
CSAH 133
PG 58-34
18% RAP
TH 61 Little
Marais
PG 58-34
15% RAP
TH 52
PG 64-28
0% RAP
TH 62
PG 58-34
16% RAP
TH 86
PG 64-28
28% RAP
TH 5
PG 58-34
20% RAP
CSAH 49
PG 64-28
0% RAP
TH 10
58-34
30% RAP
TH 95
PG 58-34
20% RAP
Pea
k L
oa
d(K
N)
AET MnDOT
Braun UNH
Figure A-4 shows the index parameters such Gf/m and Sf computed for the mixtures. A comparison was
attempted among the different mixtures Gf/m and Sf values but no consistent trend was observed as it
relates to the different variables within the mixtures such as RAP amount and PG Grade.

A-6
Figure A-4: Gf/m and Sf for Specimens Tested at UNH
0
2
4
6
TH 59
PG64-34
18% RAP
CSAH 133
PG58-34
18% RAP
TH 61
PG58-34
15% RAP
TH 52
PG64-28
0% RAP
TH 62
PG58-34
16% RAP
TH 86
PG64-28
28% RAP
TH 5
PG58-34
20% RAP
TH 10
PG58-34
30% RAP
TH 95
PG58-34
20% RAP
Sf
0
50
100
150
200
TH 59
PG64-34
18% RAP
CSAH 133
PG58-34
18% RAP
TH 61
PG58-34
15% RAP
TH 52
PG64-28
0% RAP
TH 62
PG58-34
16% RAP
TH 86
PG64-28
28% RAP
TH 5
PG58-34
20% RAP
TH 10
PG58-34
30% RAP
TH 95
PG58-34
20% RAP
Gf/
m
The temperature of air and monitoring dummy (MD) during testing was recorded according to the
MnDOT modified DCT specification using temperature measurement system, Figure A-5 thru A-7 are
presented as an example to show the noticeably high difference encountered between air and MD
temperature during testing. This strengthens the recommendation in MnDOT specification to monitor
the test by a MD specimen and to conduct the test when the MD temperature stabilizes to the test
temperature.
Figure A-5: Recorded test temperature for the test duration (CSAH 133 section test at 25.9℃)
-27
-26.5
-26
-25.5
-25
0 20 40 60 80 100 120 140 160
Tem
per
atu
re/℃
Time/s
Test dummy temperatureAir temperature

A-7
Figure A-6: Recorded test temperature for the test duration (TH 95 section test at 21.1℃)
-21
-20.5
-20
-19.5
-19
-18.5
-18
-17.5
-17
0 20 40 60 80 100 120 140 160 180 200
Tem
per
atu
re/℃
Time/s
Test dummy temperature
Figure A-7: Recorded test temperature for the test duration (TH 61 section test at 22.1℃)
-22.5
-22
-21.5
-21
-20.5
-20
-19.5
-19
0 20 40 60 80 100 120 140 160 180
Tem
per
atu
re/℃
Time/s
Test dummy temperatureAir temperature

APPENDIX B: DCT PILOT SPECIAL PROVISION

B-1
(2360) PLANT MIXED ASPHALT PAVEMENT – DISC-SHAPED COMPACT TENSION (DCT)
TEST
S-1 Description
The DCT (disc-shaped compact tension) test assesses low temperature cracking potential of asphalt mixtures. This
provision requires that both mix design and production mixture for the wearing course (top 4 inches) meets the
minimum fracture energy requirements. Wearing course mixture not meeting minimum fracture energy at design
and during production will not be placed on the roadway.
S-1.2 MnDOT 2360.2.E6, Mixture Requirements, is modified to include the following Table DCT-1:
Fracture Energy Mixture Design Requirements
Table DCT-1
Minimum Average Fracture Energy Mixture
Design Requirements for Wearing Course*
Traffic Level Fracture Energy
Traffic Level 2-3/PG XX-34 450 J/m2
Traffic Level 4-5/PGXX-34 500 J/m2
*Test a minimum of six (6) DCT test specimens according to ASTM D7313-13 MnDOT Modified
Revision dated September X, 2015 to determine the average fracture energy of the submitted mix
design (see MnDOT Modified for requirements of when greater than 6 specimens are to be tested).
Testing temperature for wearing course mixture on SP XXXX-XXX will be –XX.X °C. This temperature
represents the 98% reliability low-temperature at the location where the pavement will be constructed, plus
10 °C, as determined using LTPPBind 3.1. When determining the project testing temperature the rounding
step is not included.
Redesign the mixture and re-submit samples for evaluation if the submitted sample does not meet the
minimum average fracture energy shown above.
S-1.3 Modify Table 2360-8 as follows:

B-2
Table 2360-8
Requirements for Ratio of Added New Asphalt Binder to Total Asphalt Binder1 min%:
Specified Asphalt Grade Recycled Material
RAS Only RAS + RAP RAP Only
PG XX-28, PG 52-34, PG 49-34, PG 64-22
Wear
Non-Wear
70
70
70
70
70
65
PG 58-34, PG 64-34, PG 70-34
Wear & Non-Wear
75
75
75 1 The ratio of added new asphalt binder to total asphalt binder is calculated as (added
binder/total binder) x 100
S-1.4 Modify 2360.2.E.9 Documentation to include submitting the following information regarding
Fracture Energy:
(15) Average fracture energy at optimum asphalt content.
S-1.5 Delete 2360.2F Mixture Design Report and replace with:
Initial Mixture Design Report
The Department will issue a preliminary Mixture Design Report (MDR) consisting of the JMF
after review of the submitted design. The JMF will include:
(1) Composite gradation,
(2) Aggregate component proportions,
(3) Asphalt binder content of the mixture,
(4) Design air voids,
(5) Adj. asphalt film thickness, and
(6) Aggregate bulk specific gravity values
By issuing the preliminary MDR the Department makes no guaranty or warranty, either express or
implied, that compliance with volumetric and or fracture energy properties ensures specification
compliance regarding placement and compaction of the mixture.
Initial DCT Verification

B-3
Do not begin full-scale production of the wearing course mixture until it is shown that plant
produced mixture meets minimum DCT and mixture requirements. Mixture for Initial DCT Verification may be
placed either on the project or at an alternate location. When Initial DCT Verification mixture is placed as wearing
course mixture (top 4”) limit placement to between 50 and 200 tons. With the approval of the Engineer the
Contractor may substitute wear course mix for non-wear to determine fracture energy compliance. Mixture
production is not limited when wearing course mixture is placed as non-wear.
Take one sample from the initial mixture produced and cease production of the wearing course mixture until both
mix volumetric and DCT properties are tested and evaluated by both the Contractor and the Department. The
Contractor will obtain a sample large enough for at least ten (10) full 6” x 12” cylinders. Blend and split the sample
in half to provide two sets of at least five (5) full 6” x 12” cylinders for the Department and the Contractor. Resume
production when:
1) The Contractor’s test results meet the requirements shown in Table 2360-7, Table 2360-8, and Table
2360-9, and Table DCT-2.
2) The Contractor’s test results are within the JMF limits as indicated on the Mixture Design Report, and
The Contractor’s and the Department’s test results are within the allowable testing tolerances shown in Table 2360-9
as modified by this provision.
Final Mixture Design Report
If the Initial DCT Verification mixture does not meet the requirements listed above the process must
be repeated. A final production MDR, allowing full-scale production will be issued once the produced
mixture meets all specification requirements. This final production MDR will contain the updated JMF and
will include all changes needed to the following:
(1) Composite gradation,
(2) Aggregate component proportions,
(3) Asphalt binder content of the mixture,
(4) Design air voids,
(5) Adj. asphalt film thickness,
(6) Aggregate bulk specific gravity values, and
(7) Added AC or %New AC.
S-1.6 Modify Table 2360-9 Allowable Differences between Contractor and Department Test Results to
include the following allowable difference for DCT fracture energy:

B-4
Table 2360-9
Allowable Differences between Contractor and Department Test Results*
Item Allowable Difference
DCT - Fracture Energy (J/m2) 90
*Test a minimum of six (6) DCT test specimens according to ASTM D7313-13
MnDOT Modified revision dated September 1, 2015 to determine the average fracture
energy of the submitted mix design (see MnDOT Modified for requirements of when
greater than 6 specimens are to be tested).
S-1.7 Modify 2360.2G.7 Production Tests to include:
2360.2G.7m Disc-Shaped Compact Tension (DCT) Test
Conduct DCT tests and calculate fracture energy according to ASTM D7313-13 MnDOT
Modified Revision dated September 1, 2015. If the Engineer requires sampling and testing of production
mixture to verify fracture energy, fabrication of DCT specimens, testing, and reporting must be completed
within 48 to 72 hrs. after the sample arrives at the testing laboratory. The Contractor will obtain a sample
large enough for at least ten (10) full 6” x 12” cylinders. Blend and split the sample in half to provide two
sets of at least five (5) full 6” x 12” cylinders for the Department and the Contractor. Label the Department
companion of this split with the following information:
(1) Date,
(2) Time,
(3) Project number,
(4) Mixture designation,
(5) Location, and
(6) Cumulative tonnage to date.
(7) MDR Number
Provide the Department with that day’s Test Summary Sheet.
The Engineer will require fracture energy testing when there is:
(1) An aggregate proportion change for a single stockpile aggregate greater than 10% from the
currently produced mixture.
(2) A cumulative change on any one aggregate product exceeds 10% from the original MDR.
(3) A change in added asphalt that decreases by more than 0.3% below that shown on the MDR.
(4) An aggregate or RAP source is changed.
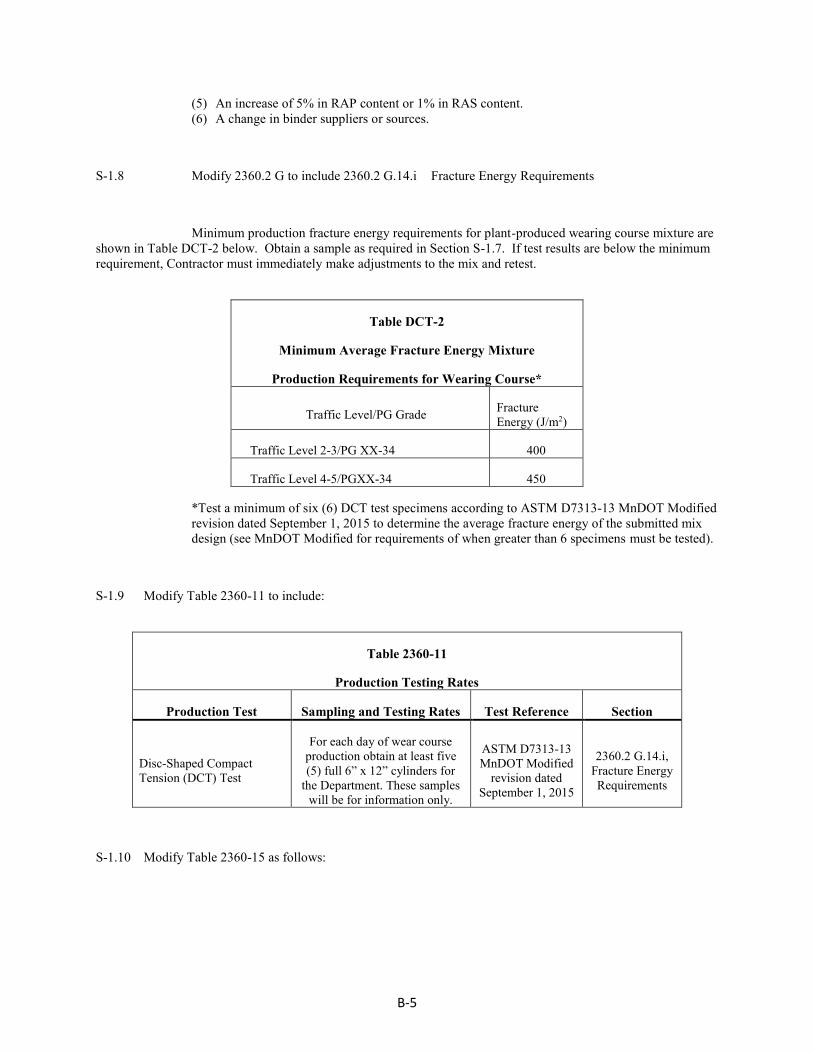
B-5
(5) An increase of 5% in RAP content or 1% in RAS content.
(6) A change in binder suppliers or sources.
S-1.8 Modify 2360.2 G to include 2360.2 G.14.i Fracture Energy Requirements
Minimum production fracture energy requirements for plant-produced wearing course mixture are
shown in Table DCT-2 below. Obtain a sample as required in Section S-1.7. If test results are below the minimum
requirement, Contractor must immediately make adjustments to the mix and retest.
Table DCT-2
Minimum Average Fracture Energy Mixture
Production Requirements for Wearing Course*
Traffic Level/PG Grade Fracture
Energy (J/m2)
Traffic Level 2-3/PG XX-34 400
Traffic Level 4-5/PGXX-34 450
*Test a minimum of six (6) DCT test specimens according to ASTM D7313-13 MnDOT Modified
revision dated September 1, 2015 to determine the average fracture energy of the submitted mix
design (see MnDOT Modified for requirements of when greater than 6 specimens must be tested).
S-1.9 Modify Table 2360-11 to include:
Table 2360-11
Production Testing Rates
Production Test Sampling and Testing Rates Test Reference Section
Disc-Shaped Compact
Tension (DCT) Test
For each day of wear course
production obtain at least five
(5) full 6” x 12” cylinders for
the Department. These samples
will be for information only.
ASTM D7313-13
MnDOT Modified
revision dated
September 1, 2015
2360.2 G.14.i,
Fracture Energy
Requirements
S-1.10 Modify Table 2360-15 as follows:
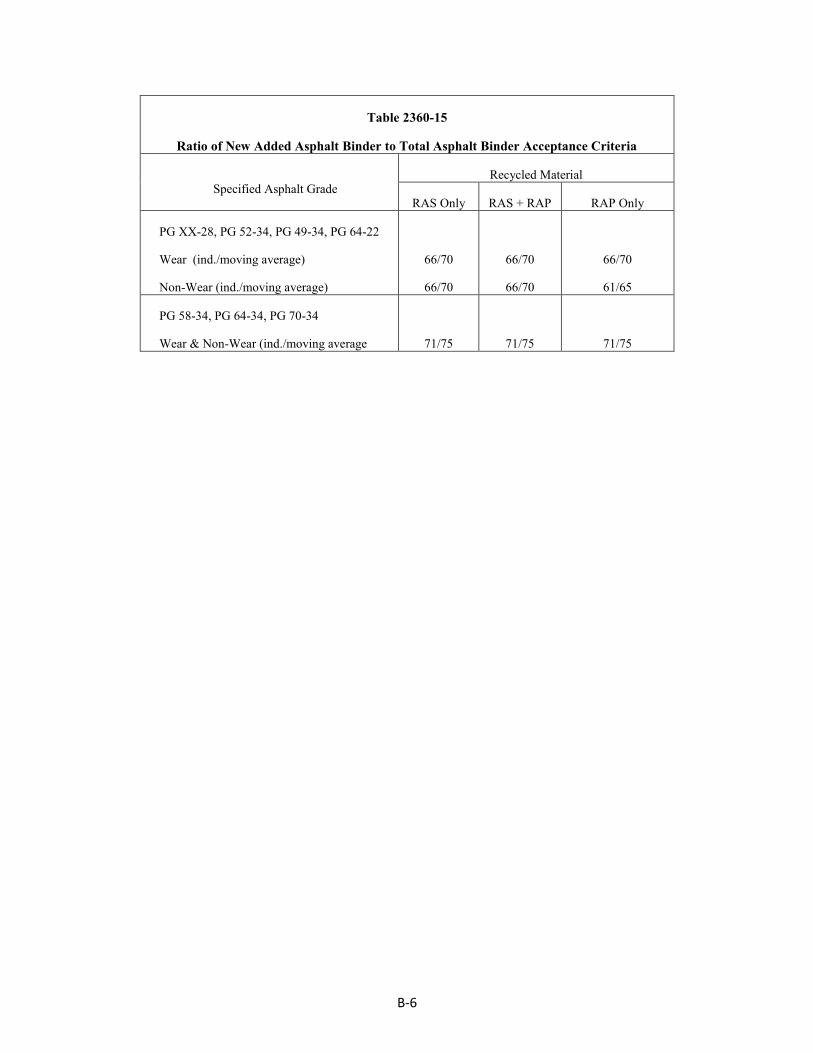
B-6
Table 2360-15
Ratio of New Added Asphalt Binder to Total Asphalt Binder Acceptance Criteria
Specified Asphalt Grade Recycled Material
RAS Only RAS + RAP RAP Only
PG XX-28, PG 52-34, PG 49-34, PG 64-22
Wear (ind./moving average)
Non-Wear (ind./moving average)
66/70
66/70
66/70
66/70
66/70
61/65
PG 58-34, PG 64-34, PG 70-34
Wear & Non-Wear (ind./moving average
71/75
71/75
71/75