Disaster Risk Maps for Gender Empowerment in Disaster ... · Bantul Regency in Yogyakarta Special...
12
Disaster Risk Maps for Gender Empowerment in Disaster Management, (6982) Lalitya Narieswari, Sri Lestari Munajati and Cornelia Marschiavelli Mone Iye (Indonesia) FIG Congress 2014 Engaging the Challenges - Enhancing the Relevance Kuala Lumpur, Malaysia 16 – 21 June 2014 1/12 Disaster Risk Maps for Gender Empowerment in Disaster Management Lalitya NARIESWARI, Sri Lestari MUNAJATI, and Cornelia Marschiavelli MONE IYE, Indonesia Key words: Gender strengthening, Disaster Management, Disaster Risk Map SUMMARY In Indonesia, the involvement of gender issue and women empowerment in disaster management is almost never been considered and, moreover, spatially assessed and visualized. This study aims to present two influencing factors of disaster management from gender-related point of view. They are gender-related vulnerability and gender-related risk. Bantul Regency in Yogyakarta Special Province, an area which is very vulnerable of natural hazard such as earthquake, tsunami, and volcanic eruption, was chosen as the study area. The study produced questionnaires, weighting and scoring methods to determine gender vulnerability. The results then further processed with gender capacity and natural hazards to generate thematic maps: gender vulnerability map, gender capacity map and gender disaster risk maps (of earthquakes, tsunamis, droughts and floods). By visualizing spatial information, such maps are expected to be a guideline when the government needs to strengthen and involve gender in disaster management in disaster high-risk areas.
Transcript of Disaster Risk Maps for Gender Empowerment in Disaster ... · Bantul Regency in Yogyakarta Special...

Disaster Risk Maps for Gender Empowerment in Disaster Management, (6982) Lalitya Narieswari, Sri Lestari Munajati and Cornelia Marschiavelli Mone Iye (Indonesia) FIG Congress 2014 Engaging the Challenges - Enhancing the Relevance Kuala Lumpur, Malaysia 16 – 21 June 2014
1/12 Disaster
Disaster Risk Maps for Gender Empowerment in Disaster Management
Lalitya NARIESWARI, Sri Lestari MUNAJATI, and Cornelia Marschiavelli MONE IYE, Indonesia
Key words: Gender strengthening, Disaster Management, Disaster Risk Map SUMMARY In Indonesia, the involvement of gender issue and women empowerment in disaster management is almost never been considered and, moreover, spatially assessed and visualized. This study aims to present two influencing factors of disaster management from gender-related point of view. They are gender-related vulnerability and gender-related risk. Bantul Regency in Yogyakarta Special Province, an area which is very vulnerable of natural hazard such as earthquake, tsunami, and volcanic eruption, was chosen as the study area. The study produced questionnaires, weighting and scoring methods to determine gender vulnerability. The results then further processed with gender capacity and natural hazards to generate thematic maps: gender vulnerability map, gender capacity map and gender disaster risk maps (of earthquakes, tsunamis, droughts and floods). By visualizing spatial information, such maps are expected to be a guideline when the government needs to strengthen and involve gender in disaster management in disaster high-risk areas.

Disaster Risk Maps for Gender Empowerment in Disaster Management, (6982) Lalitya Narieswari, Sri Lestari Munajati and Cornelia Marschiavelli Mone Iye (Indonesia) FIG Congress 2014 Engaging the Challenges - Enhancing the Relevance Kuala Lumpur, Malaysia 16 – 21 June 2014
2/12 Disaster
Disaster Risk Maps for Gender Empowerment in Disaster Management
Lalitya NARIESWARI, Sri Lestari MUNAJATI, and Cornelia Marschiavelli MONE IYE, Indonesia
1. INTRODUCTION The paradigm shift that catastrophic disaster is not only government responsibility but also the entire community to be one basis of National Action Plan for Disaster Risk Reduction (NAP-DRR). Awareness of risk reduction efforts has been launched at international level from 1990 to 1999. At national level, the foundation of disaster risk reduction is defined by Law No. 24 Year 2007 on Disaster Management (RAN-PRB 2010-2012). However, the paradigm has not been entirely accepted by general population, particularly in developing countries such as Indonesia. Women and children are still considered only as victims and get affected completely by hazards and disasters, and “powerless” in the term of mitigation and disaster handling, although BPS data population survey in 2005 showed that the sex ratio for adults age ranging in the 100, which shows the number of people who balanced between men and women (BPS, 2005). This is certainly a challenge and a positive capital if the policy can empower women as actors of disaster management and not just as victims. Actually, women's everyday life becomes the subject of risks in before, during, and after disasters (Info resources, 2009). Women rule as formal and informal leaders as well as the main actors (primary caretakers) in the preparation and recovery from disasters (Briceno, 2002). They look after children, the elderly, and the wounded. They also take part in the provision of logistics. Because usually mitigation and emergency response depends on how accurate the knowledge of the vulnerabilities and capacities of communities, community mapping and assessment must take into account social and environmental factors (UNDP, 1992). Data about gender are very important for the practitioner to conduct disasters planning and management although not always easily available or obtainable. This great resource should be optimum empowered to develop more precise and effective disaster management planning. One thing that needs to consider in disaster management is that the same disaster could bring different impacts for different gender groups. It is caused by group’s differences vulnerability to disasters. This difference is due to the existing gender relations in the group. Data of women role and capacity has been available, but not in the field of disasters management. This study focuses on this gap by reviewing the role of women in disaster management and moreover presenting spatially. Spatially gender vulnerability information will be very helpful as a guide for decision makers and practitioners in disaster mitigation and emergency response. The purpose of this study was to determine the gender vulnerability to disaster risk reduction in the risk analysis of spatial and gender on various disasters at the study site.

Disaster Risk Maps for Gender Empowerment in Disaster Management, (6982) Lalitya Narieswari, Sri Lestari Munajati and Cornelia Marschiavelli Mone Iye (Indonesia) FIG Congress 2014 Engaging the Challenges - Enhancing the Relevance Kuala Lumpur, Malaysia 16 – 21 June 2014
3/12 Disaster
2. METHODOLOGY 2.1 Data and Materials
Data and materials used for this study are as follow:
-‐ Topographical maps (RBI maps) in digital and analog format scale of 1: 25,000.
-‐ Demographic Statistics (PODES) of the Central Bureau of Statistics
-‐ Vulnerable hazard maps (Disaster Management Information System-DMIS)
-‐ Questionnaire gender vulnerability mapping for disaster management.
2.2 Research Area The research area was Bantul district of Yogyakarta Special Province. Bantul was chosen because this region had been hit by an earthquake in 2006, which claimed many lives. Bantul lies between 07o44'04 "08o00'27" south latitude and 110o12'34 "- 110o31'08" East Longitude. Based on the BPS (2010), the population numbered 910.572 spread out 17 districts with a percentage of 50.14% of females and males was 49.86%. Figure 1 shows the location.
Bantul District location in Yogyakarta
Special Region (DIY) Province
The Villages in Bantul District
Figure 1. Research area

Disaster Risk Maps for Gender Empowerment in Disaster Management, (6982) Lalitya Narieswari, Sri Lestari Munajati and Cornelia Marschiavelli Mone Iye (Indonesia) FIG Congress 2014 Engaging the Challenges - Enhancing the Relevance Kuala Lumpur, Malaysia 16 – 21 June 2014
4/12 Disaster
2.3 Methods This study was conducted with various stages, presented in Figure 2.
Figure 2. Research flow chart
2.3.1 Data collection
The data collected is PODES data, districts in numbers, hazards dataset (disaster management information system-DMIS) and number of victims of the Yogyakarta earthquake. 2.3.2 The criteria of questionnaires
Questionnaires were developed based on several important indicators of the gender vulnerability (WHO, 2009), namely: -‐ Households, housing, family status (proportion of households with a female family clod,
the average number of families, the number of single women, widows, homeless female victims, etc.)
-‐ Economic and employment status (employment, women worked in the disaster, access to credit, etc.)
Data analysis
Gender-based spatial information
for disaster risks
Data Determining the
indicators
Creating questionnares
Field survey
Distribution of questionnaires
Sub districts and villages data
records
Overlay
Demography (BPS)
Vulnerable hazards maps
(BAKOSURTANAL, BNPB, BMKG,
LAPAN etc)
Family status
Employment and economical status
Education, literacy, communication
Ethnicity & cultural pattern
Health and welfare
Density pattern and trend
Political and social structure
Transformation of social and statistical tabular data into
spasial format
Gender vulnerability map
Gender capacity map
Villages Potency (PODES)
Total vulnerability
map

Disaster Risk Maps for Gender Empowerment in Disaster Management, (6982) Lalitya Narieswari, Sri Lestari Munajati and Cornelia Marschiavelli Mone Iye (Indonesia) FIG Congress 2014 Engaging the Challenges - Enhancing the Relevance Kuala Lumpur, Malaysia 16 – 21 June 2014
5/12 Disaster
-‐ Education, communication and writing skills (educational status of women, popular media for women, etc.)
-‐ Ethnic and cultural patterns (dominant ethnicity, language acquisition female) -‐ Health and welfare (reproductive health facilities, women with disabilities, etc.) -‐ Patterns and trends of population density (the distribution of the female population, the
level of women's mobility) -‐ Social and political structure (involvement of women in politics, organization, etc.).
PODES data provides information about the condition of villages, but the data do not distinguish sex type. This no-gender separation data is unfavorable to get vulnerability information. Therefore, the study required a questionnaire to be able to confirm vulnerability. The questionnaires were prepared by adapting indicators issued by the WHO with modifications. Besides to ensure the validity of this vulnerability information, the questionnaire was also intended to be able to quantify the data. Every indicator is weighted and given some values corresponding to the significance level of disaster. Determination of the weights and scores from Table 1, based on expert judgment on the basis that the greater the influence of the criteria of women empowerment, especially in disaster management, the stronger the local conditions (i.e., not vulnerable). As an example, the higher the education levels the higher the level of awareness, knowledge and abilities to tackle disasters impact. The total value is a multiple of three criteria types. The greater the total score, the more vulnerable the area.
Table 1. Weights and scores of the used criteria in the questionnaires
Vulnerability indicators
Weights 1 Criteria Weights
2 Options Scores
A. Political and social structure
5 Women leaders are chosen (neighborhood and ward chief, villages chief)
2 Yes 1
No 2
No 2
Group or organization handling women problems
3 Available, active 1
Yes, inactive 2
Not available 3
B. Education and communication
4 Education level/average graduation
2 Bachelor 1
Senior high school 1
Elementary/basic 2
Not educated 3

Disaster Risk Maps for Gender Empowerment in Disaster Management, (6982) Lalitya Narieswari, Sri Lestari Munajati and Cornelia Marschiavelli Mone Iye (Indonesia) FIG Congress 2014 Engaging the Challenges - Enhancing the Relevance Kuala Lumpur, Malaysia 16 – 21 June 2014
6/12 Disaster
Most popular media (ways to access news)
1 Newspapers, Magazines
1
TV 2
Radio 3 C. Households, Housing, Family status
3 Percentage of old women who home alone
2 High (>25 %) 3 Medium (10-25) 2 Low/No 1
D. Employment and economic status
3 Accessibility to financial credit from banks or other financial firms?
2 Available (Accessible)
1
No access 2
E. Ethnicity and cultural pattern
2 Gender participation (socially and politically)
3 Balanced 1
Unbalanced 2
F. Health and welfare
2 Percentage of population who don’t get proper health service (far from health infrastructure, no transportation facilities, no health officer)
3 High (> 50%) 1 Medium (10-50) 2 Low (<10%) 3
G. Density pattern and trend
1 Distribution of ages in the women population
2 Children and old people (senior citizens)
1
Juveniles 2
Adults 3 2.3.3 Field survey and questionnaires distribution
Data collection was carried out in the field with conditional random stratification method. Stratification is done based on the number of villages, where in each village at least one random sample is taken, but still with the proviso that have been determined. The sample should be able to represent his village in explaining a wide range of information on matters related to the disaster (Williams, 2003). As Bantul has 17 villages, then the respondent is minimum 75 respondents. To avoid bias and subjectivity, the respondent must be key persons from various professions, men and women.
Disaster Risk Maps for Gender Empowerment in Disaster Management, (6982) Lalitya Narieswari, Sri Lestari Munajati and Cornelia Marschiavelli Mone Iye (Indonesia) FIG Congress 2014 Engaging the Challenges - Enhancing the Relevance Kuala Lumpur, Malaysia 16 – 21 June 2014
7/12 Disaster
After determined the field survey method, we then distributed the questionnaires, through the following stages: 1. Coordination with Bantul local government 2. Selection of field staff 3. Briefing with field workers 4. Distribute the questionnaires 5. Data input from the questionnaire 6. Review the results of the questionnaire 7. Insight interview
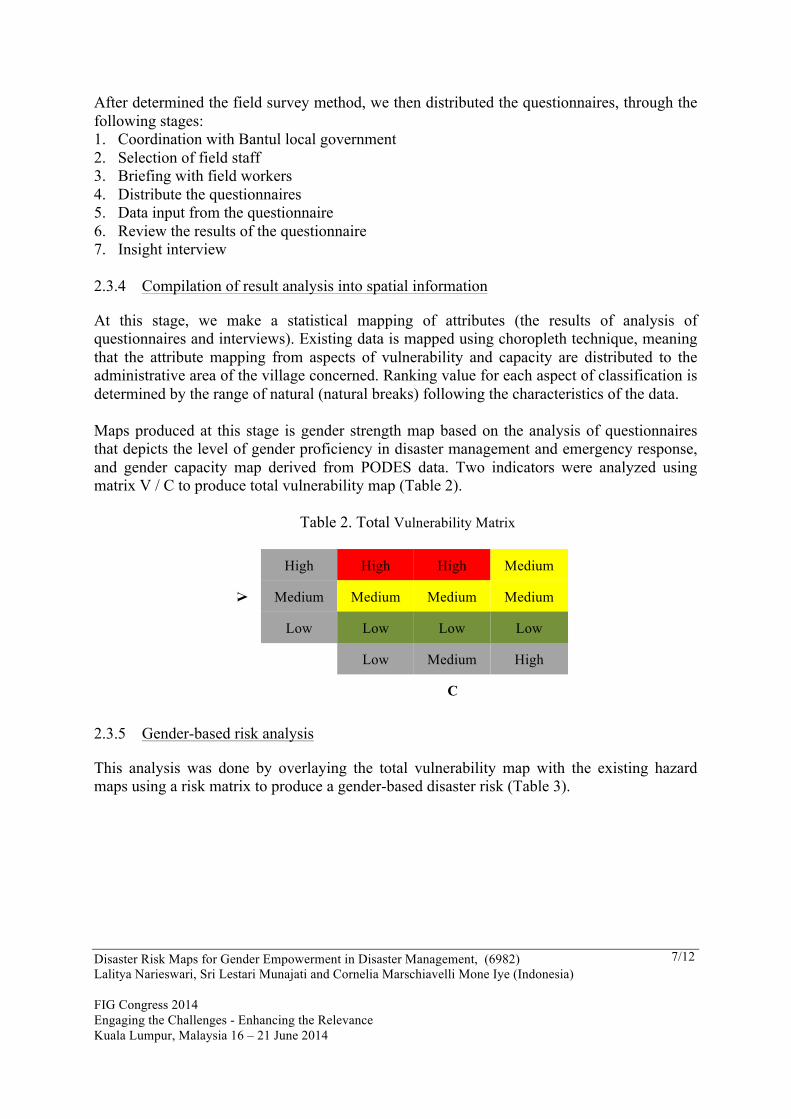
2.3.4 Compilation of result analysis into spatial information
At this stage, we make a statistical mapping of attributes (the results of analysis of questionnaires and interviews). Existing data is mapped using choropleth technique, meaning that the attribute mapping from aspects of vulnerability and capacity are distributed to the administrative area of the village concerned. Ranking value for each aspect of classification is determined by the range of natural (natural breaks) following the characteristics of the data. Maps produced at this stage is gender strength map based on the analysis of questionnaires that depicts the level of gender proficiency in disaster management and emergency response, and gender capacity map derived from PODES data. Two indicators were analyzed using matrix V / C to produce total vulnerability map (Table 2).
Table 2. Total Vulnerability Matrix
V
High High High Medium
Medium Medium Medium Medium
Low Low Low Low
Low Medium High
C
2.3.5 Gender-based risk analysis
This analysis was done by overlaying the total vulnerability map with the existing hazard maps using a risk matrix to produce a gender-based disaster risk (Table 3).

Disaster Risk Maps for Gender Empowerment in Disaster Management, (6982) Lalitya Narieswari, Sri Lestari Munajati and Cornelia Marschiavelli Mone Iye (Indonesia) FIG Congress 2014 Engaging the Challenges - Enhancing the Relevance Kuala Lumpur, Malaysia 16 – 21 June 2014
8/12 Disaster
Table 3. Disaster risk matrix
V/C
High Medium High High
Medium Low Medium High
Low Low Medium Medium
Low Medium High
H
3. RESULTS AND ANALYSIS
3.1 Respondents Analysis Of the 105 respondents were successfully obtained, the respondent characteristics were collected. These were age, gender, level of education and type of works. Respondents are mostly under 50 years old, age 19-35 was 47% and age 36-50 was 41%. This suggests that respondents were valid based on the terms mentioned in the methodology. Most of the respondents (71%) were women, as the main issue was increasing roles of women. The education level of the respondents mostly D1 (47%). Second biggest level is high school education (41%) and the remainder (12%) was elementary-school education. This is expected to represent the condition of the village described by respondents. Most of the respondents (27 %) are civil servants, followed by employees are 18 %, and then housewives, 16 %. With this composition, it was hoped could represent the gender characteristics in his village. 3.2 Disaster Risk Spatial Analysis
3.2.1 Gender vulnerability and capacity
Gender susceptibility map provides information about gender condition in prevention, preparation and responsive-response to disasters. The questionnaires analysis that considered weights and scores of selected indicators show spatially that the high gender vulnerabilities are in the southern or coastal areas, areas where are relatively far from the provincial capital. Accessibility and topography might be major influencing factors (Figure 3). Besides vulnerability, within the community there is always the ability to respond using all available resources such as knowledge, physical development and day-to-day good practice so-called capacity (Davis et al., 2004). The analysis showed that there are two general conditions in the study area, namely (1) the village has a high capacity and high vulnerability, and (2) villages that have low capacity and high vulnerability (Figure 4). The second condition is ideal or desirable, because the women in the region will be able to anticipate and provide follow proper response in disaster management. In the other side, the first condition requires attention because women in the village are less able to perform activities of disaster

Disaster Risk Maps for Gender Empowerment in Disaster Management, (6982) Lalitya Narieswari, Sri Lestari Munajati and Cornelia Marschiavelli Mone Iye (Indonesia) FIG Congress 2014 Engaging the Challenges - Enhancing the Relevance Kuala Lumpur, Malaysia 16 – 21 June 2014
9/12 Disaster
management, and the ability to respond to disasters (capacity) is also low. First condition is generally found in coastal villages or in the southern part of the study area. Condition 2 found most in the villages around the provincial capital. The vulnerability analysis provided interesting results, especially if correlated with the number of earthquake victims at the time of the incident. The villages with big damage and loss of life were likely to increase their capacity to disasters. This was reflected in low total scores. This applied in vice versa, in some villages where the amount of casualties and damage were not large; their vulnerability score were relatively high. It was confirmed from the results of interviews with the village officials and community leaders, for example in the village Tamanan, Banguntapan Sub-district. The earthquake resulting in 34 fatalities, 10.427 displaced people, and minor damage to 2.700 houses were completely destroyed enhanced the capacity of villagers in disaster preparation and mitigation. They were aware of the disasters that might occur in their territory. Their capacity was proven by the ability to create their own participatory hazard maps in village scale. Tagana (disaster response) activities were actively implemented by the youth. The role of women were considered equal in disaster because their involvement in every activity. An opposite had been occurred in the village Imogiri, Imogiri Sub-district. Fewer casualties and damage in the event of a disaster indicated that the village had high vulnerability. This is probably because the villagers were less aware of the disaster.
Figure 3. Vulnerability map

Disaster Risk Maps for Gender Empowerment in Disaster Management, (6982) Lalitya Narieswari, Sri Lestari Munajati and Cornelia Marschiavelli Mone Iye (Indonesia) FIG Congress 2014 Engaging the Challenges - Enhancing the Relevance Kuala Lumpur, Malaysia 16 – 21 June 2014
10/12
Figure 4. Gender capacity map
3.2.2 Disaster risk
The disaster risk map provides information about gender risk to particular disaster that might happen in the region (Figure 5). The information is concerning the role, quality and capacity of women. In some villages with high capacity and high threat, the disaster risk is not as much as in villages with low capacity and high threat. This is because the woman would be able to anticipate and confront the danger that will come. The complexity of risk mapping requires thorough readings of all its constituent aspects. The high disaster risk map indicates that the villages have gender risk to disasters based on the high probability of high level of threat and the villages have gender vulnerability at moderate or high levels and low levels of capacity. The medium class indicates gender disaster risk based on the probability of threat and the villages have gender susceptibility in the moderate to high level capacity. The low class indicates low disaster risk by having low probability of the threat and low to moderate gender vulnerability with moderate to high capacity. To disaster management stakeholders, the gender risk maps can be used to evaluate the efforts to increase regional capacity in high risk areas and minimize the vulnerability. Areas with high risk levels will certainly be priority, especially in the phase of the disaster mitigation to reduce the disaster risk and impacts. This information is needed by decision-makers and practitioners so that disaster management activities will be more effective and efficient. The entire research process shows how spatial data i.e., maps can be used as basis for policy-making disaster relief which then be used to determine the right program for gender reinforcements for disaster risk reduction as part of the disaster response.

Disaster Risk Maps for Gender Empowerment in Disaster Management, (6982) Lalitya Narieswari, Sri Lestari Munajati and Cornelia Marschiavelli Mone Iye (Indonesia) FIG Congress 2014 Engaging the Challenges - Enhancing the Relevance Kuala Lumpur, Malaysia 16 – 21 June 2014
11/12
a)
b)
c)
d)
Figure 5. The risk gender-based map to a) floods, b) earthquakes, c) tsunamis, and d) droughts.
4. CONCLUSION Determining gender vulnerability quantitatively by means of questionnaires using scoring and weighting method allows us to present gender vulnerability spatially. Such information is used as the basis for disaster risk thematic maps. Spatial information about gender strengths will be helpful as guidelines for decision makers and practitioners in disaster mitigation and emergency response. The disaster risk thematic maps also useful for strengthening the gender roles in disaster management. Decision makers who read the maps will be able to make comparisons and identify the regions as well as can evaluate the efforts to improve the capacity of the high-risk and vulnerable areas. Gender risk maps are classified into 3 levels: high, medium, and low. Risk mapping process is a complex process and the result is communicative without losing the characteristics of each constituent indicator.
Disaster Risk Maps for Gender Empowerment in Disaster Management, (6982) Lalitya Narieswari, Sri Lestari Munajati and Cornelia Marschiavelli Mone Iye (Indonesia) FIG Congress 2014 Engaging the Challenges - Enhancing the Relevance Kuala Lumpur, Malaysia 16 – 21 June 2014
12/12
REFERENCES BPS. 2005. Karakteristikpenduduk, http://www.datastatistik-indonesia.com/content/view/
210/210/1/3/. Accessed on November 2010. BPS. 2010. KabupatenBantuldalamAngka 2010. http://bantulkab.bps.go.id/index.php?
view=category&id=1%3Apendahuluan&option=com_content&Itemid=2. Accessed on Juni 2010.
Benson, C., Twigg, J. 2007. PerangkatuntukMengarustamakanPenguranganResikoBencana: CatatanPanduanBagiLembaga-Lembaga yang BergerakdalamBidang Pembangunan (EdisiBahasa), Provention Consortium Secretariat. Switzerland.
Briceno, S. 2002. Gender Mainstreaming in Disaster Reduction. International Strategy for Disaster Reduction (ISDR). www.unisdr.org.
Davis, I., B. Haghebaert and D. Peppiatt. 2004. Social Vulnerability & Capacity Analysis (VCA): An Overview. ProVention Consortium Workshop. Geneva.
Info Resources. 2009. Disaster Risk Reduction: A Gender and Livelihood Perspective. InfoResources Focus No. 2/09. Schlaefli& Maurer AG. Switzerland. www.inforesources.ch.
RencanaAksiNasionalPenanggulanganResikoBencana (RAN-PRB 2010-2012). 2010. BAPPENAS-BadanNasionalPenanggulanganBencana. Jakarta.
UNDP. 1992. An Overview of Disaster Management. New York, United Nations Development. 2nd Edition.
WHO. 2009. Gender, Women and Health. http://www.searo.who.int/en/Section13/ Section390_8282.htm. Accessed on November 2010.
Williams. A. 2003. How to Write and Analyse A Questionnaire. Journal of Orthodontics. Vol. 30, No. 3, 245-252. September 2003
BIOGRAPHICAL NOTES
The author is graduated from double degree UGM-ITC the Netherland in 2008 with thesis titled: Vulnerability Assessment and Coping Mechanism Related to Floods in Urban Areas: A Community-based Case Study in KampungMelayu, Indonesia. She is one of the researchers in BIG and already produced several publications related to geospatial information for disaster and marine natural resources since 2004. She also participated in several international seminars as a presenter. Last year, she becomes the organizing committee of Asian Conference on Remote Sensing (ACRS) and 9th Student Consortium and WG VI/5 Summer School in Bali. CONTACTS Cornelia Marschiavelli Mone Iye Geospatial Information Agency (formerly National Coordinating Agency for Surveys and Mapping) Jl. Raya Jakarta-Bogor KM.46, Cibinong – Bogor, INDONESIA Tel. +62 21 8754592; Fax +62 21 8754592 Email: [email protected]