
Disaster Recovery Indicators: guidelines for monitoring ... Brown Disaster recovery... · Disaster...
77
Disaster Recovery Indicators: guidelines for monitoring and evaluation Daniel Brown, Stephen Platt and John Bevington Published online March 2015 at: www.carltd.com/downloads Reference: Brown D, Platt S Bevington J (2010) Disaster Recovery Indicators: guidelines for monitoring and evaluation. CURBE, Cambridge University Centre for Risk in the Built Environment. University of Cambridge
Transcript of Disaster Recovery Indicators: guidelines for monitoring ... Brown Disaster recovery... · Disaster...
Disaster Recovery Indicators: guidelines for monitoring and evaluation Daniel Brown, Stephen Platt and John Bevington
Published online March 2015 at: www.carltd.com/downloads
Reference:
Brown D, Platt S, Bevington J (2010) Disaster Recovery Indicators: guidelines for monitoring and evaluation. CURBE, Cambridge University Centre for Risk in the Built Environment. University of Cambridge

Disaster Recovery Monitoring and Evaluation
CA MB RIDGE
AR CHITECURAL
RESEAR CH
L IMITED
UNIVERSITY OF CAMBRIDGE
2
Published by
CURBE, Cambridge University Centre for Risk in the Built Environment.
CURBE was established in 1997 to create a structure for interdisciplinary collaboration for disaster and risk research and application. Projects link the skills and expertise from distinct disciplines to understand and resolve disaster and risk issues, particularly related to reducing detrimental impacts of disasters. CURBE is based at the Martin Centre within the Department of Architecture at the University of Cambridge.
About the research These Guidelines are the output from a research project Funded by the Engineering and Physical Sciences Research Council (EPSRC), UK entitled Indicators for Measuring, Monitoring and Evaluating Post-Disaster Recovery 2008–2010.
The aim of the RECOVERY project is to develop indicators of recovery by exploiting the wealth of data now available, including that from satellite imagery, internet-based statistics and advanced field survey techniques. The work was carried out with a view to develop a standardised, independent and replicable approach to measure, monitor and evaluate the relief and recovery processes. Investigative case studies were carried out between March 2008 and March 2010 in areas affected by the 2004 Indian Ocean Tsunami and the 2005 Pakistan Earthquake, covering a diverse range of recovery characteristics.
Project team The project team was composed of: Dr Torwong Chenvidyakarn, Dr Keiko Saito, Dr Emily So and Daniel Brown in CURBE, University of Cambridge; Professor Robin Spence and Dr Stephen Platt in Cambridge Architectural Research; Dr Beverley Adams and Dr John Bevington in ImageCat. Inc; Dr Ratana Chuenpagdee from University of Newfoundland who lead the fieldwork team in Thailand, and Professor Amir Khan from University of Peshawar who lead the fieldwork team in Pakistan.
The Steering Committee included: Professor Arleen Hill, Department of Earth Sciences, University of Memphis; Professor Peter Atkinson, School of Geography, University of Southampton, UK Professor Ian Davis, Cranfield University, UK Mr. Doekle Wielinga, World Bank. First edition 2010
ISBN 92-xxxx-xxx-x
A catalogue record for this publication is available from The British Library and the US Library of Congress.
All rights reserved. This material is copyright but may be reproduced by any method without fee for educational purposes but not for resale. Formal permission is required for all such uses but normally will be granted immediately. For copying in other circumstances or for re-use in other publications, or for translation or adaptation, prior written permission must be obtained from the copyright owner, and a fee may be payable.
Emily So
Emily So
3
Contents 1 Executive Summary 4 2 Introduction 5 3 Indicators of recovery 10 4 Methods of monitoring 12
Key informant survey 12 Household survey 13 Ground survey 14 Official reports, publications and statistics 17 Remote sensing 18
5 Monitoring each indicator 20 Accessibility 21
Indicator 1: Accessibility analysis 24 Indicator 2: Reconstruction of bridges and public transport facilities. 26 Indicator 3: Presence of vehicles 28
Buildings 31 Indicator 4: Removal and construction of buildings. 31 Indicator 5: Change in urban morphology 37 Indicator 6: Individual building assessment 39
Population 47 Indicator 7: Temporary camps 47 Indicator 8: Internally displaced persons 55
Services 62 Indicator 9. Education, healthcare and religious facilities 62 Indicator 10. Power, water and sanitation 66
Natural Environment 70 Indicator 11. Land-cover and urban green space 70
Livelihoods 71 Indicator 12. Reconstruction of livelihoods 71
6 Conclusions 72

4
1 Executive Summary
5
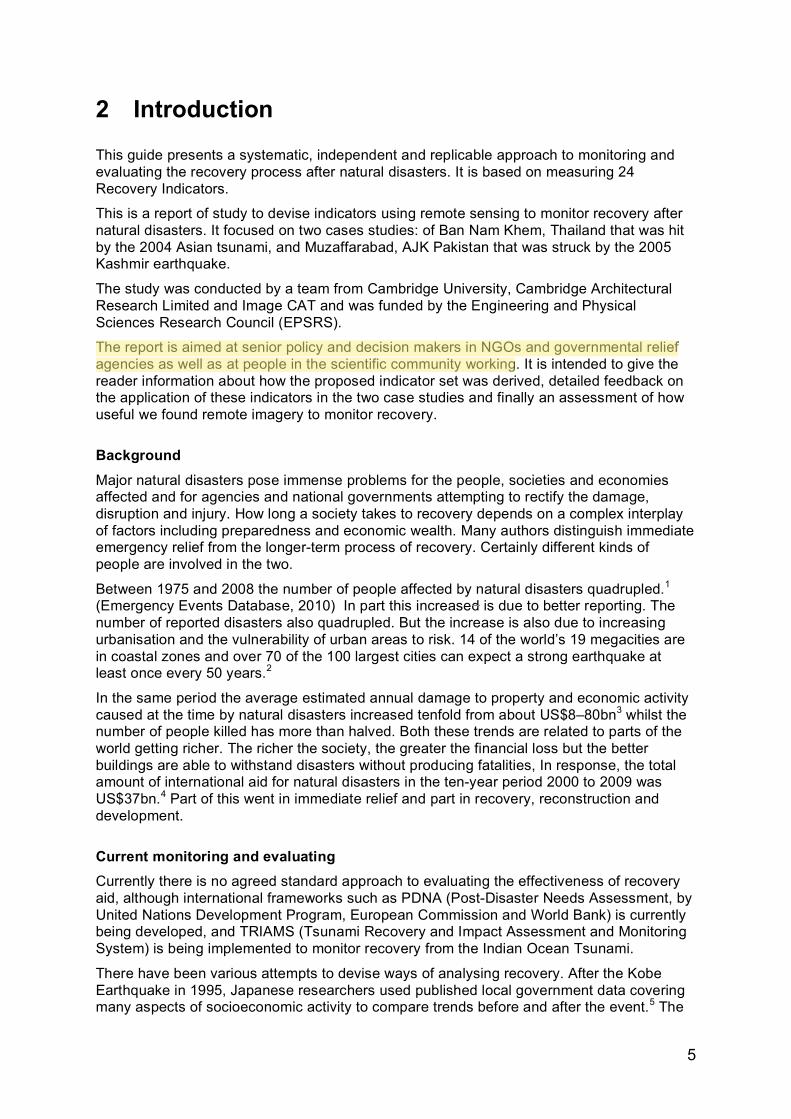
2 Introduction
This guide presents a systematic, independent and replicable approach to monitoring and evaluating the recovery process after natural disasters. It is based on measuring 24 Recovery Indicators.
This is a report of study to devise indicators using remote sensing to monitor recovery after natural disasters. It focused on two cases studies: of Ban Nam Khem, Thailand that was hit by the 2004 Asian tsunami, and Muzaffarabad, AJK Pakistan that was struck by the 2005 Kashmir earthquake.
The study was conducted by a team from Cambridge University, Cambridge Architectural Research Limited and Image CAT and was funded by the Engineering and Physical Sciences Research Council (EPSRS).
The report is aimed at senior policy and decision makers in NGOs and governmental relief agencies as well as at people in the scientific community working. It is intended to give the reader information about how the proposed indicator set was derived, detailed feedback on the application of these indicators in the two case studies and finally an assessment of how useful we found remote imagery to monitor recovery.
Background Major natural disasters pose immense problems for the people, societies and economies affected and for agencies and national governments attempting to rectify the damage, disruption and injury. How long a society takes to recovery depends on a complex interplay of factors including preparedness and economic wealth. Many authors distinguish immediate emergency relief from the longer-term process of recovery. Certainly different kinds of people are involved in the two.
Between 1975 and 2008 the number of people affected by natural disasters quadrupled.1 (Emergency Events Database, 2010) In part this increased is due to better reporting. The number of reported disasters also quadrupled. But the increase is also due to increasing urbanisation and the vulnerability of urban areas to risk. 14 of the world’s 19 megacities are in coastal zones and over 70 of the 100 largest cities can expect a strong earthquake at least once every 50 years.2
In the same period the average estimated annual damage to property and economic activity caused at the time by natural disasters increased tenfold from about US$8–80bn3 whilst the number of people killed has more than halved. Both these trends are related to parts of the world getting richer. The richer the society, the greater the financial loss but the better buildings are able to withstand disasters without producing fatalities, In response, the total amount of international aid for natural disasters in the ten-year period 2000 to 2009 was US$37bn.4 Part of this went in immediate relief and part in recovery, reconstruction and development.
Current monitoring and evaluating Currently there is no agreed standard approach to evaluating the effectiveness of recovery aid, although international frameworks such as PDNA (Post-Disaster Needs Assessment, by United Nations Development Program, European Commission and World Bank) is currently being developed, and TRIAMS (Tsunami Recovery and Impact Assessment and Monitoring System) is being implemented to monitor recovery from the Indian Ocean Tsunami.
There have been various attempts to devise ways of analysing recovery. After the Kobe Earthquake in 1995, Japanese researchers used published local government data covering many aspects of socioeconomic activity to compare trends before and after the event.5 The
Emily So
Emily So
6
problem with applying this approach to other places is that it requires large amounts of pre-disaster data. After the Chi-Chi earthquake in Taiwan in 1999, researchers proposed a method of measuring physical recovery using a spatial reconstruction model based on the physical reconstruction of public buildings6.
A number of frameworks for post-disaster monitoring and evaluation have also been developed. The Economic Commission for Latin America and the Caribbean (ECLAC) provides a comprehensive loss assessment toolkit that measures the impact a disaster can have on a community.7 Development indicators are also referred to in the United Nation’s Millennium Development Goals8 and the World Development Indicators.9 The Sphere Project contains guidelines and minimum standards on various aspects of the humanitarian response to a disaster under four headings: 1 Water, sanitation and hygiene promotion; 2 Food security, nutrition and food aid,; 3 Shelter, settlement and non-food items and 4 Health services. The handbook provides guidance notes on how signs of bad practice may be identified, as well as potential indicators that agencies may want to adopt. The focus of the Shere Project, however, is on emergency relief rather than long-term recovery.10
Another approach to monitoring recovery has been to develop information management systems.11 The systems are designed to collect and manage data for different phases of the disaster response cycle. The simplest system is known as a Logistics Support System (LSS) and was used in Guatemala after Hurricane Stan in 2005 to monitor the distribution of supplies and donations and thus increase the project’s transparency and accountability. The Development Assistance Database (DAD) a web-based aid management system has been used to track the provision of aid and the progress of reconstruction projects (Aid Effectiveness Portal, 2009) in 21 countries. The Disaster Recovery and Mitigation Information System (DREAMIS) launched in March 2009 by the World Bank is an online database that will provide financial statistics to support the reconstruction process.
Whilst DAD and DREAMIS are designed to predominantly track financial data, the following systems monitor the outcomes of recovery. The Relief and Information Systems for Earthquake Pakistan (RISEPAK) was developed after the 2005 Pakistan Earthquake to provide information on needs and response at village scale. Aceh Info 2.0 was released in July 2008 and played a role in assisting policymaking in Banda Aceh after the Asian Tsunami. It contains 280 recovery indicators from over 20 organisations, and other sources of information such as the Millennium Development Goals (MDGs) and the Tsunami Recovery Impact Assessment and Monitoring System (TRIAMs).12 The TRIAMS framework is based on a series of indicators that are categorised into four areas: 1. Vital needs, 2. Basic social services, 3. Infrastructure and 4. Livelihoods.13
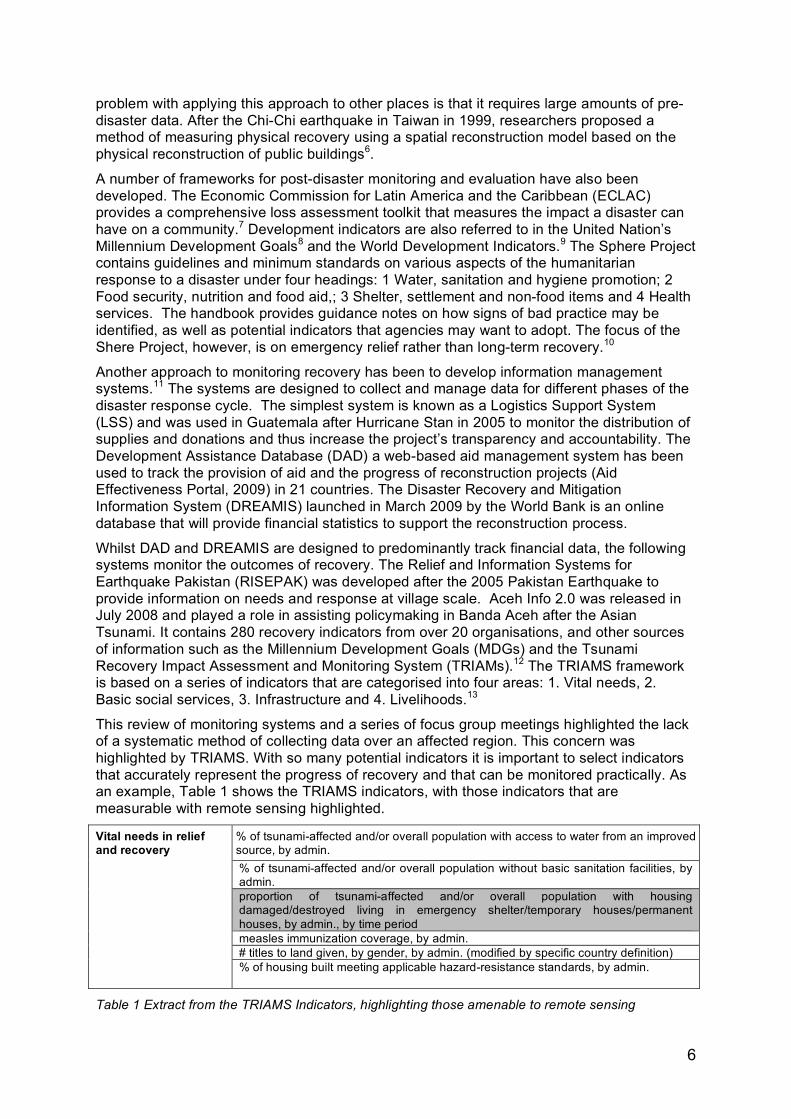
This review of monitoring systems and a series of focus group meetings highlighted the lack of a systematic method of collecting data over an affected region. This concern was highlighted by TRIAMS. With so many potential indicators it is important to select indicators that accurately represent the progress of recovery and that can be monitored practically. As an example, Table 1 shows the TRIAMS indicators, with those indicators that are measurable with remote sensing highlighted.
% of tsunami-affected and/or overall population with access to water from an improved source, by admin. % of tsunami-affected and/or overall population without basic sanitation facilities, by admin. proportion of tsunami-affected and/or overall population with housing damaged/destroyed living in emergency shelter/temporary houses/permanent houses, by admin., by time period measles immunization coverage, by admin. # titles to land given, by gender, by admin. (modified by specific country definition)
Vital needs in relief and recovery
% of housing built meeting applicable hazard-resistance standards, by admin.
Table 1 Extract from the TRIAMS Indicators, highlighting those amenable to remote sensing
7
Aims and objectives Collecting information quickly and systematically can be particularly difficult in a post-disaster situation where there are no accurate maps or shared language, and where there are a large number of agencies working independently of each other in different sectors of recovery. The objective of this study is to devise a set of indicators that can be measured systematically across a large geographical area using high-resolution satellite imagery.
This study aims to explore the use of remote sensing – specifically, satellite and aerial photographs – to monitor recovery from the time of the disaster to the present. The objective is, firstly, to develop a set of indicators to systematically and comprehensively monitor and evaluate recovery and, secondly, to examine the role of remote imagery in measuring change in these indicators.
The study aims at contributing to a system that would answer the kinds of questions that people involved in post-disaster recovery are likely to ask, for example:
1. How much recovery has been achieved?
2. Where do we need to focus new interventions to improve recovery and development?
3. Have our efforts been worthwhile and can we learn from recovery in this situation that can be applied in responding to future disasters?
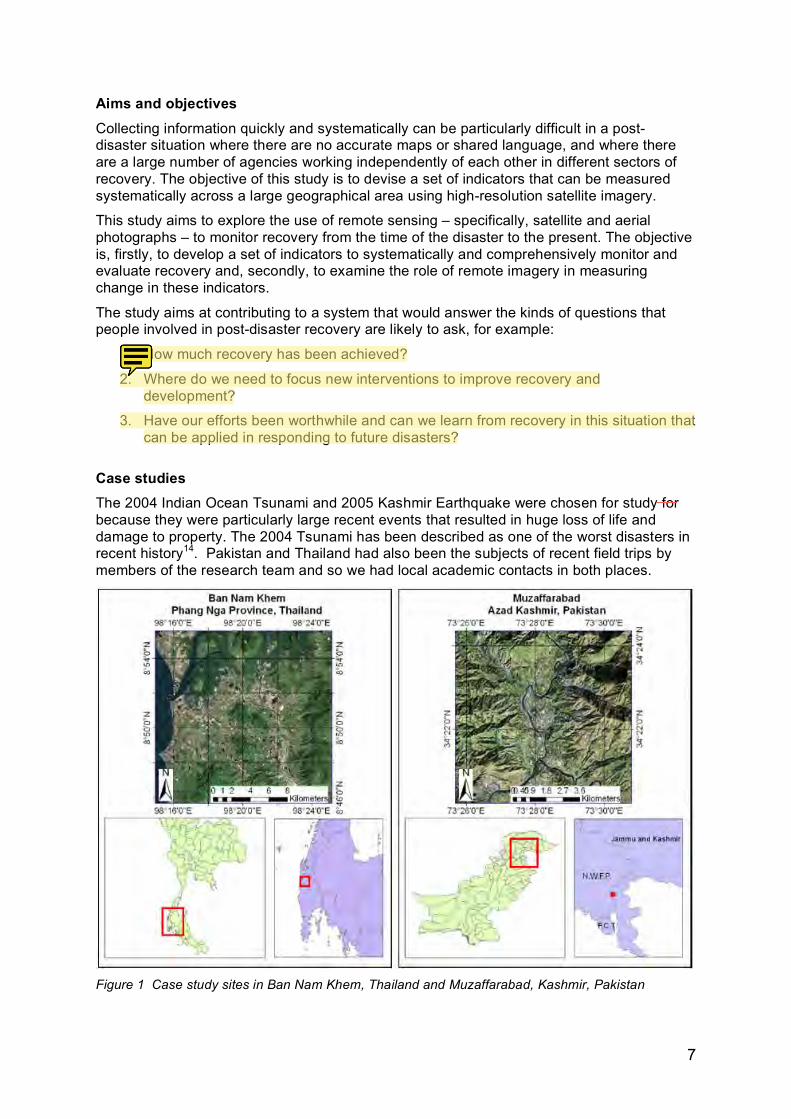
Case studies The 2004 Indian Ocean Tsunami and 2005 Kashmir Earthquake were chosen for study for because they were particularly large recent events that resulted in huge loss of life and damage to property. The 2004 Tsunami has been described as one of the worst disasters in recent history14. Pakistan and Thailand had also been the subjects of recent field trips by members of the research team and so we had local academic contacts in both places.
Figure 1 Case study sites in Ban Nam Khem, Thailand and Muzaffarabad, Kashmir, Pakistan
Emily So
Emily So
Emily So
Same Audience?
8
Case Study 1: Ban Nam Khem, Thailand On the morning of 26th December 2004 an undersea earthquake measuring more than 9.0 on the Richter scale triggered devastating waves that hit many countries bordering the Indian Ocean. This was one of the biggest undersea disturbances ever recorded with an epicentre just off the coast of Sumatra, Indonesia. Many countries were affected by the waves but the hardest hit were Indonesia, Sri Lanka, India and Thailand. The earthquake occurred at 7:58am on Boxing Day, which is a national holiday for many countries and meant that there were large numbers of tourists in the area. The total number of fatalities is reported to be over 225,000 with an estimated 1.2 million having been displaced.15 Destruction on this scale had not been seen anywhere else in recent history.
Damage assessment by the Pacific Disaster Centre after the 2004 Asian tsunami, highlighted four areas of interest in Thailand: 1. Ban Nam Khem 2. Khao Lak 3. Phuket Island and 4 Phi Phi Island. Phi Phi Island was excluded because of problems of accessibility and lack of ground data. Phuket was excluded because of its dependence on the tourism industry, which might have affected the recovery process and because most of the buildings had mid-rise reinforced concrete frames and therefore only received damage to their ground floors16. In contrast, a report by the Asian Disaster Preparedness Centre stated that “the whole village of Ban Nam Khem was badly damaged with only a few buildings left standing”.17 The Ban Nam Khem imagery was ordered with an area of 49 Km!, which is the minimum area for Ikonos imagery.
Case Study 2: Muzaffarabad, AJK Pakistan At 8:50am local time on Saturday 8th October 2005 an earthquake of magnitude 7.6 struck northern Pakistan causing widespread destruction in Azad Jammu Kashmir and in the eastern districts of North West Frontier Province as well as in India and Afghanistan.18 A map produced by the European Commission’s Joint Research Centre (JRC) showed severe damage stretching south-west from Balakot in the north to Bagh in the south.19 The epicenter was 12 miles northeast of Muzaffarabad, Azad Kashmir and 65 miles from Islamabad.20 The disaster caused widespread devastation, leaving millions of people homeless and thousands of buildings destroyed. It resulted in 74,500 people losing their lives21, over 100,000 were seriously injured22 and more than 3 million people were left without a shelter or adequate food.23 This earthquake is considered the worst in the history of the region.24 It destroyed more than 200,000 housing units and affected another 190,000; 5000 educational buildings and 500 health facilities were destroyed in addition to 37% of the country’s roads.25
We knew from our field studies to the area in November 1005 and June 2006 that Balakot and Muzaffarabad were the two large centres that were most severely damaged. The government’s decision to relocate Balakot 25 Km to the south excluded it as a suitable case study for recovery. This left Muzaffarabad but as part of the site selection process, the location, accessibility, damage, evidence of recovery and main industry were analysed for 12 villages, towns and cities in the affected area. Damage was identified using both remote sensing techniques and EEFIT field surveys. Heavy damage occurred in the centre of the urban area of Muzaffarabad, and schools had almost completely collapsed despite being built with reinforced concrete column and slab with masonry infill.26 Chela Bandi, a suburb of Muzaffarabad, was chosen finally as the case study area largely because we had conducted a household casualty survey there in 2006.
Structure of report There are four main parts to the report. Chapter 3 presents the proposed indicators and describes how they were devised; chapter 4 analyses the various methods to monitor these indicators, including imagery analysis and chapter 5 and 6 describe how these indicators
Emily So
Use magnitude!
Emily So
Emily So
Emily So
Emily So
Emily So
Jammu
Emily So
CAPS?

9
and methods were applied in the two case studies. Chapter 7 compares the costs and benefits of using each method for each indicator and Chapter 8 summarises the main conclusions and points the way to further work.
10
3 Indicators of recovery
Introduction The start of our research coincided with a conference on Post Disaster Needs Assessment (PDNA) in Brussels 19-20 May 2008 organised by the World Bank and the European Commission. About forty senior people working in the relief and recovery sectors attended and this was their third meeting.
The aim of the initiative is to develop a way of coordinating agencies involved in post disaster needs analysis (PDNA). The main drivers for the initiative are to the bridge the gap between relief aid and development funding, to restore the foundations for development as early as possible and to identify opportunities for positive change that will increase resilience to future disaster. The approach is to build on current post conflict needs analysis, in particular the World Bank method of calculating damage and loss called ECLAC and the assessment of livelihoods and social issues by aid agencies like WFP, ILO.
The delegates at this conference formed the contacts for our user needs survey. The aim of this survey of user needs was to find out what information sources international and national relief and development agencies already use to assess and monitor the recovery process after major natural disasters and what information they lack. The survey was emailed to 50 people. The survey was also used at round table meetings and individual interviews with stakeholders responsible for monitoring recovery or needing information about the process in both Thailand and Pakistan.
The survey found that two-thirds of respondents (69%) say that their organization already uses satellite imagery to assess needs. In addition people also mentioned using mapping and GIS data, local knowledge including interviews with key informants and focus groups, unpublished surveys and reports, networking and contacts with agencies with a field presence, ECLAC damage and loss calculations, press articles and websites.
The information respondents currently includes:
1. Base Line Data
2. Damage assessment and mapping
3. Needs assessment
4. Monitoring recovery: timing of restoration of community functions.
The survey contributed to the compilation of the indicators by asking the users what indicators they would find useful. Five major categories were identified:
1. Access
2. Housing
3. Environment
4. Services
5. Livelihoods
The respondents were asked to prioritize a draft set of 24 indicators. It was apparent that people prioritised indicators relevant to their own agency’s needs. And consistent with the general preference for a comprehensive approach to monitoring recovery, all 24 of the indicators were given a medium to high priority. This list of indicators was amended and the proposed indicators were sub-divided into 11 Recovery Categories that represent all the aspects of recovery identified by the users and a literature search. The following table shows the overlap between the Recovery Categories and those used by ECLAC, the Sphere Guidelines and TRIAMS.
Emily So
Emily So
Emily So
sounds like a group of OAPs.. Key Personnel?
Emily So
Have a list of acronyms at the start of the report.
Emily So
don't like this sentence!
11
Proposed Indicator Categories ECLAC Sphere Guidelines TRIAMs
Accessibility Transport and communications Infrastructure
Buildings Affected population Housing and Human Settlements
Shelter, Settlement and Non-Food Items
Vital needs Infrastructure
Environment Environment Infrastructure
Phy
sica
l Ind
icat
ors
Safety and Vulnerability Infrastructure
Administration and Local Services
Education Education and culture Basic Social Services
Healthcare Health sector Health Services Vital needs Basic Social Services
Power Energy
Ser
vice
s an
d A
men
ities
In
dica
tors
Water and Sanitation Drinking water and sanitation
Water, Sanitation and Hygiene Promotion
Vital needs
Food Aid and Food Security
Food Security, Nutrition and Food Aid
Soc
io-E
cono
mic
In
dica
tors
Livelihood
Employment and income Agriculture Trade and industry Tourism
Livelihoods
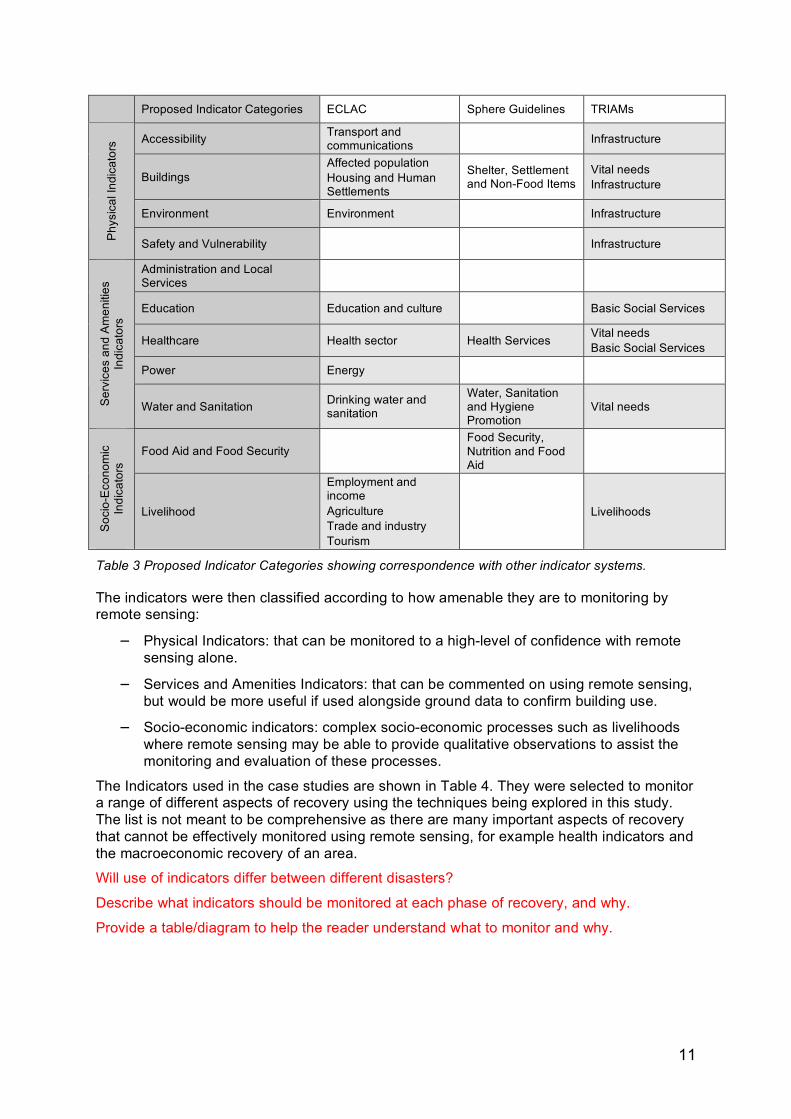
Table 3 Proposed Indicator Categories showing correspondence with other indicator systems.
The indicators were then classified according to how amenable they are to monitoring by remote sensing:
! Physical Indicators: that can be monitored to a high-level of confidence with remote sensing alone.
! Services and Amenities Indicators: that can be commented on using remote sensing, but would be more useful if used alongside ground data to confirm building use.
! Socio-economic indicators: complex socio-economic processes such as livelihoods where remote sensing may be able to provide qualitative observations to assist the monitoring and evaluation of these processes.
The Indicators used in the case studies are shown in Table 4. They were selected to monitor a range of different aspects of recovery using the techniques being explored in this study. The list is not meant to be comprehensive as there are many important aspects of recovery that cannot be effectively monitored using remote sensing, for example health indicators and the macroeconomic recovery of an area.
Will use of indicators differ between different disasters?
Describe what indicators should be monitored at each phase of recovery, and why.
Provide a table/diagram to help the reader understand what to monitor and why.
12
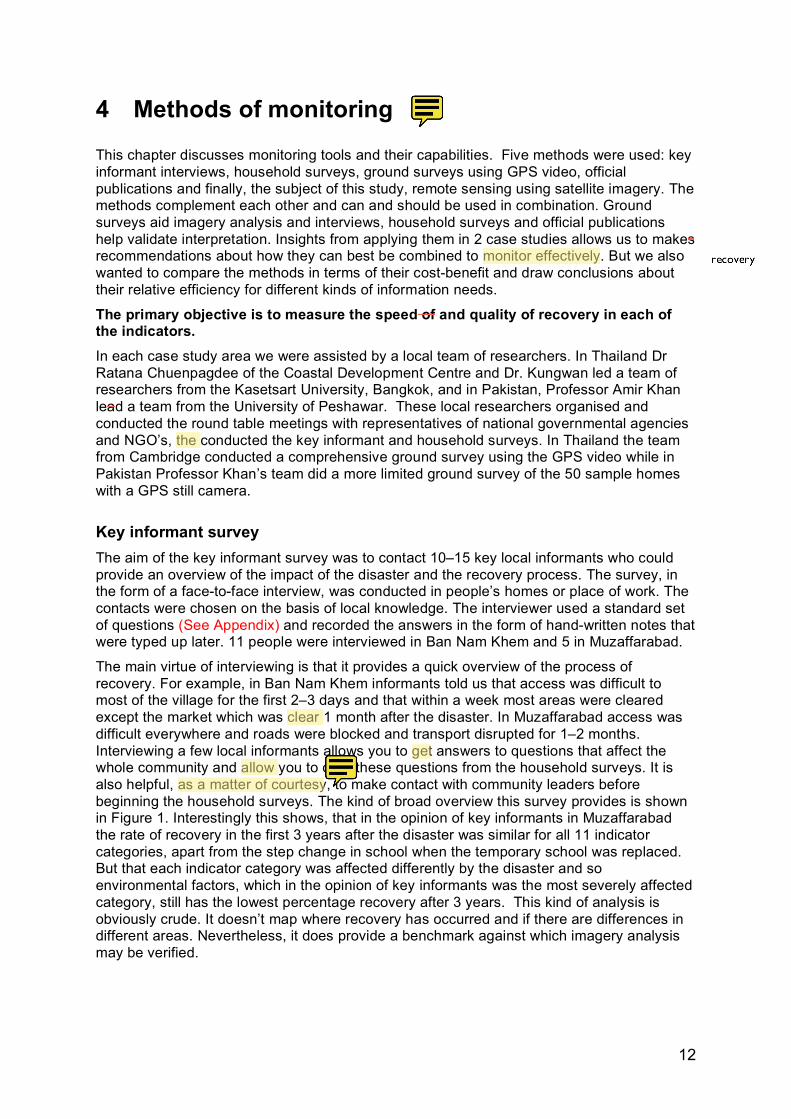
4 Methods of monitoring
This chapter discusses monitoring tools and their capabilities. Five methods were used: key informant interviews, household surveys, ground surveys using GPS video, official publications and finally, the subject of this study, remote sensing using satellite imagery. The methods complement each other and can and should be used in combination. Ground surveys aid imagery analysis and interviews, household surveys and official publications help validate interpretation. Insights from applying them in 2 case studies allows us to makes recommendations about how they can best be combined to monitor effectively. But we also wanted to compare the methods in terms of their cost-benefit and draw conclusions about their relative efficiency for different kinds of information needs.
The primary objective is to measure the speed of and quality of recovery in each of the indicators. In each case study area we were assisted by a local team of researchers. In Thailand Dr Ratana Chuenpagdee of the Coastal Development Centre and Dr. Kungwan led a team of researchers from the Kasetsart University, Bangkok, and in Pakistan, Professor Amir Khan lead a team from the University of Peshawar. These local researchers organised and conducted the round table meetings with representatives of national governmental agencies and NGO’s, the conducted the key informant and household surveys. In Thailand the team from Cambridge conducted a comprehensive ground survey using the GPS video while in Pakistan Professor Khan’s team did a more limited ground survey of the 50 sample homes with a GPS still camera.
Key informant survey The aim of the key informant survey was to contact 10–15 key local informants who could provide an overview of the impact of the disaster and the recovery process. The survey, in the form of a face-to-face interview, was conducted in people’s homes or place of work. The contacts were chosen on the basis of local knowledge. The interviewer used a standard set of questions (See Appendix) and recorded the answers in the form of hand-written notes that were typed up later. 11 people were interviewed in Ban Nam Khem and 5 in Muzaffarabad.
The main virtue of interviewing is that it provides a quick overview of the process of recovery. For example, in Ban Nam Khem informants told us that access was difficult to most of the village for the first 2–3 days and that within a week most areas were cleared except the market which was clear 1 month after the disaster. In Muzaffarabad access was difficult everywhere and roads were blocked and transport disrupted for 1–2 months. Interviewing a few local informants allows you to get answers to questions that affect the whole community and allow you to drop these questions from the household surveys. It is also helpful, as a matter of courtesy, to make contact with community leaders before beginning the household surveys. The kind of broad overview this survey provides is shown in Figure 1. Interestingly this shows, that in the opinion of key informants in Muzaffarabad the rate of recovery in the first 3 years after the disaster was similar for all 11 indicator categories, apart from the step change in school when the temporary school was replaced. But that each indicator category was affected differently by the disaster and so environmental factors, which in the opinion of key informants was the most severely affected category, still has the lowest percentage recovery after 3 years. This kind of analysis is obviously crude. It doesn’t map where recovery has occurred and if there are differences in different areas. Nevertheless, it does provide a benchmark against which imagery analysis may be verified.
Emily So
Emily So
recovery
Emily So
Emily So
Emily So
Emily So
Emily So
Emily So
Emily So
Emily So
Emily So
Emily So
more than a matter of courtesy....
Emily So
Are we suggesting this order? Do we have to do the key informant, household and ground surveys to make the RS useful?
13
Household survey The aim of the household survey was to gain more information about the recovery experience of the affected households and to create a qualitative narrative for each indicator to aide and validate the image analysis. In particular we wanted to obtain dates in the recovery when particular services were reinstated. We also wanted to establish how household structure was affected by the disaster and to analyse how socio-economic status might have affected household recovery.
A two-page household survey was designed, piloted and implemented in the two case study areas. (See Appendix) The survey opened with questions about the socio-economic and demographic characteristics of the household, to establish the losses they experienced and to derive a recovery narrative, including key dates. The main part of the survey consists of 12 sections, each representing a different aspect of recovery. For each of these sections the survey aims to determine what problems were faced, how the household overcame these issues, if their situation is better, worse or the same as before the disaster, when key events occurred and how the recovery process could have been improved. Due to the complex nature of recovery the majority of the questions were designed as open-ended prompts to invoke discussion about their experiences. The survey ends with a series of questions designed to identify the household’s perception of community recovery. It also aims to establish which aspects of recovery are most important to the householder and to obtain recommendations on how the recovery process as a whole may have been improved.
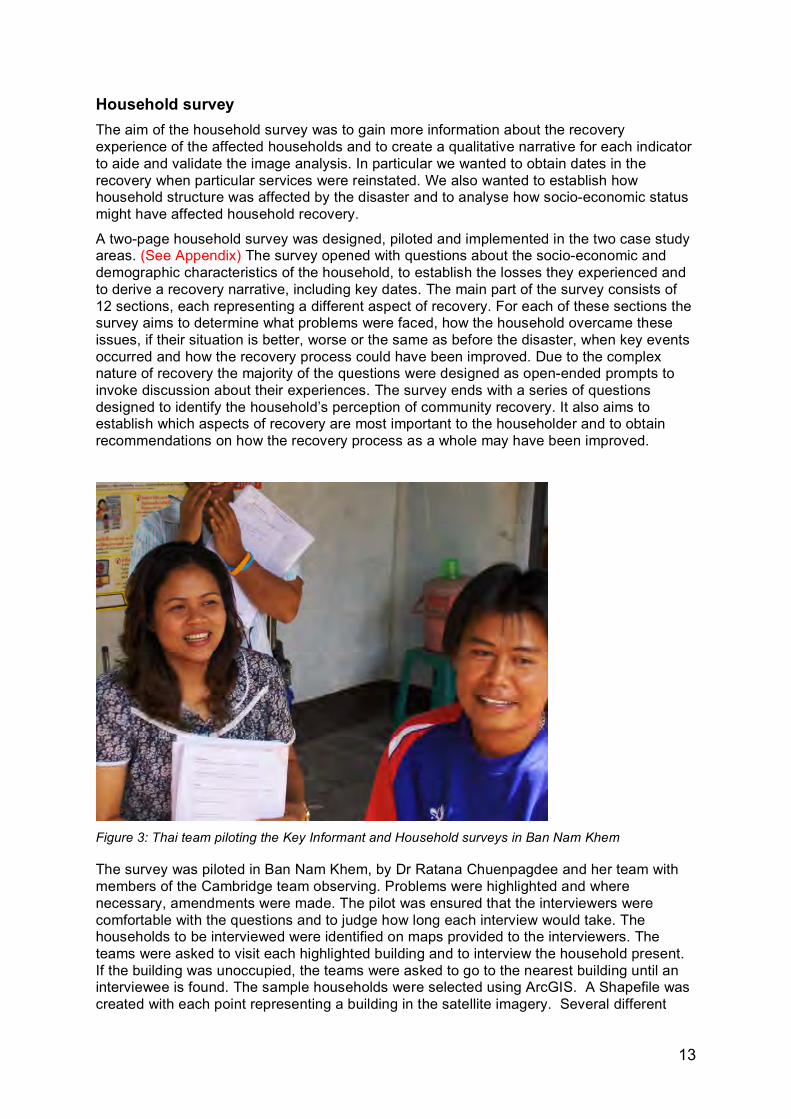
Figure 3: Thai team piloting the Key Informant and Household surveys in Ban Nam Khem
The survey was piloted in Ban Nam Khem, by Dr Ratana Chuenpagdee and her team with members of the Cambridge team observing. Problems were highlighted and where necessary, amendments were made. The pilot was ensured that the interviewers were comfortable with the questions and to judge how long each interview would take. The households to be interviewed were identified on maps provided to the interviewers. The teams were asked to visit each highlighted building and to interview the household present. If the building was unoccupied, the teams were asked to go to the nearest building until an interviewee is found. The sample households were selected using ArcGIS. A Shapefile was created with each point representing a building in the satellite imagery. Several different
14
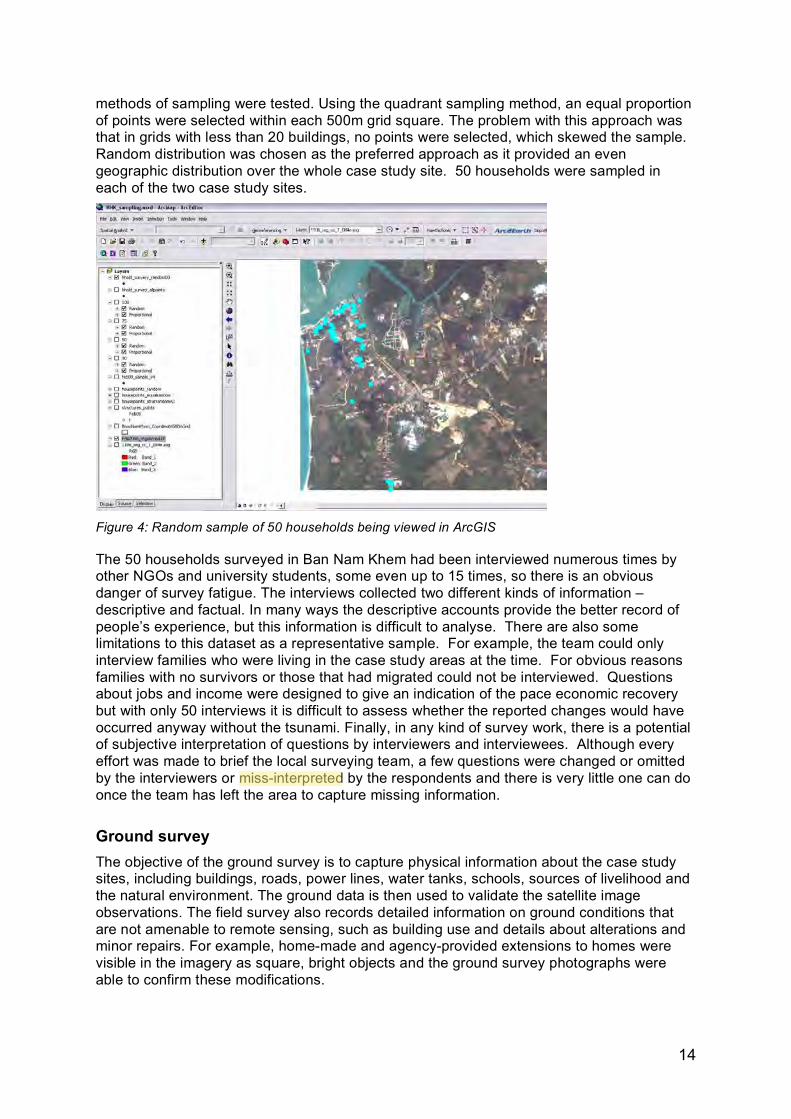
methods of sampling were tested. Using the quadrant sampling method, an equal proportion of points were selected within each 500m grid square. The problem with this approach was that in grids with less than 20 buildings, no points were selected, which skewed the sample. Random distribution was chosen as the preferred approach as it provided an even geographic distribution over the whole case study site. 50 households were sampled in each of the two case study sites.
Figure 4: Random sample of 50 households being viewed in ArcGIS
The 50 households surveyed in Ban Nam Khem had been interviewed numerous times by other NGOs and university students, some even up to 15 times, so there is an obvious danger of survey fatigue. The interviews collected two different kinds of information – descriptive and factual. In many ways the descriptive accounts provide the better record of people’s experience, but this information is difficult to analyse. There are also some limitations to this dataset as a representative sample. For example, the team could only interview families who were living in the case study areas at the time. For obvious reasons families with no survivors or those that had migrated could not be interviewed. Questions about jobs and income were designed to give an indication of the pace economic recovery but with only 50 interviews it is difficult to assess whether the reported changes would have occurred anyway without the tsunami. Finally, in any kind of survey work, there is a potential of subjective interpretation of questions by interviewers and interviewees. Although every effort was made to brief the local surveying team, a few questions were changed or omitted by the interviewers or miss-interpreted by the respondents and there is very little one can do once the team has left the area to capture missing information.
Ground survey The objective of the ground survey is to capture physical information about the case study sites, including buildings, roads, power lines, water tanks, schools, sources of livelihood and the natural environment. The ground data is then used to validate the satellite image observations. The field survey also records detailed information on ground conditions that are not amenable to remote sensing, such as building use and details about alterations and minor repairs. For example, home-made and agency-provided extensions to homes were visible in the imagery as square, bright objects and the ground survey photographs were able to confirm these modifications.
Emily So
15
The field survey was conducted across the whole extent of the satellite image and included areas that were directly and indirectly affected by the tsunami, including a community of prefabricated houses that were built several kilometres from Ban Nam Khem.
Two methods were used to capture geo-coded imagery in Ban Nam Khem – still photographs taken by a GPS camera and video linked to the VIEWSTM system. The VIEWSTM (Visualizing Earthquakes with Satellites), developed by ImageCat Inc, integrates remotely-sensed imagery with high definition video through a map overlay that draws a track of the recording linked to the video playing in a window next to the satellite image. VIEWSTM collects continuous imagery from a site from two high definition video cameras in a slow-moving vehicle: one camera pointing sideways to record building facades and the other pointing forward to capture building heights and additional information such as road type and power-lines. The VIEWS system and a GPS camera were used in Ban Nam Khem to capture, store and visualise over 10 hours of video data and 1,500 geo-referenced photographs.
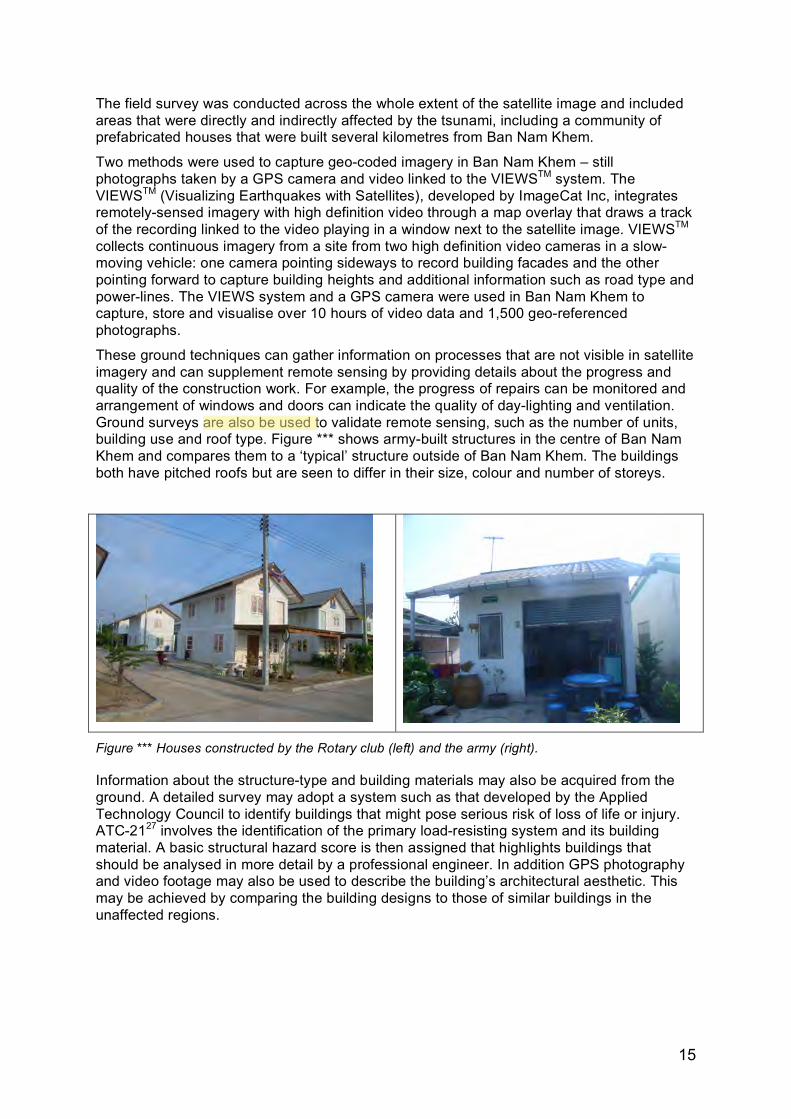
These ground techniques can gather information on processes that are not visible in satellite imagery and can supplement remote sensing by providing details about the progress and quality of the construction work. For example, the progress of repairs can be monitored and arrangement of windows and doors can indicate the quality of day-lighting and ventilation. Ground surveys are also be used to validate remote sensing, such as the number of units, building use and roof type. Figure *** shows army-built structures in the centre of Ban Nam Khem and compares them to a ‘typical’ structure outside of Ban Nam Khem. The buildings both have pitched roofs but are seen to differ in their size, colour and number of storeys.
Figure *** Houses constructed by the Rotary club (left) and the army (right).
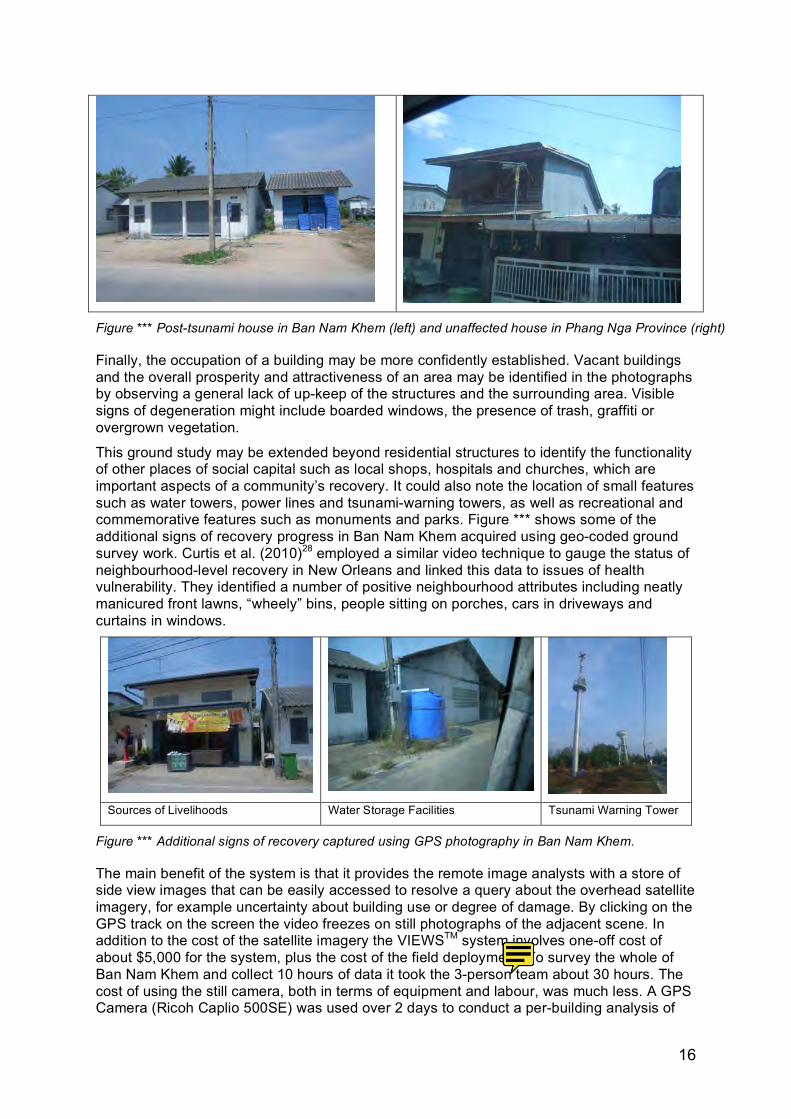
Information about the structure-type and building materials may also be acquired from the ground. A detailed survey may adopt a system such as that developed by the Applied Technology Council to identify buildings that might pose serious risk of loss of life or injury. ATC-2127 involves the identification of the primary load-resisting system and its building material. A basic structural hazard score is then assigned that highlights buildings that should be analysed in more detail by a professional engineer. In addition GPS photography and video footage may also be used to describe the building’s architectural aesthetic. This may be achieved by comparing the building designs to those of similar buildings in the unaffected regions.
Emily So
16
Figure *** Post-tsunami house in Ban Nam Khem (left) and unaffected house in Phang Nga Province (right)
Finally, the occupation of a building may be more confidently established. Vacant buildings and the overall prosperity and attractiveness of an area may be identified in the photographs by observing a general lack of up-keep of the structures and the surrounding area. Visible signs of degeneration might include boarded windows, the presence of trash, graffiti or overgrown vegetation.
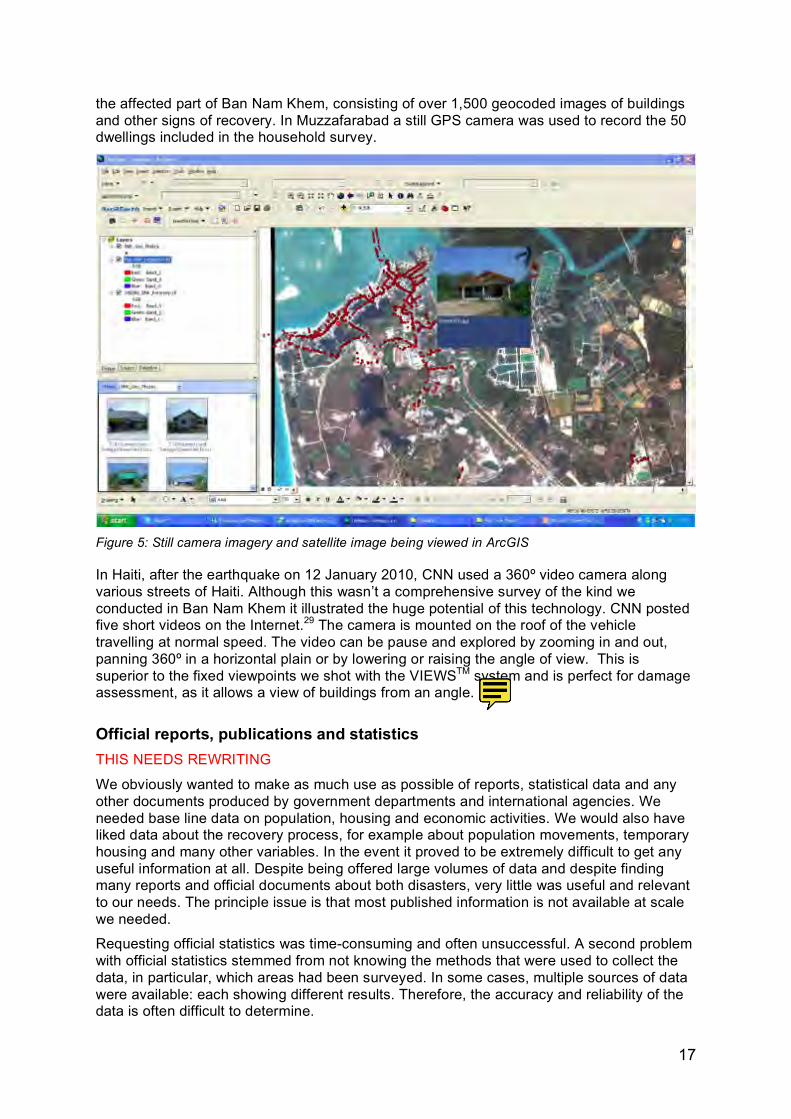
This ground study may be extended beyond residential structures to identify the functionality of other places of social capital such as local shops, hospitals and churches, which are important aspects of a community’s recovery. It could also note the location of small features such as water towers, power lines and tsunami-warning towers, as well as recreational and commemorative features such as monuments and parks. Figure *** shows some of the additional signs of recovery progress in Ban Nam Khem acquired using geo-coded ground survey work. Curtis et al. (2010)28 employed a similar video technique to gauge the status of neighbourhood-level recovery in New Orleans and linked this data to issues of health vulnerability. They identified a number of positive neighbourhood attributes including neatly manicured front lawns, “wheely” bins, people sitting on porches, cars in driveways and curtains in windows.
Sources of Livelihoods Water Storage Facilities Tsunami Warning Tower
Figure *** Additional signs of recovery captured using GPS photography in Ban Nam Khem.
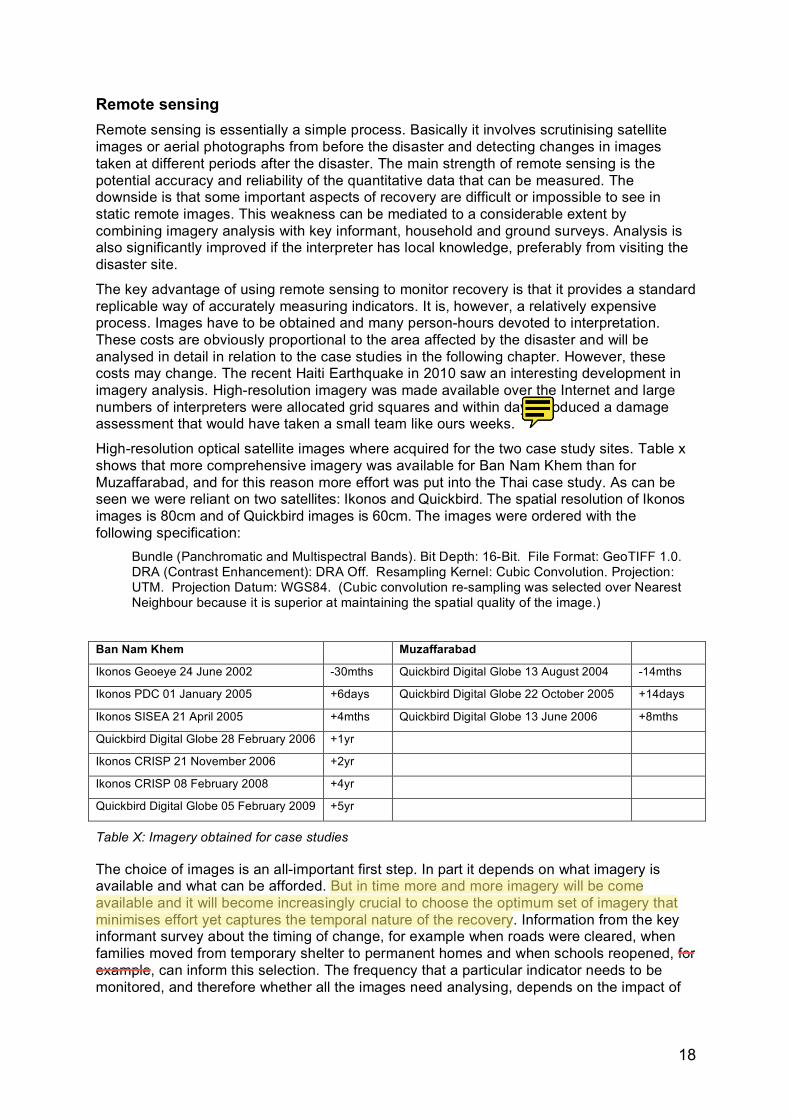
The main benefit of the system is that it provides the remote image analysts with a store of side view images that can be easily accessed to resolve a query about the overhead satellite imagery, for example uncertainty about building use or degree of damage. By clicking on the GPS track on the screen the video freezes on still photographs of the adjacent scene. In addition to the cost of the satellite imagery the VIEWSTM system involves one-off cost of about $5,000 for the system, plus the cost of the field deployment. To survey the whole of Ban Nam Khem and collect 10 hours of data it took the 3-person team about 30 hours. The cost of using the still camera, both in terms of equipment and labour, was much less. A GPS Camera (Ricoh Caplio 500SE) was used over 2 days to conduct a per-building analysis of
Emily So
No comment!! :)
17
the affected part of Ban Nam Khem, consisting of over 1,500 geocoded images of buildings and other signs of recovery. In Muzzafarabad a still GPS camera was used to record the 50 dwellings included in the household survey.
Figure 5: Still camera imagery and satellite image being viewed in ArcGIS
In Haiti, after the earthquake on 12 January 2010, CNN used a 360º video camera along various streets of Haiti. Although this wasn’t a comprehensive survey of the kind we conducted in Ban Nam Khem it illustrated the huge potential of this technology. CNN posted five short videos on the Internet.29 The camera is mounted on the roof of the vehicle travelling at normal speed. The video can be pause and explored by zooming in and out, panning 360º in a horizontal plain or by lowering or raising the angle of view. This is superior to the fixed viewpoints we shot with the VIEWSTM system and is perfect for damage assessment, as it allows a view of buildings from an angle.
Official reports, publications and statistics THIS NEEDS REWRITING
We obviously wanted to make as much use as possible of reports, statistical data and any other documents produced by government departments and international agencies. We needed base line data on population, housing and economic activities. We would also have liked data about the recovery process, for example about population movements, temporary housing and many other variables. In the event it proved to be extremely difficult to get any useful information at all. Despite being offered large volumes of data and despite finding many reports and official documents about both disasters, very little was useful and relevant to our needs. The principle issue is that most published information is not available at scale we needed.
Requesting official statistics was time-consuming and often unsuccessful. A second problem with official statistics stemmed from not knowing the methods that were used to collect the data, in particular, which areas had been surveyed. In some cases, multiple sources of data were available: each showing different results. Therefore, the accuracy and reliability of the data is often difficult to determine.
Emily So
is this the right place to be d*mning VIEWS!?
18
Remote sensing Remote sensing is essentially a simple process. Basically it involves scrutinising satellite images or aerial photographs from before the disaster and detecting changes in images taken at different periods after the disaster. The main strength of remote sensing is the potential accuracy and reliability of the quantitative data that can be measured. The downside is that some important aspects of recovery are difficult or impossible to see in static remote images. This weakness can be mediated to a considerable extent by combining imagery analysis with key informant, household and ground surveys. Analysis is also significantly improved if the interpreter has local knowledge, preferably from visiting the disaster site.
The key advantage of using remote sensing to monitor recovery is that it provides a standard replicable way of accurately measuring indicators. It is, however, a relatively expensive process. Images have to be obtained and many person-hours devoted to interpretation. These costs are obviously proportional to the area affected by the disaster and will be analysed in detail in relation to the case studies in the following chapter. However, these costs may change. The recent Haiti Earthquake in 2010 saw an interesting development in imagery analysis. High-resolution imagery was made available over the Internet and large numbers of interpreters were allocated grid squares and within days produced a damage assessment that would have taken a small team like ours weeks.
High-resolution optical satellite images where acquired for the two case study sites. Table x shows that more comprehensive imagery was available for Ban Nam Khem than for Muzaffarabad, and for this reason more effort was put into the Thai case study. As can be seen we were reliant on two satellites: Ikonos and Quickbird. The spatial resolution of Ikonos images is 80cm and of Quickbird images is 60cm. The images were ordered with the following specification:
Bundle (Panchromatic and Multispectral Bands). Bit Depth: 16-Bit. File Format: GeoTIFF 1.0. DRA (Contrast Enhancement): DRA Off. Resampling Kernel: Cubic Convolution. Projection: UTM. Projection Datum: WGS84. (Cubic convolution re-sampling was selected over Nearest Neighbour because it is superior at maintaining the spatial quality of the image.)
Ban Nam Khem Muzaffarabad
Ikonos Geoeye 24 June 2002 -30mths Quickbird Digital Globe 13 August 2004 -14mths
Ikonos PDC 01 January 2005 +6days Quickbird Digital Globe 22 October 2005 +14days
Ikonos SISEA 21 April 2005 +4mths Quickbird Digital Globe 13 June 2006 +8mths
Quickbird Digital Globe 28 February 2006 +1yr
Ikonos CRISP 21 November 2006 +2yr
Ikonos CRISP 08 February 2008 +4yr
Quickbird Digital Globe 05 February 2009 +5yr
Table X: Imagery obtained for case studies
The choice of images is an all-important first step. In part it depends on what imagery is available and what can be afforded. But in time more and more imagery will be come available and it will become increasingly crucial to choose the optimum set of imagery that minimises effort yet captures the temporal nature of the recovery. Information from the key informant survey about the timing of change, for example when roads were cleared, when families moved from temporary shelter to permanent homes and when schools reopened, for example, can inform this selection. The frequency that a particular indicator needs to be monitored, and therefore whether all the images need analysing, depends on the impact of
Emily So
I think you need to mention the lack of validation and QC with loads of interpreters
Emily So
Emily So
19
the disaster and other factors that affect the rate and timing of physical reconstruction, such as the availability of funds/materials and how quickly new urban plans can be approved.
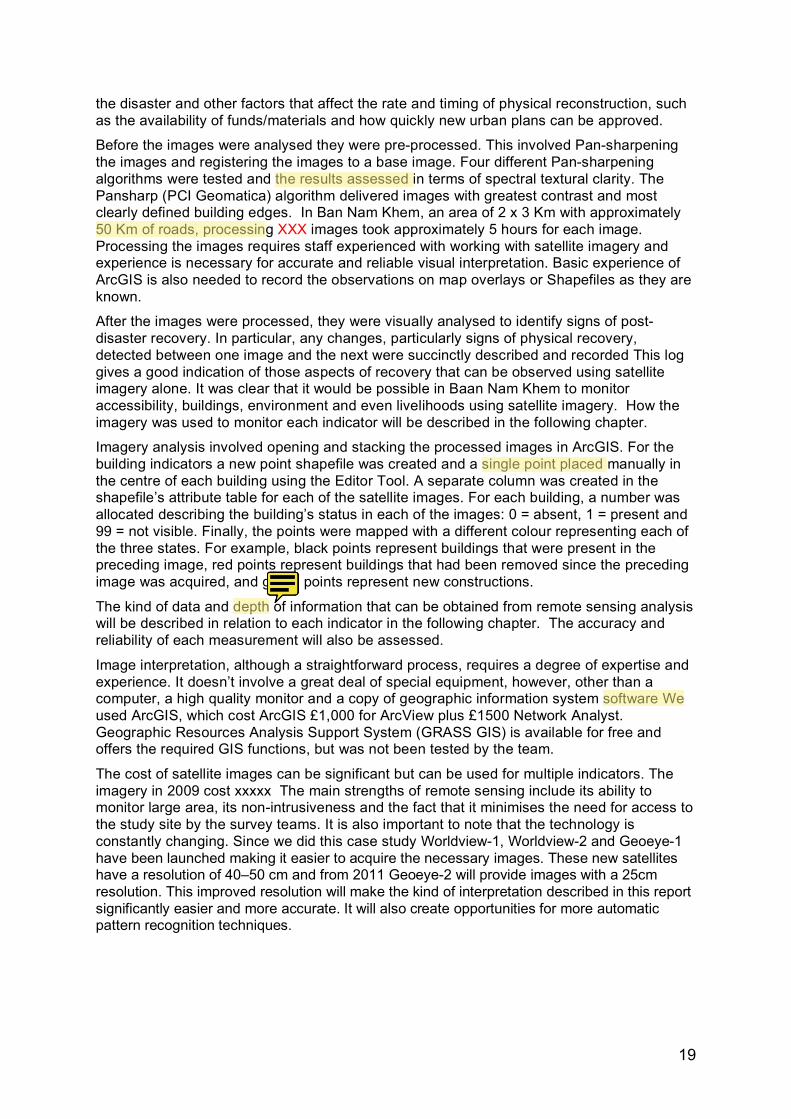
Before the images were analysed they were pre-processed. This involved Pan-sharpening the images and registering the images to a base image. Four different Pan-sharpening algorithms were tested and the results assessed in terms of spectral textural clarity. The Pansharp (PCI Geomatica) algorithm delivered images with greatest contrast and most clearly defined building edges. In Ban Nam Khem, an area of 2 x 3 Km with approximately 50 Km of roads, processing XXX images took approximately 5 hours for each image. Processing the images requires staff experienced with working with satellite imagery and experience is necessary for accurate and reliable visual interpretation. Basic experience of ArcGIS is also needed to record the observations on map overlays or Shapefiles as they are known.
After the images were processed, they were visually analysed to identify signs of post-disaster recovery. In particular, any changes, particularly signs of physical recovery, detected between one image and the next were succinctly described and recorded This log gives a good indication of those aspects of recovery that can be observed using satellite imagery alone. It was clear that it would be possible in Baan Nam Khem to monitor accessibility, buildings, environment and even livelihoods using satellite imagery. How the imagery was used to monitor each indicator will be described in the following chapter.
Imagery analysis involved opening and stacking the processed images in ArcGIS. For the building indicators a new point shapefile was created and a single point placed manually in the centre of each building using the Editor Tool. A separate column was created in the shapefile’s attribute table for each of the satellite images. For each building, a number was allocated describing the building’s status in each of the images: 0 = absent, 1 = present and 99 = not visible. Finally, the points were mapped with a different colour representing each of the three states. For example, black points represent buildings that were present in the preceding image, red points represent buildings that had been removed since the preceding image was acquired, and green points represent new constructions.
The kind of data and depth of information that can be obtained from remote sensing analysis will be described in relation to each indicator in the following chapter. The accuracy and reliability of each measurement will also be assessed.
Image interpretation, although a straightforward process, requires a degree of expertise and experience. It doesn’t involve a great deal of special equipment, however, other than a computer, a high quality monitor and a copy of geographic information system software We used ArcGIS, which cost ArcGIS £1,000 for ArcView plus £1500 Network Analyst. Geographic Resources Analysis Support System (GRASS GIS) is available for free and offers the required GIS functions, but was not been tested by the team.
The cost of satellite images can be significant but can be used for multiple indicators. The imagery in 2009 cost xxxxx The main strengths of remote sensing include its ability to monitor large area, its non-intrusiveness and the fact that it minimises the need for access to the study site by the survey teams. It is also important to note that the technology is constantly changing. Since we did this case study Worldview-1, Worldview-2 and Geoeye-1 have been launched making it easier to acquire the necessary images. These new satellites have a resolution of 40–50 cm and from 2011 Geoeye-2 will provide images with a 25cm resolution. This improved resolution will make the kind of interpretation described in this report significantly easier and more accurate. It will also create opportunities for more automatic pattern recognition techniques.
Emily So
Emily So
Emily So
Emily So
Emily So
Emily So
have to be careful using DEPTH in engineering reports.. another word?
20
5 Monitoring each indicator
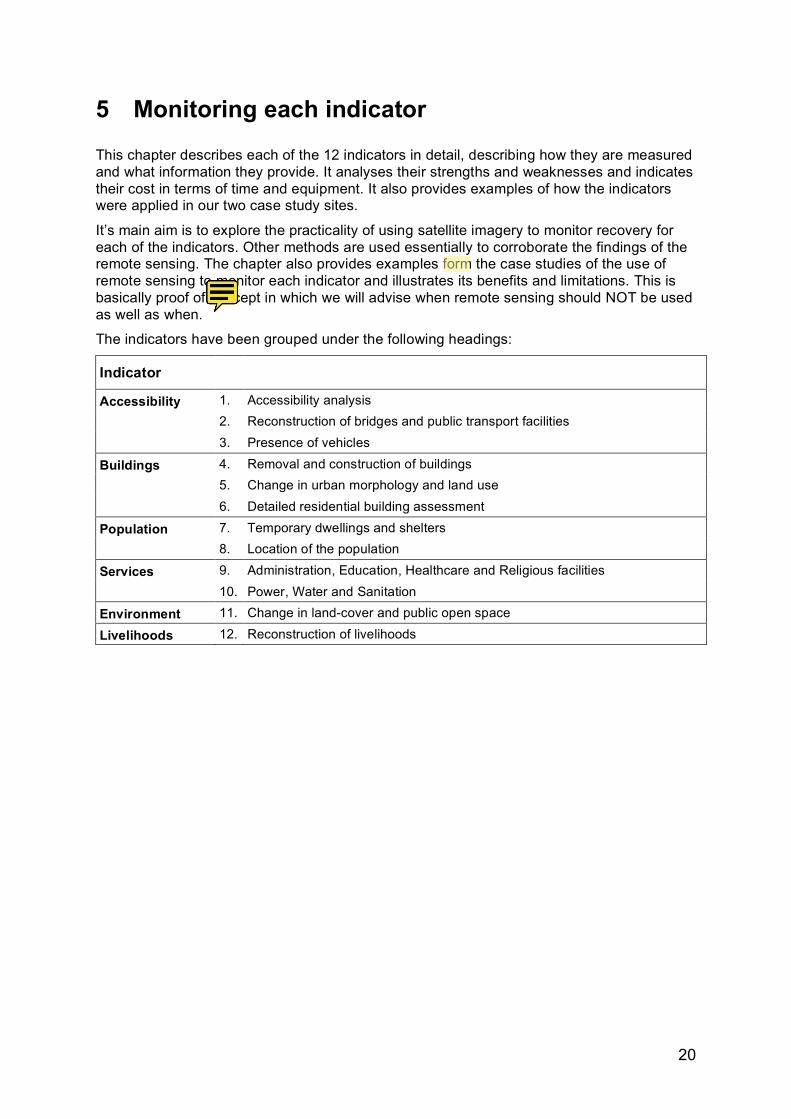
This chapter describes each of the 12 indicators in detail, describing how they are measured and what information they provide. It analyses their strengths and weaknesses and indicates their cost in terms of time and equipment. It also provides examples of how the indicators were applied in our two case study sites.
It’s main aim is to explore the practicality of using satellite imagery to monitor recovery for each of the indicators. Other methods are used essentially to corroborate the findings of the remote sensing. The chapter also provides examples form the case studies of the use of remote sensing to monitor each indicator and illustrates its benefits and limitations. This is basically proof of concept in which we will advise when remote sensing should NOT be used as well as when.
The indicators have been grouped under the following headings:
Indicator
1. Accessibility analysis 2. Reconstruction of bridges and public transport facilities
Accessibility
3. Presence of vehicles 4. Removal and construction of buildings 5. Change in urban morphology and land use
Buildings
6. Detailed residential building assessment 7. Temporary dwellings and shelters Population 8. Location of the population 9. Administration, Education, Healthcare and Religious facilities Services 10. Power, Water and Sanitation
Environment 11. Change in land-cover and public open space
Livelihoods 12. Reconstruction of livelihoods
Emily So
Emily So
they should be used.
21
Accessibility
Accessibility is a crucial issue that can determine the success of many other different aspects of relief and recovery. Aid agencies and national governments need access to deliver immediate relief and longer-term recovery depends on access to service facilities and sources of livelihood. Inaccessibility may also affect people’s health, the overall speed of reconstruction and the maintenance of reliable market prices. Key transport routes must be cleared and restored to allow relief vehicles and personnel access to severely affected areas and throughout recovery, consistent access routes are required to ensure the reliable import and export of food and other resources.
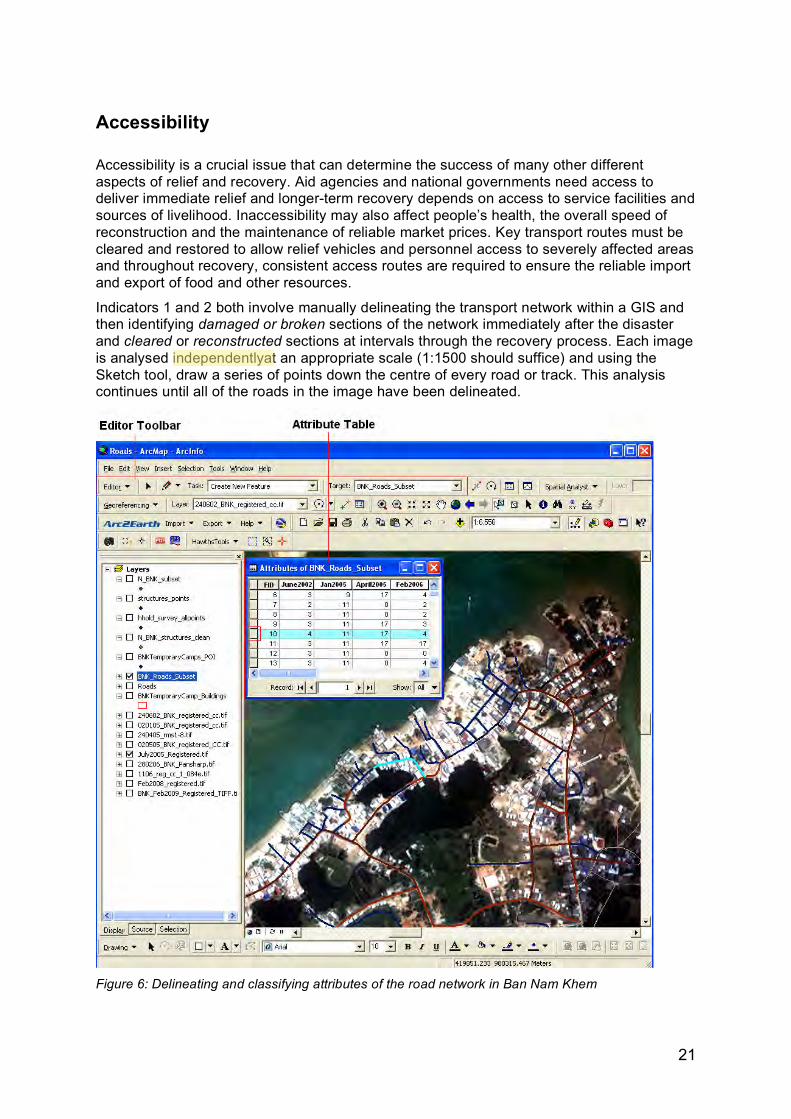
Indicators 1 and 2 both involve manually delineating the transport network within a GIS and then identifying damaged or broken sections of the network immediately after the disaster and cleared or reconstructed sections at intervals through the recovery process. Each image is analysed independentlyat an appropriate scale (1:1500 should suffice) and using the Sketch tool, draw a series of points down the centre of every road or track. This analysis continues until all of the roads in the image have been delineated.
Figure 6: Delineating and classifying attributes of the road network in Ban Nam Khem
Emily So
22
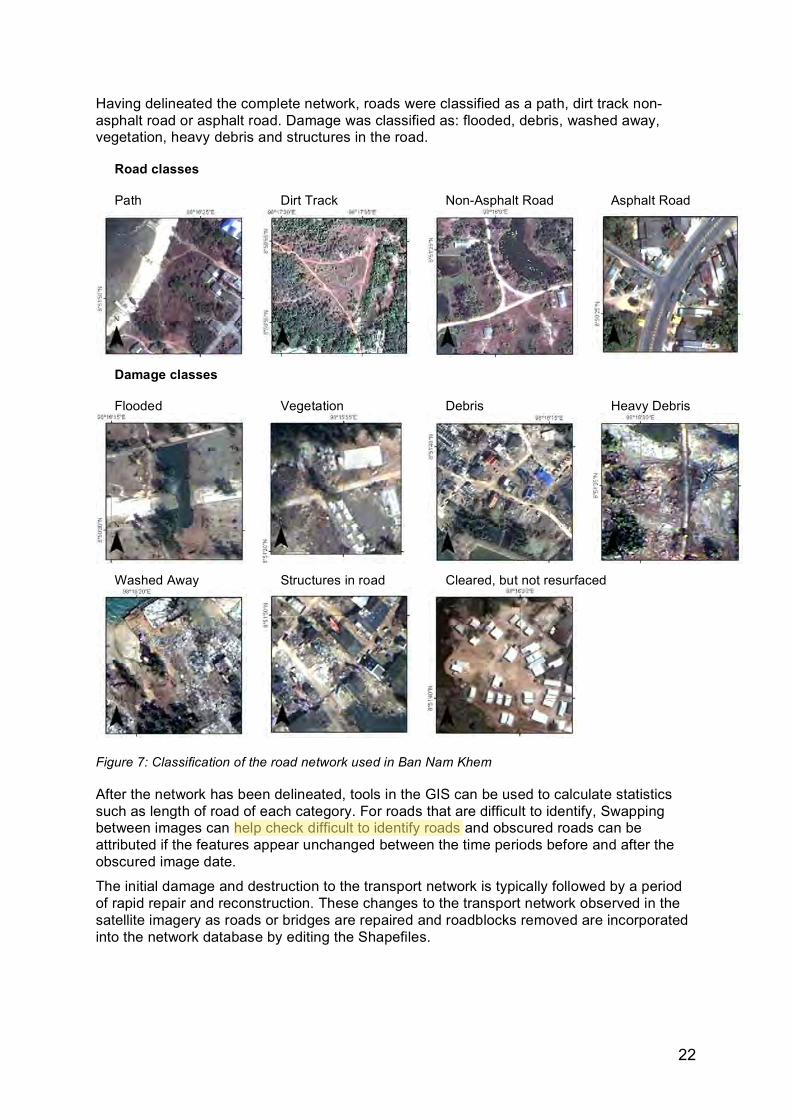
Having delineated the complete network, roads were classified as a path, dirt track non-asphalt road or asphalt road. Damage was classified as: flooded, debris, washed away, vegetation, heavy debris and structures in the road.
Road classes
Path Dirt Track Non-Asphalt Road Asphalt Road
Damage classes
Flooded Vegetation Debris Heavy Debris
Washed Away Structures in road Cleared, but not resurfaced
Figure 7: Classification of the road network used in Ban Nam Khem
After the network has been delineated, tools in the GIS can be used to calculate statistics such as length of road of each category. For roads that are difficult to identify, Swapping between images can help check difficult to identify roads and obscured roads can be attributed if the features appear unchanged between the time periods before and after the obscured image date.
The initial damage and destruction to the transport network is typically followed by a period of rapid repair and reconstruction. These changes to the transport network observed in the satellite imagery as roads or bridges are repaired and roadblocks removed are incorporated into the network database by editing the Shapefiles.
Emily So
23
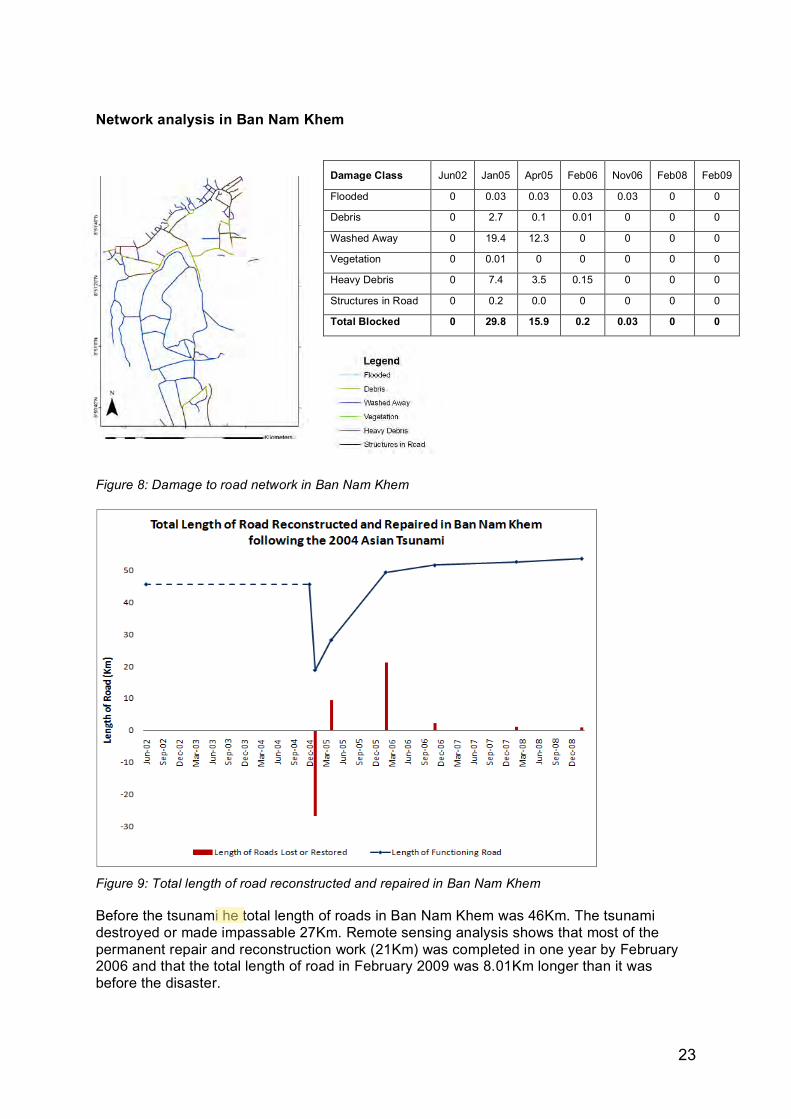
Network analysis in Ban Nam Khem
Damage Class Jun02 Jan05 Apr05 Feb06 Nov06 Feb08 Feb09
Flooded 0 0.03 0.03 0.03 0.03 0 0
Debris 0 2.7 0.1 0.01 0 0 0
Washed Away 0 19.4 12.3 0 0 0 0
Vegetation 0 0.01 0 0 0 0 0
Heavy Debris 0 7.4 3.5 0.15 0 0 0
Structures in Road 0 0.2 0.0 0 0 0 0
Total Blocked 0 29.8 15.9 0.2 0.03 0 0
Figure 8: Damage to road network in Ban Nam Khem
Figure 9: Total length of road reconstructed and repaired in Ban Nam Khem
Before the tsunami he total length of roads in Ban Nam Khem was 46Km. The tsunami destroyed or made impassable 27Km. Remote sensing analysis shows that most of the permanent repair and reconstruction work (21Km) was completed in one year by February 2006 and that the total length of road in February 2009 was 8.01Km longer than it was before the disaster.
Emily So
24
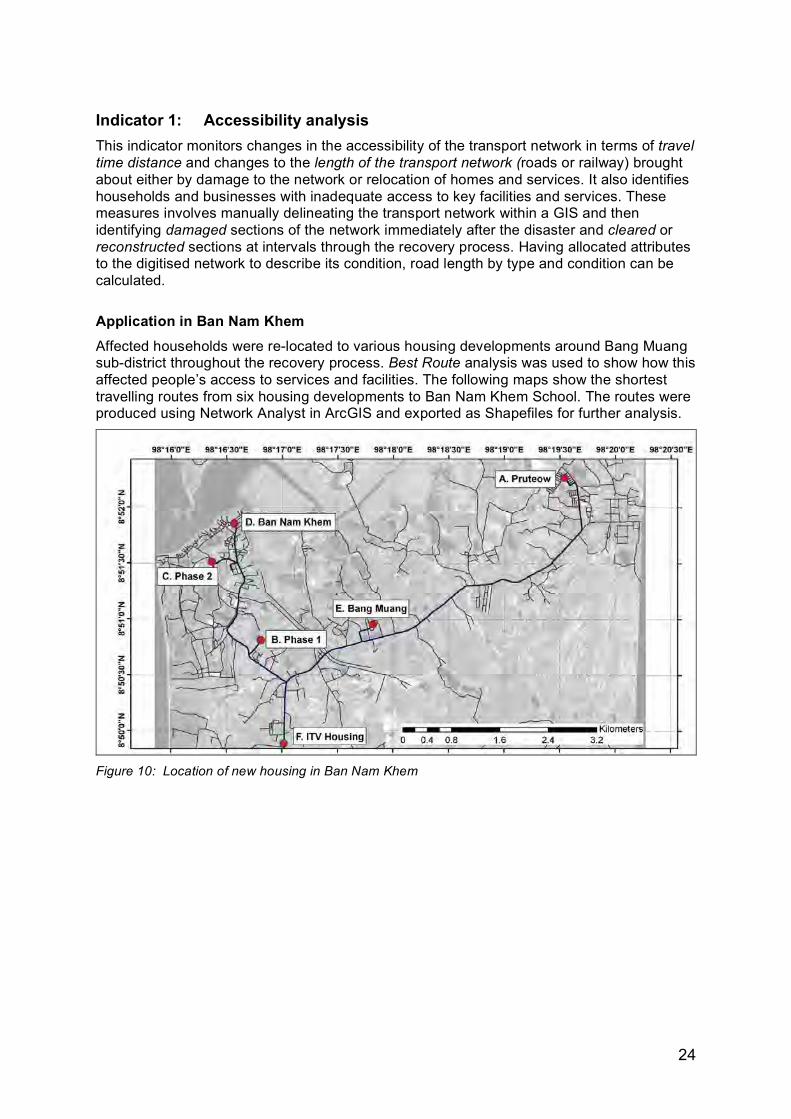
Indicator 1: Accessibility analysis This indicator monitors changes in the accessibility of the transport network in terms of travel time distance and changes to the length of the transport network (roads or railway) brought about either by damage to the network or relocation of homes and services. It also identifies households and businesses with inadequate access to key facilities and services. These measures involves manually delineating the transport network within a GIS and then identifying damaged sections of the network immediately after the disaster and cleared or reconstructed sections at intervals through the recovery process. Having allocated attributes to the digitised network to describe its condition, road length by type and condition can be calculated.
Application in Ban Nam Khem Affected households were re-located to various housing developments around Bang Muang sub-district throughout the recovery process. Best Route analysis was used to show how this affected people’s access to services and facilities. The following maps show the shortest travelling routes from six housing developments to Ban Nam Khem School. The routes were produced using Network Analyst in ArcGIS and exported as Shapefiles for further analysis.
Figure 10: Location of new housing in Ban Nam Khem
25
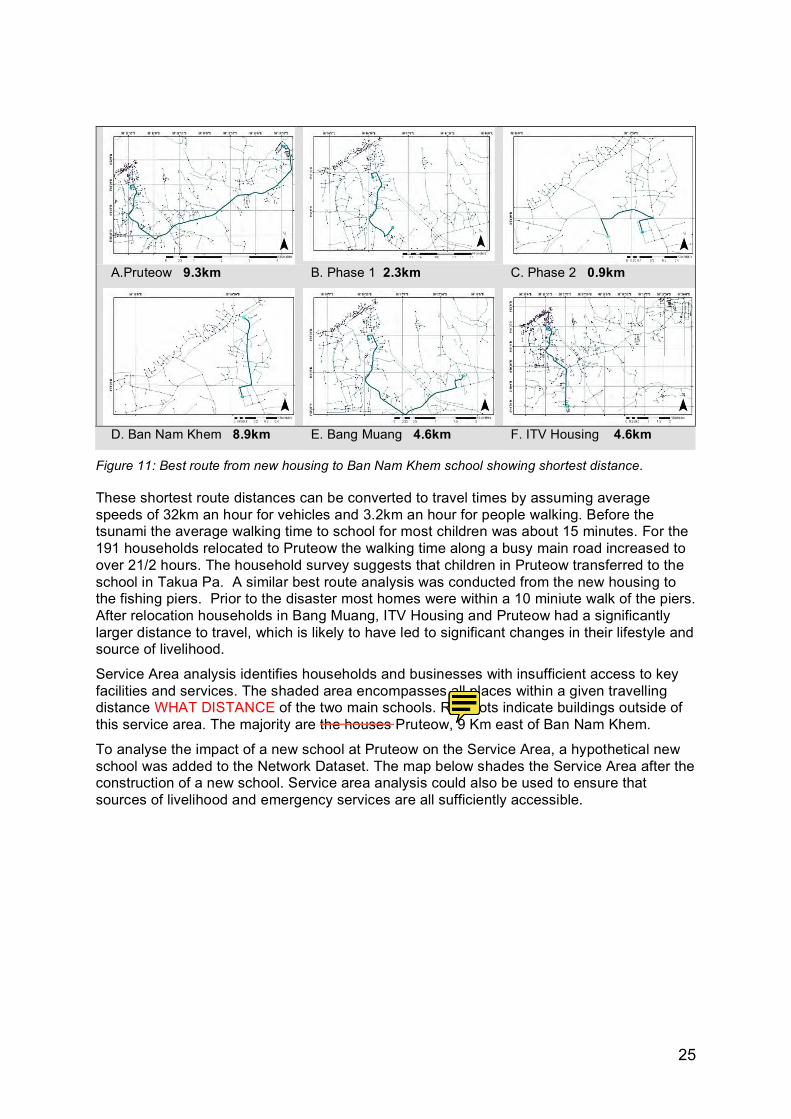
A.Pruteow 9.3km B. Phase 1 2.3km C. Phase 2 0.9km
D. Ban Nam Khem 8.9km E. Bang Muang 4.6km F. ITV Housing 4.6km
Figure 11: Best route from new housing to Ban Nam Khem school showing shortest distance.
These shortest route distances can be converted to travel times by assuming average speeds of 32km an hour for vehicles and 3.2km an hour for people walking. Before the tsunami the average walking time to school for most children was about 15 minutes. For the 191 households relocated to Pruteow the walking time along a busy main road increased to over 21/2 hours. The household survey suggests that children in Pruteow transferred to the school in Takua Pa. A similar best route analysis was conducted from the new housing to the fishing piers. Prior to the disaster most homes were within a 10 miniute walk of the piers. After relocation households in Bang Muang, ITV Housing and Pruteow had a significantly larger distance to travel, which is likely to have led to significant changes in their lifestyle and source of livelihood.
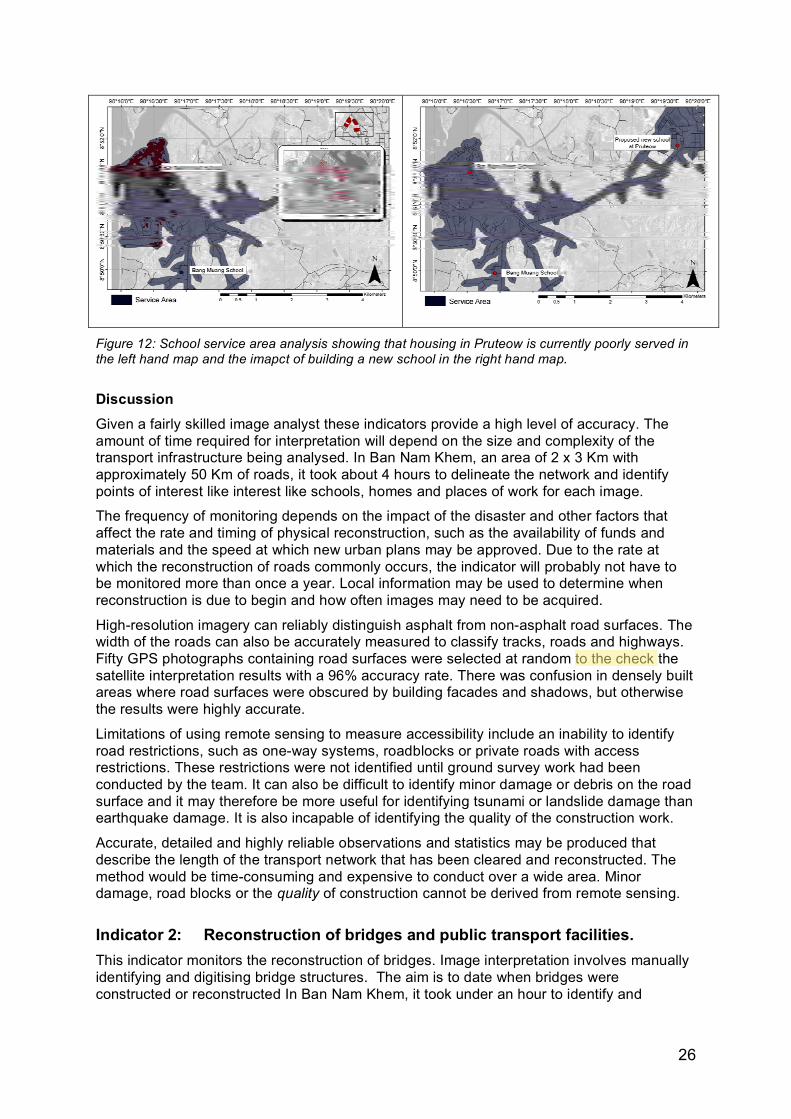
Service Area analysis identifies households and businesses with insufficient access to key facilities and services. The shaded area encompasses all places within a given travelling distance WHAT DISTANCE of the two main schools. Red dots indicate buildings outside of this service area. The majority are the houses Pruteow, 9 Km east of Ban Nam Khem.
To analyse the impact of a new school at Pruteow on the Service Area, a hypothetical new school was added to the Network Dataset. The map below shades the Service Area after the construction of a new school. Service area analysis could also be used to ensure that sources of livelihood and emergency services are all sufficiently accessible.
Emily So
Emily So
the Pruteow housing
26
Figure 12: School service area analysis showing that housing in Pruteow is currently poorly served in the left hand map and the imapct of building a new school in the right hand map.
Discussion Given a fairly skilled image analyst these indicators provide a high level of accuracy. The amount of time required for interpretation will depend on the size and complexity of the transport infrastructure being analysed. In Ban Nam Khem, an area of 2 x 3 Km with approximately 50 Km of roads, it took about 4 hours to delineate the network and identify points of interest like interest like schools, homes and places of work for each image.
The frequency of monitoring depends on the impact of the disaster and other factors that affect the rate and timing of physical reconstruction, such as the availability of funds and materials and the speed at which new urban plans may be approved. Due to the rate at which the reconstruction of roads commonly occurs, the indicator will probably not have to be monitored more than once a year. Local information may be used to determine when reconstruction is due to begin and how often images may need to be acquired.
High-resolution imagery can reliably distinguish asphalt from non-asphalt road surfaces. The width of the roads can also be accurately measured to classify tracks, roads and highways. Fifty GPS photographs containing road surfaces were selected at random to the check the satellite interpretation results with a 96% accuracy rate. There was confusion in densely built areas where road surfaces were obscured by building facades and shadows, but otherwise the results were highly accurate.
Limitations of using remote sensing to measure accessibility include an inability to identify road restrictions, such as one-way systems, roadblocks or private roads with access restrictions. These restrictions were not identified until ground survey work had been conducted by the team. It can also be difficult to identify minor damage or debris on the road surface and it may therefore be more useful for identifying tsunami or landslide damage than earthquake damage. It is also incapable of identifying the quality of the construction work.
Accurate, detailed and highly reliable observations and statistics may be produced that describe the length of the transport network that has been cleared and reconstructed. The method would be time-consuming and expensive to conduct over a wide area. Minor damage, road blocks or the quality of construction cannot be derived from remote sensing.
Indicator 2: Reconstruction of bridges and public transport facilities. This indicator monitors the reconstruction of bridges. Image interpretation involves manually identifying and digitising bridge structures. The aim is to date when bridges were constructed or reconstructed In Ban Nam Khem, it took under an hour to identify and
Emily So
27
delineate bridges on each image. Experience with satellite imagery is preferred to perform the visual interpretation work accurately, but is not necessary.
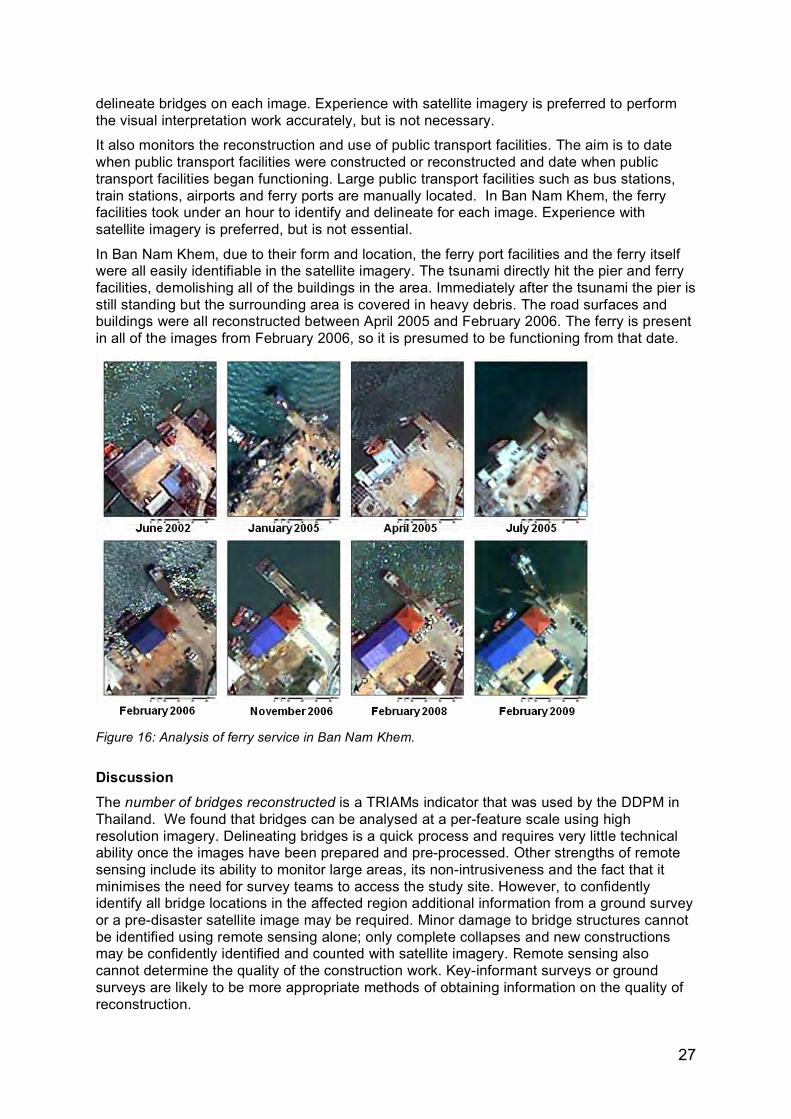
It also monitors the reconstruction and use of public transport facilities. The aim is to date when public transport facilities were constructed or reconstructed and date when public transport facilities began functioning. Large public transport facilities such as bus stations, train stations, airports and ferry ports are manually located. In Ban Nam Khem, the ferry facilities took under an hour to identify and delineate for each image. Experience with satellite imagery is preferred, but is not essential.
In Ban Nam Khem, due to their form and location, the ferry port facilities and the ferry itself were all easily identifiable in the satellite imagery. The tsunami directly hit the pier and ferry facilities, demolishing all of the buildings in the area. Immediately after the tsunami the pier is still standing but the surrounding area is covered in heavy debris. The road surfaces and buildings were all reconstructed between April 2005 and February 2006. The ferry is present in all of the images from February 2006, so it is presumed to be functioning from that date.
Figure 16: Analysis of ferry service in Ban Nam Khem.
Discussion The number of bridges reconstructed is a TRIAMs indicator that was used by the DDPM in Thailand. We found that bridges can be analysed at a per-feature scale using high resolution imagery. Delineating bridges is a quick process and requires very little technical ability once the images have been prepared and pre-processed. Other strengths of remote sensing include its ability to monitor large areas, its non-intrusiveness and the fact that it minimises the need for survey teams to access the study site. However, to confidently identify all bridge locations in the affected region additional information from a ground survey or a pre-disaster satellite image may be required. Minor damage to bridge structures cannot be identified using remote sensing alone; only complete collapses and new constructions may be confidently identified and counted with satellite imagery. Remote sensing also cannot determine the quality of the construction work. Key-informant surveys or ground surveys are likely to be more appropriate methods of obtaining information on the quality of reconstruction.
28
A range of different public transport facilities, such as bus stations, airports, ferry ports and train stations, can be analysed at a per-building scale using high resolution imagery. Delineating public transport facilities is a quick process and requires very little technical ability once the images have been prepared and pre-processed. However, only large facilities such as railway stations, bus stations, ferry ports and airports can be confidently identified with satellite imagery alone. Obviously ground information or reference maps can be used to assist this process. It is also not always easy to determine in satellite imagery if the facilities are in-use or not. Key-informant surveys or ground survey may be a more appropriate method of discovering when facilities come back into use and about the quality of the reconstruction and of the frequency and reliability of the service.
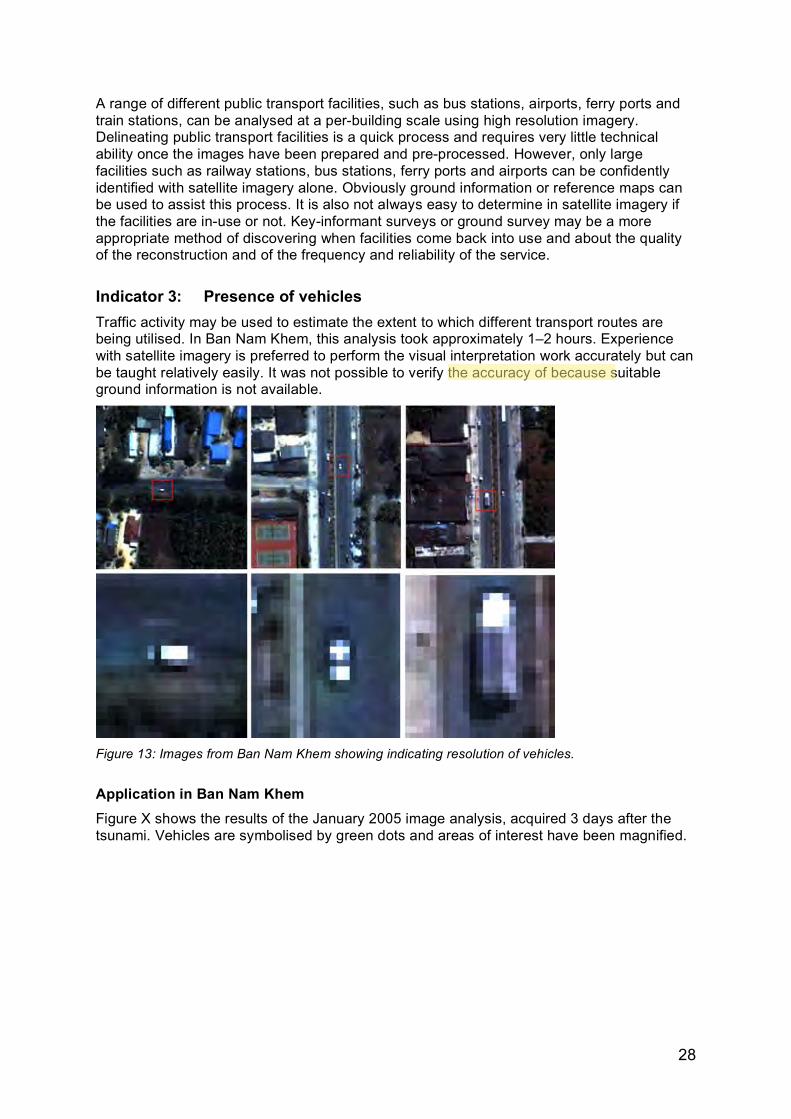
Indicator 3: Presence of vehicles Traffic activity may be used to estimate the extent to which different transport routes are being utilised. In Ban Nam Khem, this analysis took approximately 1–2 hours. Experience with satellite imagery is preferred to perform the visual interpretation work accurately but can be taught relatively easily. It was not possible to verify the accuracy of because suitable ground information is not available.
Figure 13: Images from Ban Nam Khem showing indicating resolution of vehicles.
Application in Ban Nam Khem Figure X shows the results of the January 2005 image analysis, acquired 3 days after the tsunami. Vehicles are symbolised by green dots and areas of interest have been magnified.
Emily So
29
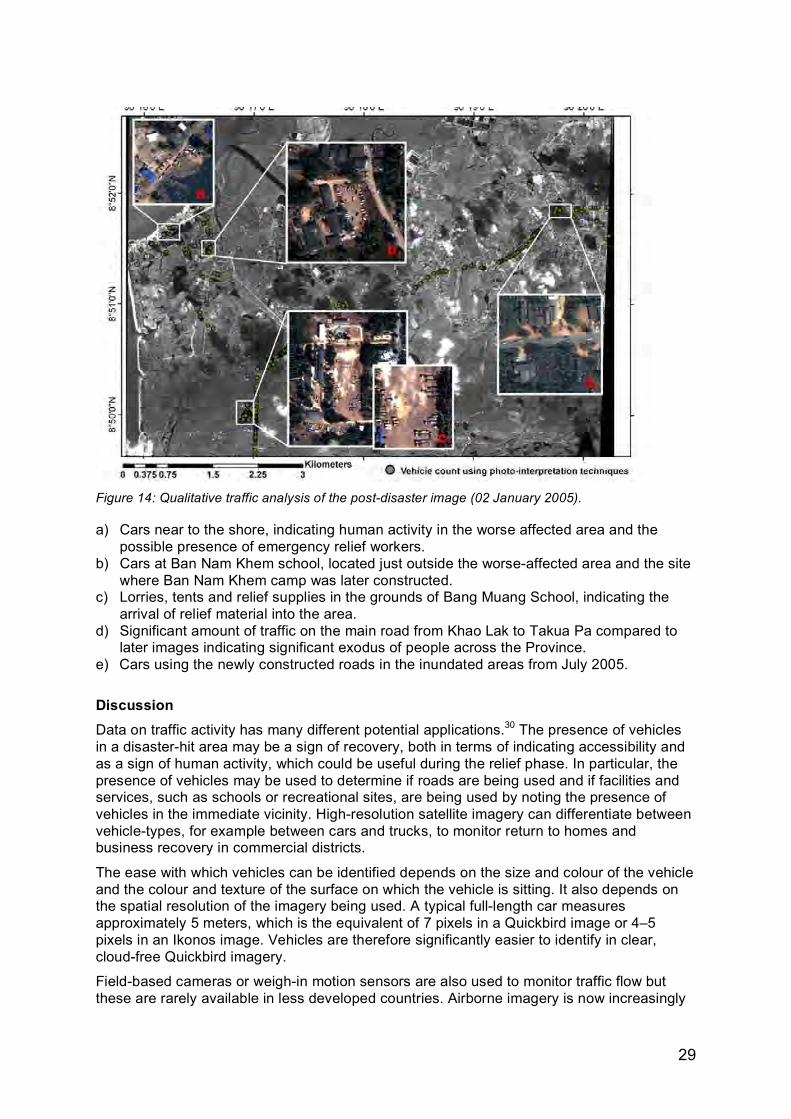
Figure 14: Qualitative traffic analysis of the post-disaster image (02 January 2005).
a) Cars near to the shore, indicating human activity in the worse affected area and the possible presence of emergency relief workers.
b) Cars at Ban Nam Khem school, located just outside the worse-affected area and the site where Ban Nam Khem camp was later constructed.
c) Lorries, tents and relief supplies in the grounds of Bang Muang School, indicating the arrival of relief material into the area.
d) Significant amount of traffic on the main road from Khao Lak to Takua Pa compared to later images indicating significant exodus of people across the Province.
e) Cars using the newly constructed roads in the inundated areas from July 2005.
Discussion Data on traffic activity has many different potential applications.30 The presence of vehicles in a disaster-hit area may be a sign of recovery, both in terms of indicating accessibility and as a sign of human activity, which could be useful during the relief phase. In particular, the presence of vehicles may be used to determine if roads are being used and if facilities and services, such as schools or recreational sites, are being used by noting the presence of vehicles in the immediate vicinity. High-resolution satellite imagery can differentiate between vehicle-types, for example between cars and trucks, to monitor return to homes and business recovery in commercial districts.
The ease with which vehicles can be identified depends on the size and colour of the vehicle and the colour and texture of the surface on which the vehicle is sitting. It also depends on the spatial resolution of the imagery being used. A typical full-length car measures approximately 5 meters, which is the equivalent of 7 pixels in a Quickbird image or 4–5 pixels in an Ikonos image. Vehicles are therefore significantly easier to identify in clear, cloud-free Quickbird imagery.
Field-based cameras or weigh-in motion sensors are also used to monitor traffic flow but these are rarely available in less developed countries. Airborne imagery is now increasingly
30
used to provide a more synoptic view of traffic. One advantage of aerial imagery is that it gives a snapshot of a large geographic area, whilst a camera on the ground can only show vehicle-use on a single road. Vehicle counts may be conducted using manual photo-interpretation techniques, but this is impractical and relatively expensive when there is a large amount of imagery to analyse. However, care must be taken in interpreting traffic activity from a single image, since travel volumes vary with time of day and day of the week.
Monitoring manually is time-consuming and automatic techniques are not yet available. But various approaches are being explored to automatically detect vehicles using Ikonos and Quickbird Imagery, and there is likely to be significant progress in this area.31 32 33 Vehicles are not always easy to identify, especially those not on smooth asphalt road surfaces and buildings, vegetation and shadows may obscure vehicles. Vehicles may also be mistaken for other features, such as boats. Clearly monitoring the presence of vehicles gives snap-shots of one aspect of recovery rather than monitoring traffic activity. Nevertheless, it does allow monitoring of a large area may be the only data available in less developed countries.
Remote Sensing may not be the most reliable or effective method of monitoring traffic activity, but the presence of vehicles in the imagery may be used as a sign of human activity and used to assist other accessibility indicators.
31
Buildings
Rebuilding damaged or collapsed buildings – homes, schools, hospitals, administrative offices, markets and places of work – is another critical factor in the process of recovery. In a similar way that the analysis of the 5 indicators of accessibility began by mapping the transport network, the process of analysing building indicators 6–11 begins by identifying buildings in the pre-disaster satellite image and then subsequent images.
Indicator 4: Removal and construction of buildings. This indicator tracks the construction and removal of buildings by monitoring their presence and absence throughout the recovery process. Two different approaches were applied: a manual method and a semi-automatic method. The first involves manually delineating each building as a single point. The second involves using an algorithm in ArcGIS to identify built areas. Both methods allow change detection maps and statistics to be generated between the intervals of the available satellite imagery. The most appropriate technique will depend on the resources available to the user and the amount of detail that is required.
Method 1: Manual delineation of building points
The amount of time required to for this analysis will depend on the extent of the damage, the number of buildings present, and the density and morphology of the built environment. In Ban Nam Khem, a 2 x 3 Km area with approximately 1,700 buildings, took approximately 4–6 hours to delineate for each image. In Chella Bandi, in Pakistan, because buildings were distributed across 4 km2, it took 30 hours. Experience with satellite imagery is necessary to perform the visual interpretation work accurately, especially to conduct the change detection analysis when one image is compared with the next.
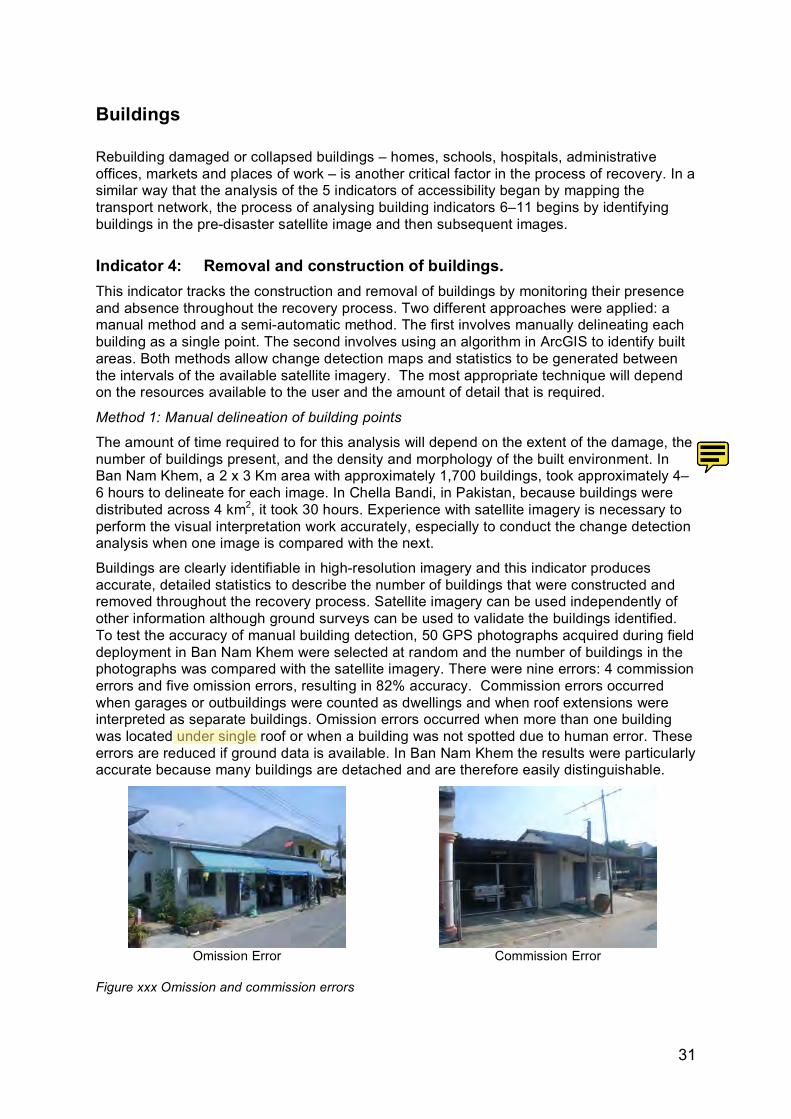
Buildings are clearly identifiable in high-resolution imagery and this indicator produces accurate, detailed statistics to describe the number of buildings that were constructed and removed throughout the recovery process. Satellite imagery can be used independently of other information although ground surveys can be used to validate the buildings identified. To test the accuracy of manual building detection, 50 GPS photographs acquired during field deployment in Ban Nam Khem were selected at random and the number of buildings in the photographs was compared with the satellite imagery. There were nine errors: 4 commission errors and five omission errors, resulting in 82% accuracy. Commission errors occurred when garages or outbuildings were counted as dwellings and when roof extensions were interpreted as separate buildings. Omission errors occurred when more than one building was located under single roof or when a building was not spotted due to human error. These errors are reduced if ground data is available. In Ban Nam Khem the results were particularly accurate because many buildings are detached and are therefore easily distinguishable.
Omission Error Commission Error
Figure xxx Omission and commission errors
Emily So
This comparison is not done for all sections. Actually, in other sections, it first describes the importance of examining the indicator for monitoring recovery, then RS methods, then application to BNK- no time given in other sections
Emily So
32
Building removal, building construction and major levels of damage (e.g. major structural damage and at least partial collapse: EMS Damage States D4 and D5) were all successfully identified in the satellite imagery, but it was not possible to identify minor damage or repairs due to satellite imagery’s vertical angle and its limited spatial resolution.
Method 2: Semi-automatic delineation of urban areas using ArcGIS tool
An ArcGIS tool, the maximum likelihood algorithm, was used to test a semi-automatic method of classifying surfaces to produce maps and statistics of the extent of the built environment and of non-urban land cover for Indicator 12. Selecting suitable training areas in the image and applying the classification algorithm took approximately 1–2 hours per image. The accuracy of this technique and manual detection were compared. Fifty points were randomly selected and, using photographs and video footage, these were manually classified as: urban, bare ground, sparse vegetation, thick vegetation, and water. Accuracy ranged from 50% to 75% (mean: 63%) and may have been affected by cloud, water inundation after the tsunami and other factors. But because the technique relies solely on the spectral information urban, bare ground and sparse vegetation are confused.
Ikonos and Quickbird have only 4 multispectral bands and leads to poor classification of surfaces. WorldView-2 was launched in October 2009, and has eight spectral bands – the four standard bands plus four new bands designed specifically to assist automatic classification. This is likely to allow more accurate classification. Impervious surfaces were most conspicuous immediately after they were constructed. With time roofs weathered and became less prominent in subsequent images. There was more confusion between bare ground and urban in the February 2006 image because of cloud shadow.
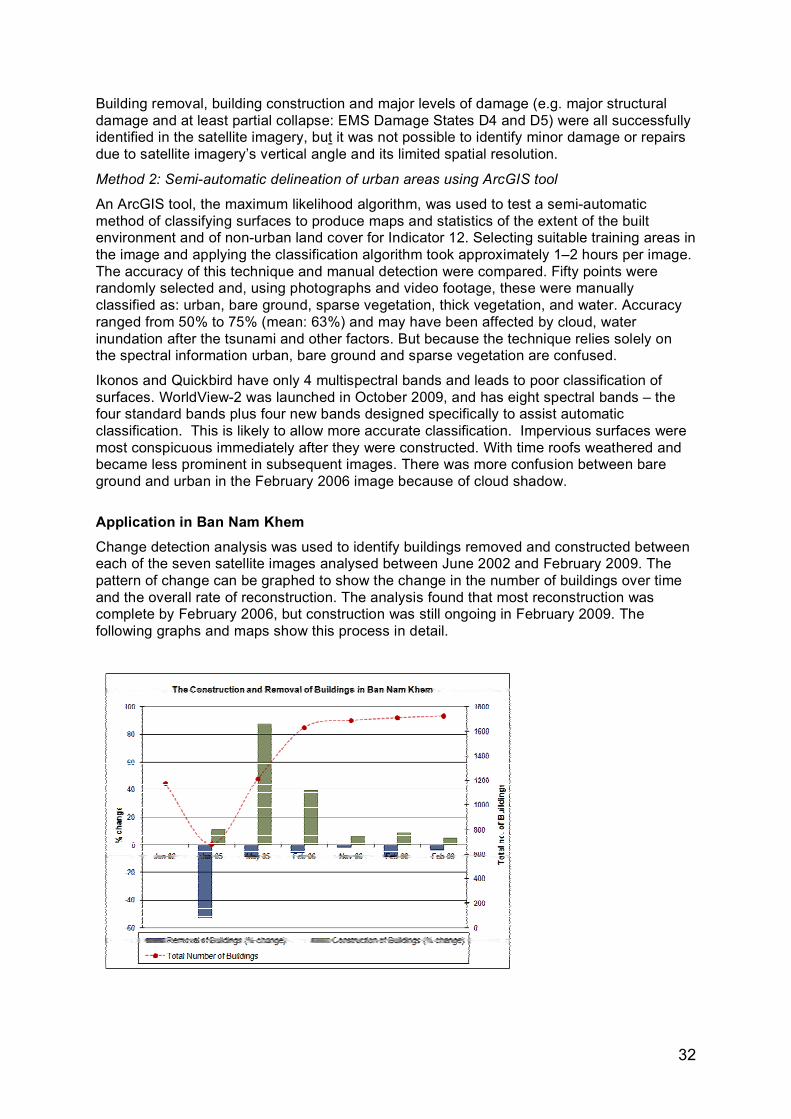
Application in Ban Nam Khem Change detection analysis was used to identify buildings removed and constructed between each of the seven satellite images analysed between June 2002 and February 2009. The pattern of change can be graphed to show the change in the number of buildings over time and the overall rate of reconstruction. The analysis found that most reconstruction was complete by February 2006, but construction was still ongoing in February 2009. The following graphs and maps show this process in detail.
33
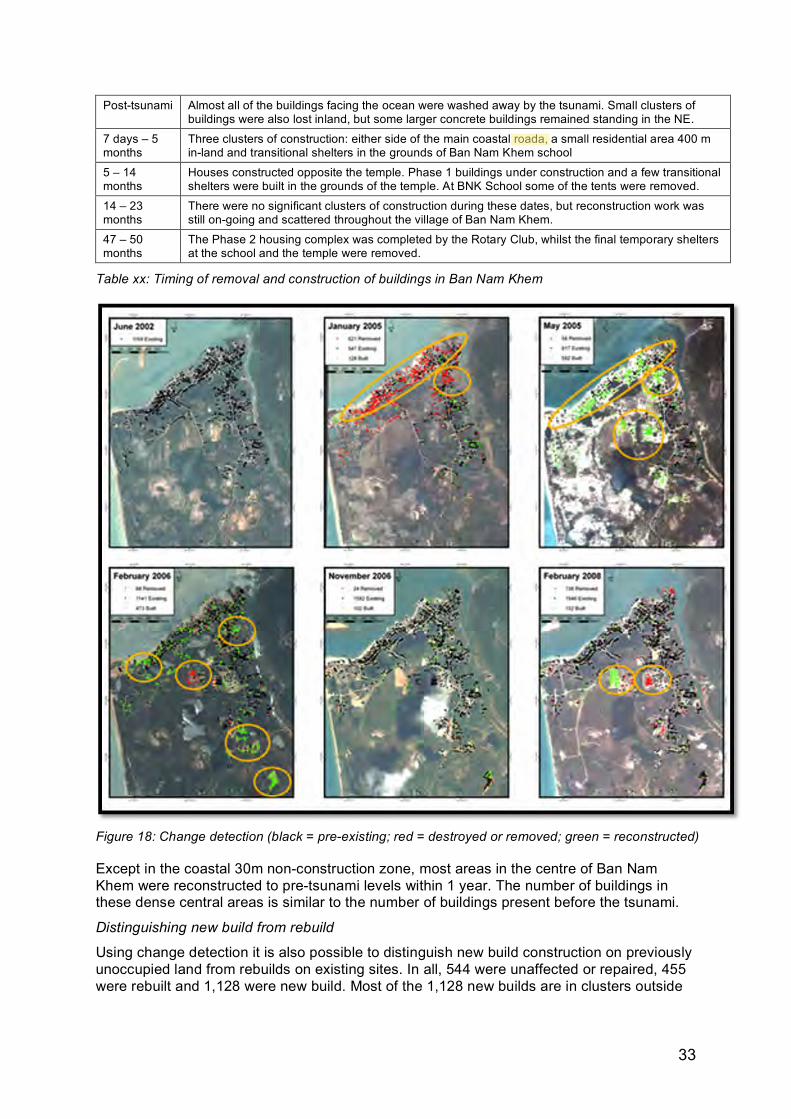
Post-tsunami Almost all of the buildings facing the ocean were washed away by the tsunami. Small clusters of buildings were also lost inland, but some larger concrete buildings remained standing in the NE.
7 days – 5 months
Three clusters of construction: either side of the main coastal roada, a small residential area 400 m in-land and transitional shelters in the grounds of Ban Nam Khem school
5 – 14 months
Houses constructed opposite the temple. Phase 1 buildings under construction and a few transitional shelters were built in the grounds of the temple. At BNK School some of the tents were removed.
14 – 23 months
There were no significant clusters of construction during these dates, but reconstruction work was still on-going and scattered throughout the village of Ban Nam Khem.
47 – 50 months
The Phase 2 housing complex was completed by the Rotary Club, whilst the final temporary shelters at the school and the temple were removed.
Table xx: Timing of removal and construction of buildings in Ban Nam Khem
Figure 18: Change detection (black = pre-existing; red = destroyed or removed; green = reconstructed)
Except in the coastal 30m non-construction zone, most areas in the centre of Ban Nam Khem were reconstructed to pre-tsunami levels within 1 year. The number of buildings in these dense central areas is similar to the number of buildings present before the tsunami.
Distinguishing new build from rebuild
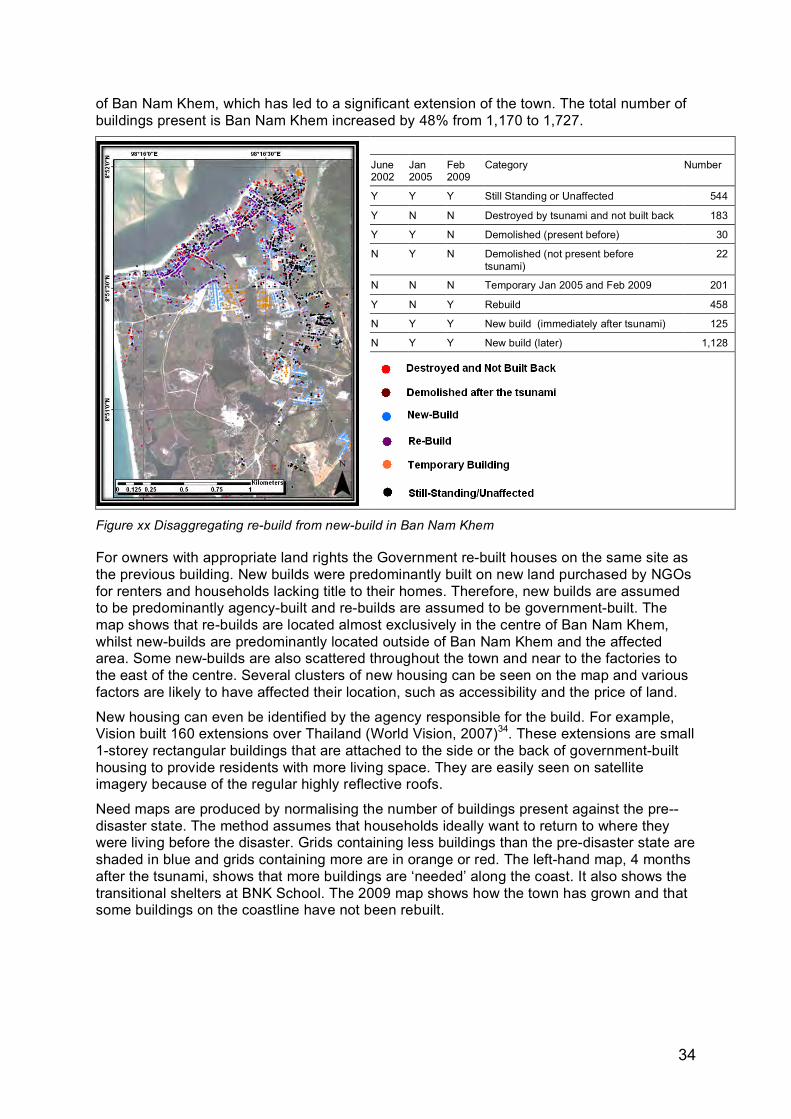
Using change detection it is also possible to distinguish new build construction on previously unoccupied land from rebuilds on existing sites. In all, 544 were unaffected or repaired, 455 were rebuilt and 1,128 were new build. Most of the 1,128 new builds are in clusters outside
Emily So
34
of Ban Nam Khem, which has led to a significant extension of the town. The total number of buildings present is Ban Nam Khem increased by 48% from 1,170 to 1,727.
June 2002
Jan 2005
Feb 2009
Category Number
Y Y Y Still Standing or Unaffected 544
Y N N Destroyed by tsunami and not built back 183
Y Y N Demolished (present before) 30
N Y N Demolished (not present before tsunami)
22
N N N Temporary Jan 2005 and Feb 2009 201
Y N Y Rebuild 458
N Y Y New build (immediately after tsunami) 125
N Y Y New build (later) 1,128
Figure xx Disaggregating re-build from new-build in Ban Nam Khem
For owners with appropriate land rights the Government re-built houses on the same site as the previous building. New builds were predominantly built on new land purchased by NGOs for renters and households lacking title to their homes. Therefore, new builds are assumed to be predominantly agency-built and re-builds are assumed to be government-built. The map shows that re-builds are located almost exclusively in the centre of Ban Nam Khem, whilst new-builds are predominantly located outside of Ban Nam Khem and the affected area. Some new-builds are also scattered throughout the town and near to the factories to the east of the centre. Several clusters of new housing can be seen on the map and various factors are likely to have affected their location, such as accessibility and the price of land.
New housing can even be identified by the agency responsible for the build. For example, Vision built 160 extensions over Thailand (World Vision, 2007)34. These extensions are small 1-storey rectangular buildings that are attached to the side or the back of government-built housing to provide residents with more living space. They are easily seen on satellite imagery because of the regular highly reflective roofs.
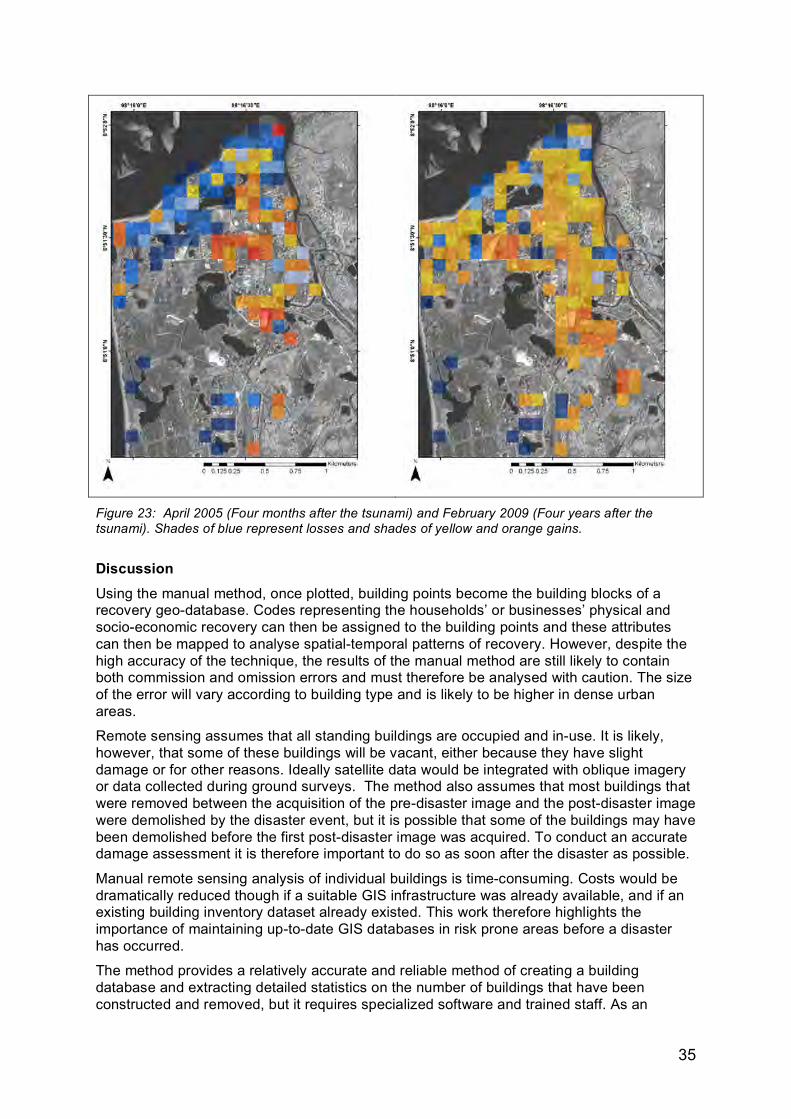
Need maps are produced by normalising the number of buildings present against the pre--disaster state. The method assumes that households ideally want to return to where they were living before the disaster. Grids containing less buildings than the pre-disaster state are shaded in blue and grids containing more are in orange or red. The left-hand map, 4 months after the tsunami, shows that more buildings are ‘needed’ along the coast. It also shows the transitional shelters at BNK School. The 2009 map shows how the town has grown and that some buildings on the coastline have not been rebuilt.
35
Figure 23: April 2005 (Four months after the tsunami) and February 2009 (Four years after the tsunami). Shades of blue represent losses and shades of yellow and orange gains.
Discussion Using the manual method, once plotted, building points become the building blocks of a recovery geo-database. Codes representing the households’ or businesses’ physical and socio-economic recovery can then be assigned to the building points and these attributes can then be mapped to analyse spatial-temporal patterns of recovery. However, despite the high accuracy of the technique, the results of the manual method are still likely to contain both commission and omission errors and must therefore be analysed with caution. The size of the error will vary according to building type and is likely to be higher in dense urban areas.
Remote sensing assumes that all standing buildings are occupied and in-use. It is likely, however, that some of these buildings will be vacant, either because they have slight damage or for other reasons. Ideally satellite data would be integrated with oblique imagery or data collected during ground surveys. The method also assumes that most buildings that were removed between the acquisition of the pre-disaster image and the post-disaster image were demolished by the disaster event, but it is possible that some of the buildings may have been demolished before the first post-disaster image was acquired. To conduct an accurate damage assessment it is therefore important to do so as soon after the disaster as possible.
Manual remote sensing analysis of individual buildings is time-consuming. Costs would be dramatically reduced though if a suitable GIS infrastructure was already available, and if an existing building inventory dataset already existed. This work therefore highlights the importance of maintaining up-to-date GIS databases in risk prone areas before a disaster has occurred.
The method provides a relatively accurate and reliable method of creating a building database and extracting detailed statistics on the number of buildings that have been constructed and removed, but it requires specialized software and trained staff. As an
36
alternative, ground surveys, although just as time-consuming, could be used to obtain more accurate data on the number of buildings and information about the quality of the building construction and repair work, and the use of the buildings, information that is difficult to acquire with remote sensing alone.
Using the semi-automatic method accurate and reliable maps and statistics can be produced to describe the change in urban area. The method is a lot less time-consuming than manually delineating individual building points and can be applied quickly across a large geographical extent. However, errors using Ikonos and Quickbird images with only 4 spectral bands are probably unacceptably high. New 8 band imagery is likely to reduce errors significantly. This kind of semi-automatic classification does not identify individual buildings; it distinguishes urban area from other land cover types. This is a lot less detailed and meaningful than the ‘Total Number of Buildings’. The technique is still fairly demanding in terms of staff time to select suitable training areas and apply the classification algorithm.
Ground surveys can be conducted to collect data about buildings present. This will be more expensive and time-consuming than remote sensing but would provide more accurate data. In addition, ground surveys can be used to obtain information on occupancy and use and the quality of the building construction and repair work, information that is difficult to obtain with remote sensing alone. A major advantage of using ground survey over remote sensing is therefore this ability to collect additional data.
Remote sensing might most usefully combined with a ground survey sample. The sample must accurately represent all the reconstructed building types and all of the executing agencies involved in the recovery process. Typically a 10% sample might prove sufficient in most instances.
Key informants were not asked questions about housing, because it was decided that it was most appropriate to ask households these questions. In hindsight, key informants from agencies constructing housing could have provided useful information on the number and type of homes.
The household survey can provide information about who provided the housing, to what extent households were involved in the process and how satisfied rresidenst are with their new homes. In Ban Nam Khem, for example, most of the rebuilding was done by NGOs and most of the interviewed households were happy with the speed and quality of the recovery of their community, though those who were unhappy mentioned the small sizes of the reconstructed houses and expressed concern that there was an uneven distribution of aid and reconstruction.
Although unable to provide data on the number of buildings reconstructed the household survey can be used to estimate how long reconstruction took. Households were asked when they moved into tents, shelters and permanent homes. In Ban Nam Khem, on average, households surveyed took 10 months to move into shelters and 22 months to move into permanent housing. Remote sensing and official statistics showed that most temporary shelters were constructed within 5 months and most housing construction had been completed within 24 months of the tsunami.
There is close agreement between the findings from the household survey and remote sensing for when families moved into permanent housing. Importantly, the household survey results show that it cannot be assumed that all households were re-housed at the same time. For example in Ban Nam Khem, most reconstruction work was completed by February 2006 but the last surveyed household did not move into their home until May 2009.
There is a bigger discrepancy between the household survey and remote sensing in timing of the move to temporary shelters. This might have occurred for a variety of reasons. The question may have been miss-interpreted by some respondents or respondents may have rounded their answers to the nearest year. Because of this discrepancy the results of the
Emily So
Emily So
Emily So
Emily So
Emily So
building use?
Emily So
qualitative data
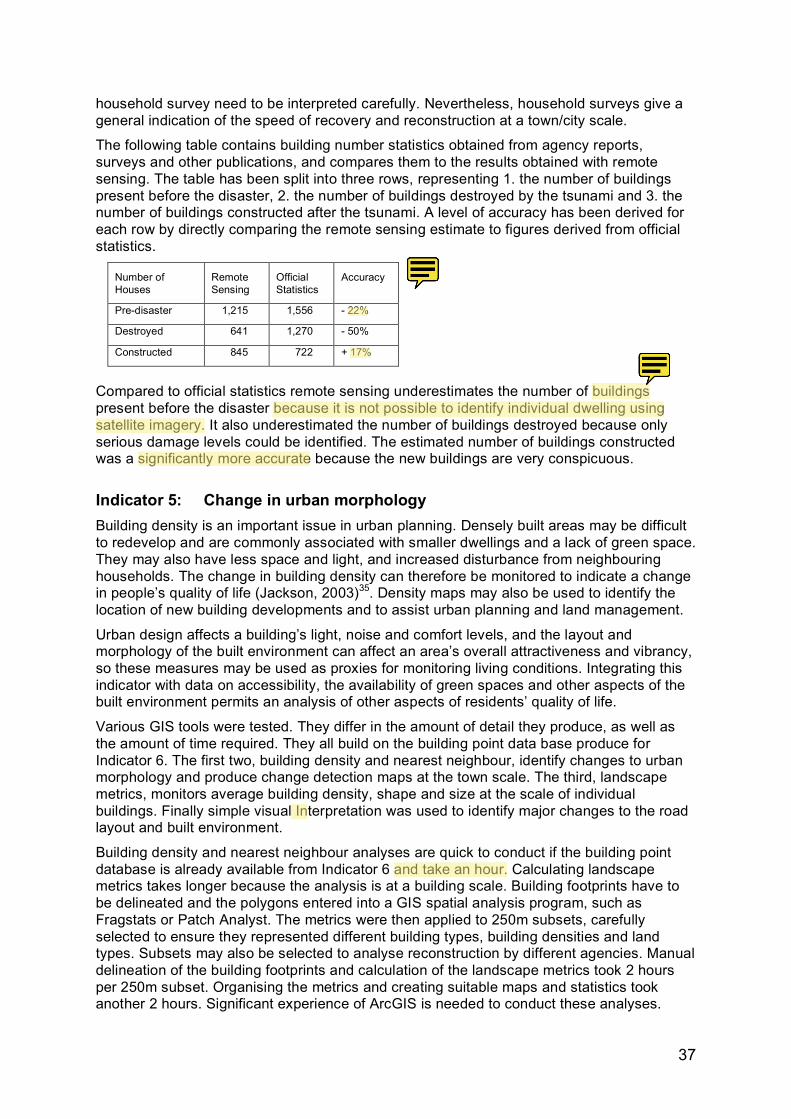
37
household survey need to be interpreted carefully. Nevertheless, household surveys give a general indication of the speed of recovery and reconstruction at a town/city scale.
The following table contains building number statistics obtained from agency reports, surveys and other publications, and compares them to the results obtained with remote sensing. The table has been split into three rows, representing 1. the number of buildings present before the disaster, 2. the number of buildings destroyed by the tsunami and 3. the number of buildings constructed after the tsunami. A level of accuracy has been derived for each row by directly comparing the remote sensing estimate to figures derived from official statistics.
Number of Houses
Remote Sensing
Official Statistics
Accuracy
Pre-disaster 1,215 1,556 - 22%
Destroyed 641 1,270 - 50%
Constructed 845 722 + 17%
Compared to official statistics remote sensing underestimates the number of buildings present before the disaster because it is not possible to identify individual dwelling using satellite imagery. It also underestimated the number of buildings destroyed because only serious damage levels could be identified. The estimated number of buildings constructed was a significantly more accurate because the new buildings are very conspicuous.
Indicator 5: Change in urban morphology Building density is an important issue in urban planning. Densely built areas may be difficult to redevelop and are commonly associated with smaller dwellings and a lack of green space. They may also have less space and light, and increased disturbance from neighbouring households. The change in building density can therefore be monitored to indicate a change in people’s quality of life (Jackson, 2003)35. Density maps may also be used to identify the location of new building developments and to assist urban planning and land management.
Urban design affects a building’s light, noise and comfort levels, and the layout and morphology of the built environment can affect an area’s overall attractiveness and vibrancy, so these measures may be used as proxies for monitoring living conditions. Integrating this indicator with data on accessibility, the availability of green spaces and other aspects of the built environment permits an analysis of other aspects of residents’ quality of life.
Various GIS tools were tested. They differ in the amount of detail they produce, as well as the amount of time required. They all build on the building point data base produce for Indicator 6. The first two, building density and nearest neighbour, identify changes to urban morphology and produce change detection maps at the town scale. The third, landscape metrics, monitors average building density, shape and size at the scale of individual buildings. Finally simple visual Interpretation was used to identify major changes to the road layout and built environment.
Building density and nearest neighbour analyses are quick to conduct if the building point database is already available from Indicator 6 and take an hour. Calculating landscape metrics takes longer because the analysis is at a building scale. Building footprints have to be delineated and the polygons entered into a GIS spatial analysis program, such as Fragstats or Patch Analyst. The metrics were then applied to 250m subsets, carefully selected to ensure they represented different building types, building densities and land types. Subsets may also be selected to analyse reconstruction by different agencies. Manual delineation of the building footprints and calculation of the landscape metrics took 2 hours per 250m subset. Organising the metrics and creating suitable maps and statistics took another 2 hours. Significant experience of ArcGIS is needed to conduct these analyses.
Emily So
Emily So
Emily So
Emily So
Emily So
Emily So
Emily So
Emily So
is our point that a building may have many dwellings in it?
Emily So
it's only 5%... how can we be significantly more accurate??
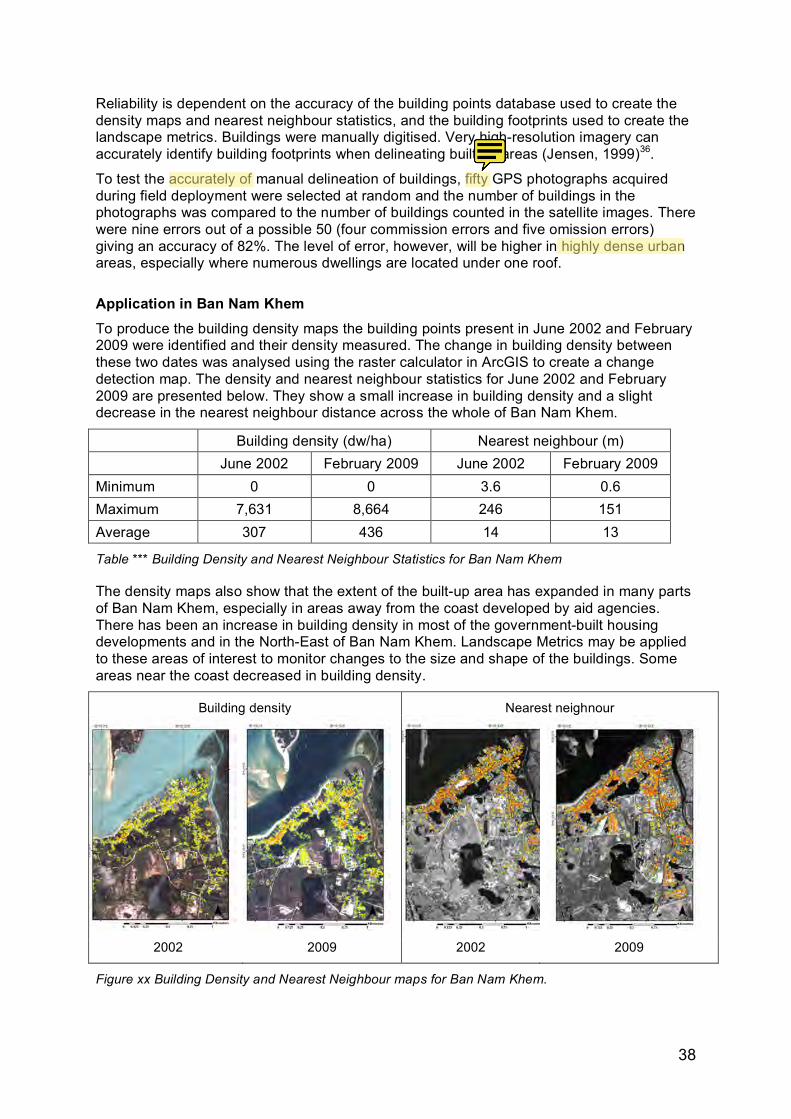
38
Reliability is dependent on the accuracy of the building points database used to create the density maps and nearest neighbour statistics, and the building footprints used to create the landscape metrics. Buildings were manually digitised. Very high-resolution imagery can accurately identify building footprints when delineating built-up areas (Jensen, 1999)36.
To test the accurately of manual delineation of buildings, fifty GPS photographs acquired during field deployment were selected at random and the number of buildings in the photographs was compared to the number of buildings counted in the satellite images. There were nine errors out of a possible 50 (four commission errors and five omission errors) giving an accuracy of 82%. The level of error, however, will be higher in highly dense urban areas, especially where numerous dwellings are located under one roof.
Application in Ban Nam Khem To produce the building density maps the building points present in June 2002 and February 2009 were identified and their density measured. The change in building density between these two dates was analysed using the raster calculator in ArcGIS to create a change detection map. The density and nearest neighbour statistics for June 2002 and February 2009 are presented below. They show a small increase in building density and a slight decrease in the nearest neighbour distance across the whole of Ban Nam Khem.
Building density (dw/ha) Nearest neighbour (m) June 2002 February 2009 June 2002 February 2009 Minimum 0 0 3.6 0.6 Maximum 7,631 8,664 246 151 Average 307 436 14 13
Table *** Building Density and Nearest Neighbour Statistics for Ban Nam Khem
The density maps also show that the extent of the built-up area has expanded in many parts of Ban Nam Khem, especially in areas away from the coast developed by aid agencies. There has been an increase in building density in most of the government-built housing developments and in the North-East of Ban Nam Khem. Landscape Metrics may be applied to these areas of interest to monitor changes to the size and shape of the buildings. Some areas near the coast decreased in building density.
Building density Nearest neighnour
2002 2009 2002 2009
Figure xx Building Density and Nearest Neighbour maps for Ban Nam Khem.
Emily So
Emily So
Emily So
Emily So
use 50?
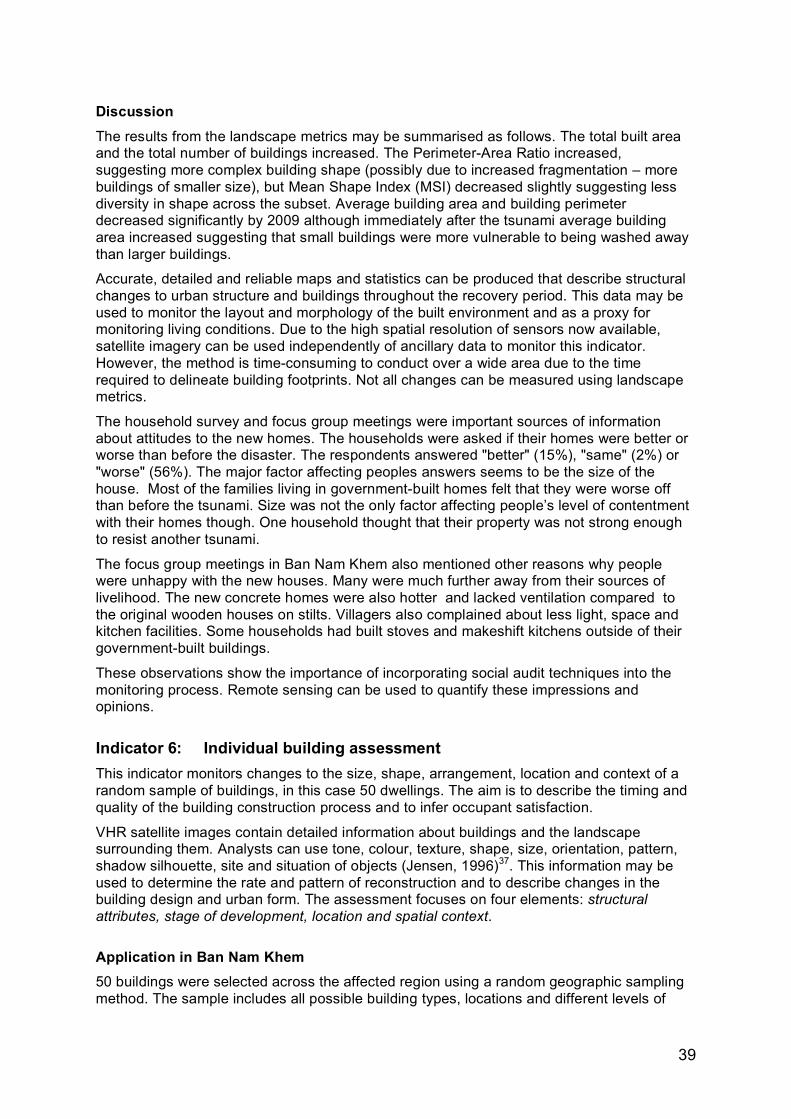
39
Discussion The results from the landscape metrics may be summarised as follows. The total built area and the total number of buildings increased. The Perimeter-Area Ratio increased, suggesting more complex building shape (possibly due to increased fragmentation – more buildings of smaller size), but Mean Shape Index (MSI) decreased slightly suggesting less diversity in shape across the subset. Average building area and building perimeter decreased significantly by 2009 although immediately after the tsunami average building area increased suggesting that small buildings were more vulnerable to being washed away than larger buildings.
Accurate, detailed and reliable maps and statistics can be produced that describe structural changes to urban structure and buildings throughout the recovery period. This data may be used to monitor the layout and morphology of the built environment and as a proxy for monitoring living conditions. Due to the high spatial resolution of sensors now available, satellite imagery can be used independently of ancillary data to monitor this indicator. However, the method is time-consuming to conduct over a wide area due to the time required to delineate building footprints. Not all changes can be measured using landscape metrics.
The household survey and focus group meetings were important sources of information about attitudes to the new homes. The households were asked if their homes were better or worse than before the disaster. The respondents answered "better" (15%), "same" (2%) or "worse" (56%). The major factor affecting peoples answers seems to be the size of the house. Most of the families living in government-built homes felt that they were worse off than before the tsunami. Size was not the only factor affecting people’s level of contentment with their homes though. One household thought that their property was not strong enough to resist another tsunami.
The focus group meetings in Ban Nam Khem also mentioned other reasons why people were unhappy with the new houses. Many were much further away from their sources of livelihood. The new concrete homes were also hotter and lacked ventilation compared to the original wooden houses on stilts. Villagers also complained about less light, space and kitchen facilities. Some households had built stoves and makeshift kitchens outside of their government-built buildings.
These observations show the importance of incorporating social audit techniques into the monitoring process. Remote sensing can be used to quantify these impressions and opinions.
Indicator 6: Individual building assessment This indicator monitors changes to the size, shape, arrangement, location and context of a random sample of buildings, in this case 50 dwellings. The aim is to describe the timing and quality of the building construction process and to infer occupant satisfaction.
VHR satellite images contain detailed information about buildings and the landscape surrounding them. Analysts can use tone, colour, texture, shape, size, orientation, pattern, shadow silhouette, site and situation of objects (Jensen, 1996)37. This information may be used to determine the rate and pattern of reconstruction and to describe changes in the building design and urban form. The assessment focuses on four elements: structural attributes, stage of development, location and spatial context.
Application in Ban Nam Khem 50 buildings were selected across the affected region using a random geographic sampling method. The sample includes all possible building types, locations and different levels of
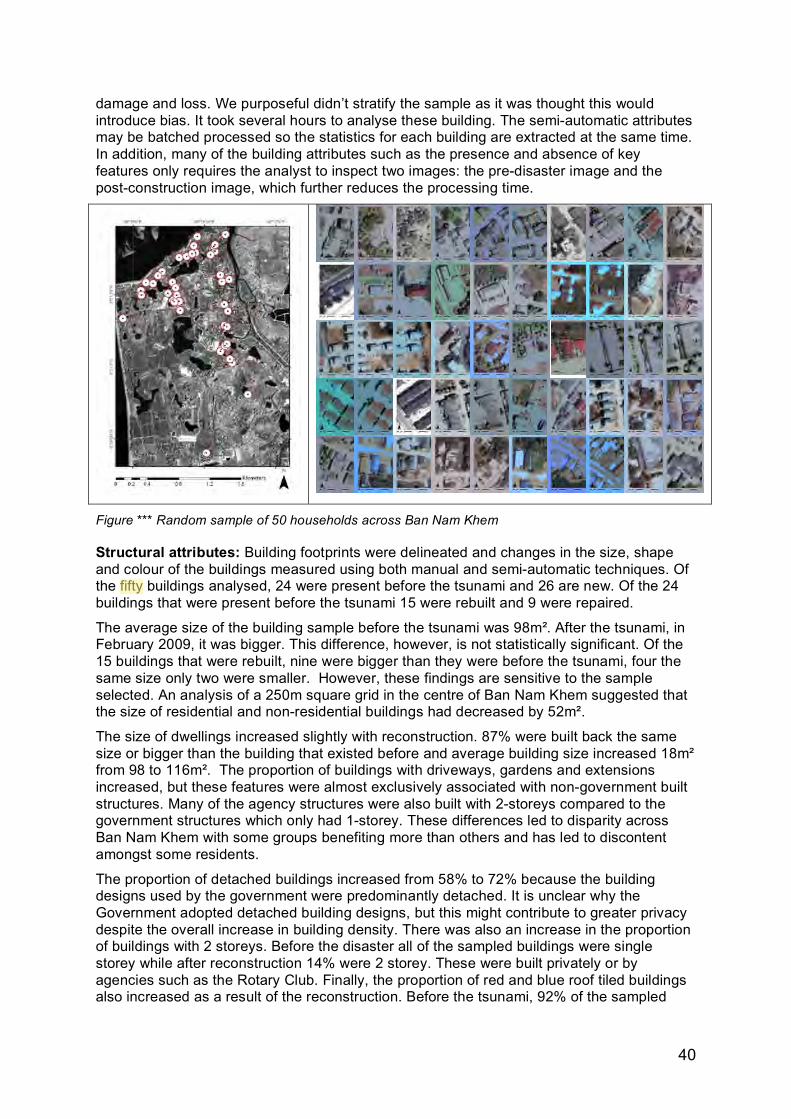
40
damage and loss. We purposeful didn’t stratify the sample as it was thought this would introduce bias. It took several hours to analyse these building. The semi-automatic attributes may be batched processed so the statistics for each building are extracted at the same time. In addition, many of the building attributes such as the presence and absence of key features only requires the analyst to inspect two images: the pre-disaster image and the post-construction image, which further reduces the processing time.
Figure *** Random sample of 50 households across Ban Nam Khem
Structural attributes: Building footprints were delineated and changes in the size, shape and colour of the buildings measured using both manual and semi-automatic techniques. Of the fifty buildings analysed, 24 were present before the tsunami and 26 are new. Of the 24 buildings that were present before the tsunami 15 were rebuilt and 9 were repaired.
The average size of the building sample before the tsunami was 98m!. After the tsunami, in February 2009, it was bigger. This difference, however, is not statistically significant. Of the 15 buildings that were rebuilt, nine were bigger than they were before the tsunami, four the same size only two were smaller. However, these findings are sensitive to the sample selected. An analysis of a 250m square grid in the centre of Ban Nam Khem suggested that the size of residential and non-residential buildings had decreased by 52m!.
The size of dwellings increased slightly with reconstruction. 87% were built back the same size or bigger than the building that existed before and average building size increased 18m! from 98 to 116m!. The proportion of buildings with driveways, gardens and extensions increased, but these features were almost exclusively associated with non-government built structures. Many of the agency structures were also built with 2-storeys compared to the government structures which only had 1-storey. These differences led to disparity across Ban Nam Khem with some groups benefiting more than others and has led to discontent amongst some residents.
The proportion of detached buildings increased from 58% to 72% because the building designs used by the government were predominantly detached. It is unclear why the Government adopted detached building designs, but this might contribute to greater privacy despite the overall increase in building density. There was also an increase in the proportion of buildings with 2 storeys. Before the disaster all of the sampled buildings were single storey while after reconstruction 14% were 2 storey. These were built privately or by agencies such as the Rotary Club. Finally, the proportion of red and blue roof tiled buildings also increased as a result of the reconstruction. Before the tsunami, 92% of the sampled
Emily So
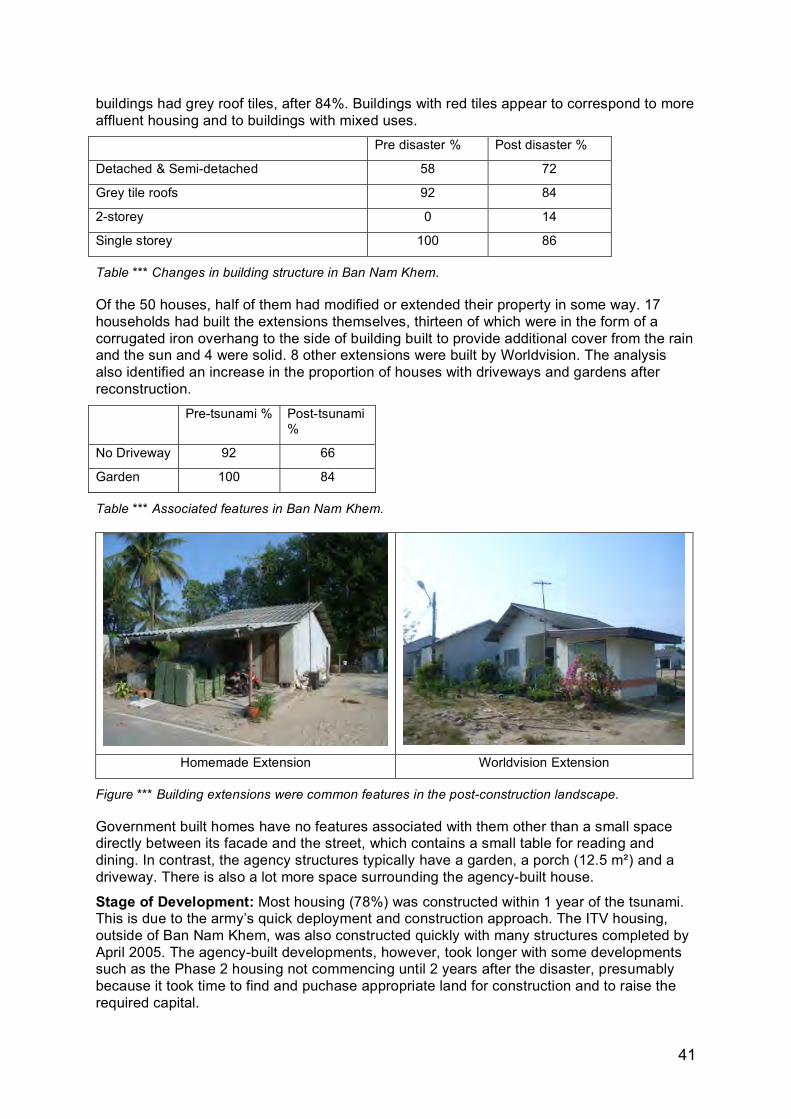
41
buildings had grey roof tiles, after 84%. Buildings with red tiles appear to correspond to more affluent housing and to buildings with mixed uses.
Pre disaster % Post disaster %
Detached & Semi-detached 58 72
Grey tile roofs 92 84
2-storey 0 14
Single storey 100 86
Table *** Changes in building structure in Ban Nam Khem.
Of the 50 houses, half of them had modified or extended their property in some way. 17 households had built the extensions themselves, thirteen of which were in the form of a corrugated iron overhang to the side of building built to provide additional cover from the rain and the sun and 4 were solid. 8 other extensions were built by Worldvision. The analysis also identified an increase in the proportion of houses with driveways and gardens after reconstruction.
Pre-tsunami % Post-tsunami %
No Driveway 92 66
Garden 100 84
Table *** Associated features in Ban Nam Khem.
Homemade Extension Worldvision Extension
Figure *** Building extensions were common features in the post-construction landscape.
Government built homes have no features associated with them other than a small space directly between its facade and the street, which contains a small table for reading and dining. In contrast, the agency structures typically have a garden, a porch (12.5 m!) and a driveway. There is also a lot more space surrounding the agency-built house.
Stage of Development: Most housing (78%) was constructed within 1 year of the tsunami. This is due to the army’s quick deployment and construction approach. The ITV housing, outside of Ban Nam Khem, was also constructed quickly with many structures completed by April 2005. The agency-built developments, however, took longer with some developments such as the Phase 2 housing not commencing until 2 years after the disaster, presumably because it took time to find and puchase appropriate land for construction and to raise the required capital.
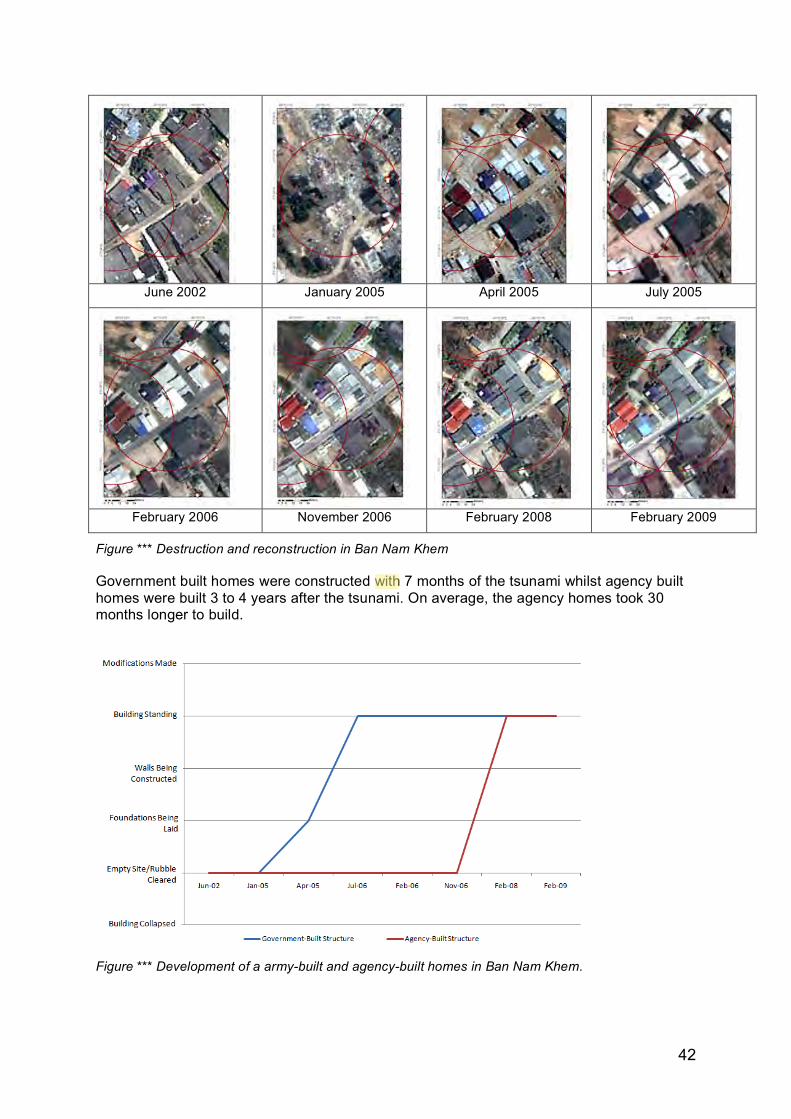
42
June 2002 January 2005 April 2005 July 2005
February 2006 November 2006 February 2008 February 2009
Figure *** Destruction and reconstruction in Ban Nam Khem
Government built homes were constructed with 7 months of the tsunami whilst agency built homes were built 3 to 4 years after the tsunami. On average, the agency homes took 30 months longer to build.
Figure *** Development of a army-built and agency-built homes in Ban Nam Khem.
Emily So
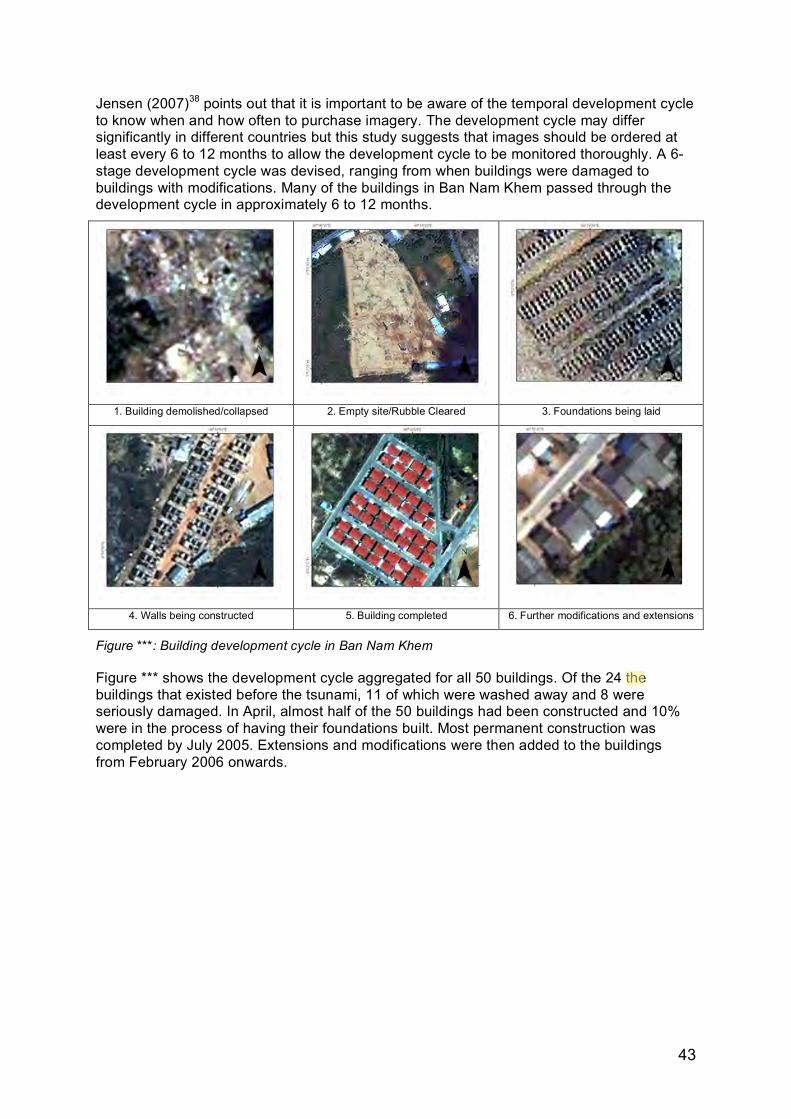
43
Jensen (2007)38 points out that it is important to be aware of the temporal development cycle to know when and how often to purchase imagery. The development cycle may differ significantly in different countries but this study suggests that images should be ordered at least every 6 to 12 months to allow the development cycle to be monitored thoroughly. A 6-stage development cycle was devised, ranging from when buildings were damaged to buildings with modifications. Many of the buildings in Ban Nam Khem passed through the development cycle in approximately 6 to 12 months.
1. Building demolished/collapsed 2. Empty site/Rubble Cleared 3. Foundations being laid
4. Walls being constructed 5. Building completed 6. Further modifications and extensions
Figure ***: Building development cycle in Ban Nam Khem
Figure *** shows the development cycle aggregated for all 50 buildings. Of the 24 the buildings that existed before the tsunami, 11 of which were washed away and 8 were seriously damaged. In April, almost half of the 50 buildings had been constructed and 10% were in the process of having their foundations built. Most permanent construction was completed by July 2005. Extensions and modifications were then added to the buildings from February 2006 onwards.
Emily So
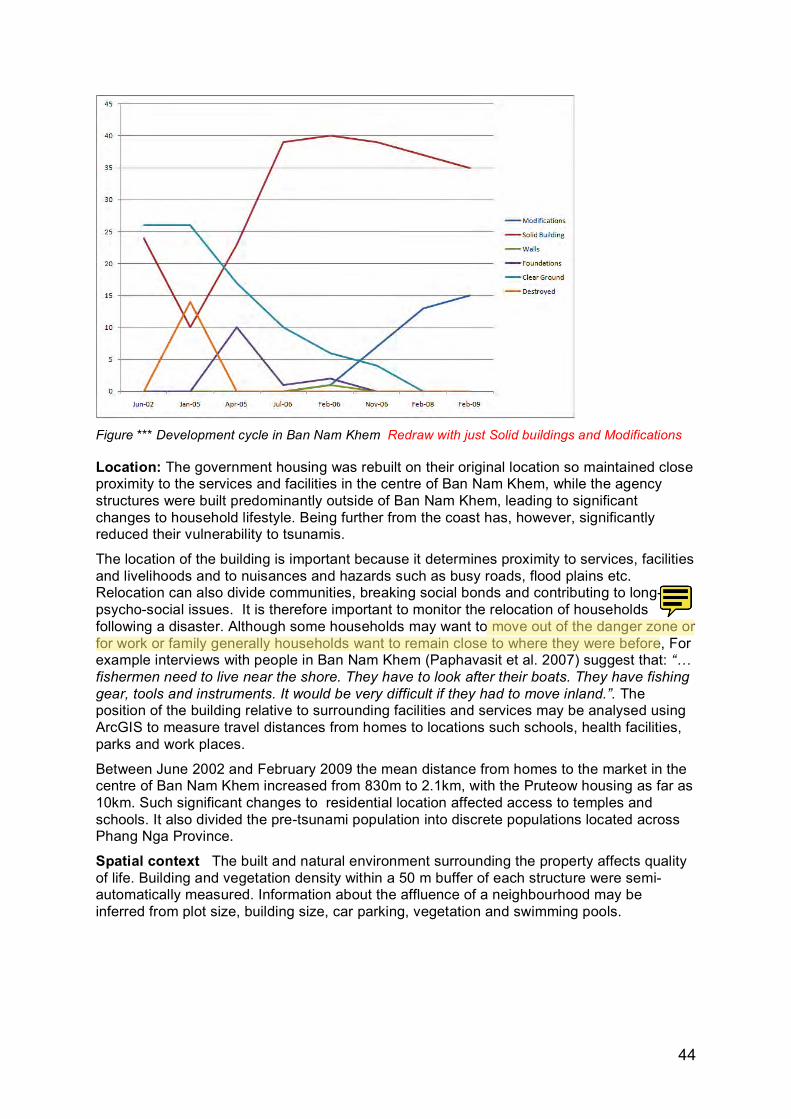
44
Figure *** Development cycle in Ban Nam Khem Redraw with just Solid buildings and Modifications
Location: The government housing was rebuilt on their original location so maintained close proximity to the services and facilities in the centre of Ban Nam Khem, while the agency structures were built predominantly outside of Ban Nam Khem, leading to significant changes to household lifestyle. Being further from the coast has, however, significantly reduced their vulnerability to tsunamis.
The location of the building is important because it determines proximity to services, facilities and livelihoods and to nuisances and hazards such as busy roads, flood plains etc. Relocation can also divide communities, breaking social bonds and contributing to long-term psycho-social issues. It is therefore important to monitor the relocation of households following a disaster. Although some households may want to move out of the danger zone or for work or family generally households want to remain close to where they were before, For example interviews with people in Ban Nam Khem (Paphavasit et al. 2007) suggest that: “… fishermen need to live near the shore. They have to look after their boats. They have fishing gear, tools and instruments. It would be very difficult if they had to move inland.”. The position of the building relative to surrounding facilities and services may be analysed using ArcGIS to measure travel distances from homes to locations such schools, health facilities, parks and work places.
Between June 2002 and February 2009 the mean distance from homes to the market in the centre of Ban Nam Khem increased from 830m to 2.1km, with the Pruteow housing as far as 10km. Such significant changes to residential location affected access to temples and schools. It also divided the pre-tsunami population into discrete populations located across Phang Nga Province.
Spatial context The built and natural environment surrounding the property affects quality of life. Building and vegetation density within a 50 m buffer of each structure were semi-automatically measured. Information about the affluence of a neighbourhood may be inferred from plot size, building size, car parking, vegetation and swimming pools.
Emily So
Emily So
started singing the Top Gun theme tune to myself! ;p
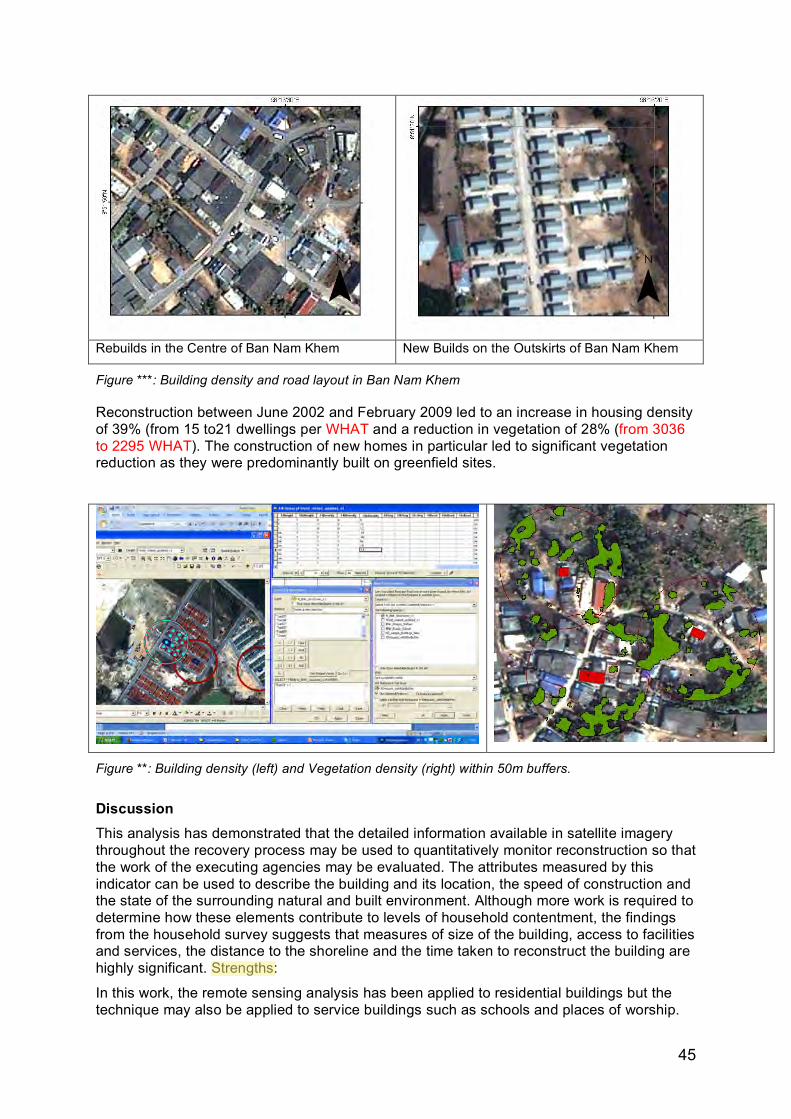
45
Rebuilds in the Centre of Ban Nam Khem New Builds on the Outskirts of Ban Nam Khem
Figure ***: Building density and road layout in Ban Nam Khem
Reconstruction between June 2002 and February 2009 led to an increase in housing density of 39% (from 15 to21 dwellings per WHAT and a reduction in vegetation of 28% (from 3036 to 2295 WHAT). The construction of new homes in particular led to significant vegetation reduction as they were predominantly built on greenfield sites.
Figure **: Building density (left) and Vegetation density (right) within 50m buffers.
Discussion This analysis has demonstrated that the detailed information available in satellite imagery throughout the recovery process may be used to quantitatively monitor reconstruction so that the work of the executing agencies may be evaluated. The attributes measured by this indicator can be used to describe the building and its location, the speed of construction and the state of the surrounding natural and built environment. Although more work is required to determine how these elements contribute to levels of household contentment, the findings from the household survey suggests that measures of size of the building, access to facilities and services, the distance to the shoreline and the time taken to reconstruct the building are highly significant. Strengths:
In this work, the remote sensing analysis has been applied to residential buildings but the technique may also be applied to service buildings such as schools and places of worship.
Emily So

46
Using appropriate sampling methods, this indicator may be conducted relatively quickly. This indicator also re-uses several data layers created for other indicators which speeds up the processing time. For example, road networks (Indicator 1), building points (Indicator 6) and vegetation maps (Indicator ***) were all originally produced at town/city scale and are reused for this indicator. Most of the semi-automatic processes can also be applied to all of the buildings at once by batch processing, which further reduces the processing time.
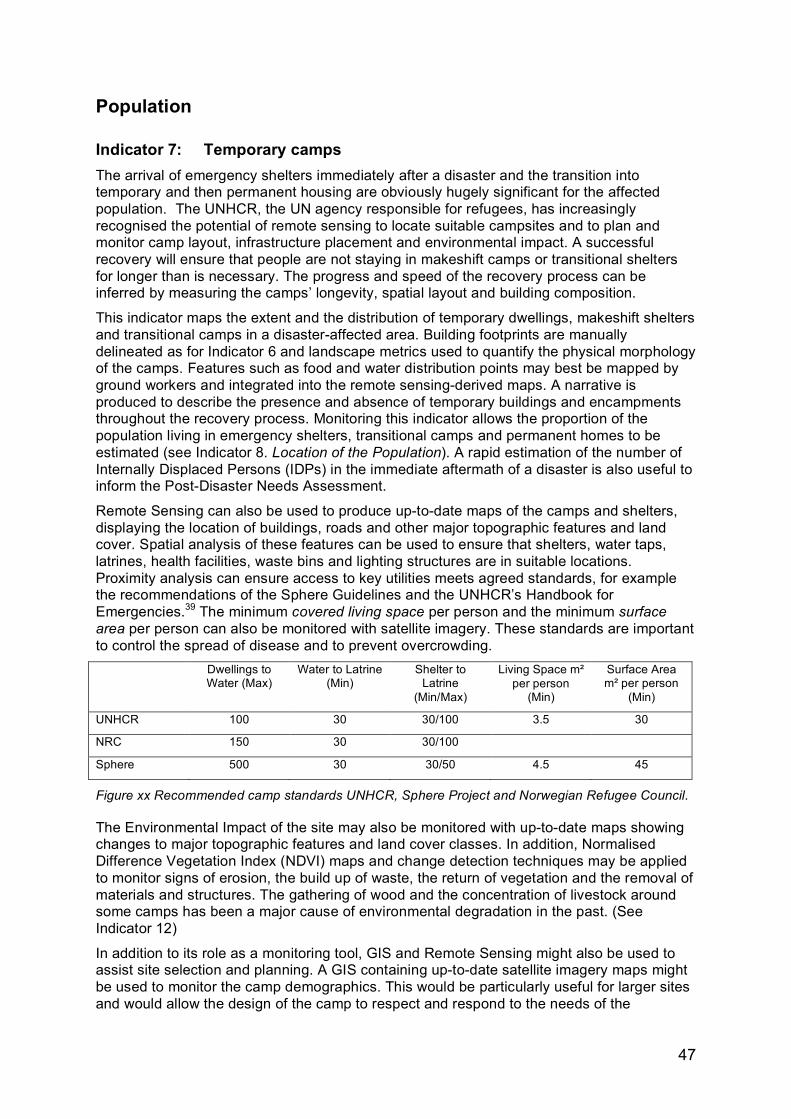
47
Population
Indicator 7: Temporary camps The arrival of emergency shelters immediately after a disaster and the transition into temporary and then permanent housing are obviously hugely significant for the affected population. The UNHCR, the UN agency responsible for refugees, has increasingly recognised the potential of remote sensing to locate suitable campsites and to plan and monitor camp layout, infrastructure placement and environmental impact. A successful recovery will ensure that people are not staying in makeshift camps or transitional shelters for longer than is necessary. The progress and speed of the recovery process can be inferred by measuring the camps’ longevity, spatial layout and building composition.
This indicator maps the extent and the distribution of temporary dwellings, makeshift shelters and transitional camps in a disaster-affected area. Building footprints are manually delineated as for Indicator 6 and landscape metrics used to quantify the physical morphology of the camps. Features such as food and water distribution points may best be mapped by ground workers and integrated into the remote sensing-derived maps. A narrative is produced to describe the presence and absence of temporary buildings and encampments throughout the recovery process. Monitoring this indicator allows the proportion of the population living in emergency shelters, transitional camps and permanent homes to be estimated (see Indicator 8. Location of the Population). A rapid estimation of the number of Internally Displaced Persons (IDPs) in the immediate aftermath of a disaster is also useful to inform the Post-Disaster Needs Assessment.
Remote Sensing can also be used to produce up-to-date maps of the camps and shelters, displaying the location of buildings, roads and other major topographic features and land cover. Spatial analysis of these features can be used to ensure that shelters, water taps, latrines, health facilities, waste bins and lighting structures are in suitable locations. Proximity analysis can ensure access to key utilities meets agreed standards, for example the recommendations of the Sphere Guidelines and the UNHCR’s Handbook for Emergencies.39 The minimum covered living space per person and the minimum surface area per person can also be monitored with satellite imagery. These standards are important to control the spread of disease and to prevent overcrowding.
Dwellings to Water (Max)
Water to Latrine (Min)
Shelter to Latrine
(Min/Max)
Living Space m! per person
(Min)
Surface Area m! per person
(Min)
UNHCR 100 30 30/100 3.5 30
NRC 150 30 30/100
Sphere 500 30 30/50 4.5 45
Figure xx Recommended camp standards UNHCR, Sphere Project and Norwegian Refugee Council.
The Environmental Impact of the site may also be monitored with up-to-date maps showing changes to major topographic features and land cover classes. In addition, Normalised Difference Vegetation Index (NDVI) maps and change detection techniques may be applied to monitor signs of erosion, the build up of waste, the return of vegetation and the removal of materials and structures. The gathering of wood and the concentration of livestock around some camps has been a major cause of environmental degradation in the past. (See Indicator 12)
In addition to its role as a monitoring tool, GIS and Remote Sensing might also be used to assist site selection and planning. A GIS containing up-to-date satellite imagery maps might be used to monitor the camp demographics. This would be particularly useful for larger sites and would allow the design of the camp to respect and respond to the needs of the
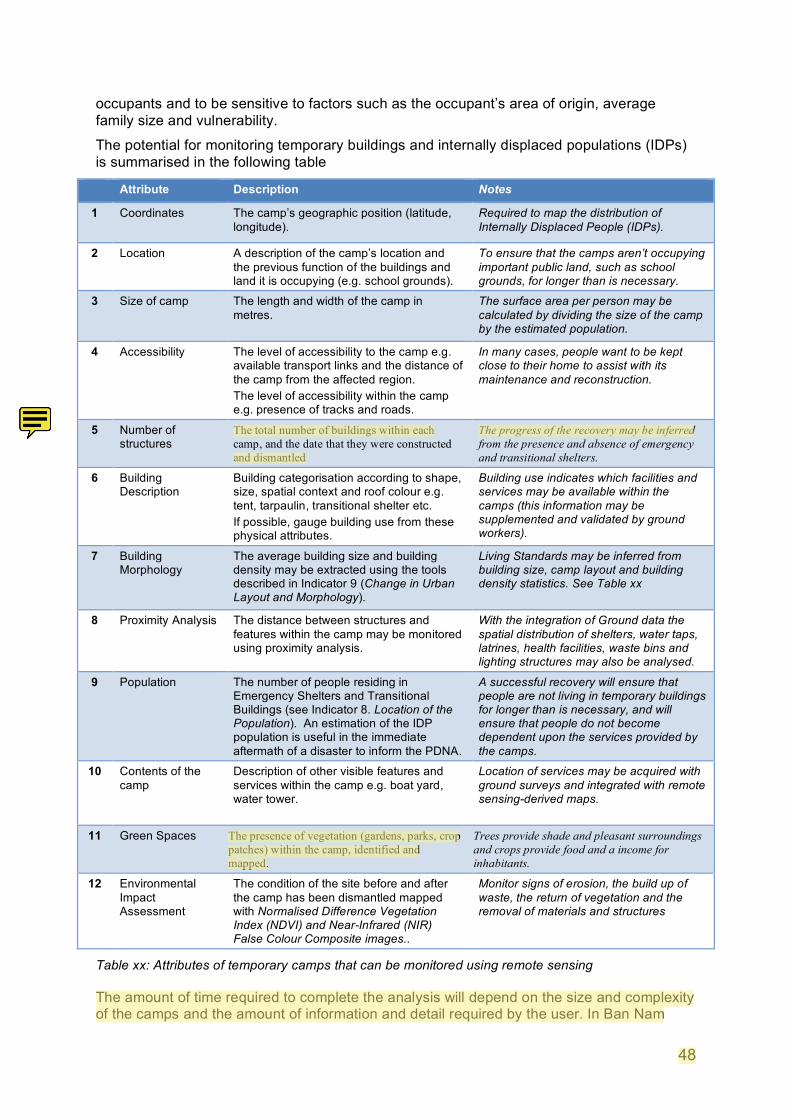
48
occupants and to be sensitive to factors such as the occupant’s area of origin, average family size and vulnerability.
The potential for monitoring temporary buildings and internally displaced populations (IDPs) is summarised in the following table
Attribute Description Notes
1 Coordinates The camp’s geographic position (latitude, longitude).
Required to map the distribution of Internally Displaced People (IDPs).
2 Location A description of the camp’s location and the previous function of the buildings and land it is occupying (e.g. school grounds).
To ensure that the camps aren’t occupying important public land, such as school grounds, for longer than is necessary.
3 Size of camp The length and width of the camp in metres.
The surface area per person may be calculated by dividing the size of the camp by the estimated population.
4 Accessibility The level of accessibility to the camp e.g. available transport links and the distance of the camp from the affected region. The level of accessibility within the camp e.g. presence of tracks and roads.
In many cases, people want to be kept close to their home to assist with its maintenance and reconstruction.
5 Number of structures
The total number of buildings within each camp, and the date that they were constructed and dismantled
The progress of the recovery may be inferred from the presence and absence of emergency and transitional shelters.
6 Building Description
Building categorisation according to shape, size, spatial context and roof colour e.g. tent, tarpaulin, transitional shelter etc. If possible, gauge building use from these physical attributes.
Building use indicates which facilities and services may be available within the camps (this information may be supplemented and validated by ground workers).
7 Building Morphology
The average building size and building density may be extracted using the tools described in Indicator 9 (Change in Urban Layout and Morphology).
Living Standards may be inferred from building size, camp layout and building density statistics. See Table xx
8 Proximity Analysis The distance between structures and features within the camp may be monitored using proximity analysis.
With the integration of Ground data the spatial distribution of shelters, water taps, latrines, health facilities, waste bins and lighting structures may also be analysed.
9 Population The number of people residing in Emergency Shelters and Transitional Buildings (see Indicator 8. Location of the Population). An estimation of the IDP population is useful in the immediate aftermath of a disaster to inform the PDNA.
A successful recovery will ensure that people are not living in temporary buildings for longer than is necessary, and will ensure that people do not become dependent upon the services provided by the camps.
10 Contents of the camp
Description of other visible features and services within the camp e.g. boat yard, water tower.
Location of services may be acquired with ground surveys and integrated with remote sensing-derived maps.
11 Green Spaces The presence of vegetation (gardens, parks, crop patches) within the camp, identified and mapped.
Trees provide shade and pleasant surroundings and crops provide food and a income for inhabitants.
12 Environmental Impact Assessment
The condition of the site before and after the camp has been dismantled mapped with Normalised Difference Vegetation Index (NDVI) and Near-Infrared (NIR) False Colour Composite images..
Monitor signs of erosion, the build up of waste, the return of vegetation and the removal of materials and structures
Table xx: Attributes of temporary camps that can be monitored using remote sensing
The amount of time required to complete the analysis will depend on the size and complexity of the camps and the amount of information and detail required by the user. In Ban Nam
Emily So
Emily So
Emily So
Emily So
Font
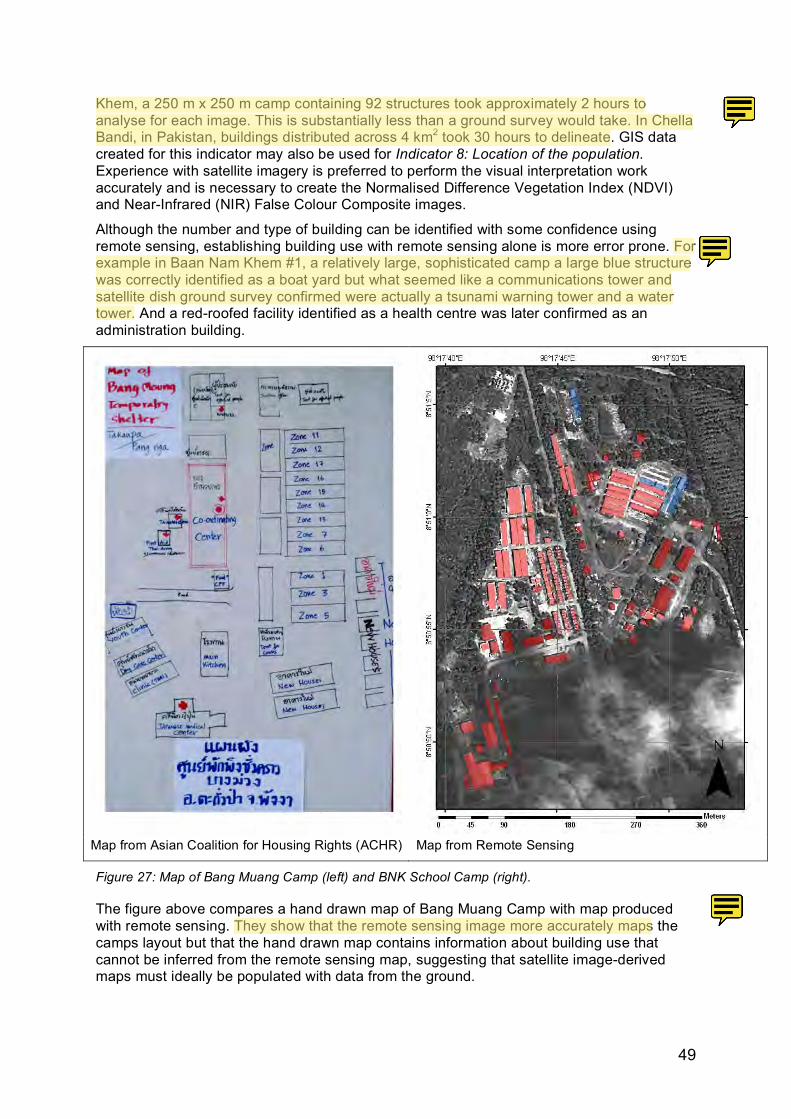
49
Khem, a 250 m x 250 m camp containing 92 structures took approximately 2 hours to analyse for each image. This is substantially less than a ground survey would take. In Chella Bandi, in Pakistan, buildings distributed across 4 km2 took 30 hours to delineate. GIS data created for this indicator may also be used for Indicator 8: Location of the population. Experience with satellite imagery is preferred to perform the visual interpretation work accurately and is necessary to create the Normalised Difference Vegetation Index (NDVI) and Near-Infrared (NIR) False Colour Composite images.
Although the number and type of building can be identified with some confidence using remote sensing, establishing building use with remote sensing alone is more error prone. For example in Baan Nam Khem #1, a relatively large, sophisticated camp a large blue structure was correctly identified as a boat yard but what seemed like a communications tower and satellite dish ground survey confirmed were actually a tsunami warning tower and a water tower. And a red-roofed facility identified as a health centre was later confirmed as an administration building.
Map from Asian Coalition for Housing Rights (ACHR) Map from Remote Sensing
Figure 27: Map of Bang Muang Camp (left) and BNK School Camp (right).
The figure above compares a hand drawn map of Bang Muang Camp with map produced with remote sensing. They show that the remote sensing image more accurately maps the camps layout but that the hand drawn map contains information about building use that cannot be inferred from the remote sensing map, suggesting that satellite image-derived maps must ideally be populated with data from the ground.
Emily So
Emily So
Emily So
Emily So
Emily So May 19, 2010 11:52 AM
Emily So
Rewrite?
Emily So
Mmmm... because you are looking at the real thing, perhaps?? ;)
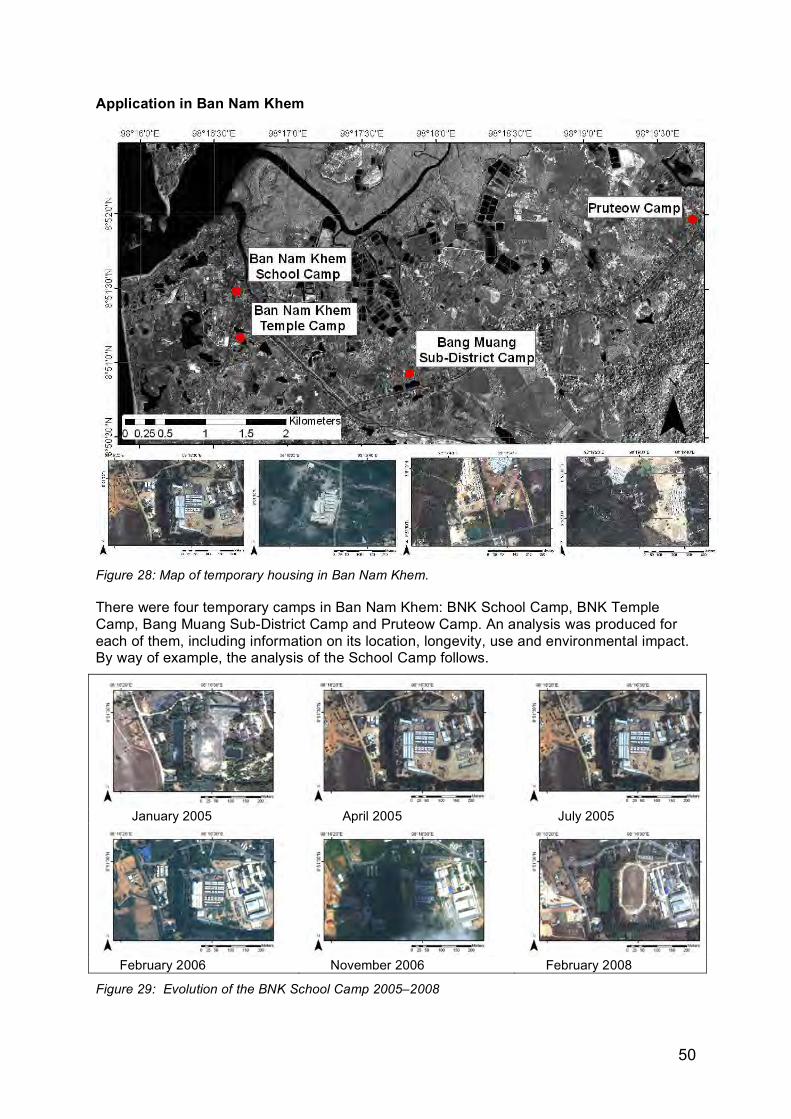
50
Application in Ban Nam Khem
Figure 28: Map of temporary housing in Ban Nam Khem.
There were four temporary camps in Ban Nam Khem: BNK School Camp, BNK Temple Camp, Bang Muang Sub-District Camp and Pruteow Camp. An analysis was produced for each of them, including information on its location, longevity, use and environmental impact. By way of example, the analysis of the School Camp follows.
January 2005 April 2005 July 2005
February 2006 November 2006 February 2008
Figure 29: Evolution of the BNK School Camp 2005–2008
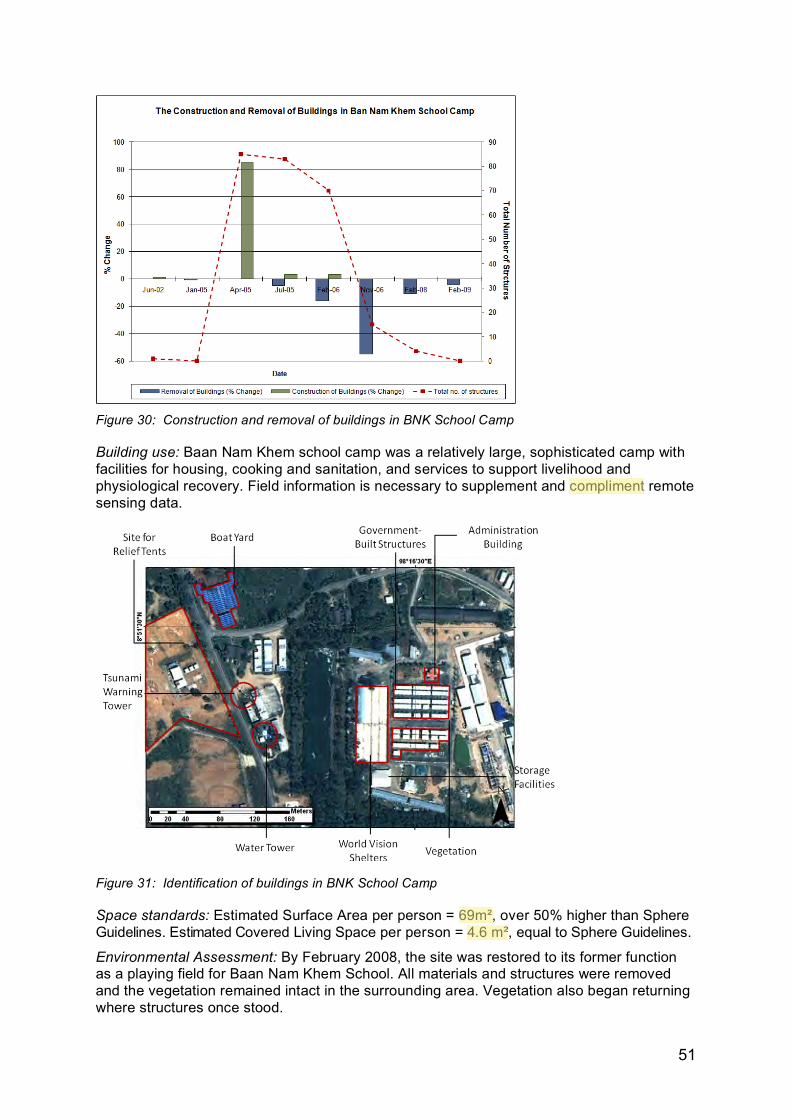
51
Figure 30: Construction and removal of buildings in BNK School Camp
Building use: Baan Nam Khem school camp was a relatively large, sophisticated camp with facilities for housing, cooking and sanitation, and services to support livelihood and physiological recovery. Field information is necessary to supplement and compliment remote sensing data.
Figure 31: Identification of buildings in BNK School Camp
Space standards: Estimated Surface Area per person = 69m!, over 50% higher than Sphere Guidelines. Estimated Covered Living Space per person = 4.6 m!, equal to Sphere Guidelines.
Environmental Assessment: By February 2008, the site was restored to its former function as a playing field for Baan Nam Khem School. All materials and structures were removed and the vegetation remained intact in the surrounding area. Vegetation also began returning where structures once stood.
Emily So
Emily So
Emily So
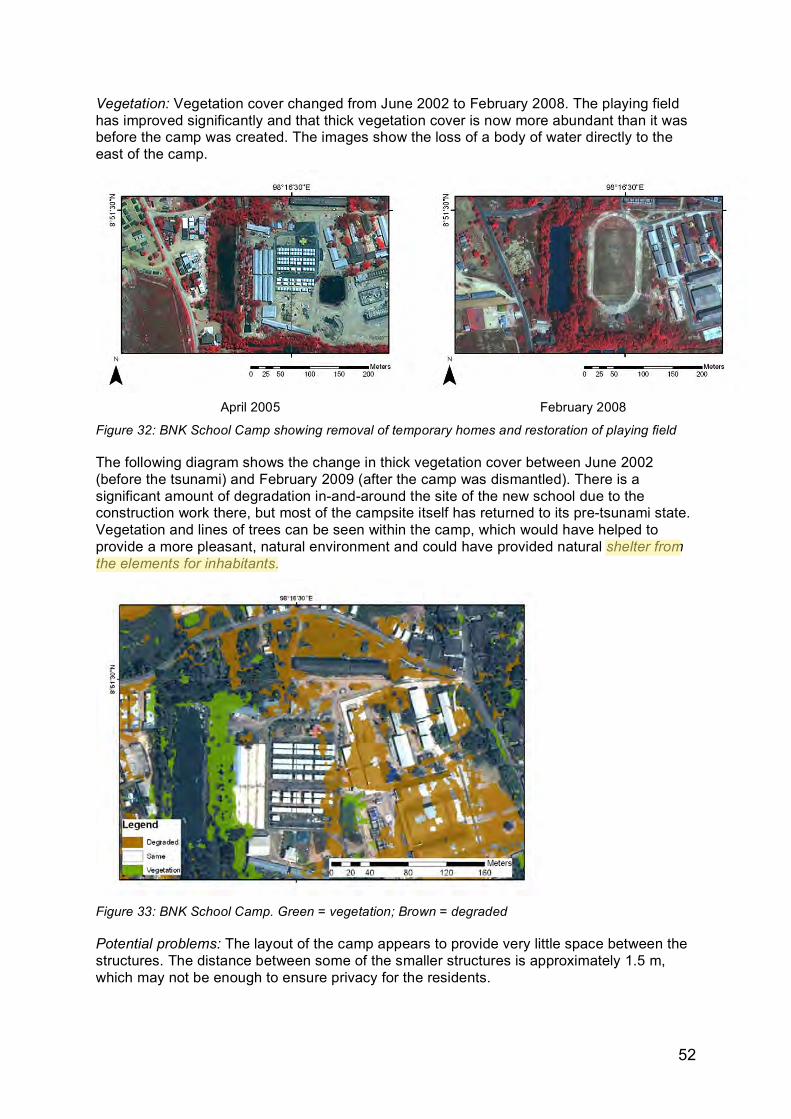
52
Vegetation: Vegetation cover changed from June 2002 to February 2008. The playing field has improved significantly and that thick vegetation cover is now more abundant than it was before the camp was created. The images show the loss of a body of water directly to the east of the camp.
April 2005 February 2008
Figure 32: BNK School Camp showing removal of temporary homes and restoration of playing field
The following diagram shows the change in thick vegetation cover between June 2002 (before the tsunami) and February 2009 (after the camp was dismantled). There is a significant amount of degradation in-and-around the site of the new school due to the construction work there, but most of the campsite itself has returned to its pre-tsunami state. Vegetation and lines of trees can be seen within the camp, which would have helped to provide a more pleasant, natural environment and could have provided natural shelter from the elements for inhabitants.
Figure 33: BNK School Camp. Green = vegetation; Brown = degraded
Potential problems: The layout of the camp appears to provide very little space between the structures. The distance between some of the smaller structures is approximately 1.5 m, which may not be enough to ensure privacy for the residents.
Emily So
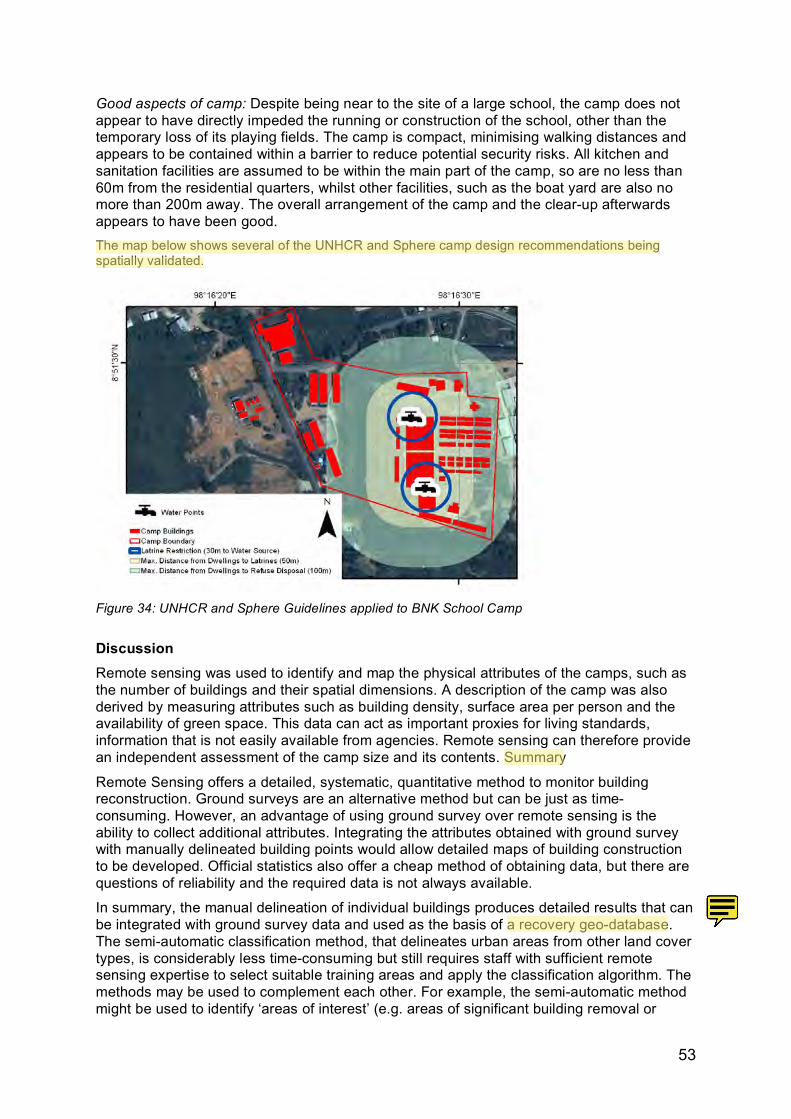
53
Good aspects of camp: Despite being near to the site of a large school, the camp does not appear to have directly impeded the running or construction of the school, other than the temporary loss of its playing fields. The camp is compact, minimising walking distances and appears to be contained within a barrier to reduce potential security risks. All kitchen and sanitation facilities are assumed to be within the main part of the camp, so are no less than 60m from the residential quarters, whilst other facilities, such as the boat yard are also no more than 200m away. The overall arrangement of the camp and the clear-up afterwards appears to have been good. The map below shows several of the UNHCR and Sphere camp design recommendations being spatially validated.
Figure 34: UNHCR and Sphere Guidelines applied to BNK School Camp
Discussion Remote sensing was used to identify and map the physical attributes of the camps, such as the number of buildings and their spatial dimensions. A description of the camp was also derived by measuring attributes such as building density, surface area per person and the availability of green space. This data can act as important proxies for living standards, information that is not easily available from agencies. Remote sensing can therefore provide an independent assessment of the camp size and its contents. Summary
Remote Sensing offers a detailed, systematic, quantitative method to monitor building reconstruction. Ground surveys are an alternative method but can be just as time-consuming. However, an advantage of using ground survey over remote sensing is the ability to collect additional attributes. Integrating the attributes obtained with ground survey with manually delineated building points would allow detailed maps of building construction to be developed. Official statistics also offer a cheap method of obtaining data, but there are questions of reliability and the required data is not always available.
In summary, the manual delineation of individual buildings produces detailed results that can be integrated with ground survey data and used as the basis of a recovery geo-database. The semi-automatic classification method, that delineates urban areas from other land cover types, is considerably less time-consuming but still requires staff with sufficient remote sensing expertise to select suitable training areas and apply the classification algorithm. The methods may be used to complement each other. For example, the semi-automatic method might be used to identify ‘areas of interest’ (e.g. areas of significant building removal or
Emily So
Emily So
Emily So
Emily So
first time this is mentioned. Expand/ delete
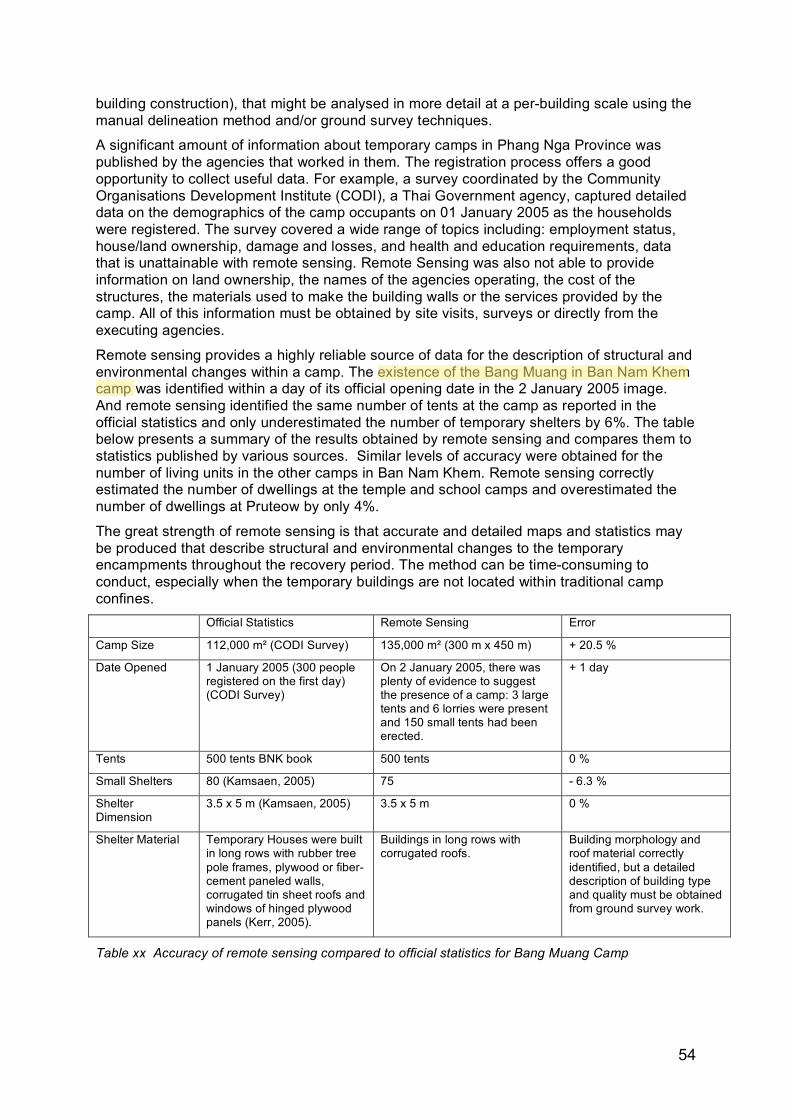
54
building construction), that might be analysed in more detail at a per-building scale using the manual delineation method and/or ground survey techniques.
A significant amount of information about temporary camps in Phang Nga Province was published by the agencies that worked in them. The registration process offers a good opportunity to collect useful data. For example, a survey coordinated by the Community Organisations Development Institute (CODI), a Thai Government agency, captured detailed data on the demographics of the camp occupants on 01 January 2005 as the households were registered. The survey covered a wide range of topics including: employment status, house/land ownership, damage and losses, and health and education requirements, data that is unattainable with remote sensing. Remote Sensing was also not able to provide information on land ownership, the names of the agencies operating, the cost of the structures, the materials used to make the building walls or the services provided by the camp. All of this information must be obtained by site visits, surveys or directly from the executing agencies.
Remote sensing provides a highly reliable source of data for the description of structural and environmental changes within a camp. The existence of the Bang Muang in Ban Nam Khem camp was identified within a day of its official opening date in the 2 January 2005 image. And remote sensing identified the same number of tents at the camp as reported in the official statistics and only underestimated the number of temporary shelters by 6%. The table below presents a summary of the results obtained by remote sensing and compares them to statistics published by various sources. Similar levels of accuracy were obtained for the number of living units in the other camps in Ban Nam Khem. Remote sensing correctly estimated the number of dwellings at the temple and school camps and overestimated the number of dwellings at Pruteow by only 4%.
The great strength of remote sensing is that accurate and detailed maps and statistics may be produced that describe structural and environmental changes to the temporary encampments throughout the recovery period. The method can be time-consuming to conduct, especially when the temporary buildings are not located within traditional camp confines. Official Statistics Remote Sensing Error
Camp Size 112,000 m! (CODI Survey) 135,000 m! (300 m x 450 m) + 20.5 %
Date Opened 1 January 2005 (300 people registered on the first day) (CODI Survey)
On 2 January 2005, there was plenty of evidence to suggest the presence of a camp: 3 large tents and 6 lorries were present and 150 small tents had been erected.
+ 1 day
Tents 500 tents BNK book 500 tents 0 %
Small Shelters 80 (Kamsaen, 2005) 75 - 6.3 %
Shelter Dimension
3.5 x 5 m (Kamsaen, 2005) 3.5 x 5 m 0 %
Shelter Material Temporary Houses were built in long rows with rubber tree pole frames, plywood or fiber-cement paneled walls, corrugated tin sheet roofs and windows of hinged plywood panels (Kerr, 2005).
Buildings in long rows with corrugated roofs.
Building morphology and roof material correctly identified, but a detailed description of building type and quality must be obtained from ground survey work.
Table xx Accuracy of remote sensing compared to official statistics for Bang Muang Camp
Emily So
Emily So
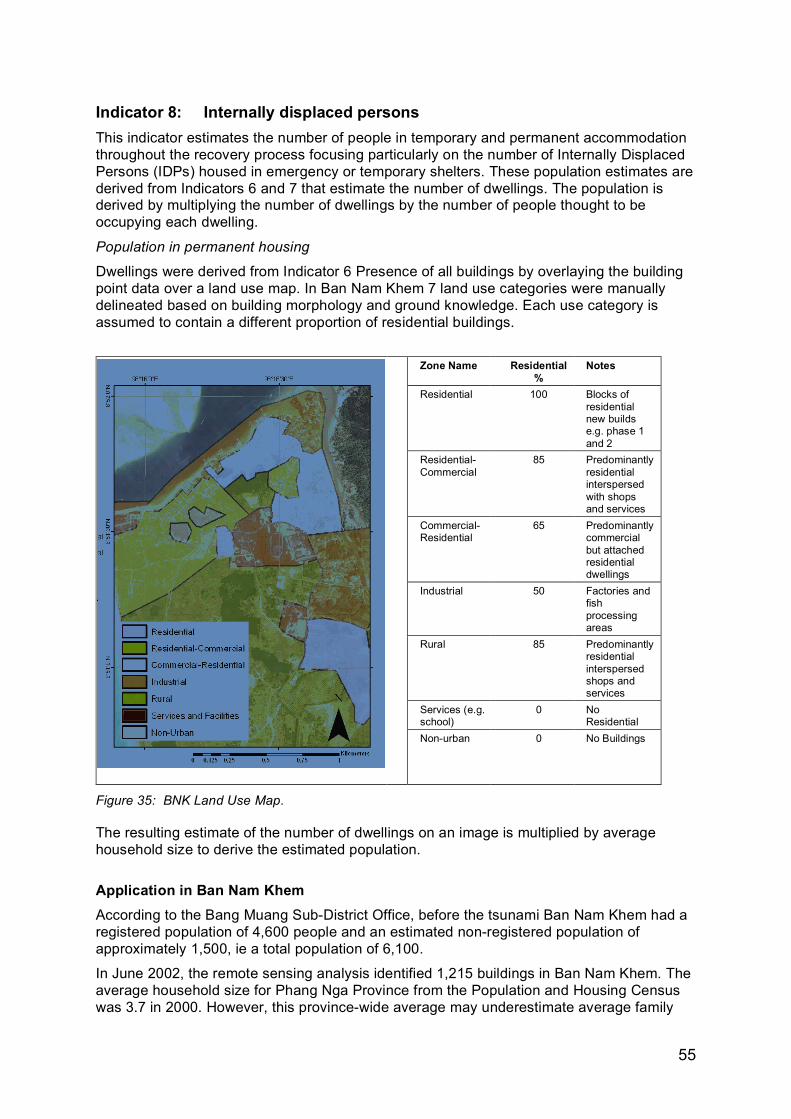
55
Indicator 8: Internally displaced persons This indicator estimates the number of people in temporary and permanent accommodation throughout the recovery process focusing particularly on the number of Internally Displaced Persons (IDPs) housed in emergency or temporary shelters. These population estimates are derived from Indicators 6 and 7 that estimate the number of dwellings. The population is derived by multiplying the number of dwellings by the number of people thought to be occupying each dwelling.
Population in permanent housing
Dwellings were derived from Indicator 6 Presence of all buildings by overlaying the building point data over a land use map. In Ban Nam Khem 7 land use categories were manually delineated based on building morphology and ground knowledge. Each use category is assumed to contain a different proportion of residential buildings.
Zone Name Residential
% Notes
Residential 100 Blocks of residential new builds e.g. phase 1 and 2
Residential-Commercial
85 Predominantly residential interspersed with shops and services
Commercial-Residential
65 Predominantly commercial but attached residential dwellings
Industrial 50 Factories and fish processing areas
Rural 85 Predominantly residential interspersed shops and services
Services (e.g. school)
0 No Residential
Non-urban 0 No Buildings
Figure 35: BNK Land Use Map.
The resulting estimate of the number of dwellings on an image is multiplied by average household size to derive the estimated population.
Application in Ban Nam Khem According to the Bang Muang Sub-District Office, before the tsunami Ban Nam Khem had a registered population of 4,600 people and an estimated non-registered population of approximately 1,500, ie a total population of 6,100.
In June 2002, the remote sensing analysis identified 1,215 buildings in Ban Nam Khem. The average household size for Phang Nga Province from the Population and Housing Census was 3.7 in 2000. However, this province-wide average may underestimate average family
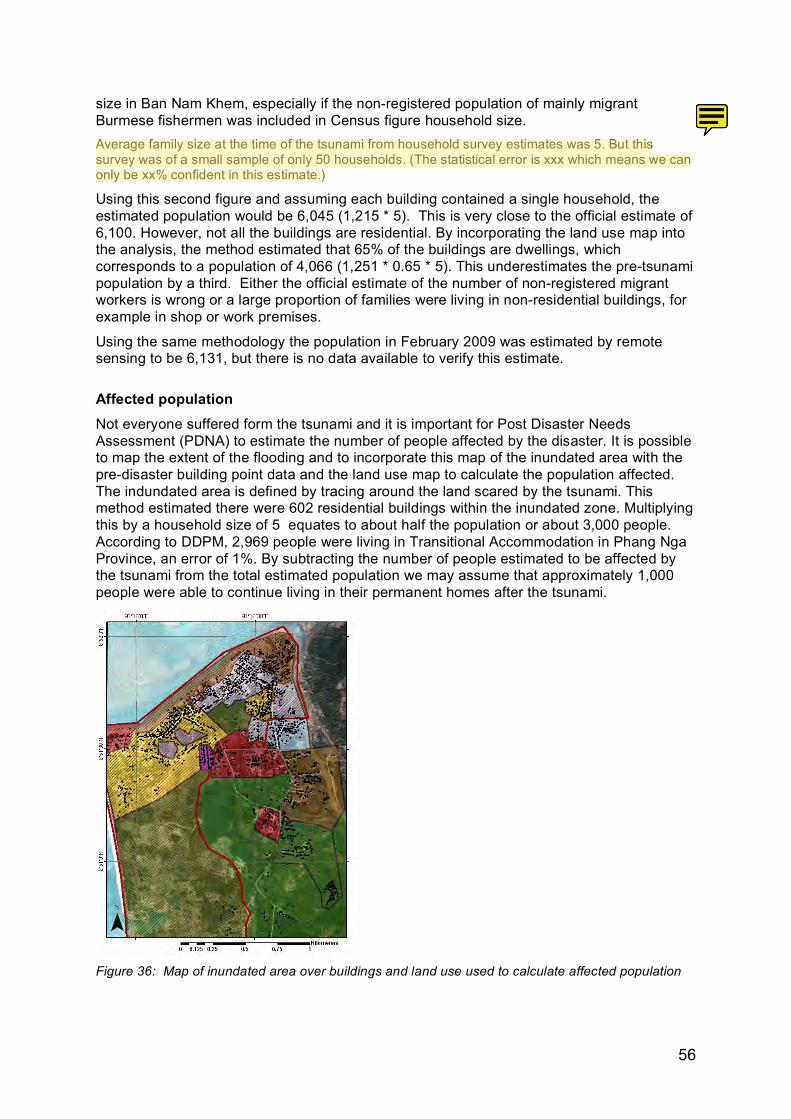
56
size in Ban Nam Khem, especially if the non-registered population of mainly migrant Burmese fishermen was included in Census figure household size. Average family size at the time of the tsunami from household survey estimates was 5. But this survey was of a small sample of only 50 households. (The statistical error is xxx which means we can only be xx% confident in this estimate.)
Using this second figure and assuming each building contained a single household, the estimated population would be 6,045 (1,215 * 5). This is very close to the official estimate of 6,100. However, not all the buildings are residential. By incorporating the land use map into the analysis, the method estimated that 65% of the buildings are dwellings, which corresponds to a population of 4,066 (1,251 * 0.65 * 5). This underestimates the pre-tsunami population by a third. Either the official estimate of the number of non-registered migrant workers is wrong or a large proportion of families were living in non-residential buildings, for example in shop or work premises.
Using the same methodology the population in February 2009 was estimated by remote sensing to be 6,131, but there is no data available to verify this estimate.
Affected population Not everyone suffered form the tsunami and it is important for Post Disaster Needs Assessment (PDNA) to estimate the number of people affected by the disaster. It is possible to map the extent of the flooding and to incorporate this map of the inundated area with the pre-disaster building point data and the land use map to calculate the population affected. The indundated area is defined by tracing around the land scared by the tsunami. This method estimated there were 602 residential buildings within the inundated zone. Multiplying this by a household size of 5 equates to about half the population or about 3,000 people. According to DDPM, 2,969 people were living in Transitional Accommodation in Phang Nga Province, an error of 1%. By subtracting the number of people estimated to be affected by the tsunami from the total estimated population we may assume that approximately 1,000 people were able to continue living in their permanent homes after the tsunami.
Figure 36: Map of inundated area over buildings and land use used to calculate affected population
Emily So
Emily So
Font
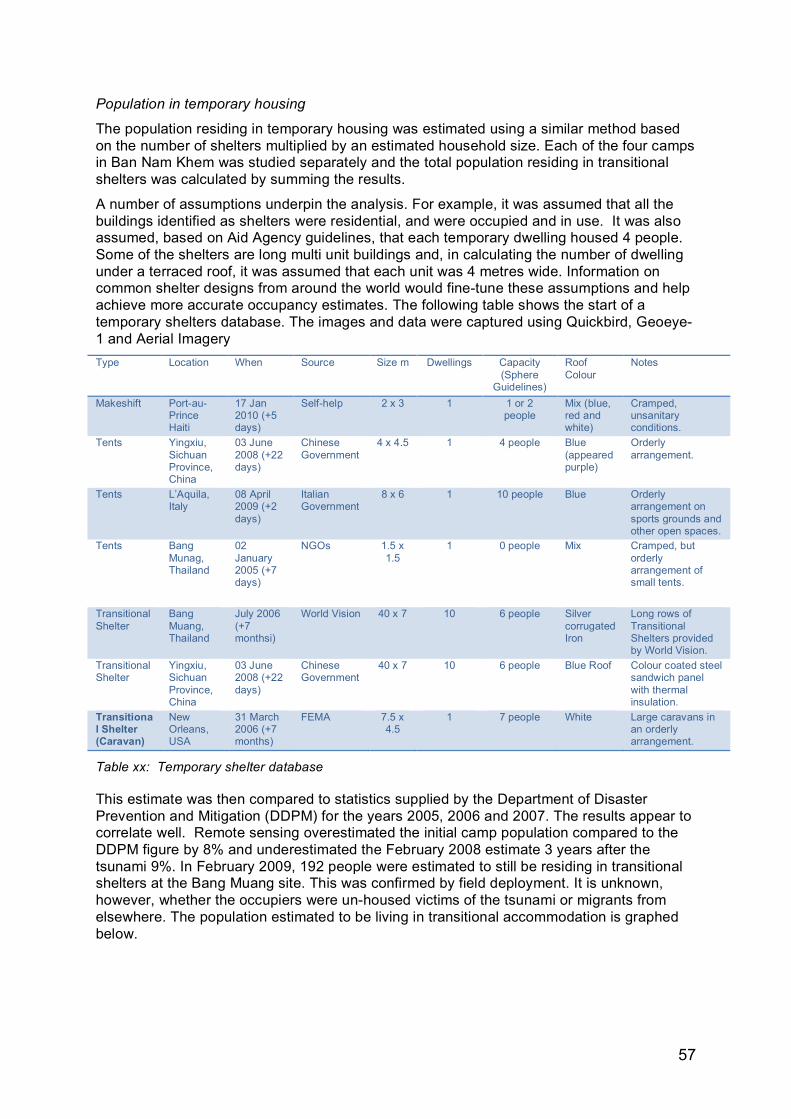
57
Population in temporary housing
The population residing in temporary housing was estimated using a similar method based on the number of shelters multiplied by an estimated household size. Each of the four camps in Ban Nam Khem was studied separately and the total population residing in transitional shelters was calculated by summing the results.
A number of assumptions underpin the analysis. For example, it was assumed that all the buildings identified as shelters were residential, and were occupied and in use. It was also assumed, based on Aid Agency guidelines, that each temporary dwelling housed 4 people. Some of the shelters are long multi unit buildings and, in calculating the number of dwelling under a terraced roof, it was assumed that each unit was 4 metres wide. Information on common shelter designs from around the world would fine-tune these assumptions and help achieve more accurate occupancy estimates. The following table shows the start of a temporary shelters database. The images and data were captured using Quickbird, Geoeye-1 and Aerial Imagery Type Location When Source Size m Dwellings Capacity
(Sphere Guidelines)
Roof Colour
Notes
Makeshift Port-au-Prince Haiti
17 Jan 2010 (+5 days)
Self-help 2 x 3 1 1 or 2 people
Mix (blue, red and white)
Cramped, unsanitary conditions.
Tents Yingxiu, Sichuan Province, China
03 June 2008 (+22 days)
Chinese Government
4 x 4.5 1 4 people Blue (appeared purple)
Orderly arrangement.
Tents L’Aquila, Italy
08 April 2009 (+2 days)
Italian Government
8 x 6 1 10 people Blue Orderly arrangement on sports grounds and other open spaces.
Tents Bang Munag, Thailand
02 January 2005 (+7 days)
NGOs 1.5 x 1.5
1 0 people Mix Cramped, but orderly arrangement of small tents.
Transitional Shelter
Bang Muang, Thailand
July 2006 (+7 monthsi)
World Vision 40 x 7 10 6 people Silver corrugated Iron
Long rows of Transitional Shelters provided by World Vision.
Transitional Shelter
Yingxiu, Sichuan Province, China
03 June 2008 (+22 days)
Chinese Government
40 x 7 10 6 people Blue Roof Colour coated steel sandwich panel with thermal insulation.
Transitional Shelter (Caravan)
New Orleans, USA
31 March 2006 (+7 months)
FEMA 7.5 x 4.5
1 7 people White Large caravans in an orderly arrangement.
Table xx: Temporary shelter database
This estimate was then compared to statistics supplied by the Department of Disaster Prevention and Mitigation (DDPM) for the years 2005, 2006 and 2007. The results appear to correlate well. Remote sensing overestimated the initial camp population compared to the DDPM figure by 8% and underestimated the February 2008 estimate 3 years after the tsunami 9%. In February 2009, 192 people were estimated to still be residing in transitional shelters at the Bang Muang site. This was confirmed by field deployment. It is unknown, however, whether the occupiers were un-housed victims of the tsunami or migrants from elsewhere. The population estimated to be living in transitional accommodation is graphed below.
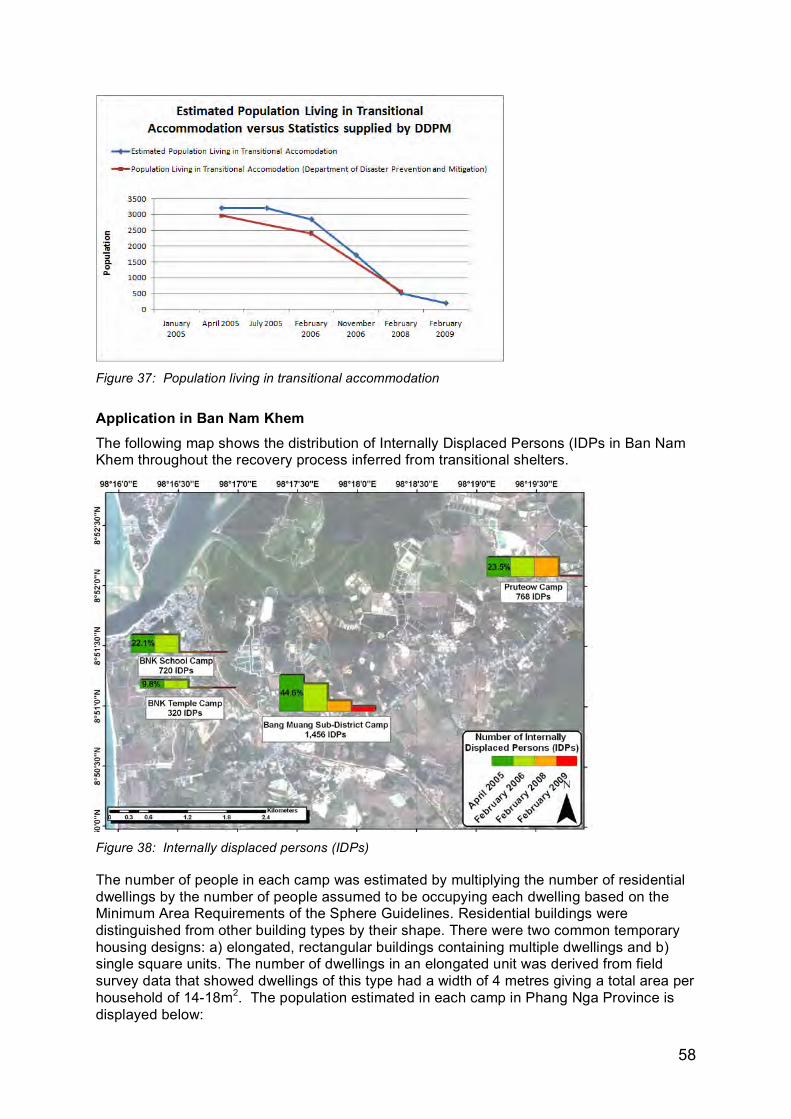
58
Figure 37: Population living in transitional accommodation
Application in Ban Nam Khem The following map shows the distribution of Internally Displaced Persons (IDPs in Ban Nam Khem throughout the recovery process inferred from transitional shelters.
Figure 38: Internally displaced persons (IDPs)
The number of people in each camp was estimated by multiplying the number of residential dwellings by the number of people assumed to be occupying each dwelling based on the Minimum Area Requirements of the Sphere Guidelines. Residential buildings were distinguished from other building types by their shape. There were two common temporary housing designs: a) elongated, rectangular buildings containing multiple dwellings and b) single square units. The number of dwellings in an elongated unit was derived from field survey data that showed dwellings of this type had a width of 4 metres giving a total area per household of 14-18m2. The population estimated in each camp in Phang Nga Province is displayed below:
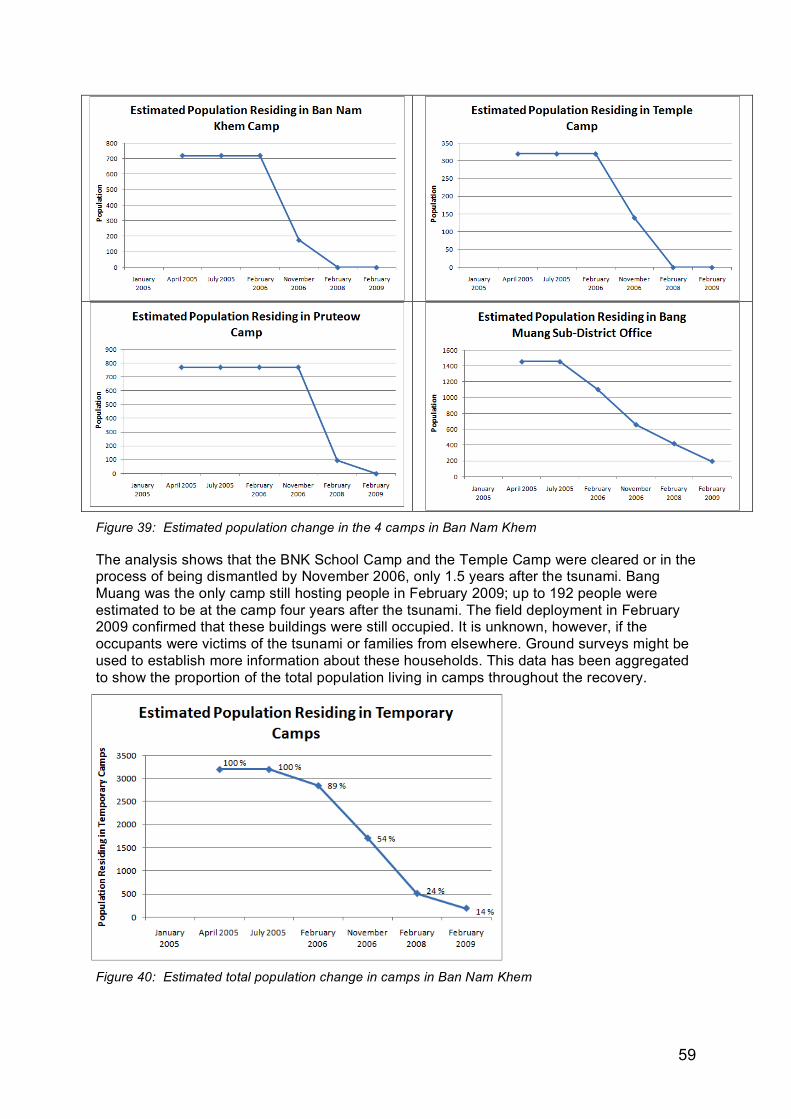
59
Figure 39: Estimated population change in the 4 camps in Ban Nam Khem
The analysis shows that the BNK School Camp and the Temple Camp were cleared or in the process of being dismantled by November 2006, only 1.5 years after the tsunami. Bang Muang was the only camp still hosting people in February 2009; up to 192 people were estimated to be at the camp four years after the tsunami. The field deployment in February 2009 confirmed that these buildings were still occupied. It is unknown, however, if the occupants were victims of the tsunami or families from elsewhere. Ground surveys might be used to establish more information about these households. This data has been aggregated to show the proportion of the total population living in camps throughout the recovery.
Figure 40: Estimated total population change in camps in Ban Nam Khem
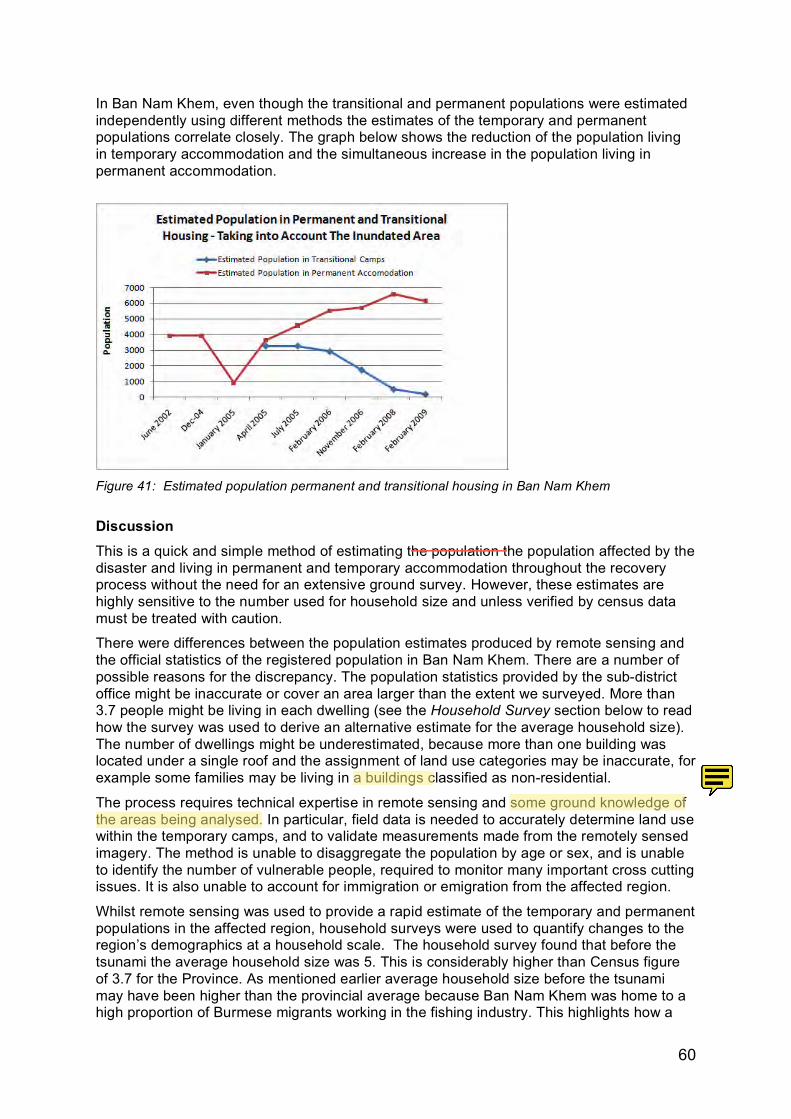
60
In Ban Nam Khem, even though the transitional and permanent populations were estimated independently using different methods the estimates of the temporary and permanent populations correlate closely. The graph below shows the reduction of the population living in temporary accommodation and the simultaneous increase in the population living in permanent accommodation.
Figure 41: Estimated population permanent and transitional housing in Ban Nam Khem
Discussion This is a quick and simple method of estimating the population the population affected by the disaster and living in permanent and temporary accommodation throughout the recovery process without the need for an extensive ground survey. However, these estimates are highly sensitive to the number used for household size and unless verified by census data must be treated with caution.
There were differences between the population estimates produced by remote sensing and the official statistics of the registered population in Ban Nam Khem. There are a number of possible reasons for the discrepancy. The population statistics provided by the sub-district office might be inaccurate or cover an area larger than the extent we surveyed. More than 3.7 people might be living in each dwelling (see the Household Survey section below to read how the survey was used to derive an alternative estimate for the average household size). The number of dwellings might be underestimated, because more than one building was located under a single roof and the assignment of land use categories may be inaccurate, for example some families may be living in a buildings classified as non-residential.
The process requires technical expertise in remote sensing and some ground knowledge of the areas being analysed. In particular, field data is needed to accurately determine land use within the temporary camps, and to validate measurements made from the remotely sensed imagery. The method is unable to disaggregate the population by age or sex, and is unable to identify the number of vulnerable people, required to monitor many important cross cutting issues. It is also unable to account for immigration or emigration from the affected region.
Whilst remote sensing was used to provide a rapid estimate of the temporary and permanent populations in the affected region, household surveys were used to quantify changes to the region’s demographics at a household scale. The household survey found that before the tsunami the average household size was 5. This is considerably higher than Census figure of 3.7 for the Province. As mentioned earlier average household size before the tsunami may have been higher than the provincial average because Ban Nam Khem was home to a high proportion of Burmese migrants working in the fishing industry. This highlights how a
Emily So
Emily So
Emily So
Emily So
Emily So May 19, 2010 11:55 AM
61
small household survey may be used to derive an average household size at town scale, which might be used along with remote sensing to produce a quick, estimation of the affected population.
The household survey also found that the average household size in February 2009 was 4. This gives an interesting insight into how demographics in the village might have changed. Households with more than four members were also given more than one house by aid agencies, which would have had a dramatic effect on reducing average household size. Loss of life and emigration may alos have had an effect. On average, each household in our survey lost one family member to the tsunami, with one household losing up to 7 family members. Emigration and immigration were high in the aftermath of the tsunami: 26% of households had members that emigrated and 28% of households had members that immigrated, suggesting that the net impact on the population due to the movement of people is likely to have been negligible. Household members moved away from Ban Nam Khem to marry, study and find work whilst people were attracted by the availability of new permanent homes and to help their relatives recover after the tsunami.
More accurate population estimates might be obtained through ground survey work. In particular, camp registration offers a good opportunity to count the number of Internally Displaced Persons (IDPs), which can then be disaggregated by gender and/or age. Other vulnerable groups, such as children, the elderly or the injured may also be identified to ensure that crosscutting needs are considered during the recovery process. Remote Sensing offers a useful tool to map and visualise the displaced population across the affected region. This information is important to prevent overcrowding at camps and to assist resource allocation.
Emily So
Emily So
Emily So
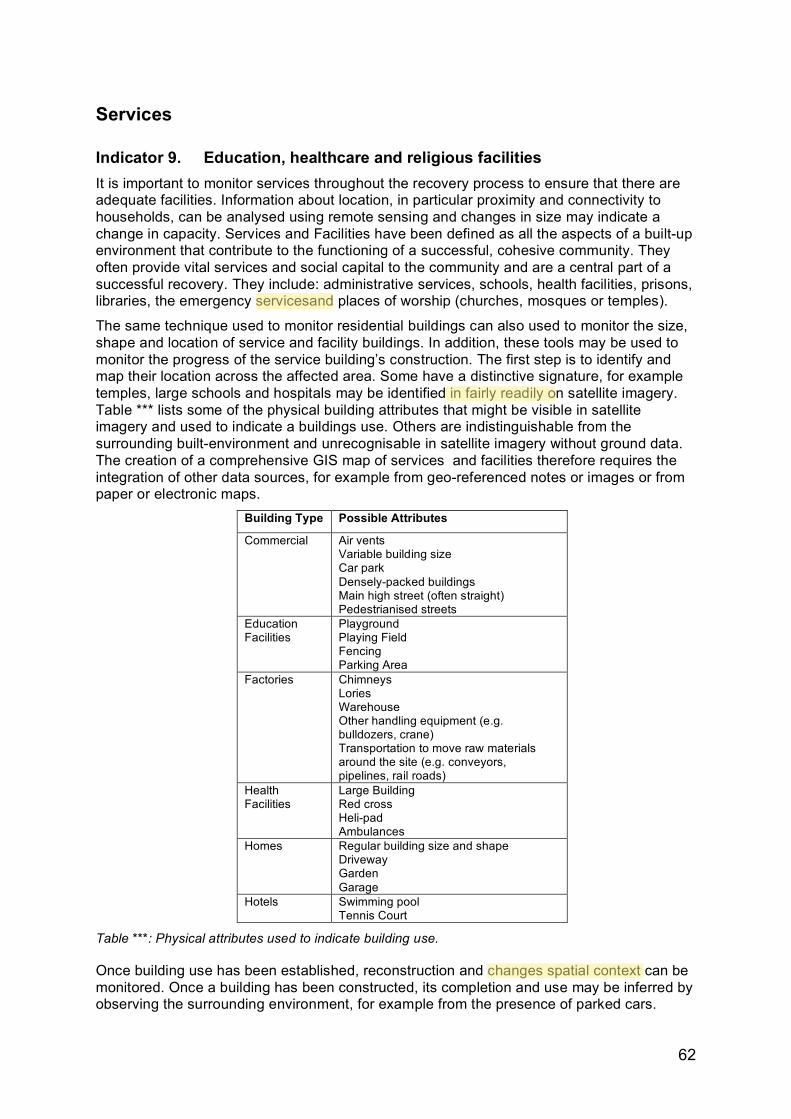
62
Services
Indicator 9. Education, healthcare and religious facilities It is important to monitor services throughout the recovery process to ensure that there are adequate facilities. Information about location, in particular proximity and connectivity to households, can be analysed using remote sensing and changes in size may indicate a change in capacity. Services and Facilities have been defined as all the aspects of a built-up environment that contribute to the functioning of a successful, cohesive community. They often provide vital services and social capital to the community and are a central part of a successful recovery. They include: administrative services, schools, health facilities, prisons, libraries, the emergency servicesand places of worship (churches, mosques or temples).
The same technique used to monitor residential buildings can also used to monitor the size, shape and location of service and facility buildings. In addition, these tools may be used to monitor the progress of the service building’s construction. The first step is to identify and map their location across the affected area. Some have a distinctive signature, for example temples, large schools and hospitals may be identified in fairly readily on satellite imagery. Table *** lists some of the physical building attributes that might be visible in satellite imagery and used to indicate a buildings use. Others are indistinguishable from the surrounding built-environment and unrecognisable in satellite imagery without ground data. The creation of a comprehensive GIS map of services and facilities therefore requires the integration of other data sources, for example from geo-referenced notes or images or from paper or electronic maps.
Building Type Possible Attributes
Commercial Air vents Variable building size Car park Densely-packed buildings Main high street (often straight) Pedestrianised streets
Education Facilities
Playground Playing Field Fencing Parking Area
Factories Chimneys Lories Warehouse Other handling equipment (e.g. bulldozers, crane) Transportation to move raw materials around the site (e.g. conveyors, pipelines, rail roads)
Health Facilities
Large Building Red cross Heli-pad Ambulances
Homes Regular building size and shape Driveway Garden Garage
Hotels Swimming pool Tennis Court
Table ***: Physical attributes used to indicate building use.
Once building use has been established, reconstruction and changes spatial context can be monitored. Once a building has been constructed, its completion and use may be inferred by observing the surrounding environment, for example from the presence of parked cars.
Emily So
Emily So
Emily So
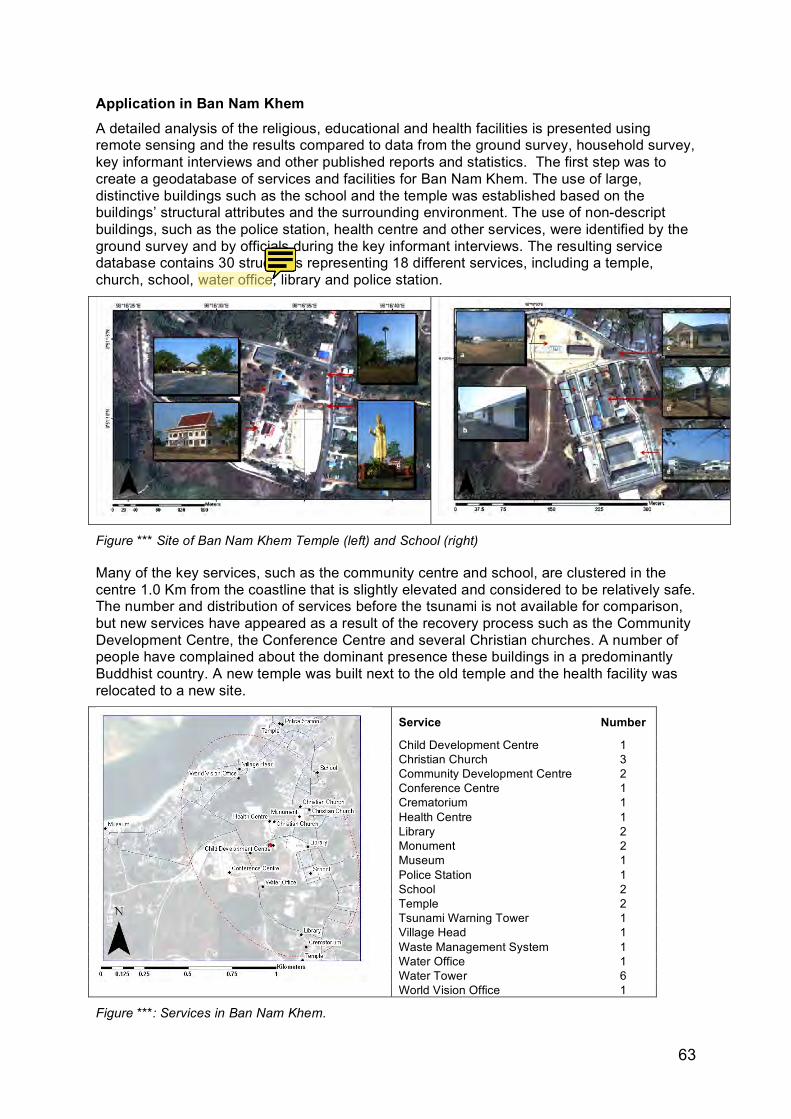
63
Application in Ban Nam Khem A detailed analysis of the religious, educational and health facilities is presented using remote sensing and the results compared to data from the ground survey, household survey, key informant interviews and other published reports and statistics. The first step was to create a geodatabase of services and facilities for Ban Nam Khem. The use of large, distinctive buildings such as the school and the temple was established based on the buildings’ structural attributes and the surrounding environment. The use of non-descript buildings, such as the police station, health centre and other services, were identified by the ground survey and by officials during the key informant interviews. The resulting service database contains 30 structures representing 18 different services, including a temple, church, school, water office, library and police station.
Figure *** Site of Ban Nam Khem Temple (left) and School (right)
Many of the key services, such as the community centre and school, are clustered in the centre 1.0 Km from the coastline that is slightly elevated and considered to be relatively safe. The number and distribution of services before the tsunami is not available for comparison, but new services have appeared as a result of the recovery process such as the Community Development Centre, the Conference Centre and several Christian churches. A number of people have complained about the dominant presence these buildings in a predominantly Buddhist country. A new temple was built next to the old temple and the health facility was relocated to a new site.
Service Number
Child Development Centre 1 Christian Church 3 Community Development Centre 2 Conference Centre 1 Crematorium 1 Health Centre 1 Library 2 Monument 2 Museum 1 Police Station 1 School 2 Temple 2 Tsunami Warning Tower 1 Village Head 1 Waste Management System 1 Water Office 1 Water Tower 6 World Vision Office 1
Figure ***: Services in Ban Nam Khem.
Emily So
Emily So
what's a water office?
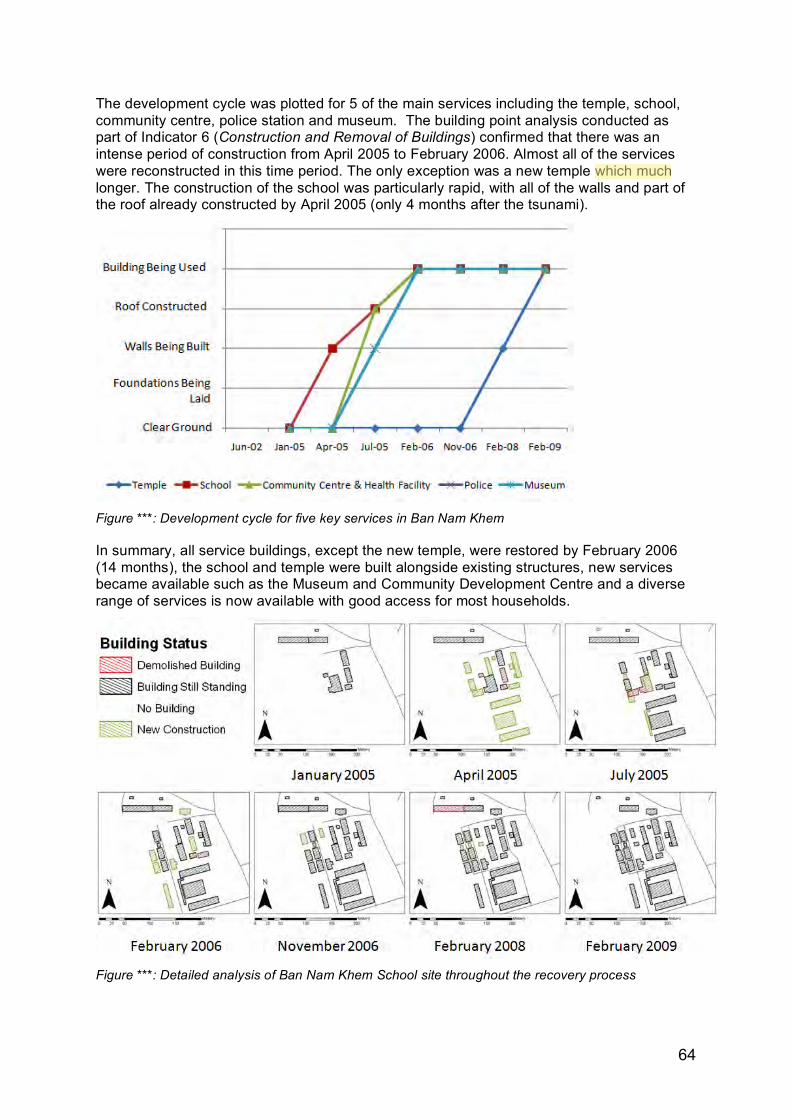
64
The development cycle was plotted for 5 of the main services including the temple, school, community centre, police station and museum. The building point analysis conducted as part of Indicator 6 (Construction and Removal of Buildings) confirmed that there was an intense period of construction from April 2005 to February 2006. Almost all of the services were reconstructed in this time period. The only exception was a new temple which much longer. The construction of the school was particularly rapid, with all of the walls and part of the roof already constructed by April 2005 (only 4 months after the tsunami).
Figure ***: Development cycle for five key services in Ban Nam Khem
In summary, all service buildings, except the new temple, were restored by February 2006 (14 months), the school and temple were built alongside existing structures, new services became available such as the Museum and Community Development Centre and a diverse range of services is now available with good access for most households.
Figure ***: Detailed analysis of Ban Nam Khem School site throughout the recovery process
Emily So

65
Discussion The remote sensing analysis was compared with official statistics and the results from the household survey. Bang Muang Sub-District Office informed us that the school was reopened in two weeks. Other reports claim that Ban Nam Khem School reopened after one month and that Thai and foreign volunteers helped with the teaching in the school-yard. The later reports match the remote sensing analysis which shows several temporary structures on the grounds of the school in April 2005 and removed by July 2005.
The 50 households in our survey sent their children to a number of schools across the region. The families of children at Ban Nam Khem School identified damaged buildings and the school closure as a problem after the tsunami. Most of the students at Ban Nam Khem School returned by April - May 2005, which coincides with the construction of the small temporary structures on the site. The children at the unaffected schools all returned to classes within one or two months of the tsunami. Most children were kept out of education for a minimal amount of time. Some households decided to move their children to other schools but they returned a year later.
It is clear that remote sensing can be used to monitor the construction of new buildings and facilities and in some cases it may also observe the presence of temporary teaching facilities during the relief period. But monitoring children’s progress is a complex issue that requires the attendance and progress of students to be monitored in detail. Remote sensing cannot monitor other aspects of education, including: attendance levels, when children re-started lessons, where did they re-locate to, repair and recovery of school resources, employment of qualified teachers, children’s progress in the curriculum,
Remote sensing can be used to map functioning health facilities, clinics and hospitals. But most healthcare facilities are difficult to detect without detailed information from the ground or the availability of large-scale city maps. In some cases, large hospitals may be identifiable by a red cross or the presence of a helicopter landing-pad, but most buildings are unidentifiable from satellite images alone, especially those temporary facilities set-up in the aftermath of the disaster. Remote sensing cannot monitor other aspects of health, including: attendance rates, patient recovery, health equipment and medicines, availability of staff and doctors.
Remote sensing may also be used to analyse health risk, but even a basic study of health recovery will require detailed statistics, including epidemiological and community-based data. Poor health may occur during the relief and recovery phase due to poor sanitation and waste control. Other useful indicators may also include: overcrowding and population displacements; houses equipped with appropriate vector-controlling devices (e.g. mosquito nets); good hygiene and sanitation practices.
Emily So
Emily So
Emily So
another word?
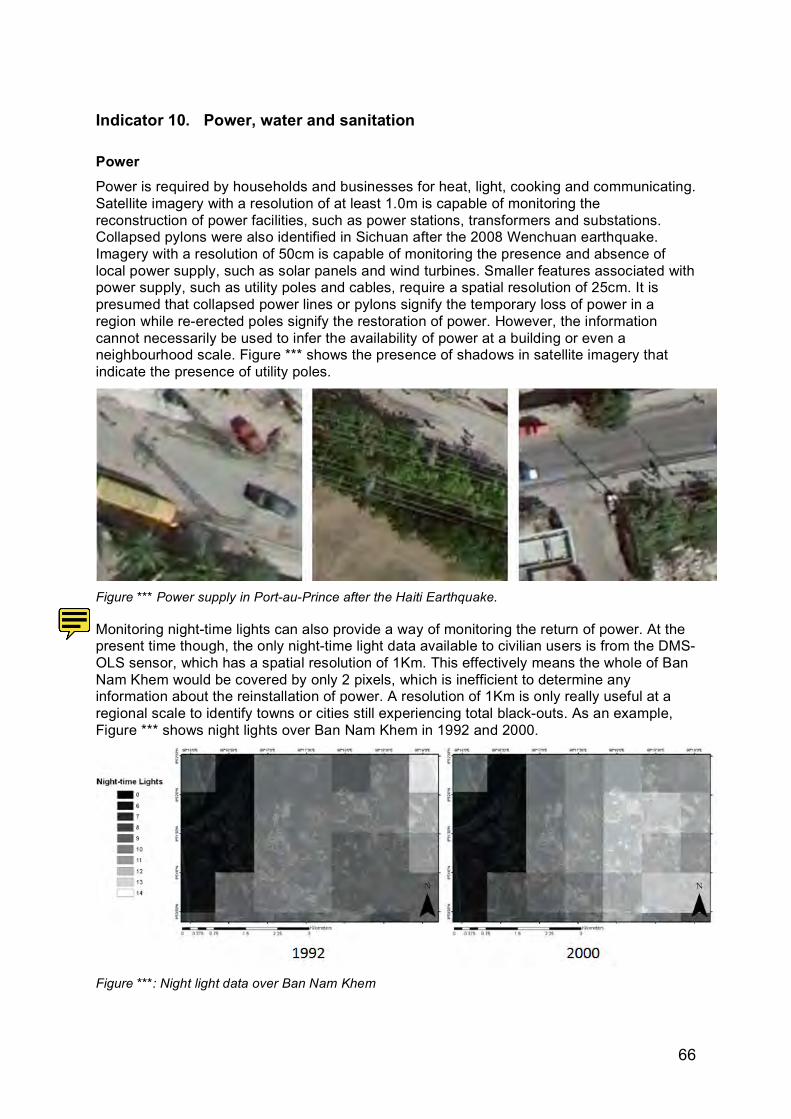
66
Indicator 10. Power, water and sanitation
Power Power is required by households and businesses for heat, light, cooking and communicating. Satellite imagery with a resolution of at least 1.0m is capable of monitoring the reconstruction of power facilities, such as power stations, transformers and substations. Collapsed pylons were also identified in Sichuan after the 2008 Wenchuan earthquake. Imagery with a resolution of 50cm is capable of monitoring the presence and absence of local power supply, such as solar panels and wind turbines. Smaller features associated with power supply, such as utility poles and cables, require a spatial resolution of 25cm. It is presumed that collapsed power lines or pylons signify the temporary loss of power in a region while re-erected poles signify the restoration of power. However, the information cannot necessarily be used to infer the availability of power at a building or even a neighbourhood scale. Figure *** shows the presence of shadows in satellite imagery that indicate the presence of utility poles.
Figure *** Power supply in Port-au-Prince after the Haiti Earthquake.
Monitoring night-time lights can also provide a way of monitoring the return of power. At the present time though, the only night-time light data available to civilian users is from the DMS-OLS sensor, which has a spatial resolution of 1Km. This effectively means the whole of Ban Nam Khem would be covered by only 2 pixels, which is inefficient to determine any information about the reinstallation of power. A resolution of 1Km is only really useful at a regional scale to identify towns or cities still experiencing total black-outs. As an example, Figure *** shows night lights over Ban Nam Khem in 1992 and 2000.
Figure ***: Night light data over Ban Nam Khem
Emily So
Going into application for BNK- subheading?
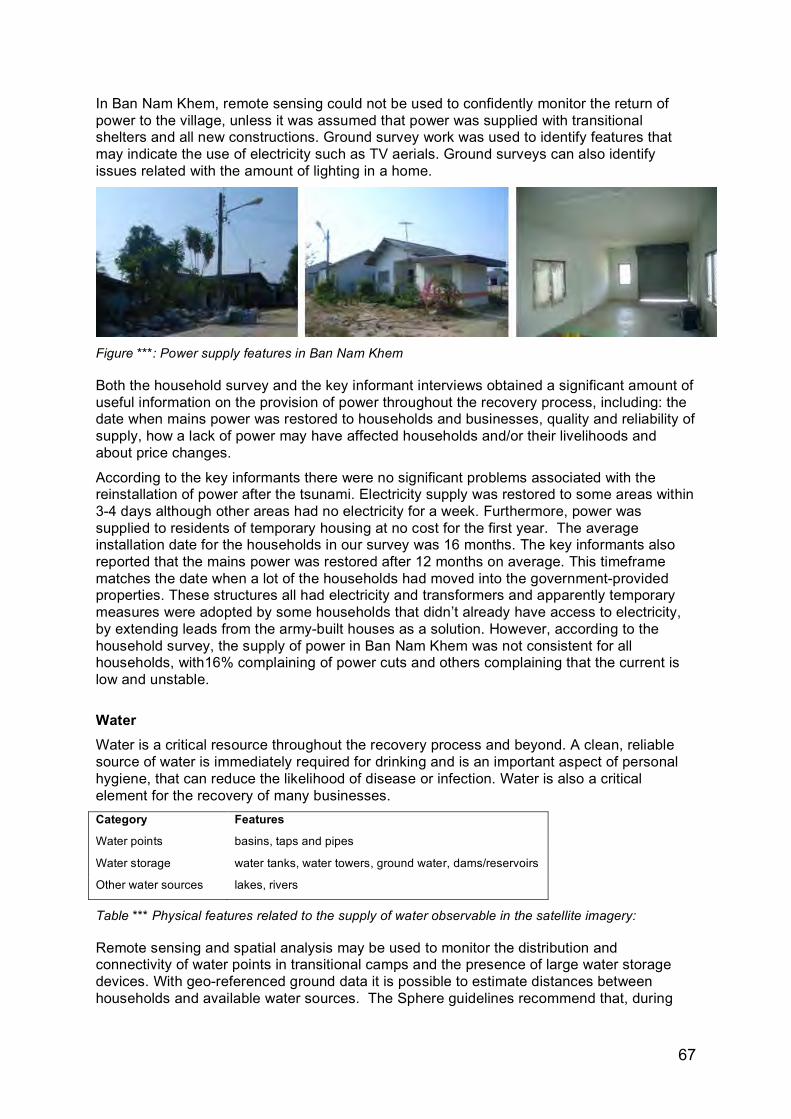
67
In Ban Nam Khem, remote sensing could not be used to confidently monitor the return of power to the village, unless it was assumed that power was supplied with transitional shelters and all new constructions. Ground survey work was used to identify features that may indicate the use of electricity such as TV aerials. Ground surveys can also identify issues related with the amount of lighting in a home.
Figure ***: Power supply features in Ban Nam Khem
Both the household survey and the key informant interviews obtained a significant amount of useful information on the provision of power throughout the recovery process, including: the date when mains power was restored to households and businesses, quality and reliability of supply, how a lack of power may have affected households and/or their livelihoods and about price changes.
According to the key informants there were no significant problems associated with the reinstallation of power after the tsunami. Electricity supply was restored to some areas within 3-4 days although other areas had no electricity for a week. Furthermore, power was supplied to residents of temporary housing at no cost for the first year. The average installation date for the households in our survey was 16 months. The key informants also reported that the mains power was restored after 12 months on average. This timeframe matches the date when a lot of the households had moved into the government-provided properties. These structures all had electricity and transformers and apparently temporary measures were adopted by some households that didn’t already have access to electricity, by extending leads from the army-built houses as a solution. However, according to the household survey, the supply of power in Ban Nam Khem was not consistent for all households, with16% complaining of power cuts and others complaining that the current is low and unstable.
Water Water is a critical resource throughout the recovery process and beyond. A clean, reliable source of water is immediately required for drinking and is an important aspect of personal hygiene, that can reduce the likelihood of disease or infection. Water is also a critical element for the recovery of many businesses. Category Features
Water points basins, taps and pipes
Water storage water tanks, water towers, ground water, dams/reservoirs
Other water sources lakes, rivers
Table *** Physical features related to the supply of water observable in the satellite imagery:
Remote sensing and spatial analysis may be used to monitor the distribution and connectivity of water points in transitional camps and the presence of large water storage devices. With geo-referenced ground data it is possible to estimate distances between households and available water sources. The Sphere guidelines recommend that, during
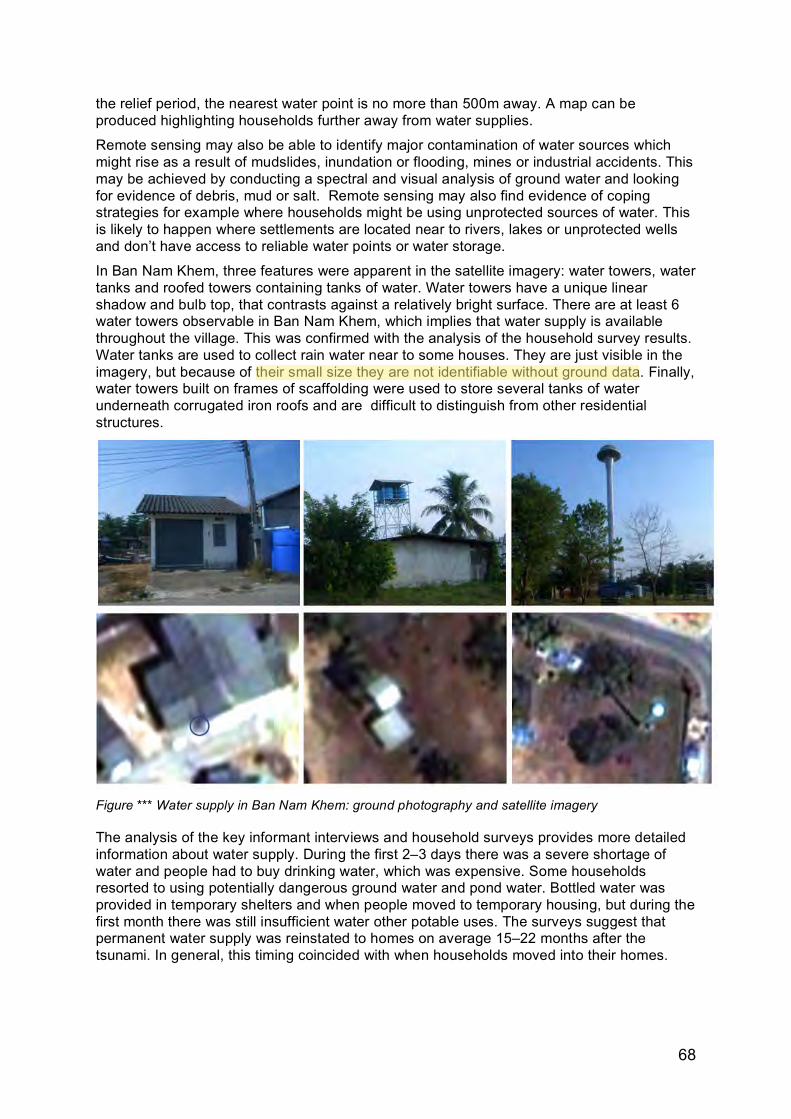
68
the relief period, the nearest water point is no more than 500m away. A map can be produced highlighting households further away from water supplies.
Remote sensing may also be able to identify major contamination of water sources which might rise as a result of mudslides, inundation or flooding, mines or industrial accidents. This may be achieved by conducting a spectral and visual analysis of ground water and looking for evidence of debris, mud or salt. Remote sensing may also find evidence of coping strategies for example where households might be using unprotected sources of water. This is likely to happen where settlements are located near to rivers, lakes or unprotected wells and don’t have access to reliable water points or water storage.
In Ban Nam Khem, three features were apparent in the satellite imagery: water towers, water tanks and roofed towers containing tanks of water. Water towers have a unique linear shadow and bulb top, that contrasts against a relatively bright surface. There are at least 6 water towers observable in Ban Nam Khem, which implies that water supply is available throughout the village. This was confirmed with the analysis of the household survey results. Water tanks are used to collect rain water near to some houses. They are just visible in the imagery, but because of their small size they are not identifiable without ground data. Finally, water towers built on frames of scaffolding were used to store several tanks of water underneath corrugated iron roofs and are difficult to distinguish from other residential structures.
Figure *** Water supply in Ban Nam Khem: ground photography and satellite imagery
The analysis of the key informant interviews and household surveys provides more detailed information about water supply. During the first 2–3 days there was a severe shortage of water and people had to buy drinking water, which was expensive. Some households resorted to using potentially dangerous ground water and pond water. Bottled water was provided in temporary shelters and when people moved to temporary housing, but during the first month there was still insufficient water other potable uses. The surveys suggest that permanent water supply was reinstated to homes on average 15–22 months after the tsunami. In general, this timing coincided with when households moved into their homes.
Emily So
69
Sanitation Sanitation appears to have been dealt with adequately, with sufficient toilets and bathroom facilities provided along with advice about hygiene. The toilets were installed in transitional shelters after approximately 1 month and in permanent homes after approximately 1 year. There were regular collections of rubbish at the temporary shelters, which also became an additional income for some workers there. It took one year for the regular waste collection service to resume with a temporary black bag measure adopted in the meantime. Despite this, some households complained that there were not enough toilets and that they were dirty. One household also complained that there was no trash collection near to their house which led to bad smells and slippery surfaces after localised flooding occurred.
Although the presence of an over-ground water system is visible is satellite imagery, many of the problems raised by Key Informants and Household Surveys are not identifiable. The
Discussion Remote sensing will never be able to completely replace ground or household surveys, however, since even for a basic study, additional information will be required for example on the quality of the service provided, exact dates of recovery and reports of any unreliable or limited supplies, information that is only obtainable through ground surveys and interviews with households and key informants.
Remote sensing will never replace social audit techniques such as household surveys and focus group meetings which may be used to establish the household’s accessibility to different services and their level of satisfaction with the service provided. These techniques are also important methods of acquiring attendance statistics and other data that might indicate the level of service provided.
Emily So
we start straight off with BNK.. and only findings from ground surveys..
Emily So
Emily So

70
Natural Environment
Indicator 11. Land-cover and urban green space

71
Livelihoods
Indicator 12. Reconstruction of livelihoods
72
6 Conclusions
THE FOLLOWING NEEDS REWRITING. IT IS PLACED HERE SO IT DOESN’T GET LOST
Our main conclusion is that remote sensing, when judiciously combined with key informant and ground surveys, provides an unparalleled degree of useful information. Different agencies have different information needs and might consider doing their own remote sensing. However, it might make more sense for a single agency to take overall responsibility for monitoring recovery in a comprehensive way following our approach
Comparison of the tools The case studies highlight how detailed information may be obtained about recovery using remote sensing, interviews, household surveys and ground surveys. Remote sensing was used to monitor changes to the size, shape, arrangement, location and context of buildings. The household survey obtained information about changes to the socio-economic and demographic make-up of the households. Key information about their registration status and land entitlement was also established. In addition, it was used to produce a recovery narrative describing when key events happened and to infer their perception of recovery by identifying any problems they faced and how the process of recovery could have been improved. Important information was also obtained about the households’ source of livelihood and any support they received, and it highlighted problems with the provision of utilities that were unobservable with remote sensing. In hindsight, there were several important aspects of recovery that were missed from our survey; these include the security of the households, their experience of crime throughout the recovery process and their participation in the community.
Household survey
The household survey results show that both the size and the location of the buildings (e.g. proximity to fishing facilities) were important factors in the households’ perception of recovery. Both of these attributes were objectively measured in satellite imagery in a quantitative manner. In fact, remote sensing was able to quantify changes to the proximity and connectivity of households in Ban Nam Khem and households that were relocated elsewhere. Households that had been relocated outside of Ban Nam Khem have generally found it difficult to continue making a living in the fishing industry and felt disconnected from the village. The small size of the building was also a major factor contributing to the households’ discontent with the army-constructed buildings. Remote sensing was able to objectively show that an agency structure had a floor space 68% larger than the government-built structure. Both remote sensing and a household survey were used to estimate when the occupants moved into their houses. The agency household told us that they moved into their home in December 2008, which matched remote sensing’s estimate of a move in date between February 2008 and February 2009. The government household told us that they moved in July 2006 whilst remote sensing estimated a move in date between April 2005 and July 2005. This shows that the occupancy of a building cannot always be confidently determined with satellite imagery alone. The accuracy of any temporal-based estimate is also reliant on how often satellite imagery is acquired throughout the recovery process.
Ground survey
Ground survey work, such as the utilisation of geo-referenced photo and video equipment, may be used to collect detailed street view data. This data may be used to validate some remote sensing attributes such as the occupancy and the number of storeys. It may also be used to conduct a basic structural assessment of the structure by identifying the building’s material and structure type. Finally, detailed observations of the building facade and the area
73
surrounding the building may be used to identify signs of general prosperity or degeneration. Visible signs of degeneration might include broken windows, vacant buildings and overgrown vegetation.
In summary, the household survey was able to capture unique information that was not possible in Remote Sensing, such as income, source of livelihood, the date water and power supplies were restored, and overall contentment levels with the recovery process. Assumptions could be made about a household’s overall contentment with their house and overall perception of recovery based on key measurements made with remote sensing such as the building size, the presence of a garden and its location and connectivity. For example, households living in bigger structures with a porch, garden and driveway were often the most content. Participation of the household in the construction of the house also appears to have been an important factor in ensuring overall contentment. The results from the remote sensing may be used to map the unequal allocation of building size and types across Ban Nam Khem. Recommendations may be made to improve future recovery work based on these results. It is important to recognise that good building design does not automatically equate to a good recovery. A full evaluation should also take into account issues such as affordability, environmental performance and the availability of a mix of building typologies.
Official statistics
The literature review also highlighted information about several groups of households that were not surveyed or detected in our work. These include the crab farmers in “Soi Tok Poo” and the 23 families that decided to build their homes outside of the danger zone. The “Soi Tok Poo” group wanted to rebuild their structures as they were present before the tsunami – on stilts above the water - but these ideas and designs were deemed too expensive by the government. The group eventually got design advice from CODI and funding from the Save Andaman Network to build the structures in a way that suited them. The second group asked for building materials instead of a new home from the government so that they could build their homes by the temple in Ban Nam Khem. As a consequence, they were the first group of households to build homes according to their own designs in the safety zone. These examples highlight the complexity of post-disaster recovery, even in a small geographic region. Every household has their own recovery trajectory and every individual will have a unique set of issues and problems that will require assistance. It is therefore not possible for remote sensing or sampled surveys to identify ALL of these issues. These tools may only be used to build a picture of what recovery might be like in these communities and to make assumptions on the overall level of recovery and reconstruction. This therefore highlights the continued importance of bottom-up approaches to monitoring recovery, such as the use of focus groups or other mechanisms where the community are allowed to come together and raise any problems they might have throughout the process of recovery.

74
Appendices A1 Key informant interview schedule A2 Household survey
75
References 1 EM-DAT (2010). Emergency Events Database (EM-DAT). Centre for Research on the Epidemiology of Disasters (CRED), School of Public Health, Universitè Catholiquè de Louvain, Brussels, Belgium. <http://www.emdat.be> Accessed 11/02/10 2 Freeman, P.K., Keen, M. and Mani, M. (2003). Being Prepared. Natural disasters are becoming more frequent, more destructive, and deadlier, and poor countries are being hit the hardest. Finance and Development. September 2003. 3 EM-DAT (2010). Op cit 4 Relief Web, UN Financial Tracking Service <http://www.ocha.unog.ch/fts/by_sector.asp?viewDonors=&type_of_cont=ND> (Accessed 11/2/10) 5 Karatani, Y. and Hayashi, H. (2007). Quantitative Evaluation of Recovery Process in Disaster-Stricken Areas Using Statistical Data. Journal of Disaster Research: Vol. 2, No. 6. 6 Murao, O. (2004). Description of building reconstruction process of Chi-Chi area using image archives after the 1999 Chi-Chi earthquake, Taiwan. 1st International Conference of Urban Disaster Reduction. Kobe, Japan. 19 January 2004 7 ECLAC (2003). Handbook for estimating the socio-economic and EnvironmentalEffects of Disasters. Economic Commission for Latin America and the Caribbean (ECLAC). 8 MDG (2008). The Millennium Development Goals Report 2008. United Nations. New York. 9 WDI (2008). World Development Indicators 2008. The World Bank. Washington, D.C. 10 Sphere Project (2004). Humanitarian Charter and Minimum Standards in Disaster Response. The Sphere Project. Oxford, OXFAM Publishing. 11 Amin, S. and Goldstein, M. (eds.) (2008). Data against natural disasters. Establishing effective systems for relief, recovery and reconstruction. The World Bank. Washington, DC. 12 TRIAMS (2007). Tsunami Recovery Impact Assessment and Monitoring System(TRIAMS). Second regional TRIAMS workshop. Bangkok, 21-23 March 2007. 13 TRIP (2007). 2nd Tsunami Recovery Indicator Package (TRIP) Report for Aceh and Nias. How far have we come? Where do we go from here? Tsunami Recovery Indicator Package (TRIP). UNORC-IAS. 14 SHAW, R (2006) Recovery from the Indian Ocean tsunami disaster, in Disaster Prevention and Management Emerald Group Publishing Limited pp 164 15 World Health Organisation and International federation of the Red Cross and red Crescent Societies ( 2005 ), Joint Concept Paper, TRIAMS Technical Paper <http://www.ifrc.org/docs/pubs/updates/triams-technical-paper.pdf> pp 3-5 (Accessed 19/11/08) 16 Pomonis, A, Rossetto, T., Wilkinson, S. Del Re, D. Happold, B., Peiris, N., Koo, N., Manakapig, R. and Gallocher, S. (2005). Preliminary Reconnaissance Report. The Indian Ocean Tsunami. 26th December 2004. Earthquake Engineering Field Investigation Team (EEFIT), Web Report 2005, www.eefit.org.uk 17 Thailand - Post Rapid Assessment Report: Dec 26 2004 Tsunami, Asian Disaster Preparedness Center, 15 February 2005) <http://www.adpc.net/tudmp/Tsunami%20Rapid%20Assessment%20Report_15%20Feb.pdf> (Accessed 16/2/10) 18 Earthquake Engineering Research Institute. (Feb 2006), Learning from Earthquakes – The Kashmir Earthquake of October 8, 2005: Impacts in Pakistan. http://www.eeri.org/lfe/pdf/kashmir_eeri_2nd_report.pdf (Accessed 9/1/09) 19 European Commission Joint Research centre JRC Response to Emergencies and Disasters Pakistan Earthquake, 8/10/2005 <http://disasters.jrc.it/PakistanEarthquake/index.asp>
76
20 U.S. Geological Survey Preliminary Earthquake Report http://earthquake.usgs.gov/eqcenter/eqinthenews/2005/usdyae/#details (Accessed 9/1/09) 21 Mushaq, S., One year on, Kashmir earthquake haunts survivors Reuters Foundation <http://www.alertnet.org/thenews/newsdesk/DEL38845.htm> (Accessed 9/1/09) 22 The Jammu and Kashmir Earthquake: A Rapid Assessment of Impacts and Needs – Uri and Karnah Tehsils., (Sep 06), University of Kashmir, Srinagar, Tata Institute of Social Sciences, Mumbai, ActionAid India, pp. 1. 23 Habitat for humanity, 2008. Pakistan earthquake: challenges and innovations after the 2005 earthquake. <http://www.habitat.org/ap/pdf/media/Pakistan_Earthquake.pdf> (Accessed 6/1/09) 24 UNICEF, 2005. Pakistan earthquake <http://www.unicef.org/infobycountry/pakistan_30401.html> (Accessed 5/1/09) 25 ISDR, 2008. Pakistan 8th October Earthquake. http://www.unisdr.org/eng/task%20force/tf-meetigns/12th-TF-mtg/item2-Pakistan-IATF-12.ppt> (Accessed 7/1/09) 26 Peiris, L.M.N., Rossetto, T., Burton, P.W. and Mahmood, S. (2006). EEFIT Mission: October 8, 2005 Kashmir Earthquake. Preliminary Reconnaissance Report, Earthquake Engineering Field Investigation Team (EEFIT), <http://www.eefit.org.uk> (Accessed 16/2/10). 27 ATC-21 FEMA 154, 2nd Ed., Rapid Visual Screening of Buildings for Potential Seismic Hazards: A Handbook. 28 Curtis, A.J., Mills, J.W., McCarthy, T., Stewart, Fotheringham, A.S. and Fagan, W.F. (2010) Space and Time Changes in Neighbourhood Recovery After a Disaster Using a Spatial Video Acquisition System. In: Showalter, P.S. and Lu, Y. (2010) Geospatial Techniques in Urban Hazard and Disaster Analysis. Springer, London. 29 Haiti: 360º Vidoe surveys shot in Port-au-Prince on 18 January 2010, six days after the Haitian Earthquake. www.cnn.com/interactive/2010/01/world/haiti.360/index.html (Accessed 28.2.10) 30 Hinz, S., 2003. Detection and Counting of Cars in Aerial Images. Proceedings of the International Conference on Image Processing, Barcelona, Spain, Vol. 3, pp. III-997-1000. 31 Alba-Flores, R. (2005). Evaluation of the use of High-Resolution Satellite Imagery in Transportation Applications. Final Report. University of Minnesota. Center for Transportation Systems Institute. CTS 05-11. http://www.cts.umn.edu/pdf/CTS-05-11.pdf 32 Gerhardinger, A., Ehrlich, D. and Pesaresi, M. (2005). Vehicles detection from very high resolution satellite imagery. In: Stilla U, Rottensteiner F, Hinz S (Eds) CMRT05. IAPRS, Vol. XXXVI, Part 3/W24 --- Vienna, Austria, August 29-30, 2005. 33 Schlosser, C., Reitberger, J., and Hinz, S., "Automatic Car Detection in High Resolution Urban Scenes Based on an Adaptive 3D-Model," Proceedings of the IEEE/ISPRS joint Workshop on Remote Sensing and Data Fusion over Urban Areas, Berlin, 2003, IEEE, Piscataway, pp. 167 - 171. 34 World Vision (2007). World Vision Thailand Tsunami Response. Final Report: December 2004 – June 2007. 35 Jackson, L.E. The relationship of urban design to human health and condition. Landscape andUrban Planning 2003, 64, 191-200. 36 Jensen, J.R. and Cowen, D.C. (1999). Remote Sensing of Urban/Suburban Infrastructure and Socio-Economic Attributes. Photogrammetric Engineering and Remote Sensing. Vol. 65. No. 5. 611-622. 37Jensen, J.R. (1996). Introductory Digital Image Processing: A Remote Sensing Perspective. Prentice-Hall. Saddle River. New Jersey. 318. 38 Jensen, J.R. (2007). Remote sensing of the Environment. An Earth Resource Perspective. 2nd Edition. Pearson. Practice Hall Series in Geographic Information Science. NJ07458.
39 A Handy Guide to UNHCR Emergency Standards and Indicators, UNHRC.


![Disaster Recovery Center (Disaster Assistance … Library/Disaster Recovery Center...Disaster Recovery Center (Disaster Assistance Center) Standard Operating Guide [Appendix to: ]](https://static.fdocuments.us/doc/165x107/5b0334ba7f8b9a2d518bd9d9/disaster-recovery-center-disaster-assistance-librarydisaster-recovery-centerdisaster.jpg)