Disability in North Carolina: Spatial Distributions and …The North Carolina Geographer 65 NC...
12
The North Carolina Geographer Disability in North Carolina: Spatial Distributions and Access to Care Karine Dube Queen Elizabeth House, Pembroke College Oxford University Examination of the spatial patterns of disability rates by North Carolina county reveals regional patterns with eastern and mountain counties having higher levels of disabilities. Income and ethnic measures show the most frequent statistically significant associations with disability rates. Case studies of three counties – Mecklenburg, Chatham, and Halifax – show that residents in the counties with the greatest need for disability services have the poorest geographic access to them. These results have implications for those who make policies concerning the disabled. The paper demonstrates the benefits of collaboration between university students and a North Carolina state agency. , Volume 11, 2003, pp. 62-73 Elizabeth Hauser, Colleen Longfellow, Amanda Clarke Henley, and Wil Gesler University of North Carolina at Chapel Hill Introduction Disability is a serious problem in the U.S. Approximately 20% of Americans (around 54 million people) experience an activity limitation due to a physical or mental impairment or health condition. The 1998 and 1999 North Carolina Behavioral Risk Factor Surveillance System indicated that 21% of non- institutionalized adults experience activity limitation as a result of a health condition or perceive that they have a disability (Division of Public Health, State Center for Health Statistics, 2001). To compound the situation, disability is associated with several other problems, including poverty, low educational attainment, and difficulty in obtaining social services. Despite the burden on society of disability, however, it is only recently that geographers have begun to study this problem (Gleeson 1999). Recent work by geographers and others points toward the idea that disability is a social construction. A person is labeled as disabled when s/he fails to meet societal norms for such activities as employment, schooling, or self-care. Thus, for example, the inability to walk is a serious problem for most people in all times and places, but the inability to drive becomes especially serious in communities where residential areas are distant from services and access to public transportation is limited. Most people pursue their daily activities in the belief that everyone is physically and mentally fit. This notion, called ableism, “refers to ideas, practices, institutions, and social relations that presume able- bodiness, and by so doing, construct persons with disabilities as marginalized, oppressed, and largely invisible ‘others’” (Chouinard 1997, p. 380). Being disabled leads to stigmatization and misunderstanding. The disabled are often subject to such psychologically damaging labels as “crippled” or “crazy.” The language used to express deviance marks the body and may have a great deal to do with how people see themselves in relation to others (Butler 1990). This research was conducted as a service- learning project within the context of a university course on the geography of health. It results from collaboration between the North Carolina Office on Disability and Health (NCODH), three undergraduate students and their professor, and a GIS/computer cartography specialist at the university library. Following a request for information from NCODH, the students, in consultation with NCODH staff members, 62
Transcript of Disability in North Carolina: Spatial Distributions and …The North Carolina Geographer 65 NC...
The North Carolina Geographer
Disability in North Carolina:Spatial Distributions and Access to Care
Karine DubeQueen Elizabeth House, Pembroke College
Oxford University
Examination of the spatial patterns of disability rates by North Carolina county reveals regional patterns with easternand mountain counties having higher levels of disabilities. Income and ethnic measures show the most frequentstatistically significant associations with disability rates. Case studies of three counties – Mecklenburg, Chatham, andHalifax – show that residents in the counties with the greatest need for disability services have the poorest geographicaccess to them. These results have implications for those who make policies concerning the disabled. The paperdemonstrates the benefits of collaboration between university students and a North Carolina state agency.
, Volume 11, 2003, pp. 62-73
Elizabeth Hauser, Colleen Longfellow,Amanda Clarke Henley, and Wil Gesler
University of North Carolina at Chapel Hill
IntroductionDisability is a serious problem in the U.S.
Approximately 20% of Americans (around 54 millionpeople) experience an activity limitation due to aphysical or mental impairment or health condition.The 1998 and 1999 North Carolina Behavioral RiskFactor Surveillance System indicated that 21% of non-institutionalized adults experience activity limitationas a result of a health condition or perceive that theyhave a disability (Division of Public Health, StateCenter for Health Statistics, 2001). To compoundthe situation, disability is associated with several otherproblems, including poverty, low educationalattainment, and difficulty in obtaining social services.Despite the burden on society of disability, however,it is only recently that geographers have begun to studythis problem (Gleeson 1999).
Recent work by geographers and others pointstoward the idea that disability is a social construction.A person is labeled as disabled when s/he fails to meetsocietal norms for such activities as employment,schooling, or self-care. Thus, for example, the inabilityto walk is a serious problem for most people in alltimes and places, but the inability to drive becomesespecially serious in communities where residential
areas are distant from services and access to publictransportation is limited.
Most people pursue their daily activities in thebelief that everyone is physically and mentally fit. Thisnotion, called ableism, “refers to ideas, practices,institutions, and social relations that presume able-bodiness, and by so doing, construct persons withdisabilities as marginalized, oppressed, and largelyinvisible ‘others’” (Chouinard 1997, p. 380). Beingdisabled leads to stigmatization and misunderstanding.The disabled are often subject to such psychologicallydamaging labels as “crippled” or “crazy.” The languageused to express deviance marks the body and may havea great deal to do with how people see themselves inrelation to others (Butler 1990).
This research was conducted as a service-learning project within the context of a universitycourse on the geography of health. It results fromcollaboration between the North Carolina Office onDisability and Health (NCODH), threeundergraduate students and their professor, and aGIS/computer cartography specialist at theuniversity library. Following a request forinformation from NCODH, the students, inconsultation with NCODH staff members,
62
63The North Carolina Geographer
developed a term project that met both the needs ofthe state agency and a class requirement to carry outa group research project.
NCODH wanted to examine the prevalence ofpeople with various disabilities across NorthCarolina, as well as identify factors influencing thedistribution of disability. The agency also wantedto know what types of services were offered by stateagencies for people with disability, with a particularemphasis on three counties – Mecklenburg,Chatham, and Halifax – that have differentpopulation characteristics. These requests weretranslated for the purpose of this study into twoaims with a spatial focus:(1) Examine the spatial patterns of people with
various types of disability at the county leveland what factors might be related to thesepatterns, and
(2) Examine the accessibility of populations inMecklenburg, Chatham, and Halifaxcounties to services that cater to the needsof the disabled.
BackgroundLike many health problems, disability is difficult
to define. There are hundreds of differentdisabilities. Some are present at birth (e.g., hearingimpairment); others are the result of occupationalhazards (e.g., loss of limbs), aging (e.g., arthritis), orthe psychological stresses of life (e.g., mental illness).Disability is often difficult to observe, and requiressubjective assessment by both the affected individualand verification by members of the individual’speers. The limited training of physicians in certifyingdisabilities and the different definitions of disabilityused by federal (e.g., Social Security, VocationalRehabilitation) agencies, state and local governments,and the military, lead to a bureaucratic maze that isdifficult for people with disabilities to navigate.Furthermore, measuring disability is often beset withproblems, including the lack of reliability and validityof instruments, most of which are poorlystandardized and produce non-comparable estimates(Elwan 1999). It is important to note thatdefinitional issues underlie some of the difficultiesin statistical analyses of disability distributions.
Disability is linked with several other problems.Disabled people (and their families) are more likelythan the rest of the population to live in poverty(Elwan 1999). It is difficult to determine whetherpoverty leads to disability or vice versa. Poor peoplemay become disabled because they face unsafeworking conditions or cannot afford to pay formedical care that might mitigate injuries or chronicillnesses. On the other hand, people may becomepoor because they are disabled, lose their jobs, andhave to pay for health care. Many employers areunwilling to hire disabled people, fearing that theywill be unproductive or have vocational needs thatwould disrupt workplace rhythms.
From the preceding discussion, we wouldexpect degree of disability in North Carolina to berelated to income level. Disability may also be relatedto rurality. Twenty-three percent of the non-metropolitan population has disabilities, comparedto eighteen percent in metropolitan areas (NationalCenter for the Dissemination of Disability Research2002). Furthermore, rurality is associated with olderpopulations, lower incomes, less education, and lessavailability of support services and transportation.
Consideration of rurality leads one to also thinkabout the role of occupation in creating disabilities asmany rural jobs such as farming, mining, and loggingare among the most physically dangerous (Enders andSeekins 1999). About 2000 farm workers have afinger, arm, or leg amputated every year (NorthCarolina Dept. of Agriculture & Consumer Services2001). Certain populations such as migrant farmworkers may be especially vulnerable: a NorthCarolina survey reported that 44.5% of migrant farmworker households had a disabled individual(InterAmerica Research Association 1974).
A possible association is also expected betweenethnicity and disability because of the links betweenethnicity, poverty, and rurality. Disadvantagedminority groups such as African Americans andHispanics have higher levels of poverty thanEuropean Americans and African Americans areoverrepresented in rural areas.
In the US, without comprehensive maintenanceprograms and other schemes available, disabledpeople are usually considered to be the responsibility
64 Dube et al.
of their families; publicly funded entitlements arerare, and rehabilitation services are not widelyavailable. The problem of access to benefits fordisabled people appears to be especially acute inNorth Carolina: “The Social Security Administrationtakes months – and often years – to approve claimsit receives for disability benefits” (Krueger 2003).
Additionally, many poor people with disabilitieslack appropriate resources to access health care.Insurance companies are often reluctant to pay forspecialized care or nontraditional means of healthcare, such as stress management, chiropractic, andacupuncture. Surveys have shown that, nationwide,up to 46% of persons with disability use publictransport regularly, compared with five to six percentof the overall population (Gleeson et al. 1996). Thus,if a needed health facility is not serviced by publictransit, it will be inaccessible to many of the disabled.In addition, the disabled are at a disadvantaged interms of access to or the ability to cope with neededtransportation to care.
Measuring geographic access to care has a longtradition in health geography (Joseph and Philips1984; Ricketts et al. 1994). Traditionally, thesemeasures include the availability of health carepersonnel, distances traveled to care (Euclidean,road, time), and utilization rates in differentgeographic areas. Church and Marston (2003),however, argue that traditional methods ofmeasuring accessibility are flawed when applied topeople with disabilities because they do not accountfor the physical and mobility differences betweenpeople that might affect travel time, effort, andsuccessful utilization of care.
Studies of disability by geographers can be tracedto concerns, starting in the early 1970s, with mentalillness and social dependency (e.g., Dear and Taylor1982; Dear and Wolch 1987). Several scholars workingwith disability felt that “impairment” should cover avariety of health problems, including chronic illness,but should not be defined in the language of thebiomedical model (Gleeson 1999; see also Butler andBowlby 1997; Dyck 1995). In the last decade, onecan discern a new “turn” to disability studies, beginningwith Golledge’s seminal (1993) article, and picked upby others (e.g., Dorn 1994; Parr 1997; Moss and Dyck
2003). This work provides a valuable theoreticalbackground to this study, which is, in comparison, amore traditional geographic investigation of spatialdistributions and geographic accessibility.
MethodsUnits of Analysis
For aim (1), examination of spatial patterns ofdisability in North Carolina, the geographic unitsof analysis chosen were the 100 counties in the state.Numbers of people with various disabilities in eachcounty are large enough to calculate stable rates formapping and statistical analysis.
For aim (2), examination of accessibility todisability services, three counties were chosen that werestretched out along the rural-urban continuum andthus had very different characteristics such as populationsize and percent urban. Mecklenburg is a highlypopulated and largely urban county (96.24% in 2000),centered on Charlotte, the largest city in the state.Chatham, at the edge of the Research Triangle, is acounty that follows a fairly typical pattern of evolvingfrom a rural to a more urban county (19.27% urbanin 2000). Many residents commute to work in Raleigh,Durham, and Chapel Hill. Halifax is a relatively remotecounty, with no metropolitan area nearby; however, itwas 42.65% urban in 2000.
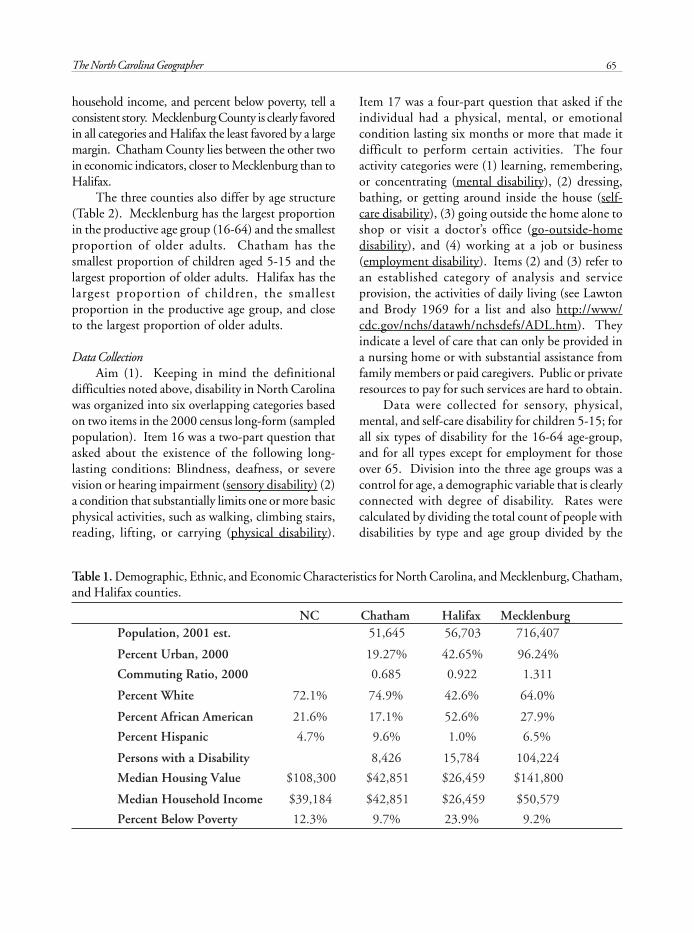
It is important for the analysis that follows toprofile some salient characteristics of the study counties(Table 1). The relatively low commuting ratio forChatham County indicates that a substantialproportion of residents work outside the county; manyof them, presumably, in Raleigh, Durham, Chapel Hill,or Research Triangle Park. In contrast, the relativelyhigh commuting ratio for Mecklenburg suggests thatmany people commute to Charlotte from outside thecounty. Differences in the ethnic composition ofcounty populations are quite striking. Over half ofHalifax’s population is African American, while onlyabout one-sixth of the residents of Chatham and one-fourth of the residents of Mecklenburg belong to thisgroup. In contrast, almost ten percent of Chatham’spopulation is Hispanic, reflecting the recent wave ofimmigration into the Triangle Area, whereas only onepercent of the Halifax population is Hispanic. Threeeconomic indicators, median housing value, median
65The North Carolina Geographer
NC Chatham Halifax MecklenburgPopulation, 2001 est. 51,645 56,703 716,407
Percent Urban, 2000 19.27% 42.65% 96.24%
Commuting Ratio, 2000 0.685 0.922 1.311
Percent White 72.1% 74.9% 42.6% 64.0%
Percent African American 21.6% 17.1% 52.6% 27.9%
Percent Hispanic 4.7% 9.6% 1.0% 6.5%
Persons with a Disability 8,426 15,784 104,224
Median Housing Value $108,300 $42,851 $26,459 $141,800
Median Household Income $39,184 $42,851 $26,459 $50,579
Percent Below Poverty 12.3% 9.7% 23.9% 9.2%
household income, and percent below poverty, tell aconsistent story. Mecklenburg County is clearly favoredin all categories and Halifax the least favored by a largemargin. Chatham County lies between the other twoin economic indicators, closer to Mecklenburg than toHalifax.
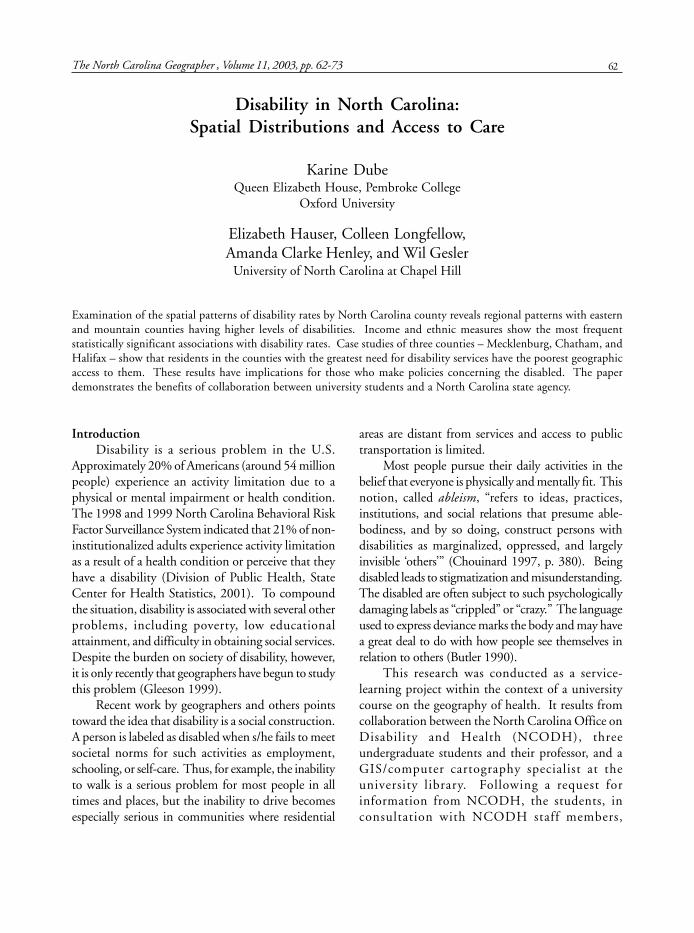
The three counties also differ by age structure(Table 2). Mecklenburg has the largest proportionin the productive age group (16-64) and the smallestproportion of older adults. Chatham has thesmallest proportion of children aged 5-15 and thelargest proportion of older adults. Halifax has thelargest proportion of children, the smallestproportion in the productive age group, and closeto the largest proportion of older adults.
Data CollectionAim (1). Keeping in mind the definitional
difficulties noted above, disability in North Carolinawas organized into six overlapping categories basedon two items in the 2000 census long-form (sampledpopulation). Item 16 was a two-part question thatasked about the existence of the following long-lasting conditions: Blindness, deafness, or severevision or hearing impairment (sensory disability) (2)a condition that substantially limits one or more basicphysical activities, such as walking, climbing stairs,reading, lifting, or carrying (physical disability).
Item 17 was a four-part question that asked if theindividual had a physical, mental, or emotionalcondition lasting six months or more that made itdifficult to perform certain activities. The fouractivity categories were (1) learning, remembering,or concentrating (mental disability), (2) dressing,bathing, or getting around inside the house (self-care disability), (3) going outside the home alone toshop or visit a doctor’s office (go-outside-homedisability), and (4) working at a job or business(employment disability). Items (2) and (3) refer toan established category of analysis and serviceprovision, the activities of daily living (see Lawtonand Brody 1969 for a list and also http://www/cdc.gov/nchs/datawh/nchsdefs/ADL.htm). Theyindicate a level of care that can only be provided ina nursing home or with substantial assistance fromfamily members or paid caregivers. Public or privateresources to pay for such services are hard to obtain.
Data were collected for sensory, physical,mental, and self-care disability for children 5-15; forall six types of disability for the 16-64 age-group,and for all types except for employment for thoseover 65. Division into the three age groups was acontrol for age, a demographic variable that is clearlyconnected with degree of disability. Rates werecalculated by dividing the total count of people withdisabilities by type and age group divided by the
Table 1. Demographic, Ethnic, and Economic Characteristics for North Carolina, and Mecklenburg, Chatham,and Halifax counties.
66
AgeGroup
DisabilityType
% ofPopulation
DisabilityRate
% ofPopulation
DisabilityRate
% ofPopulation
DisabilityRate
% ofPopulation
DisabilityRate
5-15 15.2 15.4 14.0 17.4Sensory 1.0 1.0 0.8 1.9Physical 1.0 0.8 0.4 2.4Mental 4.9 4.1 3.9 5.7
Self-care 0.9 0.9 0.5 1.816-64 64.3 68.4 64.1 59.4
Sensory 2.5 1.7 2.3 3.8Physical 7.1 4.2 5.6 12.1Mental 3.7 2.5 2.6 6.9
Self-care 1.9 1.3 1.4 3.4Go-out 6.8 5.8 5.1 11.2Employ. 13.3 11.0 11.4 19.2
65+ 11.5 8.1 14.7 14.3Sensory 15.4 12.6 13.9 19.4Physical 32.3 27.8 27.8 41.2Mental 13.2 11.6 10.7 17.3
Self-care 11.3 9.7 8.9 16.0Go-out 22.7 20.3 17.8 30.8
total population in that age group. Disabled ratesby type and age group were mapped by county, usingArcView (Environmental Systems ResearchInstitute, Inc. 2002).
To examine factors that might be related to thespatial distribution of various types of disability, dataon a set of variables that the literature suggested mightbe associated with disability were collected for countiesfrom the 2000 Census. These included three incomemeasures (per capita income, median householdincome, and percent below poverty), percent urban,percent in primary activities (farming, fishing, andforestry), and two measures of ethnicity, percentAfrican American, and percent Hispanic. Bivariateand multivariate regressions were performed usingthese variables and disability rates by disability typeand age group (15 regressions in total).
Aim (2). Seven services (Department of SocialServices, Independent Living RehabilitationProgram, Vocational Rehabilitation Services, Services
for the Deaf and Hard of Hearing, Division ofServices for the Blind, Division of Aging, and MentalHealth, Developmental Disabilities, and SubstanceAbuse) were selected as potential sources of care forthe disabled. The locations of these facilities acrossNorth Carolina were geo-coded by zip-code centroidand placed on maps of the state. Then maps weremade showing where these services were locatedeither within the three study counties (Mecklenburg,Chatham, and Halifax) or in surrounding counties(the closest service of a particular type to the casestudy county centroid was chosen). These mapsenabled the examination of access to care for disabledresidents of the three counties.
ResultsTable 2 shows disability rates for North Carolina
and the three case study counties. As expected, ratesare low for children aged 5-15, ranging from 14.0percent to 17.4 percent, but increase to sometimes
Table 2. Percent of population and disability rates by age groups for North Carolina, and Mecklenburg,Chatham, and Halifax counties.
Dube et al.
North Carolina Mecklenberg Chatham Halifax
67The North Carolina Geographer
alarming proportions for the productive and olderage groups (e.g., 19.2 percent for employmentdisability in Halifax for those 16-64 and 41.2 percentfor physical disability in the same county for thoseover 65). In North Carolina, almost one-third (32.3percent) of older adults reported a physical disability,and almost a fourth (22.7 percent) said a disabilityinhibited their ability to go outside the home. Thereare clear differences in disability rates among thethree selected counties. Mecklenburg rates areconsistently lower than or equal to state rates. Incontrast, rates for Halifax are always higher thanNorth Carolina rates, often by fifty percent or more.In addition, Halifax rates are always higher than
those for the other two case study counties.Chatham’s rates are always lower than state rates;they are sometimes higher and sometimes lowerthan Mecklenburg’s rates. Overall, Halifax has adecidedly heavy disability burden.
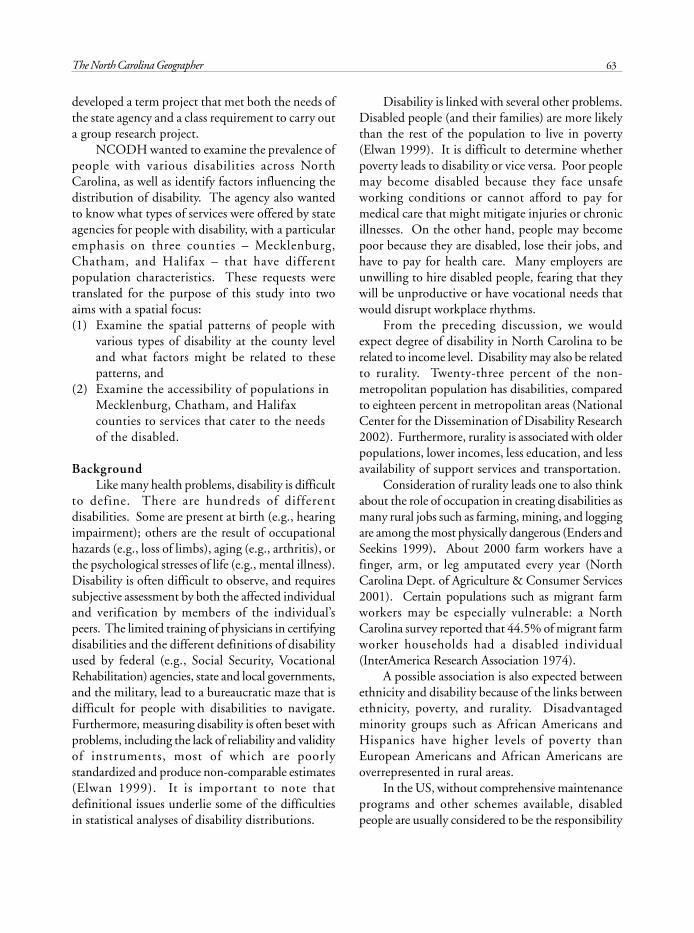
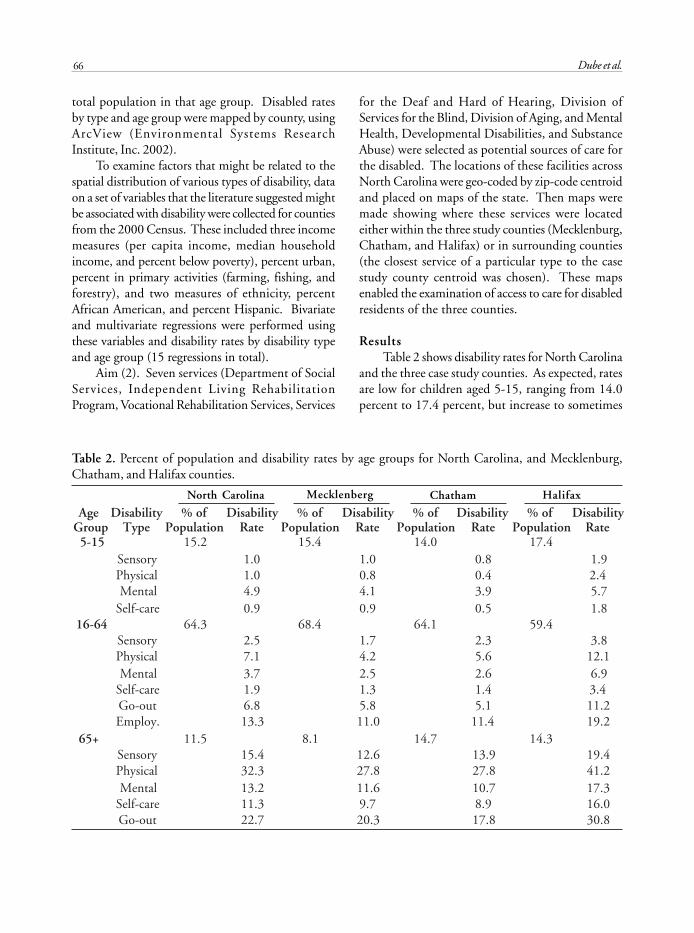
It is impossible to describe in detail the spatialpatterns of the fifteen age group-disability rates byNorth Carolina County. Very generally, dividing thestate into the traditional Eastern (coastal plain andtidewater), Piedmont, and Mountain regions, it wasfound that (1) the Eastern region, especially thenortheast and southeastern counties, had the highestdisability rates, (2) Mountain counties had the nexthighest rates, and (3) the Piedmont region had the
Figure 1. Mentaldisability rates forage group 5-15 bycounty in NorthCarolina (percents)
Figure 2. Employ-ment disabilityrates for age group16-64 by county inNorth Carolina(percents)

68
lowest rates. Figures 1 through 4, which show mentaldisability rates for children 5-15, employment disabilityrates for age group 16-64, and sensory and self-caredisability rates for those 65 and older, respectively, werechosen as illustrations because they showed some ofthe stronger patterns, but they generally represent otherdisability map patterns as well.
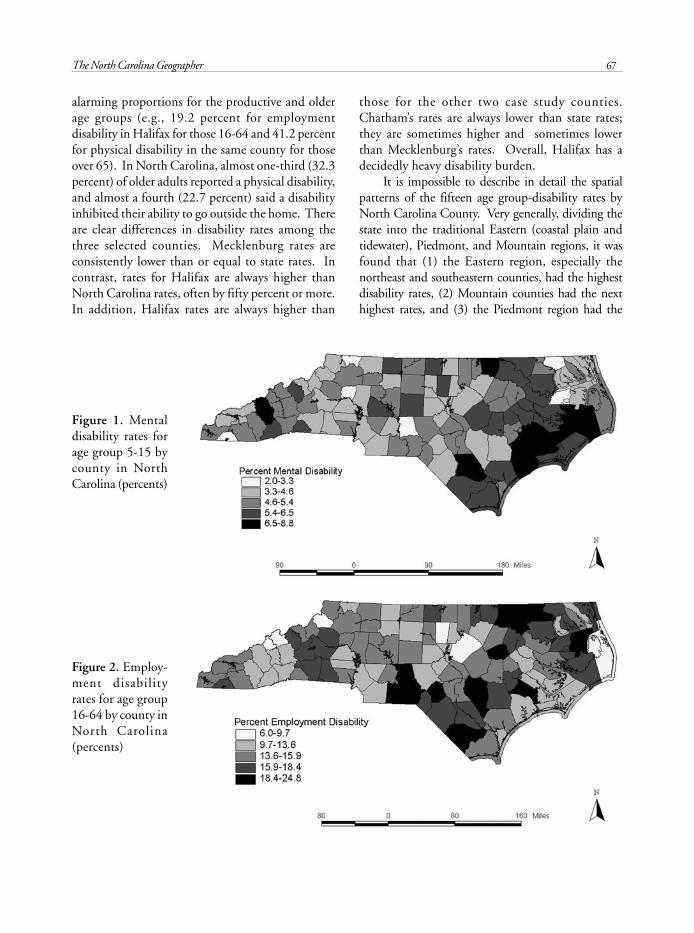
Results of regressing the seven predictorvariables on disability rates by North Carolinacounties are shown in Table 3. For children 5-15,R-squared values were very low and only twoindependent variables were significantly associatedwith disability rates. Percent in primary activitieswas, contrary to expectation, negatively associated
with sensory disability (t = -2.10, p = 0.038). Forself-care, percent African-American was positivelyassociated with disability (t = 2.53, p = 0.0129), inthe expected direction.
For the 16-64 age group, all R-squares were 0.44or more and all were significant at the 0.0001 level.Two economic independent variables, per capitaincome and median household income, were involvedin models for all six disability rates. For mental, goingoutside, and employment disabilities, percent African-American showed a positive association. The modelsfor older adults also had fairly high R-squared valuesand, again, all were significant at the 0.0001 level.Income variables dominated as independent variables
Figure 3. Sensorydisability rates forage group 65+ bycounty in NorthCarolina (percents)
Figure 4. Self-caredisability rates forage group 65+ bycounty in NorthCarolina (percents)
Dube et al.
69The North Carolina Geographer
AgeGroup
DisabilityType
Per CapitaIncome
MedianHousehold
Income
%BelowPoverty
%Urban
%PrimaryActivities
%African
American%
HispanicAdj.R sq. P
5-15 Sensory -2.10* .03 .0380Physical .13 .0055Mental .04 .1459Self-care 2.53* .05 .0129
16-64 Sensory -8.87** .44 .0001Physical -13.32** .64 .0001Mental -11.09** 2.27* .62 .0001Self-care -9.97** .50 .0001Go-out -9.73** 8.04** .72 .0001Employ. -8.32** 3.13** .53 .0001
65+ Sensory -5.10** 2.12* -3.57** .47 .0001Physical -10.66** .53 .0001Mental -7.76** 2.76** .38 .0001Self-care -4.01** 3.47** .51 .0001Go-out -7.25** .34 .0001
Table 3. Results of regressions of predictor variables on disability rates by age group for 100 North Carolina counties.*significant at the 0.05 level; **significant at the 0.01 level.
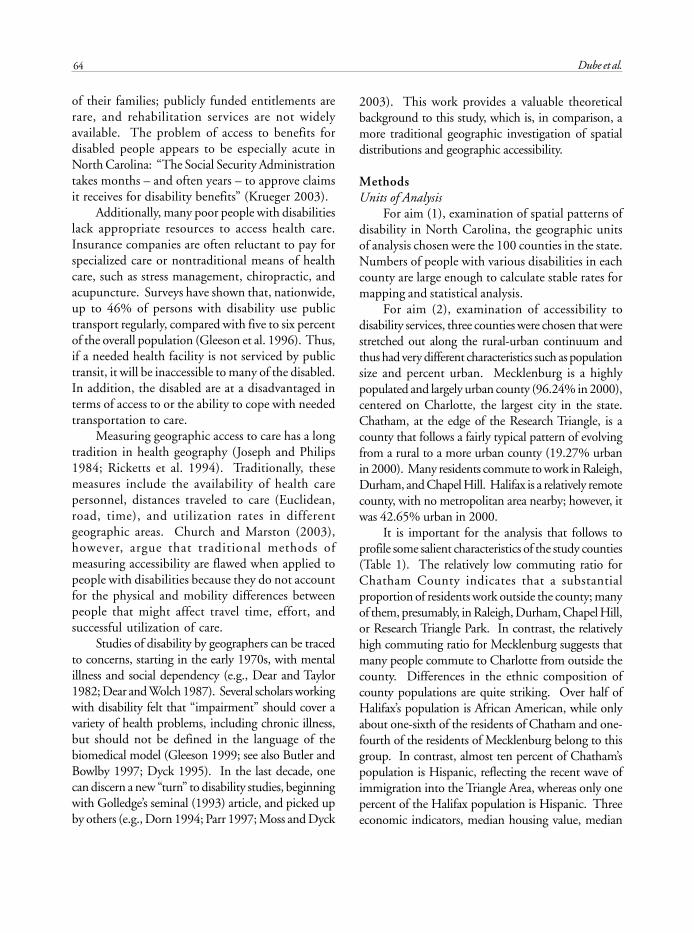
Figure 5. Locations of disability services in Mecklenburg County,NC
70
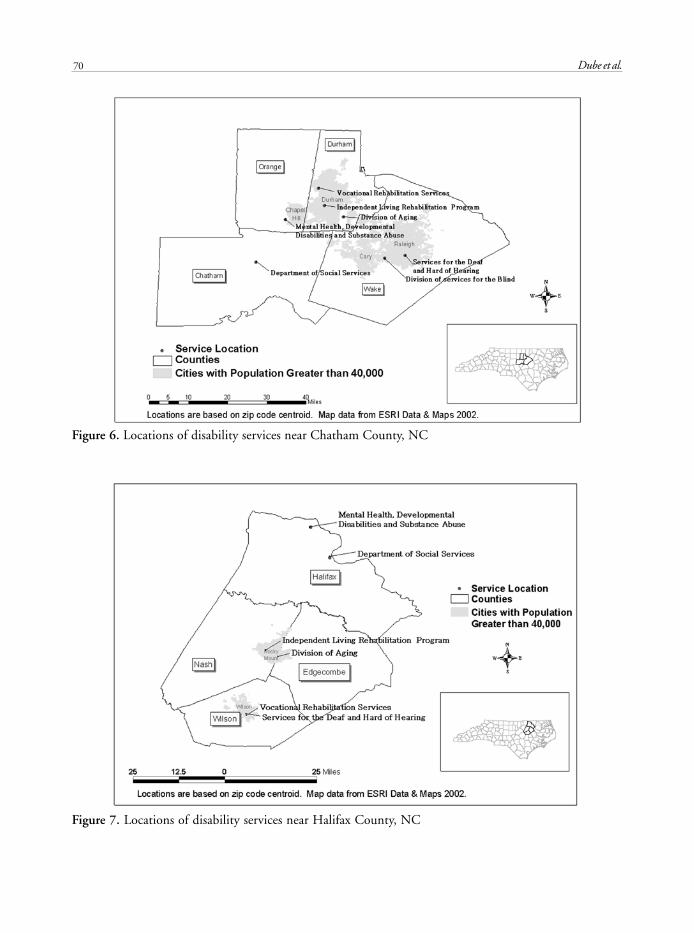
Figure 6. Locations of disability services near Chatham County, NC
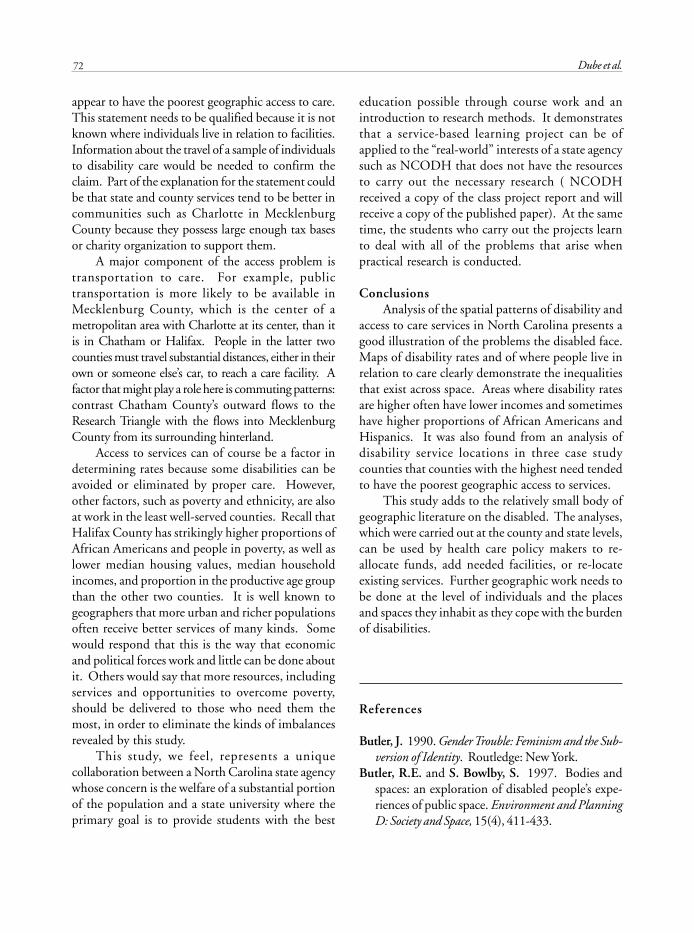
Figure 7. Locations of disability services near Halifax County, NC
Dube et al.

71The North Carolina Geographer
associated with disability. For sensory disability,contrary to expectation, percent African-Americanshowed a negative association (t = -3.57, p = 0.0000),and for mental disability, percent Hispanic showed apositive association (t = 2.76, p = 0.0000), in linewith expectations.
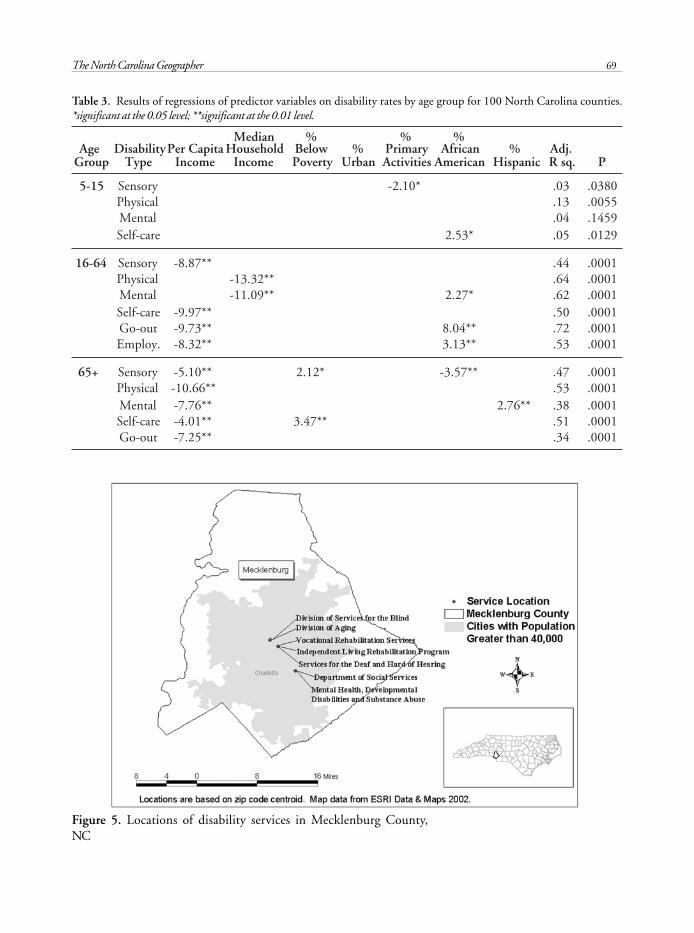
Figures 5 through 7 display disability services inor near the three case study counties. The maps showurban population concentrations of 40,000 or morein order to illustrate the access to care issue moregraphically. All seven services are found inMecklenburg County, located within Charlotte, thestate’s largest city. Only one of the services is locatedwithin Chatham County; for the rest, residents musttravel up to 30 miles to one of the major cities in theResearch Triangle, Raleigh, Durham, or Chapel Hill.Halifax County has two services; the rest are locatedin Rocky Mount or Wilson which are, again, up to30 miles away for some residents. Although it is notknown which facilities are accessible by public trans-portation, one can speculate that many services, es-pecially those farther away from residents, are onlyaccessible by car. It is also interesting to note thatMecklenburg services are most concentrated in thesame facilities, whereas those for Chatham Countyare the most geographically dispersed.
DiscussionMaps of disabilities (Figures 1 through 4)
consistently showed the highest rates for the easternpart of the state, the lowest rates for the Piedmont,and rates in between for the mountains. Thus thereare regional differences in disability. The disabilitymaps also pinpoint specific counties with relativelyhigh specific disability rates, which is importantinformation for service providers in those counties.Map patterns suggest that negative correlations existbetween income and disability and that positivecorrelations exist between percent African Americanand disability because disability rates tend to behigher in counties where incomes are lower andpercent African American higher. The maps alsoappear to support the hypothesis that rurality isrelated to level of disability as counties in both theeastern and mountain regions tend to be more rural.
The connection between higher disability ratesand lower incomes discussed in the literature was
the most significant result from the regression models(Table 3). For the 16-64 and 65+ age groups, oneof the three income variables (usually per capitaincome) was always positively associated withdisability. It is difficult to ascertain cause and effectin the disability-income relationship, however.People with lower incomes have less access to careand thus less opportunity to alleviate a disability; inturn, those with disabilities have less access to theeducational and employment opportunities thatgenerate income. Contrary to expectations and alsoexamination of disability rate maps, degree of rurality(measured by percent urban) was not significantlyassociated with disability. Perhaps the county levelof analysis masks within county differences inrurality. Also contrary to expectation, percent inprimary activity was not an important independentvariable; in fact the only model in which it wassignificant, sensory disability for children 5-15, itwas negative. Again, the county level of analysismay be inappropriate for examination of the role ofthis variable. Alternatively, accidents from primaryactivities may not be as important relative todisabilities created by other activities as was thought.
Ethnicity did play a role, as expected, in somemodels. Percent African-American was importantfor self-care for children; mental, going outside, andemployment for adults 16-64; and sensory for olderadults. Many African Americans are both poor andhave disabilities. Being African American could belinked to poverty or more severe poverty comparedto being non African American or it could be anindependent marker of disability risk because ofracial discrimination in such areas as housing,employment, medical care, or social services (seeLaVeist 1993). Percent Hispanic was positivelyassociated with mental disability for those 65 andolder, a noteworthy result for those providing servicesto this rapidly increasing minority group.
Comparing the disability rates (Table 2) to themaps of access of residents to disability services(Figures 5 through 7) is a clear illustration of theInverse Care Law, which states that: “The availabilityof good medical care tends to vary inversely with theneed for it in the population served” (Hart 1971, p.405). Those who have the highest disability rates
72
appear to have the poorest geographic access to care.This statement needs to be qualified because it is notknown where individuals live in relation to facilities.Information about the travel of a sample of individualsto disability care would be needed to confirm theclaim. Part of the explanation for the statement couldbe that state and county services tend to be better incommunities such as Charlotte in MecklenburgCounty because they possess large enough tax basesor charity organization to support them.
A major component of the access problem istransportation to care. For example, publictransportation is more likely to be available inMecklenburg County, which is the center of ametropolitan area with Charlotte at its center, than itis in Chatham or Halifax. People in the latter twocounties must travel substantial distances, either in theirown or someone else’s car, to reach a care facility. Afactor that might play a role here is commuting patterns:contrast Chatham County’s outward flows to theResearch Triangle with the flows into MecklenburgCounty from its surrounding hinterland.
Access to services can of course be a factor indetermining rates because some disabilities can beavoided or eliminated by proper care. However,other factors, such as poverty and ethnicity, are alsoat work in the least well-served counties. Recall thatHalifax County has strikingly higher proportions ofAfrican Americans and people in poverty, as well aslower median housing values, median householdincomes, and proportion in the productive age groupthan the other two counties. It is well known togeographers that more urban and richer populationsoften receive better services of many kinds. Somewould respond that this is the way that economicand political forces work and little can be done aboutit. Others would say that more resources, includingservices and opportunities to overcome poverty,should be delivered to those who need them themost, in order to eliminate the kinds of imbalancesrevealed by this study.
This study, we feel, represents a uniquecollaboration between a North Carolina state agencywhose concern is the welfare of a substantial portionof the population and a state university where theprimary goal is to provide students with the best
education possible through course work and anintroduction to research methods. It demonstratesthat a service-based learning project can be ofapplied to the “real-world” interests of a state agencysuch as NCODH that does not have the resourcesto carry out the necessary research ( NCODHreceived a copy of the class project report and willreceive a copy of the published paper). At the sametime, the students who carry out the projects learnto deal with all of the problems that arise whenpractical research is conducted.
ConclusionsAnalysis of the spatial patterns of disability and
access to care services in North Carolina presents agood illustration of the problems the disabled face.Maps of disability rates and of where people live inrelation to care clearly demonstrate the inequalitiesthat exist across space. Areas where disability ratesare higher often have lower incomes and sometimeshave higher proportions of African Americans andHispanics. It was also found from an analysis ofdisability service locations in three case studycounties that counties with the highest need tendedto have the poorest geographic access to services.
This study adds to the relatively small body ofgeographic literature on the disabled. The analyses,which were carried out at the county and state levels,can be used by health care policy makers to re-allocate funds, add needed facilities, or re-locateexisting services. Further geographic work needs tobe done at the level of individuals and the placesand spaces they inhabit as they cope with the burdenof disabilities.
References
Butler, J. 1990. Gender Trouble: Feminism and the Sub-version of Identity. Routledge: New York.
Butler, R.E. and S. Bowlby, S. 1997. Bodies andspaces: an exploration of disabled people’s expe-riences of public space. Environment and PlanningD: Society and Space, 15(4), 411-433.
Dube et al.
73The North Carolina Geographer
Chouinard, V. 1997. Making space for disablingdifferences: Challenging ableist geographies. En-vironment and Planning D: Society and Space, 15(4),379-387.
Church, R.L. and Marston, J.R. 2003. MeasuringAccessibility for People with a Disability. Geographi-cal Analysis, 35(1), 85-96.
Dear, M. and S.M. Taylor. 1982. Not on Our Street:Community Attitudes to Mental health Care. London:Pion.
Dear, M. and J. Wolch. 1987. Landscapes of De-spair: From Deinstitutionalization to Homelessness.Cambridge: Polity.
Division of Public Health, State Center forHealth Statistics. 2001. Raleigh, NC.
Dyck, I. 1995. Hidden geographies: the changinglifeworlds of women with disabilities. Social Sci-ence and Medicine 40, 307-320.
Dorn, M. 1994. Disability as Spatial Dissidence: A Cul-tural Geography of the Stigmatized Body. UnpublishedM.Sc. thesis, Pennsylvania State University.
Elwan, A. 1999. Poverty and Disability. Geneva: WorldHealth Organization.
Enders, A. and Seekins, T. 1999. Telecommunica-tions access for rural Americans with disabilities.Rural Development Perspectives, 14(3), 14-21.
Gleeson, B. 1999. Geographies of Disability. Lon-don: Routledge.
Golledge, R.G. 1993. Geography and the disabled:A survey with special reference to vision impairedand blind populations. Transactions, Institute of Brit-ish Geographers, 18(1), 63-85.
Golledge, R.G., Costanzo, M.C. and Marston,J.R. 1996. The Mass Transit Needs of a Non-DrivingDisabled Population. (Final Report MOU 167). Uni-versity of California Richmond Station PATH Di-vision.
Hart, J.T. 1971. The inverse care law. Lancet 1, 405-412.
InterAmerica Research Association. 1974. Handi-capped Migrant Farmworkers. Washington, DC: USDepartment of Health Education, and WelfarePublication OHD 75-2084.
Joseph, A.E. and Phillips, D.R. (1984). Accessbility& Utilization: Geographical Perspectives on Health CareDelivery. New York: Harper & Row.
Krueger, B. 2003. Wiped out by the wait.Newsobserver.com. Sunday, June 1.
LaVeist, T.A. 1993. Segregation, poverty, and em-powerment: Health consequences for AfricanAmericans. The Milbank Quarterly 71, 41-64.
Lawton, M.P. and Brody, E.M. 1969. Assessmentof older people: Self-maintaining and instrumen-tal activities of daily living. The Gerontologist, 9, 179-186.
Moss, P. and Dyck, I. 2003. Women, Body, Illness:Space and Identity in the Everyday Lives of Women withChronic Illness. Lanham, MD: Rowman &Littlefield.
National Center for the Dissemination of Dis-ability Research. 2002. Reaching rural commu-nities: Increasing access to disability research in-formation. The Research Exchange, 7(2), 1-3.
North Carolina Dept. of Agriculture & Con-sumer Services. 2001. Let’s make crop year 2001safer! Pesticide Update, 19(1), 1.
Parr, H. 1997. Mental health, public space, and thecity: Questions of individual and collective ac-cess. Environment and Planning D: Society and Space,15(4), 435-454.
Ricketts, T.C., Savitz, L.A., Gesler, W.M. andOsborne, D.N. (eds.) 1994. Geographic Meth-ods for Health Services Research. Lanham, MD:University Press of America.