Disability and Health in the United States 2001-2005 · Suggested citation Altman B, Bernstein A....
89
-
Upload
nguyentruc -
Category
Documents
-
view
218 -
download
0
Transcript of Disability and Health in the United States 2001-2005 · Suggested citation Altman B, Bernstein A....


Copyright information
All material appearing in this report is in the public domain and may be reproduced or copied without permission; citation as to source, however, is appreciated.
Suggested citation
Altman B, Bernstein A. Disability and health in the United States, 2001–2005. Hyattsville, MD: National Center for Health Statistics. 2008.
Library of Congress Cataloging-in-Publication Data
Disability and health in the United States, 2001–2005. p. ; cm. — (DHHS publication ; no. (PHS) 2008–1035) ‘‘July 2008.’’ Includes bibliographical references and index. ISBN-13: 978–0–8406–0621–1 ISBN-10: 0–8406–0621–4 1. People with disabilities—Health and hygiene—United States—
Statistics. 2. National Health Interview Survey (U.S.) I. National Health Interview Survey (U.S.) II. National Center for Health Statistics (U.S.) III. Series. [DNLM: 1. Disabled Persons—statistics & numerical data—United States. 2. Health Status Indicators—United States— Statistics. 3. Adult—United States. 4. Health Status—United States— Statistics. WA 900 AA1 D5994 2008]
HV1553.D5445 2008 362.40973’090511—dc22 2008009020


National Center for Health Statistics
Edward J. Sondik, Ph.D., Director
Jennifer H. Madans, Ph.D., Acting Co-Deputy Director
Michael H. Sadagursky, Acting Co-Deputy Director
Jennifer H. Madans, Ph.D., Associate Director for Science
Jennifer H. Madans, Ph.D., Acting Associate Director for Planning, Budget, and Legislation
Michael H. Sadagursky, Associate Director for Management and Operations
Lawrence H. Cox, Ph.D., Associate Director for Research and Methodology
Linda B. Torian, Acting Director for Information Technology
Linda B. Torian, Acting Director for Information Services
Linda T. Bilheimer, Ph.D., Associate Director for Analysis and Epidemiology
Charles J. Rothwell, M.S., Director for Vital Statistics
Jane E. Sisk, Ph.D., Director for Health Care Statistics
Jane F. Gentleman, Ph.D., Director for Health Interview Statistics
Clifford L. Johnson, M.S.P.H., Director for Health and Nutrition Examination Surveys
Office of Analysis and Epidemiology
Linda T. Bilheimer, Ph.D., Associate Director, Office of Analysis and Epidemiology
Diane M. Makuc, Dr.PH., Associate Director for Science, Office of Analysis and Epidemiology
Amy B. Bernstein, Sc.D., Chief, Analytic Studies Branch

Acknowledgments
The overall planning and coordinating of the content of this chartbook was conducted by the Office of Analysis and Epidemiology (OAE), National Center for Health Statistics (NCHS), under the direction of Barbara M. Altman, Amy B. Bernstein, Diane M. Makuc, and Linda T. Bilheimer.
Production of this chartbook was managed by Barbara M. Altman and Amy B. Bernstein. Data programming and analysis for charts were provided by Leif K. Karell of Social and Scientific Systems and Allen Cohen, formerly of NCHS. Graphs were drafted by La-Tonya Curl of OAE and data tables were prepared by Amy B. Bernstein. Technical assistance was provided by Susan S. Jack, Division of Health Interview Statistics, and Elizabeth K. Rasch, National Institutes of Health Clinical Center. Proofing was provided by Ilene B. Rosen of OAE.
This chartbook was edited by Megan M. Cox and Demarius V. Miller, CDC/CCHIS/NCHM/Division of Creative Services, Writer-Editor Services Branch, and typeset by Zung T. Le, CDC/CCHIS/NCHM/Division of Creative Services. Graphics were produced by Dorothy M. Day, CDC/CCHIS/ NCHM/Division of Creative Services.
Acknowledgments Page iii

Contents
Acknowledgments . . . . . . . . . . . . . . . . . . . . . . . . . . . . . . . . . . . . . . . . . . . . . . . . . . . . . . . . . . . . . . . . . . . . . . . . . . . . . . . . . . . . iii
Highlights . . . . . . . . . . . . . . . . . . . . . . . . . . . . . . . . . . . . . . . . . . . . . . . . . . . . . . . . . . . . . . . . . . . . . . . . . . . . . . . . . . . . . . . . . . 1
Introduction . . . . . . . . . . . . . . . . . . . . . . . . . . . . . . . . . . . . . . . . . . . . . . . . . . . . . . . . . . . . . . . . . . . . . . . . . . . . . . . . . . . . . . . . . 3
Disability Definition and Measurement . . . . . . . . . . . . . . . . . . . . . . . . . . . . . . . . . . . . . . . . . . . . . . . . . . . . . . . . . . . . . . . . . . . . . 5
Categorizing a Continuum . . . . . . . . . . . . . . . . . . . . . . . . . . . . . . . . . . . . . . . . . . . . . . . . . . . . . . . . . . . . . . . . . . . . . . . . . . . . 10
Consideration of Severity and Duration of Disability . . . . . . . . . . . . . . . . . . . . . . . . . . . . . . . . . . . . . . . . . . . . . . . . . . . . . . . . . 12
Methodological Considerations . . . . . . . . . . . . . . . . . . . . . . . . . . . . . . . . . . . . . . . . . . . . . . . . . . . . . . . . . . . . . . . . . . . . . . . . . 12
Summary . . . . . . . . . . . . . . . . . . . . . . . . . . . . . . . . . . . . . . . . . . . . . . . . . . . . . . . . . . . . . . . . . . . . . . . . . . . . . . . . . . . . . . . . 12
Sociodemographic Characteristics of the Population With Disabilities . . . . . . . . . . . . . . . . . . . . . . . . . . . . . . . . . . . . . . . . . . . . . . 14
Age . . . . . . . . . . . . . . . . . . . . . . . . . . . . . . . . . . . . . . . . . . . . . . . . . . . . . . . . . . . . . . . . . . . . . . . . . . . . . . . . . . . . . . . . . . . . 14
Sex. . . . . . . . . . . . . . . . . . . . . . . . . . . . . . . . . . . . . . . . . . . . . . . . . . . . . . . . . . . . . . . . . . . . . . . . . . . . . . . . . . . . . . . . . . . . . 18
Race and Ethnicity . . . . . . . . . . . . . . . . . . . . . . . . . . . . . . . . . . . . . . . . . . . . . . . . . . . . . . . . . . . . . . . . . . . . . . . . . . . . . . . . . 20
Education, Employment, and Income . . . . . . . . . . . . . . . . . . . . . . . . . . . . . . . . . . . . . . . . . . . . . . . . . . . . . . . . . . . . . . . . . . . . 22
Respondent-Assessed Health Status . . . . . . . . . . . . . . . . . . . . . . . . . . . . . . . . . . . . . . . . . . . . . . . . . . . . . . . . . . . . . . . . . . . . . . 27
Health Behaviors and Risk Factors . . . . . . . . . . . . . . . . . . . . . . . . . . . . . . . . . . . . . . . . . . . . . . . . . . . . . . . . . . . . . . . . . . . . . . . 34
Obesity and Overweight . . . . . . . . . . . . . . . . . . . . . . . . . . . . . . . . . . . . . . . . . . . . . . . . . . . . . . . . . . . . . . . . . . . . . . . . . . . . . 34
Cigarette Smoking. . . . . . . . . . . . . . . . . . . . . . . . . . . . . . . . . . . . . . . . . . . . . . . . . . . . . . . . . . . . . . . . . . . . . . . . . . . . . . . . . . 37
Alcohol Use and Abuse . . . . . . . . . . . . . . . . . . . . . . . . . . . . . . . . . . . . . . . . . . . . . . . . . . . . . . . . . . . . . . . . . . . . . . . . . . . . . . 37
Leisure-Time Physical Activity (Exercise) . . . . . . . . . . . . . . . . . . . . . . . . . . . . . . . . . . . . . . . . . . . . . . . . . . . . . . . . . . . . . . . . . 37
Access to Health Care . . . . . . . . . . . . . . . . . . . . . . . . . . . . . . . . . . . . . . . . . . . . . . . . . . . . . . . . . . . . . . . . . . . . . . . . . . . . . . . . 44
Usual Source of Medical Care . . . . . . . . . . . . . . . . . . . . . . . . . . . . . . . . . . . . . . . . . . . . . . . . . . . . . . . . . . . . . . . . . . . . . . . . . 44
Insurance Coverage . . . . . . . . . . . . . . . . . . . . . . . . . . . . . . . . . . . . . . . . . . . . . . . . . . . . . . . . . . . . . . . . . . . . . . . . . . . . . . . . 47
Use of Preventive Services . . . . . . . . . . . . . . . . . . . . . . . . . . . . . . . . . . . . . . . . . . . . . . . . . . . . . . . . . . . . . . . . . . . . . . . . . . . . . 53
Influenza Vaccination . . . . . . . . . . . . . . . . . . . . . . . . . . . . . . . . . . . . . . . . . . . . . . . . . . . . . . . . . . . . . . . . . . . . . . . . . . . . . . . . 53
Pap Test . . . . . . . . . . . . . . . . . . . . . . . . . . . . . . . . . . . . . . . . . . . . . . . . . . . . . . . . . . . . . . . . . . . . . . . . . . . . . . . . . . . . . . . . . 56
Mammography . . . . . . . . . . . . . . . . . . . . . . . . . . . . . . . . . . . . . . . . . . . . . . . . . . . . . . . . . . . . . . . . . . . . . . . . . . . . . . . . . . . . 56
Data Tables for Figures 1–33 . . . . . . . . . . . . . . . . . . . . . . . . . . . . . . . . . . . . . . . . . . . . . . . . . . . . . . . . . . . . . . . . . . . . . . . . . . . . 61
Appendix . . . . . . . . . . . . . . . . . . . . . . . . . . . . . . . . . . . . . . . . . . . . . . . . . . . . . . . . . . . . . . . . . . . . . . . . . . . . . . . . . . . . . . . . . . 74
National Health Interview Survey . . . . . . . . . . . . . . . . . . . . . . . . . . . . . . . . . . . . . . . . . . . . . . . . . . . . . . . . . . . . . . . . . . . . . . . 74
Construction of Disability Variables. . . . . . . . . . . . . . . . . . . . . . . . . . . . . . . . . . . . . . . . . . . . . . . . . . . . . . . . . . . . . . . . . . . . . . 75
Other Variable Descriptions . . . . . . . . . . . . . . . . . . . . . . . . . . . . . . . . . . . . . . . . . . . . . . . . . . . . . . . . . . . . . . . . . . . . . . . . . . . 77
Glossary . . . . . . . . . . . . . . . . . . . . . . . . . . . . . . . . . . . . . . . . . . . . . . . . . . . . . . . . . . . . . . . . . . . . . . . . . . . . . . . . . . . . . . . . . 79
List of Chartbook Figures
1. Prevalence of basic actions difficulty among all adults: United States, 2001–2005 . . . . . . . . . . . . . . . . . . . . . . . . . . . . . . . . 7 2. Prevalence of complex activity limitation among all adults: United States, 2001–2005 . . . . . . . . . . . . . . . . . . . . . . . . . . . . . 9 3. Prevalence of complex activity limitation among adults with basic actions difficulty: United States, 2001–2005 . . . . . . . . . . . 11
Contents Page v

4. Age distribution among disabled and nondisabled adults: United States, 2001–2005 . . . . . . . . . . . . . . . . . . . . . . . . . . . . . . 15 5. Age distribution among adults with basic actions difficulty, by type of difficulty: United States, 2001–2005 . . . . . . . . . . . . . . 16 6. Age distribution among adults with complex activity limitation, by type of limitation: United States, 2001–2005 . . . . . . . . . . . 17 7. Sex distribution among disabled and nondisabled adults: United States, 2001–2005 . . . . . . . . . . . . . . . . . . . . . . . . . . . . . . 19 8. Race and ethnicity distribution among disabled and nondisabled adults: United States, 2001–2005 . . . . . . . . . . . . . . . . . . . 21 9. Educational attainment distribution among disabled and nondisabled adults: United States, 2001–2005 . . . . . . . . . . . . . . . . 23
10. Employment among disabled and nondisabled adults aged 18–64 years: United States, 2001–2005 . . . . . . . . . . . . . . . . . . 24 11. Family income distribution among disabled and nondisabled adults: United States, 2001–2005 . . . . . . . . . . . . . . . . . . . . . . 25 12. Respondent-assessed health status distribution among disabled and nondisabled adults: United States, 2001–2005. . . . . . . 28 13. Respondent-assessed fair or poor health status among disabled and nondisabled adults, by age: United States,
2001–2005 . . . . . . . . . . . . . . . . . . . . . . . . . . . . . . . . . . . . . . . . . . . . . . . . . . . . . . . . . . . . . . . . . . . . . . . . . . . . . . . . . . . . 29 14. Respondent-assessed health status distribution among adults with basic actions difficulty, by type of difficulty:
United States, 2001–2005 . . . . . . . . . . . . . . . . . . . . . . . . . . . . . . . . . . . . . . . . . . . . . . . . . . . . . . . . . . . . . . . . . . . . . . . . . 30 15. Respondent-assessed health status distribution among adults with complex activity limitation, by type of limitation:
United States, 2001–2005 . . . . . . . . . . . . . . . . . . . . . . . . . . . . . . . . . . . . . . . . . . . . . . . . . . . . . . . . . . . . . . . . . . . . . . . . . 31 16. Respondent-assessed health status distribution among adults with any difficulty in movement, by severity of difficulty:
United States, 2001–2005 . . . . . . . . . . . . . . . . . . . . . . . . . . . . . . . . . . . . . . . . . . . . . . . . . . . . . . . . . . . . . . . . . . . . . . . . . 32 17. Body mass index (BMI) distribution among disabled and nondisabled adults: United States, 2001–2005. . . . . . . . . . . . . . . . 35 18. Obesity among disabled and nondisabled adults, by age: United States, 2001–2005 . . . . . . . . . . . . . . . . . . . . . . . . . . . . . . 36 19. Current cigarette smoking among disabled and nondisabled adults, by age: United States, 2001–2005 . . . . . . . . . . . . . . . . 39 20. Alcohol use among disabled and nondisabled adults, by age: United States, 2001–2005 . . . . . . . . . . . . . . . . . . . . . . . . . . . 40 21. Leisure-time physical activity distribution among disabled and nondisabled adults: United States, 2001–2005 . . . . . . . . . . . . 41 22. Regular leisure-time physical activity among disabled and nondisabled adults, by age: United States, 2001–2005 . . . . . . . . 42 23. No usual source of medical care among disabled and nondisabled adults, by age: United States, 2001–2005 . . . . . . . . . . . 45 24. Place of usual source of medical care among disabled and nondisabled adults with a usual place of care: United States,
2001–2005 . . . . . . . . . . . . . . . . . . . . . . . . . . . . . . . . . . . . . . . . . . . . . . . . . . . . . . . . . . . . . . . . . . . . . . . . . . . . . . . . . . . . 46 25. Insurance status at time of interview among disabled and nondisabled adults aged 18–64 years: United States,
2001–2005 . . . . . . . . . . . . . . . . . . . . . . . . . . . . . . . . . . . . . . . . . . . . . . . . . . . . . . . . . . . . . . . . . . . . . . . . . . . . . . . . . . . . 48 26. Insurance status at time of interview among adults aged 18–64 years with basic actions difficulty, by type of difficulty:
United States, 2001–2005 . . . . . . . . . . . . . . . . . . . . . . . . . . . . . . . . . . . . . . . . . . . . . . . . . . . . . . . . . . . . . . . . . . . . . . . . . 49 27. Insurance status at time of interview among adults aged 18–64 years with complex activity limitation, by type of
limitation: United States, 2001–2005. . . . . . . . . . . . . . . . . . . . . . . . . . . . . . . . . . . . . . . . . . . . . . . . . . . . . . . . . . . . . . . . . . 50 28. Insurance status at time of interview among adults aged 18–64 years with movement difficulty, by severity of difficulty:
United States, 2001–2005 . . . . . . . . . . . . . . . . . . . . . . . . . . . . . . . . . . . . . . . . . . . . . . . . . . . . . . . . . . . . . . . . . . . . . . . . . 51 29. Influenza vaccination within the past 12 months among disabled and nondisabled men aged 50 years and over:
United States, 2001–2005 . . . . . . . . . . . . . . . . . . . . . . . . . . . . . . . . . . . . . . . . . . . . . . . . . . . . . . . . . . . . . . . . . . . . . . . . . 54 30. Influenza vaccination within the past 12 months among disabled and nondisabled women aged 50 years and over:
United States, 2001–2005 . . . . . . . . . . . . . . . . . . . . . . . . . . . . . . . . . . . . . . . . . . . . . . . . . . . . . . . . . . . . . . . . . . . . . . . . . 55 31. Pap test within the past 3 years among disabled and nondisabled women aged 18 years and over: United States,
2003–2005 . . . . . . . . . . . . . . . . . . . . . . . . . . . . . . . . . . . . . . . . . . . . . . . . . . . . . . . . . . . . . . . . . . . . . . . . . . . . . . . . . . . . 57 32. Mammography within the past 2 years among disabled and nondisabled women aged 50 years and over: United States,
2001–2005 . . . . . . . . . . . . . . . . . . . . . . . . . . . . . . . . . . . . . . . . . . . . . . . . . . . . . . . . . . . . . . . . . . . . . . . . . . . . . . . . . . . . 58 33. Influenza vaccination, Pap test, and mammography among women with movement difficulty, by severity of difficulty:
United States, 2001–2005 . . . . . . . . . . . . . . . . . . . . . . . . . . . . . . . . . . . . . . . . . . . . . . . . . . . . . . . . . . . . . . . . . . . . . . . . . 59
Page vi Contents

Highlights
Disability and Health in the United States, 2001–2005 examines health-related differences between disabled and nondisabled noninstitutionalized adults aged 18 years and over using data from the National Health Interview Survey (NHIS). The basic actions difficulty measure of disability used in this report identifies noninstitutionalized adults with respondent-reported difficulties in movement or sensory, emotional, or cognitive functioning that is associated with some health problem. The complex activity limitation measure of disability identifies noninstitutionalized adults with respondent-reported limitations in self-care tasks (activities of daily living (ADL) or instrumental activities of daily living (IADL)) work limitations, or limitations or restrictions in the ability to participate fully in social activities.
On average, during 2001–2005, almost 30% of the noninstitutionalized adult U.S. population (approximately 62 million people) had basic actions difficulty, as indicated by reporting at least some difficulty with basic movement or sensory, cognitive, or emotional difficulties (Figure 1).
More than one-fifth of the noninstitutionalized adult population reported difficulty with basic movement actions such as walking, bending, reaching overhead, or using their fingers to grasp something. About 13% of the adult population reported vision or hearing difficulties (hearing is measured without the use of hearing aids). Only 3% of the population reported emotional difficulties, and 3% reported cognitive difficulties (Figure 1).
Work limitation was the most commonly reported complex activity limitation (12% of adults), followed by social limitation (7%) and self-care limitation (4%) (Figure 2).
Adults under 65 years of age made up 64% of those with complex activity limitation and 67% of those with difficulty with basic actions. (Figure 4).
More than one-half of noninstitutionalized adults with self-care limitations were aged 65 years and over (52%), and approximately one-half of adults with emotional difficulties were under 45 years of age (Figures 5 and 6).
Adults without disabilities were more than twice as likely to have a college degree as adults with complex activity limitation and 70% more likely to have a college degree than those with basic actions difficulty (Figure 9).
Among adults aged 18–64 years, employment was substantially lower among those with difficulty in basic actions (42% reported working for pay in the past week) compared
Highlights
with adults with no disability (75% reported working during the past week) (Figure 10).
One-half of adults with complex activity limitation and almost 40% of those with basic actions difficulty reported family income below 200% of the federal poverty threshold, compared with only about one-quarter of nondisabled adults (Figure 11).
About one-half of adults with a complex activity limitation assessed their overall health as fair or poor, as did about one-third of people with basic actions difficulty but only 3% of adults with no disability (Figure 12).
Adults were more likely to report fair or poor health status if they had cognitive difficulty (64%) or self-care limitations (65%) than adults with other types of basic actions difficulty or complex activity limitation (Figures 14–15).
Almost one-third of adults with complex activity limitation and 30% of adults with basic actions difficulty were obese (on the basis of self-reported height and weight) during the 2001–2005 period, compared with 19% of adults with no reported disability (Figure 18).
About 40% of adults aged 18–44 years with either complex activity limitation or basic actions difficulty reported currently smoking, compared with 22% of nondisabled adults in this age group (Figure 19).
Only 15% of adults with complex activity limitation reported engaging in regular physical activity, compared with 21% of adults with basic actions difficulties and 35% of adults with no disability (Figure 21).
Among adults 18–64 years of age, 19% of those with no disability or with a basic action difficulty and 17% of those with a complex activity limitation were uninsured at a point in time. People with emotional difficulties most often reported being uninsured (28%), followed by people with sensory limitations (seeing or hearing difficulties) (20%) (Figures 25 and 26).
Among adults aged 50 years and over, men and women with complex activity limitation or basic actions difficulty were more likely to have received an influenza vaccination in the past 12 months compared with nondisabled men and women (Figures 29 and 30).
About 83% of women aged 18 years and over without disabilities had a Pap test in the last 3 years, compared with 71% of women with basic actions difficulty and only 65% of women with complex activity limitation (Figure 31).
Page 1

Among women aged 50 years and over, mammography rates were higher for nondisabled women (74%) than for women with basic actions difficulty (67%) or complex activity limitation (61%) (Figure 32).
Page 2 Highlights

Introduction
The issue of health and well-being of people with disabilities is receiving recognition as a national and international priority, as several recent initiatives indicate.
Healthy People 2010 (HP 2010) is a comprehensive, nationwide health promotion and disease prevention agenda designed to serve as a framework for improving the health of all people in the United States during the first decade of the 21st century. This agenda targets the health of people with disabilities in two ways: through a specific focus area, Disability and Secondary Conditions, which identifies specific objectives for the health of people with disabilities, and through the designation of disability status as a characteristic for disparities surveillance in more than 100 objectives in the other focus areas of HP 2010 (1).
At a conference held in 2003 sponsored by The Arc of the United States (a grassroots organization of and for people with intellectual and developmental disabilities), 12 separate federal agencies from the U.S. Department of Health and Human Services and the Department of Education, along with leading private professional and advocacy organizations, focused attention on improving the health and well-being of people with intellectual and developmental disability through public policy, advocacy, and service delivery. Outcomes included the development of a research agenda for increased participation and community integration for this population (2).
The Surgeon General’s 2005 ‘‘Call to Action to Improve the Health and Wellness of Persons with Disabilities’’ sought to raise recognition of the potential for people with disabilities to lead long, healthy, and productive lives. It also aimed to enhance health care professionals’ knowledge, diagnostic tools, and treatment of the whole person, while at the same time increasing the involvement of people with disabilities in developing and maintaining healthy lifestyles as well as promoting independence though access to health care and support services (3).
The United Nations (U.N.) Convention on the Rights of Persons with Disabilities, adopted by the U.N. General Assembly in 2006 and currently ratified by 12 members, addresses the equalization of opportunities for people with disabilities in all aspects of life, including the right to equitable and accessible health care (4).
Introduction
The accomplishment of these initiatives requires high quality data to uncover disparities, plan programs, and monitor and evaluate progress. Despite these important multiple uses, available data on the health of people with disabilities have not provided sufficient information to address the issues. To date, data are not presented in a uniform, comprehensive, or cohesive way, nor are they collected in all surveys or with appropriate periodicity by federal agencies that collect data. Federal agencies and private sector organizations recently expressed the need for a critical review of current survey data on disability. Their concerns include: 1) the availability and accessibility of data on disability, 2) important gaps in data collection, and 3) the need for improving survey questions about disability (5).
This chartbook seeks, in part, to meet some of these concerns and to narrow the information gap. Using data from NHIS, the chartbook adheres closely to the definitions of disability provided in current theoretical and legislative models (6,7) and focuses on the health of the noninstitutionalized adult population with disabilities in the United States. The first section, ‘‘Disability Definition and Measurement’’ provides background on how disability has been defined and measured as well as an explanation of the two constructs used for defining and measuring disability status in this chartbook: basic actions difficulty and complex activity limitation. The sections that follow provide comparative analyses for the populations with and without disability across the following dimensions:
Sociodemographic characteristics and personal resources including education, income, and employment.
Health status.
Health risk factors.
Access to care.
Clinical preventive services.
References
1. National Center on Birth Defects and Developmental Disabilities. Healthy People 2010 Disability and Secondary Conditions Focus Area 6. Reports and Proceedings. Atlanta, GA: Centers for Disease Control and Prevention. Available from: http://www.cdc.gov/ncbddd/dh. June 2003.
2. Lakin KC, Turnbull A, editors; for The ARC of the United States and American Association on Mental Retardation. National goals and research for people with intellectual and developmental disabilities. Washington, DC: American Association on Mental Retardation. 2005.
Page 3

3. U.S. Department of Health and Human Services, Office of the Surgeon General. Surgeon General’s call to action to improve the health and wellness of persons with disabilities. Rockville, MD: Public Health Service. Available from: http://www.surgeongeneral.gov/library/disabilities/. 2005.
4. United Nations. Convention on the rights of persons with disabilities. Available from: www.un.org/disabilities/. 2006.
5. National Council on Disability. National disability policy: A progress report [online]. Available from: http://www.ncd.gov/ newsroom/publications/2006/progress_report.htm. 2006.
6. Brandt EN, Pope AM. Enabling America: Assessing the role of rehabilitation science and engineering. Washington, DC: National Academy Press. 1997.
7. Americans with Disabilities Act of 1990, 42 USCA §§12101–213 (West Supp. 1991) and 47 USCA §§225, 611 (West 1991).
Page 4 Introduction

Disability Definition and Measurement
Disability is currently recognized as a multidimensional and dynamic concept that involves both individual and environmental factors. Translating such a complex concept into a relatively short set of questions suitable for large scale surveys presents substantial methodological challenges, and survey measurement has had difficulty keeping pace with contemporary concepts of disability. Furthermore, because of the varying data collection objectives (including estimating the prevalence of disability in a population, monitoring the level of functioning in a population, assessing the need for the provision and the appropriate distribution of services, and monitoring the equalization of opportunities), disability has not been defined, measured, or analyzed in a consistent manner. This inconsistency has led to widely differing estimates of the prevalence of disability in the United States (1). The intent of this chartbook is to identify clearly and consistently the conceptual elements of disability that underlie current theoretical models of disability and that are available in NHIS. The chartbook aims to use those theoretical concepts, as measurable in NHIS, to examine health-related differences between people identified as having disability and those not having disability.
On the basis of the current theoretical and legislative models of disability, there is general agreement that the disabling process is associated with health problems or impairments caused by health conditions, accidental injuries, or congenital differences (2). Originally the connection with health conditions was considered so strong that disability was measured by identifying health conditions or impairments only, and this is still done in many applications. Nonetheless, the evolution over the past 50 years of disability theory and concepts, including more recent work by the Institute of Medicine (3) and the World Health Organization (4), has looked beyond health conditions to recognize the more complex nature of disability. The elements identified in these theoretical approaches include 1) the physical, emotional, or mental difficulties in functioning that can accompany a health condition or impairment; 2) the restrictions in social participation that can result from the functional difficulties associated with those health conditions or impairments; and 3) the facilitating or limiting effects of the environment, both social and physical, in which the person lives and works. Other factors (such as a person’s social and financial resources) can also play a role. This conceptual approach is very consistent with the current legislative approach represented by the Americans with Disabilities Act (ADA),
Disability Definition and Measurement
which seeks to ensure equalized opportunity for the population with disabilities. ADA defines disability in terms of the person’s physical, mental, or emotional functioning problems that coexist with his or her levels of participation in the activities required to be integrated into the social world.
Thus, the current understanding of the disablement process is associated with the nature of the interaction a person has with all aspects of his or her environment, given the person’s level of physical, mental, or emotional functioning. This interaction can affect the level of social participation the person experiences. To examine theoretical relationships or to monitor the effects of legislation which seeks to provide equalization of opportunity, such as ADA, disparities must be tracked by disability status in the same way that disparities among races and between men and women have been addressed.
For this chartbook, NHIS data has been combined for the years 2001 through 2005. NHIS monitors the health of the U.S. civilian noninstitutionalized population through the collection and analysis of data on a broad range of health and health related topics. A major strength of this survey lies in the richness of the data, which allows health measures to be analyzed by many demographic and socioeconomic characteristics. Combining 5 years of data ensures that stable estimates can be calculated for the populations of interest. The survey includes questions that can be used to construct two of the conceptual components that have been identified in disability models and in disability legislation. These conceptual components are identified as basic actions difficulty and complex activity limitation.
Basic actions difficulty captures limitations or difficulties in movement and sensory, emotional, or mental functioning that are associated with some health problem.
NHIS data do not cover the full range of functional levels for all classes of basic actions (see the Appendix for exact questions), but the available questions can identify a range of difficulty levels in core areas of functioning:
Movement (walking, standing, bending or kneeling, reaching overhead, and using the hands and fingers).
Sensory functioning (the ability of a person to see and hear what is going on around him or her).
Selected elements of emotional functioning—in particular, feelings that interfere with accomplishing daily activities.
Important elements in cognitive functioning, specifically difficulties with remembering or experiencing confusion.
Page 5

Basic actions represent the primary building blocks of functioning that are necessary for a person to accomplish the tasks necessary to maintain independence and to participate in social role activities.
Assistive devices are often used to compensate for functional limitations, particularly for movement limitation (use of canes, wheelchairs, or other devices to facilitate movement) or sensory functioning (use of hearing aids or devices to improve visual functioning, such as special glasses, lights, or magnifying equipment). Questions used in NHIS ask if a person has difficulty carrying out the physical or sensory actions without the use of assistive devices. With the exception of glasses or contact lenses (which are in common use), the estimates of difficulty in basic actions reported in this chartbook address functioning without the use of assistive devices. The level of difficulty or limitation in basic actions that the person experiences with a device is not available in this data set.
On average, over the period 2001–2005, almost 30% of the adult U.S. population—approximately 62 million people— indicated at least some difficulty with basic movement, sensory, cognitive, or emotional actions (Figure 1 and data table for Figures 1 and 2). The most common difficulty is related to movement, with more than one-fifth of the population reporting difficulties with basic physical actions such as walking, bending, reaching overhead, or using their fingers to grasp something. More than 13% of the adult population reported noticeable vision or hearing difficulties (hearing is measured without the use of hearing aids). Emotional or cognitive difficulties were much less prevalent, with only 3% of the population reporting each difficulty. This measure does not cover all of the basic actions necessary to function in society; however, the measure does include those difficulties that are reported most frequently. A summary indicator that represents all those who report difficulty with one or more of the possible basic actions measures is also constructed and used in this report.
Page 6 Disability Definition and Measurement

Figure 1. Prevalence of basic actions difficulty among all adults: United States, 2001–2005
Type of basicactions
difficulty Any
basic actions difficulty
29.5
Movement difficulty 21.7
Emotional difficulty 3.1
Seeing or hearing
difficulty 13.1
Cognitive difficulty 2.8
NOTES: Disability categories are notmutually exclusive. See data table fordata points, standard errors, andadditional notes.
0 5 10
SOURCE: CDC/NCHS, National HealthInterview Survey.
Percent 15 20 25 30
Disability Definition and Measurement Page 7

Complex activity limitation describes limitations or restrictions in a person’s ability to participate fully in social role activities such as working or maintaining a household.
Complex activity consists of the tasks and organized activities that, when executed, make up numerous social roles. Complex activity performance requires the execution of a combination of more than one of the basic actions. NHIS obtains information on many (but not all) complex activities that comprise participation in social roles, including the following:
Difficulties experienced with social and leisure activities, represented in these data by questions about attending movies or sporting events, visiting with friends, pursuing hobbies, or engaging in relaxation activities.
Perceived ability to work, which is a core aspect of social participation for the majority of the U.S. population and is represented by respondents’ self-defined limitations in the kind or amount of work they can do or their inability to work at a job or business.
Maintaining independence, including self-care and the ability to carry out activities associated with maintaining a household, such as shopping, cooking, and taking care of bills (measures are based on questions concerning ADL and IADL). These are the simplest of the complex activities, but limitations in doing them usually reflect the most severe difficulties in basic actions.
Similar to the format for the questions about basic action difficulty, the questions about social and leisure activities are prefaced by the phrase ‘‘by yourself and without using any special equipment, how difficult is it for you to____?’’ However, questions about self-care or independence and the ability to work do not contain instructions on whether the respondent should evaluate functioning with or without the use of assistive devices. Some respondents may use such devices and may report no difficulty functioning when using the devices. Thus, difficulty in basic actions may not limit complex activities as a result of the successful use of assistive devices.
A smaller proportion of the population (14%) experiences complex activity limitation than basic actions difficulty, with the most common problem being work limitations (12%) (Figure 2).
Page 8 Disability Definition and Measurement

Figure 2. Prevalence of complex activity limitation among all adults: United States, 2001–2005
Type ofcomplex
activitylimitation
Any complex activity
limitation
Social activity limitation
Work limitation
Self-care (ADL or IADL)
limitation
NOTES: Disability categories are not SOURCE: CDC/NCHS, National Healthmutually exclusive. See data table for Interview Survey. data points, standard errors, andadditional notes. ADL is activities of daily living. IADL is instrumental activities of daily living.
6.9
4.1
14.3
11.6
0 5 10 15 20 Percent
Disability Definition and Measurement Page 9

Categorizing a Continuum
The questions (including the answer categories) used to measure the two broad disability components discussed above are described in detail in the Appendix. The nature of the answer categories for these questions and how they are used in the construction of the variables will affect the resulting prevalence estimates. Disability measures are not inherently categorical variables. However, to understand more fully the characterizations of the populations who have basic actions difficulty and complex activity limitation, the selection of a cut point or a set of cut points that divides the population into groups is necessary. One group, for the purpose of analysis, is considered as not having a disability. The selection of the cut point will affect the size of the population identified as having a disability as well as the characteristics of those with a disability. If a less severe level of functional difficulties is used to define a person as having a disability, the prevalence estimates will be higher and the identified group will be heterogeneous in terms of their difficulties. If the cut point is based on a more severe level of restriction, prevalence rates will be lower and the group will be more homogenous in terms of functioning.
For this chartbook, two measures of disability are used—basic action difficulty and complex activity limitation. These measures can overlap and identify the same person: some who experience difficulty with basic actions can also experience limitations in complex activity. However, some people with basic actions difficulty will not exhibit complex activity limitation either because their difficulties are not too severe or because environmental or other accommodations have limited the effect of the basic actions difficulty. If the cut points are based on more severe levels of restriction, the relationship between the two measures will be stronger.
The relationship between basic actions difficulty and complex activity limitation—Measures of disability based on basic actions and complex activity, although not mutually exclusive, identify different aspects of the disablement process and represent different metrics of measurement. In order to understand the nature of the relationship between the two measures, one chart has been provided (Figure 3) that departs from the format of the other charts in this chartbook. Subsequent charts show if and how people with disabilities differ from those without disabilities in terms of the selected health behaviors, sources of care, and use of preventive care, but Figure 3 examines how well having a difficulty in basic actions predicts having a limitation in any of the complex activities. Figure 3 illustrates that relationship by showing what
Page 10
percentages of people with any basic actions difficulty also experience any type of limitation in complex activity.
Five measures were developed to summarize types of basic actions difficulty. Adults could report that they had difficulty with one action alone or that they had difficulty with that action and any other of the basic actions measured. The first four measures of basic actions difficulty used in Figure 3 include people who report difficulty with each basic action alone (movement, seeing or hearing, emotional, or cognitive difficulty), not in combination with any other type of basic action. All possible combinations of multiple difficulties (two or more) are then collapsed into the fifth measure that identifies the respondents who report difficulty in at least two of the four basic actions.
Complex activity limitation is captured through four measures: any limitations in social or leisure activities, any difficulty or inability to work, self-care limitation (reflected by any ADL or IADL limitation), and an overall combination measure, which reflects any individual or combination of limitations in the first three measures.
The prevalence of the four measures of complex activity limitation among people with a single basic actions difficulty or a combination of basic actions difficulties is shown in Figure 3. Prevalence of work limitations is higher among people with cognitive difficulties and those with a combination of more than one basic actions difficulty. Approximately 55% of people with difficulty in a combination of two or more basic actions and almost 67% of those with cognitive difficulties report being limited in the amount or kind of work they can do or being unable to work. By contrast, seeing or hearing difficulties alone have only a small association with complex activity limitation.
Disability Definition and Measurement

Figure 3. Prevalence of complex activity limitation among adults with basic actions difficulty: United States, 2001–2005
Type of basicactions
difficulty
Movement difficulty
only
Emotional difficulty
only
Seeing or hearing
difficulty only
Cognitive difficulty
only
More than one basic
actions difficulty
0 10 20 30 40 50 60 70 80
Self-care (ADL or IADL) limitation Work limitation
Any complex activity limitation
20.8
31.9
40.7
9.2
8.3
1.8
1.4
2.1
9.4
9.0
66.8
30.5
70.8
8.1
13.8
19.2
41.3
54.8
66.6
27.3
Social activity limitation
Type of complex activity limitation
Percent
NOTES: See data table for data points, SOURCE: CDC/NCHS, National Healthstandard errors, and additional notes. Interview Survey. ADL is activities of daily living. IADL is instrumental activities of daily living.
Disability Definition and Measurement Page 11

Consideration of Severity and Duration of Disability
Characterizing the severity of difficulty in performing basic actions or complex activities as well as determining how long a person has experienced the difficulty is necessary for describing disability in a population. For most of the measures used in the chartbook, severity cannot be measured. However, level of difficulty is obtained for the measure of movement and allows for construction of a severity scale (see Appendix for details of the scale’s construction). This measure does not provide information on all people identified as having difficulty with basic actions or limitation with complex activity, but it does provide information on an important subset of this population and adds another dimension to the information provided in this chartbook.
Data on duration of difficulty in basic actions and limitation in complex activity is limited in NHIS. However, respondents are asked about the length of time they have had chronic conditions that cause limitation of activity. Conditions that have persisted more than 3 months (with the exception of pregnancy) are considered chronic. In the rare instance that an acute condition has lasted 3 months or more (such as a broken leg) and caused limitation in activity, that respondent is also included here. For the measures of self-care (ADL or IADL) limitation and cognitive difficulty, the person must have had a permanent chronic condition (such as diabetes) or a condition and limitation for at least 3 months.
Methodological Considerations
When investigating the health care needs, sources of care, and receipt of preventive care among people with disabilities, information about their sociodemographic characteristics and level of resources must be included. This chartbook does not focus on the relationship between the individual characteristics and the risk of becoming disabled, but rather it emphasizes the characteristics of those with limitations in basic actions or complex activity and how these sociodemographic and economic characteristics, in conjunction with the limitations, affect the use of the health care system.
Although the disablement process can occur at any age, it increases in frequency as age increases, especially in middle to late adulthood. This is reflected in Figure 4 in the next
Page 12
section, which shows that the disabled groups are older than the nondisabled group. The relationship between disability and age can affect how information on people with disabilities is interpreted. The main focus of this chartbook is to describe the status of people with basic actions difficulty and complex activity limitation across a range of activities and behaviors. Estimates have not been age adjusted because some aspects of the disablement process are related to the aging process. In addition, in cases such as receipt of health care services, age parity should be examined. To address that issue, age specific estimates are provided. Additionally, comparing utilization that is independent of age is important. To address these issues, age specific estimates are provided for some indicators together with the overall estimates. One should note that NHIS includes only the U.S. civilian non-institutionalized population. Those residing in long-term care settings ranging from residential care facilities to nursing homes and group homes will differ considerably from the populations described here.
Summary
The following measures, either separately or together, are used to understand the associations between disability and health status, health risk behaviors, sources of care, and use of preventive services and insurance coverage.
Two general measures of disability are used. The first reflects a person’s difficulty in any of four basic actions: movement, sensory functions, emotional functions, or cognitive functions. The second measure reflects the experience of limitation in any of three complex activities: limitations in social activities, limitations or the inability to work, and limitations in maintaining independence through self-care.
Different types of difficulty in basic actions or different types of limitation in complex activity are presented to illustrate their unique relationships to the health indicator investigated. When that is the case, the subcategories of the primary measures (difficulty in basic actions and limitation in complex activity) are also shown.
Among adults with a difficulty in movement, a measure of severity is included. Unfortunately, similar severity measures are not available in NHIS for the other basic actions and complex activity measures.
Disability Definition and Measurement

References
1. National Council on Disability. National disability policy: A progress report [online]. Available from: http://www.ncd.gov/ newsroom/publications/2006/progress_report.htm. 2006.
2. Pope AM, Tarlov AR. Disability in America: Toward a national agenda for prevention. Washington, DC: National Academy Press. 1991.
3. Brandt EN, Pope AM. Enabling America: Assessing the role of rehabilitation science and engineering. Washington, DC: National Academy Press. 1997.
4. World Health Organization. International classification of functioning, disability and health. Geneva: World Health Organization. 2001.
Disability Definition and Measurement Page 13

Sociodemographic Characteristics of the Population With Disabilities
Age
The aging of the population, particularly as the baby boomers reach their sixties, has focused attention on the potential for increasing numbers of people with disability. Although some evidence shows that aging-related disability rates may be decreasing (1), predictions are being made that increasing obesity rates will result in increasing disability related to diabetes, arthritis, and other obesity-related conditions. As a result, disability prevalence could increase to a greater extent than would be expected because of the change in the age distribution alone (2). Although 61% of the population aged 65 years and over reported difficulty in basic actions and 32% of this age group reported limitation in complex activities in 2001–2005 (data table for Figures 1 and 2), this age group made up only one-third of the population with basic actions difficulty and 36% of the population with complex activity limitation. That means that 64% of those with complex activity limitation and 67% of those with difficulty with basic actions were less than 65 years of age (data table for Figure 4).
When considering the health needs of people with disability, knowing whether some types of disability are more associated with advancing age than others and whether the age distribution varies by disability type is important (Figures 5 and 6). More than one-half of noninstitutionalized people with self-care limitations were aged 65 years or over, whereas approximately one-half of people with emotional difficulties were under 44 years of age (data table for Figures 5 and 6). Of those who were aged 65 years or over with any basic actions difficulty, only 13% reported emotional difficulties. Adults with work limitations were more likely to be in the age group 45–64 years (42%) than in younger or older age groups, in part because inability to work is an eligibility requirement necessary to receive Social Security Disability Income (SSDI). People aged 45–64 years are more likely to be eligible for SSDI than younger workers who may not have worked long enough to be eligible (requirement is 40 quarters during a specific time period), although there are some exceptions to this eligibility criterion. As the age of regular Social Security retirement eligibility increases to 67 years of age and over, the number of people reporting work limitations associated with difficulty in basic actions may increase.
Page 14 Sociodemographic Characteristics of the Population With Disabilities

Figure 4. Age distribution among disabled and nondisabled adults: United States, 2001–2005
Complex activity
limitation
Basic actions difficulty
No disability
65 years and over45–64 years 18–44 years
24.7
39.0
36.3
33.1
61.9
29.5
37.6
29.3
8.7
0 20 40 Percent
60 80
NOTE: See data table for data points,standard errors, and additional notes.
SOURCE: CDC/NCHS, National HealthInterview Survey.
100
Sociodemographic Characteristics of the Population With Disabilities Page 15

Figure 5. Age distribution among adults with basic actions difficulty, by type of difficulty: United States, 2001–2005
18–44 years 45–64 years 65 years and over
24.6 Movement
39.2 difficulty
36.2
48.3
Emotional39.1 difficulty
12.6
26.9 Seeing or
hearing 35.8 difficulty
37.3
22.7
Cognitive33.0 difficulty
44.4
0 20 40 60 80 100 Percent
NOTE: See data table for data points, SOURCE: CDC/NCHS, National Healthstandard errors, and additional notes. Interview Survey.
Page 16 Sociodemographic Characteristics of the Population With Disabilities

Figure 6. Age distribution among adults with complex activity limitation, by type of limitation: United States, 2001–2005
65 years and over 45–64 years 18–44 years
Self-care (ADL or IADL)
limitation
Work limitation
Social activity
limitation
23.1
38.4
38.5
34.2
17.2
30.8
41.6
24.2
52.0
0 20 40 Percent
60 80 100
NOTES: See data table for data points,standard errors, and additional notes. ADL is activities of daily living. IADL is instrumental activities of daily living.
SOURCE: CDC/NCHS, National HealthInterview Survey.
Sociodemographic Characteristics of the Population With Disabilities Page 17

Sex
Compared with the nondisabled population, a greater percentage of the populations with complex activity limitation or basic actions difficulty were women (Figure 7). Nondisabled adults were divided almost equally between men and women, whereas 60% of adults with either complex activity limitation or basic actions difficulty were women. Women live, on average, about 5 years longer than men and therefore may have more aging-related disability. However, women were also overrepresented in the population with emotional difficulty (64%), and emotional difficulty is not as likely to be associated with increasing age as other disabilities (Figures 5 and 6).
Page 18 Sociodemographic Characteristics of the Population With Disabilities

Figure 7. Sex distribution among disabled and nondisabled adults: United States, 2001–2005
Complex activity
limitation
Basic actions difficulty
No disability
0 20 40 60 80 100
Female Male
42.8
57.2
58.0
50.5
42.0
49.5
Percent
NOTE: See data table for data points, SOURCE: CDC/NCHS, National Healthstandard errors, and additional notes. Interview Survey.
Sociodemographic Characteristics of the Population With Disabilities Page 19

Race and Ethnicity
The racial and ethnic distribution in the population with disabilities differs from the racial and ethnic distribution of the population without disabilities (Figure 8). For those without disabilities, 70% were white, compared with adults with complex activity limitation (76% white) and adults with basic actions difficulty (77% white). The proportion of the populations who were black was similar for those with no disability and those with basic actions difficulty (11%). However, 13% of those with complex activity limitation were black. The population with complex activity limitation included far fewer people of Hispanic origin (7.8% compared with 13.2% without disabilities) or Asian adults (approximately 1% compared with 2.6% among nondisabled people). The differences in the population with basic actions difficulty were similar. The smaller proportion of Hispanics reflects in part their younger age distribution; however, the reasons that Asians make up a smaller proportion of the population with disabilities are not clear (3,4).
Page 20 Sociodemographic Characteristics of the Population With Disabilities
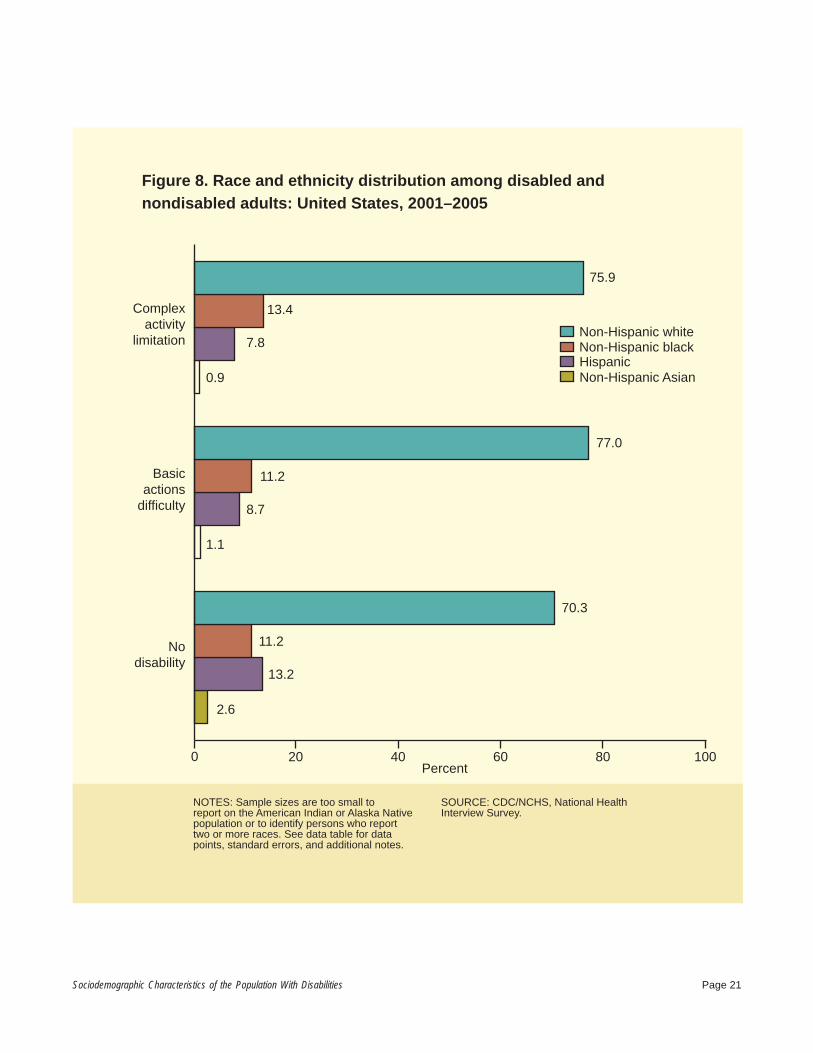
Figure 8. Race and ethnicity distribution among disabled and nondisabled adults: United States, 2001–2005
Complex activity
limitation
Basic actions difficulty
No disability
Percent
NOTES: Sample sizes are too small to SOURCE: CDC/NCHS, National Healthreport on the American Indian or Alaska Native Interview Survey. population or to identify persons who reporttwo or more races. See data table for data points, standard errors, and additional notes.
0 20 40 60 80 100
Non-Hispanic Asian Hispanic Non-Hispanic black Non-Hispanic white
75.9
13.4
7.8
0.9
77.0
11.2
8.7
1.1
70.3
11.2
13.2
2.6
Sociodemographic Characteristics of the Population With Disabilities Page 21

Education, Employment, and Income
Education
The age of onset of a disability can affect the level of education that a person attains. Early onset, at birth or in young adulthood, can affect people’s ability to complete their education or the type of education they receive and therefore their subsequent employment (5). However, the majority of people with a disability acquire that disability after they have completed their education, although acquisition of higher levels of education or opportunities to improve job skills may be restricted by the disability.
Figure 9 shows that education levels among adults with disabilities differed from those among people without disabilities. The percentage of adults with complex activity limitation who had less than a high school education (30%) was more than twice the percentage for people without a disability (14%) and was also higher than the percentage of adults with basic actions difficulty (24%). People without disabilities were more than twice as likely to have a college degree as people with complex activity limitation and 70% more likely to have a college degree than people with basic actions difficulty. These differentials may also reflect the lower education level of older cohorts.
Employment
Employment is a key issue in the field of disability policy. In the early 20th century, when much of the work depended on physical abilities to provide manual labor, the concern was to provide income subsidies for workers who experienced physical injuries or poor health. In recent years, the changing nature of work, the passage of ADA, and policy changes in the area of health care and welfare reform all point to an increasing opportunity for participation in the work force for people with disabilities (6,7). However, adults with disabilities were still less likely to be employed (in the week before the interview) than nondisabled adults during 2001–2005 (Figure 10).
Figure 10 shows the percentages of employed adults aged 18–64 years. Employment among people with difficulty in basic actions (42% reported working for pay in the past week) was substantially lower when compared with adults with no disability (75% reported working during the past week). If specific types of basic actions difficulty are examined, the result is that 43% of adults with seeing or hearing difficulty—but only 13% of adults with cognitive
Page 22
difficulty—were employed in the past week (unpublished analysis of NHIS data, 2001–2005).
Family Income
The relationships among education, employment, and disability are complex and (when observed within the current policy context) have been identified as a ‘‘poverty trap’’ (8,9). People with disabilities are less likely to be employed, as shown above, and may have less earning power even if they are able to work. The combined effects of the lower levels of both education and employment are directly evident in the lower family income among people with disabilities (Figure 11).
One-half of adults with complex activity limitation and almost 40% of those with basic actions difficulty reported family incomes below 200% of the federal poverty threshold, compared with only about one-fourth of nondisabled adults (Figure 11). Conversely, nondisabled adults were substantially more likely to be in the wealthiest income group than disabled adults. Furthermore, poor and low income people with disabilities may be more disadvantaged than nondisabled poor people because of their greater need for services or equipment.
Sociodemographic Characteristics of the Population With Disabilities

Figure 9. Educational attainment distribution among disabled and nondisabled adults: United States, 2001–2005
Less than high school29.9 High school graduate
Some collegeComplex 33.7 College graduate
activity limitation 24.5
11.9
23.9
Basic 32.8 actions
difficulty 26.6
16.7
13.6
28.0 No disability
30.0
28.4
0 20 40 60 80 100Percent
NOTE: See data table for data points, SOURCE: CDC/NCHS, National Healthstandard errors, and additional notes. Interview Survey.
Sociodemographic Characteristics of the Population With Disabilities Page 23

Figure 10. Employment among disabled and nondisabled adults aged 18–64 years: United States, 2001–2005
Complex activity
limitation
Basic actions difficulty
No disability
0 20 40 60 80 100
No job within last year Had job last week
23.3
69.3
51.2
75.4
41.9
18.0
Percent
NOTE: See data table for data points, SOURCE: CDC/NCHS, National Healthstandard errors, and additional notes. Interview Survey.
Page 24 Sociodemographic Characteristics of the Population With Disabilities

Figure 11. Family income distribution among disabled and nondisabled adults: United States, 2001–2005
Complex activity
limitation
Basic actions
difficulty
No disability
22.3
8.2
20.0
29.9
19.7 Family income as a percentageof poverty threshold
Below 100% 100%–less than 125%15.7 125%–less than 200% 200%–less than 400%6.1 400% or more
17.3
32.0
28.8
10.0
3.7
11.9
31.0
43.5
0 10 20 Percent
30 40 50
NOTE: See data table for data points,standard errors, and additional notes.
SOURCE: CDC/NCHS, National HealthInterview Survey.
Sociodemographic Characteristics of the Population With Disabilities Page 25

References
1. Freedman VA, Martin LG, Schoeni RF. Recent trends in disability and functioning among older adults in the United States: A systematic review. JAMA 288(24): 3137–46. 2002.
2. Reynolds SL, Saito Y, Crimmins EM. The impact of obesity on active life expectancy in older American men and women. Gerontologist 45(4): 438–44. 2005.
3. Steinmetz E. Americans with disabilities: 2002. Current Population Reports, P70–07. Washington, DC: U.S. Census Bureau. 2004.
4. National Center for the Dissemination of Disability Research. Disability, diversity and dissemination: A review of the literature on topics related to increasing the utilization of rehabilitation research outcomes among diverse consumer groups [online]. Research Exchange 4(1). Available from: http://www.ncddr.org/ products/researchexchange/v04n01/intro.html. 1999.
5. Pope AM, Tarlov AR. Disability in America: Toward a national agenda for prevention. Washington, DC: National Academy Press. 1991.
6. Loprest P, Maag P. The relationship between early disability onset and education and employment [online]. Urban Institute. Available from: http://www.urban.org/url.cfm?ID=410992. 2003.
7. Zwerling C, Whitten PS, Sprince NL, Davis CS, Wallace RB, Blanck PD, et al. Workforce participation by persons with disabilities: The National Health Interview Survey Disability Supplement, 1994 to 1995. J Occup Environ Med 44(4):358– 64. 2002.
8. Kruse D, Schur L. Does the definition affect the outcome? In: Stapleton DC, Burkhauser RV, editors. The decline in employment of people with disabilities. Kalamazoo, MI: W.E. Upjohn Institute for Employment Research. p. 279–98. 2003.
9. Stapleton DC, O’Day BL, Livermore GA, Imparato AJ. Dismantling the poverty trap: Disability policy for the twenty-first century. Milbank Q 84(4):701–32. 2006.
Page 26 Sociodemographic Characteristics of the Population With Disabilities

Respondent-Assessed Health Status
Respondent-assessed health status is obtained by asking the family respondent the following question about his or her health or the health of a family member: ‘‘Would you say {subject’s name} health is excellent, very good, good, fair, or poor?’’ This measure has been correlated with more objective measures of health and predictive of mortality and use of health care services (1,2). Although disability is correlated with overall poor self-rated health status (Figure 12), disability and health are not equivalent concepts.
About one-half of adults with a complex activity limitation assessed their overall health as fair or poor, as did about one-third of people with basic actions difficulty and only 3% of adults with no disability. Three-fourths of adults with no disability rated their health as excellent or very good, as did about one-third of adults with basic actions difficulty but only 18% of adults with complex activity limitation (Figure 12).
Overall health status declines with age among nondisabled adults (Figure 13) as well as among adults with disabilities. For all nondisabled adults, the percentage reporting fair or poor health increased with age such that those aged 65 years and over were more than twice as likely to report fair or poor health as those aged 18–44 years (7.3% compared with 2.4%). Among adults with basic actions difficulty, the percentage who reported fair or poor health increased from one-fifth at 18–44 years of age to more than one-third at 65 years of age and over. Among people in all age categories with any complex activity limitation, the percentage reporting fair or poor health was substantially greater than the percentage of those with any basic actions difficulty. More than one-third of adults with complex activity limitation 18–44 years of age and more than one-half (56%) of those 45–64 years of age reported fair or poor health. A slightly smaller percentage of noninstitutionalized adults with complex activity limitation aged 65 years and over reported fair or poor health (53%).
Looking at self-reported health status by type of difficulty, fair or poor health status was more likely to be reported by adults with cognitive difficulty (64%) or self-care limitations (65%) than by adults with other types of basic actions difficulty or complex activity limitation (Figures 14–15). Approximately 52% of those with emotional difficulty reported fair or poor health (Figure 14), which is of interest because those with emotional difficulty are more likely to be 18–44 years of age, and this age group generally reports better health (Figure 13). Finally, only 31% of adults with seeing or hearing difficulty reported fair or poor health.
Respondent-Assessed Health Status
Self-rated health status is also tied to severity of movement difficulty. Among those with the least severe movement difficulty, only 15% rated their health as fair or poor, but this percentage increased steadily to 77% among adults with the most severe levels of movement difficulty (Figure 16).
Page 27

Figure 12. Respondent-assessed health status distribution among disabled and nondisabled adults: United States, 2001–2005
Fair or poor Good Excellent or very good
No disability
Basic actions difficulty
Complex activity
limitation
18.1
31.1
50.8
31.5
75.0
21.6
33.8
34.7
3.4
0 20 40 Percent
60 80 100
NOTE: See data table for data points,standard errors, and additional notes.
SOURCE: CDC/NCHS, National HealthInterview Survey.
Page 28 Respondent-Assessed Health Status

Figure 13. Respondent-assessed fair or poor health status among disabled and nondisabled adults, by age: United States, 2001–2005
65 years and over
45–64 years
18–44 years
65 years and over
45–64 years
18–44 years
65 years and over
45–64 years
18–44 years 37.9
56.5
53.4
37.3
2.4
4.4
35.0
20.7
7.3
No disability
Basic actions difficulty
Complex activity limitation
0 20 40 60 80 Percent
NOTE: See data table for data points, SOURCE: CDC/NCHS, National Healthstandard errors, and additional notes. Interview Survey.
Respondent-Assessed Health Status Page 29

Figure 14. Respondent-assessed health status distribution among adults with basic actions difficulty, by type of difficulty: United States, 2001–2005
Fair or poor Good Excellent or very good
Cognitive difficulty
Seeing or hearing difficulty
Emotional difficulty
Movement difficulty
27.8
34.3
37.9
38.0
31.5
30.6
11.0
25.2
25.6
51.8
22.6
63.8
0 20 40 60 80 Percent
NOTE: See data table for data points, SOURCE: CDC/NCHS, National Healthstandard errors, and additional notes. Interview Survey.
Page 30 Respondent-Assessed Health Status

Figure 15. Respondent-assessed health status distribution among adults with complex activity limitation, by type of limitation: United States, 2001–2005
Excellent Good Fair or poor
Social activity
15.1
26.2 limitation
58.7
16.2
Work 30.5limitation
53.4
11.3 Self-care (ADL or 23.8
IADL) limitation
64.9
0 20 40 Percent
60 80 100
NOTES: See data table for data points,standard errors, and additional notes. ADL is activities of daily living. IADL is instrumental activities of daily living.
SOURCE: CDC/NCHS, National HealthInterview Survey.
Respondent-Assessed Health Status Page 31

Figure 16. Respondent-assessed health status distribution among adults with any difficulty in movement, by severity of difficulty: United States, 2001–2005
Least severe movement
difficulty
Level two
Level three
Level four
Most severe movement
difficulty
0 20 40 60 80 100
Fair or poor Good Excellent or very good48.2
37.0
77.2
14.8
41.2
36.0
46.1
11.7
24.7
63.6
17.9
30.3
28.5
6.2
16.6
Percent
NOTE: See data table for data points, SOURCE: CDC/NCHS, National Healthstandard errors, and additional notes. Interview Survey.
Page 32 Respondent-Assessed Health Status

References
1. DeSalvo KB, Fan VS, McDonell MB, Film SD. Predicting mortality and healthcare utilization with a single question. Health Serv Res 40(4):1234–46. 2003.
2. Kaplan GA, Goldberg DE, Everson SA, Cohen RD, Salonen R, Tuomilehto J, et al. Perceived health status and morbidity and mortality: Evidence from the Kuopio ischaemic heart disease risk factor study. Int J Epidemiol 25(2):259–65. 1995.
Respondent-Assessed Health Status Page 33
Health Behaviors and Risk Factors
Health promotion is a new area of concern for millions of people with a disability. Of particular concern is the prevention of secondary conditions and the maintenance of functional independence (1,2). Nutrition, fitness, and health behaviors are now seen as having relevance for this population.
Obesity and Overweight
Overweight and obesity can have serious health consequences for all people and particularly for people with disabilities because they can be precursors to secondary conditions that can complicate the treatment of the original condition associated with the disability. For example, overweight or obesity can aggravate any condition that results in mobility limitation and further affect a person’s ability to move around. Although research has found a strong association between disability and obesity (3,4), the causal sequence of that association is still in question. Studies have traced people who are overweight or obese to subsequent disabling consequences, but obesity can also follow the onset of physical or mental disabilities (5). However, whether obesity causes disability or results from disability, it has important health consequences that need to be addressed (5).
Adults with disabilities are less likely to be of healthy weight and more likely to be obese than adults without disability (Figure 17). On the basis of self-reported data of adults 18 years of age and over, almost one-third with complex activity limitation and 30% with basic actions difficulty were obese during the 2001–2005 period, compared with 19% of adults with no reported disability. Regardless of disability status, adults aged 45–64 years were most likely to be obese (Figure 18); however, adults aged 45–64 years without disabilities were less likely to be obese than those with a disability. Adults aged 65 years and over were least likely to be obese, although, once again, those with either basic actions difficulty or complex activity limitation had higher rates of obesity than those without disability (Figure 18).
When examining obesity rates by specific type of disability, rates were uniformly higher for those with any type of disability than for the nondisabled population, although some variation existed by specific disability type (data table for Figures 17 and 18). Adults with sensory or cognitive difficulty were least likely to be obese (27%) among people with disability. Among adults with movement difficulty, increasing levels of obesity were associated with increasing levels of
Page 34
severity of movement difficulty. About one-third of adults with a social or work limitation or emotional difficulty were obese, compared with less than 20% of adults with no disability.
Health Behaviors and Risk Factors

Figure 17. Body mass index (BMI) distribution among disabled and nondisabled adults: United States, 2001–2005
Complex activity
limitation
Basic actions difficulty
No disability
0 20 40 60 80 100
Obese Overweight, not obese Healthy weight Underweight
BMI category1.6
1.3
1.4
32.9
33.9
31.6
32.9
35.8
29.9
42.8
37.1
18.7
Percent
NOTE: See data table for data points, SOURCE: CDC/NCHS, National Healthstandard errors, and additional notes. Interview Survey.
Health Behaviors and Risk Factors Page 35

Figure 18. Obesity among disabled and nondisabled adults, by age: United States, 2001–2005
Complex activity
Percent
NOTE: See data table for data points, SOURCE: CDC/NCHS, National Healthstandard errors, and additional notes. Interview Survey.
0 20 40 60 80 100
65 years and over
45–64 years
18–44 years
65 years and over
45–64 years
18–44 years
65 years and over
45–64 years
18–44 years 29.8
38.0
26.1
24.3
17.8
21.5
36.2
28.4
15.6
No disability
Basic actions difficulty
limitation
Page 36 Health Behaviors and Risk Factors

Cigarette Smoking
Smoking is associated with a significantly increased risk of heart disease, stroke, lung and other types of cancer, and chronic lung diseases (6). Individuals with specific types of disabilities—including muscle weakness that affects breathing, respiratory-related problems, and cardiac-related problems— may be particularly vulnerable to the consequences of cigarette smoking. Cigarette smoking, therefore, may contribute to the onset of disability, result in additional health problems, or worsen existing problems among already disabled people (7).
Adults with disabilities are more likely to be current smokers than adults with no disability. About 40% of adults 18–44 years of age who have either complex activity limitation or basic actions difficulty reported currently smoking, compared with 22% of nondisabled adults in this age group (Figure 19). Smoking rates and differences in rates by disability status decrease with increased age; approximately 9% of adults aged 65 years and over in each disability status group were current smokers. Men were more likely to smoke than women in all disability status groups. People with emotional difficulties were by far the most likely to smoke (43%) compared with those who had other types of difficulties. Adults with cognitive difficulty, work limitation, or social limitation were the next most likely to smoke (26%–27%) (data table for Figure 19).
Alcohol Use and Abuse
Alcoholism and alcohol abuse are important public health issues that affect both disabled and nondisabled populations. Alcohol consumption, in moderation, has been posited to have some positive health effects, but some drinking patterns—particularly binge drinking or regular heavy alcohol consumption—can have both acute and chronic detrimental effects on health (8). Some evidence suggests that people with specific types of disabilities (including mental retardation, autism, sensory limitations, and mental illness) have higher than average rates of alcohol and substance abuse (9,10), and more than one-half of those with traumatically acquired disabilities such as spinal cord injury and traumatic brain injury are estimated to have substance abuse disorders, including alcohol abuse (11).
Analysis of NHIS data show that adults with disabilities were less likely to classify themselves as current drinkers than adults with no disability. Just 40% of those with complex activity limitation and 25% of those with basic actions difficulty
Health Behaviors and Risk Factors
reported being current drinkers, compared with 65% of those with no disability (data table for Figure 20).
Less than 6% of adults with a complex activity limitation were considered current heavy drinkers (14 drinks or more per week for men and 7 drinks or more per week for women), compared with 7% of adults with a basic actions difficulty and 9% of adults with no disability (data table for Figure 20). About 10% of adults with either complex activity limitation or basic actions difficulty reported drinking five or more drinks on 21 or more days in the past year, as did 11% of nondisabled adults.
Among adults with specific types of disability, current heavy drinking rates were highest for adults with the least severe difficulty in movement (10%) and with emotional difficulty (8%), and rates were lowest among those with self-care limitations (3%). In part, this represents the older age distribution of individuals with self-care limitations (see Figure 6) because adults aged 65 years and over reported the lowest alcohol consumption rate (Figure 20). Rates of reporting of 5 or more drinks on 21 or more days in the past year were highest among people with emotional difficulty (18%) and lowest among those with self-care limitations (7%).
Patterns of current heavy drinking and of drinking 5 or more drinks on 21 or more days in the past year by sex and age were similar for those with basic actions difficulty, complex activity limitation, and no disabilities. Men were more than twice as likely as women to be current heavy drinkers and about three times as likely to have had 5 or more drinks on 21 or more days in the past year (among all three groups) (data table for Figure 20). Heavy alcohol use decreased with age for adults with complex activity limitation or basic actions difficulty, as well as among nondisabled adults (Figure 20).
Leisure-Time Physical Activity (Exercise)
Benefits of regular physical activity include reduced risks of premature mortality, coronary heart disease, diabetes, colon cancer, hypertension, and osteoporosis. Regular physical activity also improves symptoms associated with musculoskeletal conditions and mental health conditions such as depression and anxiety (12). In addition, physical activity can enhance physical functioning and aid in weight control (13). Exercise is as important to disabled populations as it is for the general population, although people with disabilities may experience barriers to using certain types of equipment or lack the cognitive or social skills necessary to participate in organized fitness activities (14,15). However, some individuals, particularly those with severe functional
Page 37

difficulties, are unable to engage in exercise altogether (data table for Figures 21 and 22).
Regular leisure-time activity is defined in NHIS as at least three sessions per week of vigorous leisure-time physical activity lasting at least 20 minutes in duration or at least five sessions per week of light or moderate physical activity lasting at least 30 minutes in duration. Adults with all the types of disability measured here were less likely to participate in regular leisure-time physical activity than adults with no disability (Figure 21). Only 15% of adults with a complex activity limitation reported engaging in regular physical activity, compared with 21% of adults with basic actions difficulty and 35% of adults with no disability.
Regular leisure-time activity decreases with age regardless of disability status (Figure 22). However, the rate of decline is greater for adults with disabilities than for those without disabilities. For adults with no disability, the age differential in regular activity between adults 18–44 years of age and 65 years of age and over was about 4 percentage points, compared with 12 to 13 percentage points for adults with either complex activity limitation or basic actions difficulty. For all groups, men are more likely to participate in regular activity than women (data table for Figures 21 and 22).
The type of difficulty or limitation was also associated with the level of regular leisure-time activity. People with seeing or hearing difficulty were more likely to participate in regular leisure-time activity (24%) than adults with the most severe level of movement difficulty (4%) or adults with self-care limitations (8%).
Page 38 Health Behaviors and Risk Factors

Figure 19. Current cigarette smoking among disabled and nondisabled adults, by age: United States, 2001–2005
0 20 40 60 80 100
65 years and over
45–64 years
18–44 years
65 years and over
45–64 years
18–44 years
65 years and over
45–64 years
18–44 years 40.4
31.9
9.6
9.1
22.4
19.5
27.8
37.5
9.2
No disability
Basic actions difficulty
Complex activity limitation
Percent
NOTE: See data table for data points, SOURCE: CDC/NCHS, National Healthstandard errors, and additional notes. Interview Survey.
Health Behaviors and Risk Factors Page 39

Figure 20. Alcohol use among disabled and nondisabled adults, by age: United States, 2001–2005
Complex activity
0 20 40 60 80 100
5 or more drinks on 21 or more days inthe past year
65 years and over
45–64 years
18–44 years
65 years and over
45–64 years
18–44 years
65 years and over
45–64 years
18–44 years 15.4
9.1
7.2
5.8
4.0 3.3
9.0 14.1
10.0 7.3
10.1
7.7 9.7
5.6 3.5
15.9
7.7 3.1
No disability
Basic actions difficulty
limitation
Heavy drinker
Percent
NOTES: Heavy drinking is defined as more SOURCE: CDC/NCHS, National Healththan 14 drinks per week for men and more Interview Survey. than 7 drinks per week for women. See datatable for data points, standard errors, andadditional notes.
Page 40 Health Behaviors and Risk Factors

Figure 21. Leisure-time physical activity distribution among disabled and nondisabled adults: United States, 2001–2005
Complex activity
limitation
Basic actions
difficulty
No disability
0 20 40 60 80 100
Regular activity Some activity Inactive Unable to be active
10.8
6.0
26.9
47.7
14.7
21.2
31.0
34.8
32.2
32.8
41.7
Percent
NOTE: See data table for data points, SOURCE: CDC/NCHS, National Healthstandard errors, and additional notes. Interview Survey.
Health Behaviors and Risk Factors Page 41

Figure 22. Regular leisure-time physical activity among disabled and nondisabled adults, by age: United States, 2001–2005
Complex activity
0 20 40 60 80 100
65 years and over
45–64 years
18–44 years
65 years and over
45–64 years
18–44 years
65 years and over
45–64 years
18–44 years 21.7
14.8
9.7
15.3
35.6
34.1
20.8
28.5
31.4
No disability
Basic actions difficulty
limitation
Percent
NOTE: See data table for data points, SOURCE: CDC/NCHS, National Healthstandard errors, and additional notes. Interview Survey.
Page 42 Health Behaviors and Risk Factors

References
1. National Center on Birth Defects and Developmental Disabilities. Healthy People 2010 Disability and Secondary Conditions Focus Area 6. Reports and Proceedings. Atlanta, GA: Centers for Disease Control and Prevention. Available from: http://www.cdc.gov/ncbddd/dh. June 2003.
2. Rimmer JH. Health promotion for people with disabilities: The emerging paradigm shift from disability prevention to prevention of secondary conditions. Phys Ther 79(5):495–502. 1999.
3. Sturm R, Ringel JS, Andreyeva T. Increasing obesity rates and disability trends. Health Aff 23(2):199–205. 2004.
4. Weil E, Wachterman M, McCarthy EP, Davis RB, O’Day B, Iezzoni L, et al. Obesity among adults with disabling conditions. JAMA 288:1265–8. 2002.
5. Liou T, Pi-Sunyer X, Laferriiere B. Physical disability and obesity. Nutr Rev 63(10):321–31. 2005.
6. U.S. Department of Health and Human Services. The health consequences of smoking: A report of the Surgeon General. Atlanta, GA: Centers for Disease Control and Prevention. Available from: www.cdc.gov/tobacco/sgr/sgr_2004/index.htm. 2004.
7. Friend KB, Levy DT, Mernoff ST. The adoption of tobacco dependence treatment by rehabilitation clinicians. Disabil Rehabil 27(4):147–55. 2005.
8. Rehm J, Gmel G, Sempos CT, Trevisan M. Alcohol-related morbidity and mortality. Alcohol Res Health 27(1):39–51. 2003.
9. West SL. The accessibility of substance abuse treatment facilities in the United States for persons with disabilities. J Subst Abuse Treat 2007 Jul;33(1):1–5. 2007.
10. Corrigan JD. Substance abuse as a mediating factor in outcome from traumatic brain injury. Arch Phys Med Rehabil 76(4):302–9. 1995.
11. Kolakowsky-Hayner SA, Gourley EV, Kreutzer JS, Marwitz JH, Meade MA, Cidu DX. Post-injury substance abuse among persons with brain injury and persons with spinal cord injury. Brain Inj 16:583–92. 2002.
12. U.S. Department of Health and Human Services. Physical activity and health: A report of the Surgeon General. Atlanta, GA: Centers for Disease Control and Prevention. Available from: www.cdc.gov/nccdphp/sgr/sgr.htm. 1996.
13. U.S. Department of Health and Human Services and U.S. Department of Agriculture. Dietary Guidelines for Americans, 2005. Available from: www.healthierus.gov/dietaryguidelines/. 2005.
14. van der Ploeg HP, van der Beek AJ, van der Woude LHV, van Mechelen W. Physical activity for people with a disability. Sports Medicine 34(10):639–49. 2004.
15. Heath GW, Fentem PH. Physical activity among persons with disabilities: A public health perspective. Exerc Sport Sci Rev 25:195–234. 1997.
Health Behaviors and Risk Factors Page 43

Access to Health Care
Usual Source of Medical Care
Not having a usual source of health care may be a barrier to accessing health care. Lacking a usual source of care is associated with poorer control of chronic conditions (such as hypertension or diabetes) and lower receipt of preventive services (1,2). People with disabilites may find that having a place of care and a set of providers familiar with their health history and care needs is particularly important for them, yet they have not been a group well studied in health services research. Furthermore, the experiences of people with disabilities within the health care system are not well documented or understood (3,4).
During 2001–2005, adults 18–44 years of age were more likely to lack a usual source of medical care than adults in older age groups, regardless of disability status (Figure 23). For people 18–44 years of age, 16% of those with a complex activity limitation, 20% of those with basic actions difficulty, and 22% of those with no reported disability did not have a usual place of medical care. For people 65 years of age and over, only 5% of those with no disability and 3% of those with complex activity limitation or basic actions difficulty did not have a usual source of care.
Differences in having a usual source of medical care by disability type reflect the age distribution of the population. Adults with emotional difficulty, who tend to be younger than those with other types of difficulties, are more likely to lack a usual source of care (18%) than adults with cognitive difficulties (8%) or self-care limitations (4%), whose disabilities are often associated with advancing age (data table for Figures 23 and 24; see Figures 7 and 8 for age distribution by disability type).
Medical care can be accessed in a variety of settings, including private doctors’ offices, clinics, hospital outpatient departments, or other settings. Among those who report a usual source of medical care, about 80% of adults reported a doctor’s office as their setting of choice, regardless of disability status (Figure 24). Adults aged 65 years and over were most likely to report a doctor’s office as their usual place of care, regardless of disability status (data table for Figures 23–24). Adults aged 18–44 years were more likely than adults in older age groups to report a clinic or health center as their usual place of care. Almost one-fourth of this age group with a complex activity limitation and 22% with a basic actions difficulty reported a clinic as their usual place of care, compared with 19% of adults aged 18–44 years with no
Page 44
disability (data table for Figures 23–24). People with emotional difficulty were more likely than those with other types of disability to report a clinic or health center as their source of care (24%).
Access to Health Care

Figure 23. No usual source of medical care among disabled and nondisabled adults, by age: United States, 2001–2005
Complex activity
0 20 40 60 80 100
65 years and over
45–64 years
18–44 years
65 years and over
45–64 years
18–44 years
65 years and over
45–64 years
18–44 years 16.2
7.1
2.8
3.0
21.6
10.4
9.1
20.4
5.1
No disability
Basic actions difficulty
limitation
Percent
NOTE: See data table for data points, SOURCE: CDC/NCHS, National Healthstandard errors, and additional notes. Interview Survey.
Access to Health Care Page 45

Figure 24. Place of usual source of medical care among disabled and nondisabled adults with a usual place of care: United States, 2001–2005
Complex activity
limitation
Basic actions difficulty
No disability
Percent
NOTES: See data table for data points, SOURCE: CDC/NCHS, National Healthstandard errors, and additional notes. Interview Survey. HMO is health maintenance organization.
0 20 40 60 80 100
Hospital outpatient department Clinic or health center Doctor's office or HMO
78.3
17.9
2.8
2.1
81.8
16.2
17.3
79.8
1.2
Page 46 Access to Health Care

Insurance Coverage
Health insurance coverage is an important determinant of access to health care (5). Uninsured children and adults under 65 years of age are substantially less likely to have a usual source of health care or a recent health care visit than their insured counterparts (6). Uninsured people are more likely to forego needed health care because they cannot afford it. Almost all adults aged 65 years and over are covered by the Medicare program, resulting in very few older adults without health insurance; therefore, insurance coverage estimates presented here include only the adult population aged 18–64 years.
The most common source of coverage for all adults under 65 years of age is private employer-sponsored group health insurance. Private health insurance may also be purchased on an individual basis, but it is generally more costly and tends to provide less adequate coverage than group insurance. Adults aged 18–64 years with disabilities are less likely than those without disabilities to have private health insurance coverage (Figure 25), in part because they are less likely to be employed (Figure 8). In this age group, during 2001–2005, less than one-half of those with complex activity limitation, 61% of those with basic actions difficulty, and about three-fourths with no reported disabilities had private coverage at the time of their interview.
Adults with disabilities are much more likely than those without disabilities to be covered by public programs, primarily Medicare and Medicaid. These programs were designed, in part, to cover vulnerable populations (7,8). One-quarter of adults under 65 years of age with a complex activity limitation had Medicaid coverage, as did 14% of those with basic actions difficulties. Only 4% of adults in this age group who reported no disability were covered by Medicaid at the time of their interview (2001–2005) (Figure 25). Adults who receive Supplemental Security Income (SSI), which is a needs-based program, are usually also eligible for the Medicaid benefits provided by the states. In 1998, more than one-half of the SSI recipients were blind or disabled adults aged 18–64 years (9). Medicaid is a particularly important source of medical insurance for the more seriously disabled portion of the population who may not have been able to earn enough credits to receive Social Security Disability benefits. More than 40% of those with cognitive difficulties (Figure 26) and over one-third of people with self-care limitations (Figure 27) or severe movement difficulties (Figure 28) reported Medicaid coverage.
Access to Health Care
The SSDI program provides income to those under 65 years of age who have become disabled and can no longer work and have not worked in the past 2 years (10). SSDI beneficiaries receiving benefits based on their own disability are entitled to Medicare benefits beginning the 25th month of entitlement (8). Among adults under 65 years of age who reported being unable to work or having difficulty working, 23% were covered by Medicare in 2001–2005 (Figure 27). An even greater percentage (31%) with ADL or IADL limitations were covered by Medicare at the time of their interview, as were 33% of those with the most severe limitation in movement (Figure 28). Less than 1% of adults under the age of 65 years with no reported disability had Medicare coverage.
Public programs do not cover all people who do not have private coverage. Over the period 2001–2005, the percentage uninsured among adults aged 18–64 years was about 19% of those with no disability or with a basic action difficulty and 17% of those with a complex activity limitation (Figure 25). People with emotional difficulties most often reported being uninsured (28%), followed by people with sensory limitations (seeing or hearing difficulties) (20%) (Figure 26). The lowest uninsured rate was among those with self-care limitations (11%) (Figure 27).
Page 47

Figure 25. Insurance status at time of interview among disabled and nondisabled adults aged 18–64 years: United States, 2001–2005
Complex activity
limitation
Basic actions
difficulty
No disability
0 20 40 60 80 100
Medicare Medicaid Private No insurance
16.8
18.6
46.3
25.8
19.7
61.3
14.0
9.0
18.9
75.2
0.3
4.3
Percent
NOTES: Insurance coverage categories are SOURCE: CDC/NCHS, National Healthnot mutually exclusive. See data table for data Interview Survey. points, standard errors, and additional notes.
Page 48 Access to Health Care

Figure 26. Insurance status at time of interview among adults aged 18–64 years with basic actions difficulty, by type of difficulty: United States, 2001–2005
Movement difficulty
Emotional difficulty
Seeing or hearing difficulty
Cognitive difficulty
Percent
NOTES: Insurance coverage categories SOURCE: CDC/NCHS, National Healthare not mutually exclusive. See data Interview Survey. table for data points, standard errors,and additional notes.
0 20 40 60 80 100
Medicare Medicaid Private No insurance
19.7
28.2
62.3
12.4
8.5
38.0
26.3
13.0
17.1
59.0
15.8
11.4
13.6
32.1
27.0
41.0
Access to Health Care Page 49

Figure 27. Insurance status at time of interview among adults aged 18–64 years with complex activity limitation, by type of limitation: United States, 2001–2005
Social activity
limitation
Work limitation
Self-care (ADL or IADL)
limitation
0 20 40 60 80 100
Medicare Medicaid Private No insurance
16.1
16.0
46.8
26.1
21.1
43.5
28.2
22.5
11.0
38.2
30.5
38.2
Percent
NOTES: Insurance categories are not SOURCE: CDC/NCHS, National Healthmutually exclusive. See data table for Interview Survey. data points, standard errors, and additionalnotes. ADL is activities of daily living. IADL is instrumental activities of daily living.
Page 50 Access to Health Care

Figure 28. Insurance status at time of interview among adults aged 18–64 years with movement difficulty, by severity of difficulty: United States, 2001–2005
Least severe
movement difficulty
Level two
Level three
Level four
Most severe
movement difficulty
0 20 40 60 80 100
Medicare Medicaid Private No insurance
17.6 71.7
34.8 32.5
17.7
7.5 2.6
7.0 12.8
15.5 19.7
17.0 41.7
26.4
54.4 16.8
64.0
27.4
13.1 35.6
Percent
NOTES: Insurance categories are not SOURCE: CDC/NCHS, National Healthmutually exclusive. See data table for Interview Survey. data points, standard errors, andadditional notes.
Access to Health Care Page 51

References
1. Jiang H, Muntner P, Chen J, Roccella EJ, Streiffer RH, Whelton PK. Factors associated with hypertension control in the general population of the United States. Arch Intern Med 162:1051–8. 2002.
2. Corbie-Smith G, Flagg EW, Doyle JP, O’Brien MA. Influence of usual source of care on differences by race/ethnicity in receipt of preventive services. J Gen Intern Med 17(6):458–64. 2002.
3. Scheer J, Kroll T, Neri MT, Beatty P. Access barriers for persons with disabilities. Journal of Disability Policy Studies 13(4):221–30. 2003.
4. Sutton JP, DeJong G. Managed care and people with disabilities: Framing the issues. Arch Phys Med Rehabil. 79:1312–6. 1998.
5. Institute of Medicine. Committee on the consequences of uninsurance. Series of reports: Coverage matters: Insurance and health care; Care without coverage; Health insurance is a family matter; A shared destiny: Community effects of uninsurance; Hidden costs, value lost: Uninsurance in America. Washington, DC: National Academy Press. 2001–2003.
6. National Center for Health Statistics. Health, United States, with chartbook on trends in the health of Americans. Hyattsville, MD. 2006.
7. U.S. Social Security Administration, Office of Policy. A primer: Social Security Act program to assist the disabled. Social Security Bulletin 66(3):53–9. 2005–2006.
8. Kennedy L. SSI at its 25th year. Social Security Bulletin 62(2):52–8. 1999.
9. Benitez-Silva H, Buchinsky M, Chan HM, Rust J, Sheidvasser S. An empirical analysis of the social security disability application, appeal, and award process. Labour Economics 6(2):147–78. 1999.
10. U.S. Census Bureau. Statistical Abstract of the United States: 2007 (126th edition). Washington, DC. 2006.
Page 52 Access to Health Care

Use of Preventive Services
All people, regardless of disability status, can benefit from screening, counseling, and immunizations recommended by the U.S. Preventive Services Task Force (USPSTF) and others who produce clinical practice guidelines. Some types of functional limitations (e.g., paralysis and some limitations caused by chronic diseases) are also associated with decreased immune systems and may warrant immunizations outside of recommended age ranges. The physical inaccessibility of some care sites and nondisability-compliant equipment or tests can, however, impede the use of preventive services by people with disability (1,2). NHIS data are presented for three recommended preventive services that have been shown to reduce disease or detect disease at early, more treatable stages: annual influenza vaccination, Pap tests, and mammography.
Influenza Vaccination
Annual influenza vaccination can lessen the risk of hospitalization and death among those aged 65 years and over and also prevent influenza-related complications for adults aged 18–64 years with medical conditions (3). In 2000, the Advisory Committee on Immunization Practices broadened the universal recommendations for influenza vaccination to include adults 50–64 years of age because of the high prevalence of chronic medical conditions in adults 50–64 years of age (4).
Men and women aged 50 years and over with disabilities are more likely to have received an influenza vaccine in the past 12 months than those without disabilities (Figures 29–30). Among the population aged 50 years and over, a little more than one-half of men with complex activity limitation or basic actions difficulties received the vaccination in the past 12 months, compared with 35% of nondisabled men (Figure 29). Women aged 50 years and over were somewhat more likely to have had an influenza vaccination than men—55% of women with complex activity limitation, 54% of women with basic actions difficulties, and 41% of nondisabled women (Figure 30). Influenza vaccination rates increased with age, but the higher use of vaccination persists among the disabled and nondisabled population aged 65 years and over. Among adults this age, 68% of men and 66% of women with complex activity limitation (and similar percentages among men and women with basic actions difficulties) had an influenza shot in the past 12 months, compared with approximately 58% of nondisabled men and women (data table for Figures 29, 30, and 33).
Use of Preventive Services
Among men and women 50 years of age and over with various types of basic actions difficulties, those with emotional difficulty were less likely to receive influenza vaccination than those with movement difficulty, seeing or hearing difficulty, or cognitive difficulty.
Page 53

Figure 29. Influenza vaccination within the past 12 months among disabled and nondisabled men aged 50 years and over: United States, 2001–2005
Complex activity limitation
Social activitylimitation
Work limitation
Self-care (ADL orIADL) limitation
Basic actions difficulty Movement
difficulty Emotional
difficulty Seeing or
hearing difficulty Cognitive difficulty
No disability
0 20 40 60 80 100
53.6
54.9
53.1
57.6
52.5
55.4
42.3
53.9
35.4
56.0
Percent
NOTES: See data table for data points, SOURCE: CDC/NCHS, National Healthstandard errors, and additional notes. Interview Survey. ADL is activities of daily living. IADL is instrumental activities of daily living.
Page 54 Use of Preventive Services

Figure 30. Influenza vaccination within the past 12 months among disabled and nondisabled women aged 50 years and over: United States, 2001–2005
Complex activitylimitation
Social activitylimitation
Work limitation
Self-care (ADL orIADL) limitation
Basic actions difficulty
Movement difficulty
Emotional difficulty
Seeing or hearing difficulty
Cognitive difficulty
No disability
0 20 40 60 80 100
NOTES: See data table for data points, SOURCE: CDC/NCHS, National Healthstandard errors, and additional notes. Interview Survey. ADL is activities of daily living. IADL is instrumental activities of daily living.
55.2
56.4
54.3
58.9
53.8
54.9
44.3
54.7
40.7
56.9
Percent
Use of Preventive Services Page 55

Pap Test
A Pap test, also called a Pap smear, is a microscopic examination of cells scraped from the cervix that is used to detect cancerous or precancerous conditions of the cervix and other medical conditions. If detected, precancerous conditions can be treated before they become malignant. USPSTF, the American Cancer Society, and the American College of Obstetricians and Gynecologists all recommend regular Pap smear screening for cervical cancer, although recommendations for screening vary as to the frequency, timing, risk factors, and age (5,6,7).
Women aged 18 years and over with disabilities were less likely to have had a Pap test in the past 3 years than were women without disabilities (Figure 31). About 83% of women without disabilities had the test, compared with 71% of women with basic actions difficulty and only 65% of women with complex activity limitation. Among younger women aged 18–44 years, the percentage with a recent Pap test was similar for those with no disabilities and those with basic actions difficulty (84%–83%), compared with 80% of women with complex activity limitation (data table for Figures 31 and 33). For women aged 65 years and over, 67% of nondisabled women, 53% of women with basic actions difficulty, and only 46% of women with complex activity limitation had a Pap test in the past 3 years (data table for Figures 31 and 33). Women aged 18 years and over with ADL or IADL limitations were least likely (53%) and women with work limitations were most likely (80%) to have had the test (Figure 31). Among women with movement difficulty, Pap test rates declined with increasing severity of difficulty, from 79% to 54% (Figure 33).
Mammography
Regular mammography screening has been shown to be effective in reducing breast cancer mortality. In 2002, the Department of Health and Human Services released its updated recommendation from USPSTF that called for screening mammography, with or without clinical breast examination, every 1 to 2 years for women aged 40 years and over. USPSTF, with concurrence from the National Cancer Institute, lowered the recommended age for initiating routine screening from 50 to 40 years of age but found that the strongest evidence of the mortality benefit for women undergoing mammography screening was among women aged 50–69 years (8).
Page 56
Among women aged 50 years and over, mammography rates were higher for nondisabled women (74%) than for women with basic actions difficulty (67%) or complex activity limitation (61%) (Figure 32). The lowest mammography rates among women aged 50 years and over were for those with cognitive difficulties (52%) and those with ADL or IADL limitations (51%) (Figure 32). Mammography rates for women aged 50 years and over with movement difficulty declined with increased severity of movement difficulty (Figure 33).
Use of Preventive Services

Figure 31. Pap test within the past 3 years among disabled and nondisabled women aged 18 years and over: United States, 2003–2005
Any complexactivity
limitation Social activity
limitation
Work limitation Self-care
(ADL or IADL)limitation
Any basic actions difficulty
Movement difficulty
Emotional difficulty
Seeing or hearing difficulty
Cognitive difficulty
No disability
0 20 40 60 80 100
64.6
61.7
80.3
52.6
70.8
68.8
72.4
69.3
82.5
58.3
Percent
NOTES: See data table for data points, SOURCE: CDC/NCHS, National Healthstandard errors, and additional notes. Interview Survey. ADL is activities of daily living. IADL is instrumental activities of daily living.
Use of Preventive Services Page 57

Figure 32. Mammography within the past 2 years among disabled and nondisabled women aged 50 years and over: United States, 2003–2005
Any complexactivity
limitation Social activity
limitation Work
limitation Self-care
(ADL or IADL)limitation
Any basicactions difficulty
Movement difficulty
Emotional difficulty
Seeing or hearing difficulty
Cognitive difficulty
No disability
61.4
58.3
62.0
51.2
66.5
66.4
58.4
62.8
52.1
74.4
0 20 40 60 80 100 Percent
NOTES: See data table for data points, SOURCE: CDC/NCHS, National Healthstandard errors, and additional notes. Interview Survey. ADL is activities of daily living. IADL is instrumental activities of daily living.
Page 58 Use of Preventive Services

Figure 33. Influenza vaccination, Pap test, and mammography among women with movement difficulty, by severity of difficulty: United States, 2001–2005
Influenza vaccination
in past 12 months
(women aged 50 years
and over)
Pap test in past 3 years
(women aged 18 years
and over)
Mammography in past 2 years
(women aged 50 years
and over)
0 20 40 60 80 100
Most severe Level four Level three Level two Least severe
Severity of movementdifficulty51.0
54.5
57.1
54.0
57.4
54.2
71.6
67.9
60.3
59.1
69.8
66.3
54.9
75.4
79.0
Percent
NOTES: Data for Pap test and SOURCE: CDC/NCHS, National Healthmammography are for data Interview Survey. years 2003 and 2005 only. See data table for data points,standard errors, and additional notes.
Use of Preventive Services Page 59

References
1. Iezzoni L, McCarthy EP, Davis RB, Siebens H. Mobility impairments and use of screening and preventive services. Am J Public Health 90:955–61. 2000.
2. Rimmer, JH. Health promotion for people with disabilities: The emerging paradigm shift from disability prevention to prevention of secondary conditions. Phys Ther 79:495–502. 1999.
3. Hak E, Buskens E, van Essen GA, et al. Clinical effectiveness of influenza vaccination in persons younger than 65 years with high risk medical conditions: The PRISMA study. Arch Intern Med 165:274–80. 2005.
4. Centers for Disease Control and Prevention. Prevention and control of influenza. Recommendations of the Advisory Committee on Immunization Practices (ACIP). MMWR 49 (No. RR-3):1–38. 2000.
5. U.S. Preventive Services Task Force. Screening for cervical cancer: Recommendations and rationale. AHRQ pub no 03–515A. Rockville, MD: Agency for Healthcare Research and Quality. Available from: www.ahrq.gov/clinic/3rduspstf/cervcan/cervcanrr.htm. January 2003.
6. Saslow D, Runowicz CD, Solomon D, et al. American Cancer Society guideline for the early detection of cervical neoplasia and cancer. CA Cancer J Clin 52(6):342–62. 2002.
7. The American College of Obstetricians and Gynecologists. ACOG news release: Revised cervical cancer screening guidelines require reeducation of women and physicians. Available from: www.acog.org/from_home/publications/ press_releases/nr05-04-04-1.cfm. May 4, 2004.
8. U.S. Preventive Services Task Force. Screening for breast cancer: Recommendations and rationale. Rockville, MD: Agency for Healthcare Research and Quality. Available from: www.ahrq.gov/clinic/3rduspstf/breastcancer/brcanrr.htm. February 2002.
Page 60 Use of Preventive Services

Data table for Figures 1 and 2. Prevalence estimates (average annual) of basic actions difficulty and complex activity limitation among adults aged 18 years and over, by age, sex, and type of limitation or difficulty: United States, 2001–2005
Percentage of adult population
Population estimate Percent SE
Total . . . . . . . . . . . . . . . . . . . . . . . . . . . . . . . . . . . . . . . . . . . . . 211,133,000 100.0 . . .
Any limitation measure . . . . . . . . . . . . . . . . . . . . . . . . . . . . . . . . 66,317,000 31.4 0.2
Complex activity limitation . . . . . . . . . . . . . . . . . . . . . . . . . . . . 30,097,000 14.3 0.2
18–44 years . . . . . . . . . . . . . . . . . . . . . . . . . . . . . . . . . . . . 7,418,000 6.8 0.1
45–64 years . . . . . . . . . . . . . . . . . . . . . . . . . . . . . . . . . . . . 11,751,000 17.4 0.2
65 years and over . . . . . . . . . . . . . . . . . . . . . . . . . . . . . . . . 10,928,000 32.2 0.4
Male . . . . . . . . . . . . . . . . . . . . . . . . . . . . . . . . . . . . . . . . . 12,891,000 12.7 0.2
Female. . . . . . . . . . . . . . . . . . . . . . . . . . . . . . . . . . . . . . . . 17,205,000 15.7 0.2
Social limitation. . . . . . . . . . . . . . . . . . . . . . . . . . . . . . . . . . 14,599,000 6.9 0.1
Work limitation . . . . . . . . . . . . . . . . . . . . . . . . . . . . . . . . . . 24,548,000 11.6 0.1
Self-care (ADL or IADL) limitation . . . . . . . . . . . . . . . . . . . . 8,738,000 4.1 0.1
Basic actions difficulty . . . . . . . . . . . . . . . . . . . . . . . . . . . . . . . 62,338,000 29.5 0.2
18–44 years . . . . . . . . . . . . . . . . . . . . . . . . . . . . . . . . . . . . 18,296,000 16.7 0.2
45–64 years . . . . . . . . . . . . . . . . . . . . . . . . . . . . . . . . . . . . 23,422,000 34.7 0.3
65 years and over . . . . . . . . . . . . . . . . . . . . . . . . . . . . . . . . 20,620,000 60.7 0.4
Male . . . . . . . . . . . . . . . . . . . . . . . . . . . . . . . . . . . . . . . . . 26,152,000 25.8 0.3
Female. . . . . . . . . . . . . . . . . . . . . . . . . . . . . . . . . . . . . . . . 36,186,000 33.0 0.2
Movement difficulty . . . . . . . . . . . . . . . . . . . . . . . . . . . . . . . 45,903,000 21.7 0.2
Least severe . . . . . . . . . . . . . . . . . . . . . . . . . . . . . . . . . . 12,870,000 6.1 0.1
Level two . . . . . . . . . . . . . . . . . . . . . . . . . . . . . . . . . . . . 12,145,000 5.8 0.1
Level three . . . . . . . . . . . . . . . . . . . . . . . . . . . . . . . . . . . 10,463,000 5.0 0.1
Level four . . . . . . . . . . . . . . . . . . . . . . . . . . . . . . . . . . . . 6,210,000 2.9 0.1
Most severe . . . . . . . . . . . . . . . . . . . . . . . . . . . . . . . . . . 4,215,000 2.0 0.1
Emotional difficulty . . . . . . . . . . . . . . . . . . . . . . . . . . . . . . . 6,487,000 3.1 0.1
Seeing or hearing difficulty . . . . . . . . . . . . . . . . . . . . . . . . . . 27,655,000 13.1 0.1
Cognitive difficulty . . . . . . . . . . . . . . . . . . . . . . . . . . . . . . . . 5,876,000 2.8 0.1
No disability . . . . . . . . . . . . . . . . . . . . . . . . . . . . . . . . . . . . . . 144,816,000 68.6 0.2
18–44 years . . . . . . . . . . . . . . . . . . . . . . . . . . . . . . . . . . . . 89,609,000 81.8 0.2
45–64 years . . . . . . . . . . . . . . . . . . . . . . . . . . . . . . . . . . . . 42,669,000 63.1 0.3
65 years and over . . . . . . . . . . . . . . . . . . . . . . . . . . . . . . . . 12,538,000 36.9 0.4
Male . . . . . . . . . . . . . . . . . . . . . . . . . . . . . . . . . . . . . . . . . 73,150,000 72.1 0.3
Female. . . . . . . . . . . . . . . . . . . . . . . . . . . . . . . . . . . . . . . . 71,666,000 65.3 0.3
. . . Category not applicable.
NOTES: See the Appendix for questions used to define types of disability. SE is standard error. ADL is activities of daily living. IADL is instrumental activities of daily living.
SOURCE: CDC/NCHS, National Health Interview Survey.
Data table for Figures 1–33 Page 61

Data table for Figure 3. Prevalence of complex activity limitation among adults aged 18 years and over with basic actions difficulty, by type of difficulty: United States, 2001–2005
Self-care One or more(ADL or IADL) Work Social complex activity
limitation limitation limitation limitations Population estimate Percent SE Percent SE Percent SE Percent SE
Movement difficulty only . . . . . . . . . . . . . . . . 27,904,000 9.2 0.2 31.9 0.4 20.8 0.3 40.7 0.4
Emotional difficulty only . . . . . . . . . . . . . . . . . 1,838,000 1.8 0.4 13.8 1.0 8.3 0.9 19.2 1.2
Sensory difficulty only . . . . . . . . . . . . . . . . . . 12,846,000 2.1 0.2 8.1 0.3 1.4 0.1 9.4 0.3
Cognitive difficulty only . . . . . . . . . . . . . . . . . 860,000 30.5 2.0 66.8 2.1 9.0 1.3 70.8 2.0
Any combination of basic actions difficulties (more than one) . . . . . . . . . . . . . . . . . . . . . 18,890,000 27.3 0.4 54.8 0.5 41.3 0.5 66.6 0.5
Any basic action difficulty (one or more) . . . . . 62,338,000 13.3 0.2 33.9 0.3 22.5 0.3 41.9 0.3
No basic action difficulty . . . . . . . . . . . . . . . . 148,795,000 0.3 0.0 2.3 0.1 0.4 0.0 2.7 0.1
0.0 Quantity more than zero but less than 0.05.
NOTES: See the Appendix for questions used to define types of disability. SE is standard error. ADL is activities of daily living. IADL is instrumental activities of daily living.
SOURCE: CDC/NCHS, National Health Interview Survey.
Data table for Figures limitation or difficulty:
4–6. Age distribution among United States, 2001–2005
disabled and nondisabled adults, by type of
18–44 years 45–64 years 65 years and over
Percent SE Percent SE Percent SE
Complex activity limitation . . . . . . . . . . . . . . . . . . . .
Social limitation. . . . . . . . . . . . . . . . . . . . . . . . . .
Work limitation . . . . . . . . . . . . . . . . . . . . . . . . . .
Self-care (ADL or IADL) limitation . . . . . . . . . . . .
Basic actions difficulty. . . . . . . . . . . . . . . . . . . . . . .
Movement difficulty . . . . . . . . . . . . . . . . . . . . . . .
Emotional difficulty . . . . . . . . . . . . . . . . . . . . . . .
Seeing or hearing difficulty . . . . . . . . . . . . . . . . . .
Cognitive difficulty . . . . . . . . . . . . . . . . . . . . . . . .
No disability . . . . . . . . . . . . . . . . . . . . . . . . . . . . . .
24.7
23.1
24.2
17.2
29.3
24.6
48.3
26.9
22.7
61.9
0.4
0.5
0.4
0.6
0.3
0.3
0.8
0.4
0.8
0.3
39.0
38.4
41.6
30.8
37.6
39.2
39.1
35.8
33.0
29.5
0.4
0.6
0.5
0.7
0.3
0.3
0.8
0.4
0.8
0.2
36.3
38.5
34.2
52.0
33.1
36.2
12.6
37.3
44.4
8.7
0.5
0.6
0.5
0.8
0.3
0.4
0.5
0.5
1.0
0.1
NOTES: See the Appendix for questions used to daily living.
SOURCE: CDC/NCHS, National Health Interview
define types
Survey.
of disability. SE is standard error. ADL is activities of daily living. IADL is instrumental activities of
Page 62 Data table for Figures 1–33

Data table for Figures 7–11. Distributions for selected sociodemographic characteristics among disabled and nondisabled adults aged 18 years and over, by type of limitation or difficulty: United States, 2001–2005
Complex activity limitation Basic actions difficulty No disability
Percent SE Percent SE Percent SE
Sex
Male . . . . . . . . . . . . . . . . . . . . . . . . . . . . . . . . . . . 42.8 0.4 42.0 0.3 50.5 0.2
Female . . . . . . . . . . . . . . . . . . . . . . . . . . . . . . . . . 57.2 0.4 58.0 0.3 49.5 0.2
Race and ethnicity
Non-Hispanic white. . . . . . . . . . . . . . . . . . . . . . . . . 75.9 0.6 77.0 0.4 70.3 0.4
Non-Hispanic black. . . . . . . . . . . . . . . . . . . . . . . . . 13.4 0.5 11.2 0.3 11.2 0.3
Hispanic . . . . . . . . . . . . . . . . . . . . . . . . . . . . . . . . 7.8 0.3 8.7 0.2 13.2 0.3
Non-Hispanic Asian . . . . . . . . . . . . . . . . . . . . . . . . 0.9 0.1 1.1 0.1 2.6 0.1
Other . . . . . . . . . . . . . . . . . . . . . . . . . . . . . . . . . . 2.1 0.1 2.0 0.1 2.7 0.1
Marital status
Married . . . . . . . . . . . . . . . . . . . . . . . . . . . . . . . . . 47.5 0.4 54.9 0.3 59.3 0.3
Widowed . . . . . . . . . . . . . . . . . . . . . . . . . . . . . . . . 17.3 0.3 13.8 0.2 3.2 0.1
Divorced or separated. . . . . . . . . . . . . . . . . . . . . . . 16.0 0.2 13.6 0.2 9.2 0.1
Never married . . . . . . . . . . . . . . . . . . . . . . . . . . . . 14.6 0.3 12.7 0.2 22.2 0.3
Living with partner . . . . . . . . . . . . . . . . . . . . . . . . . 4.5 0.2 5.1 0.1 6.1 0.1
Educational attainment
Less than high school . . . . . . . . . . . . . . . . . . . . . . . 29.9 0.4 23.9 0.3 13.6 0.2
High school graduate . . . . . . . . . . . . . . . . . . . . . . . 33.7 0.4 32.8 0.3 28.0 0.2
Some college. . . . . . . . . . . . . . . . . . . . . . . . . . . . . 24.5 0.3 26.6 0.2 30.0 0.2
College graduate . . . . . . . . . . . . . . . . . . . . . . . . . . 11.9 0.3 16.7 0.3 28.4 0.3
Employment (aged 18–64 years)
Had job last week. . . . . . . . . . . . . . . . . . . . . . . . . . 23.3 0.3 41.9 0.3 75.4 0.2
Had job past year or no job last week . . . . . . . . . . . 7.5 0.2 6.9 0.1 6.5 0.1
No job last week or no job past year . . . . . . . . . . . . 69.3 0.4 51.2 0.4 18.0 0.2
Percent of poverty level
Below 100% . . . . . . . . . . . . . . . . . . . . . . . . . . . . . 22.3 0.4 15.7 0.3 10.0 0.2
100%–less than 125% . . . . . . . . . . . . . . . . . . . . . . 8.2 0.2 6.1 0.1 3.7 0.1
125%–less than 200% . . . . . . . . . . . . . . . . . . . . . . 20.0 0.3 17.3 0.2 11.9 0.2
200%–less than 400% . . . . . . . . . . . . . . . . . . . . . . 29.9 0.4 32.0 0.3 31.0 0.2
400% or above. . . . . . . . . . . . . . . . . . . . . . . . . . . . 19.7 0.4 28.8 0.3 43.5 0.3
NOTES: See the Appendix for questions used to define types of disability and construction of poverty indicator variable. SE is standard error.
SOURCE: CDC/NCHS, National Health Interview Survey.
Data table for Figures 1–33 Page 63

Data table for Figures 12–16. Respondant-assessed health status distribution among disabled and nondisabled adults aged 18 years and over, by age and type of limitation or difficulty: United States, 2001–2005
Excellent or very good Good Fair or poor
Percent SE Percent SE Percent SE
Complex activity limitation . . . . . . . . . . . . . . . . . . . . 18.1 0.3 31.1 0.4 50.8 0.4
18–44 years . . . . . . . . . . . . . . . . . . . . . . . . . . . . 27.8 0.7 34.2 0.7 37.9 0.8
45–64 years . . . . . . . . . . . . . . . . . . . . . . . . . . . . 14.7 0.4 28.9 0.5 56.5 0.6
65 years and over . . . . . . . . . . . . . . . . . . . . . . . . 15.3 0.4 31.3 0.6 53.4 0.6
Social limitation. . . . . . . . . . . . . . . . . . . . . . . . . . 15.1 0.5 26.2 0.5 58.7 0.5
Work limitation . . . . . . . . . . . . . . . . . . . . . . . . . . 16.2 0.3 30.5 0.4 53.4 0.5
Self-care (ADL or IADL) limitation . . . . . . . . . . . . . 11.3 0.4 23.8 0.6 64.9 0.7
Basic actions difficulty. . . . . . . . . . . . . . . . . . . . . . . 34.7 0.3 33.8 0.3 31.5 0.3
18–44 years . . . . . . . . . . . . . . . . . . . . . . . . . . . . 46.9 0.6 32.4 0.5 20.7 0.4
45–64 years . . . . . . . . . . . . . . . . . . . . . . . . . . . . 32.0 0.5 33.0 0.4 35.0 0.4
65 years and over . . . . . . . . . . . . . . . . . . . . . . . . 26.8 0.4 35.9 0.4 37.3 0.5
Movement difficulty . . . . . . . . . . . . . . . . . . . . . . . 27.8 0.3 34.3 0.3 37.9 0.3
Least severe . . . . . . . . . . . . . . . . . . . . . . . . . . 48.2 0.6 37.0 0.6 14.8 0.4
Level two . . . . . . . . . . . . . . . . . . . . . . . . . . . . 30.3 0.6 41.2 0.6 28.5 0.6
Level three . . . . . . . . . . . . . . . . . . . . . . . . . . . 17.9 0.5 36.0 0.6 46.1 0.7
Level four . . . . . . . . . . . . . . . . . . . . . . . . . . . . 11.7 0.5 24.7 0.6 63.6 0.7
Most severe . . . . . . . . . . . . . . . . . . . . . . . . . . 6.2 0.5 16.6 0.7 77.2 0.8
Emotional difficulty . . . . . . . . . . . . . . . . . . . . . . . 22.6 0.7 25.6 0.6 51.8 0.8
Seeing or hearing difficulty . . . . . . . . . . . . . . . . . . 38.0 0.4 31.5 0.4 30.6 0.4
Cognitive difficulty . . . . . . . . . . . . . . . . . . . . . . . . 11.0 0.5 25.2 0.7 63.8 0.8
No disability . . . . . . . . . . . . . . . . . . . . . . . . . . . . . . 75.0 0.2 21.6 0.2 3.4 0.1
18–44 years . . . . . . . . . . . . . . . . . . . . . . . . . . . . 79.2 0.2 18.4 0.2 2.4 0.1
45–64 years . . . . . . . . . . . . . . . . . . . . . . . . . . . . 70.6 0.3 25.0 0.3 4.4 0.1
65 years and over . . . . . . . . . . . . . . . . . . . . . . . . 59.8 0.6 33.0 0.6 7.3 0.3
NOTES: See the Appendix for questions used to define types of disability and question used for health status measure. SE is standard error. ADL is activities of daily living. IADL is instrumental activities of daily living.
SOURCE: CDC/NCHS, National Health Interview Survey.
Page 64 Data table for Figures 1–33

Data table for Figures 17 and 18. Body mass index (BMI) distribution among disabled and nondisabled adults, by age, sex, and type of limitation or difficulty: United States, 2001–2005
Underweight Healthy weight Overweight Obese
Percent SE Percent SE Percent SE Percent SE
Complex activity limitation . . . . . . . . . . . . . . . 1.6 0.1 32.9 0.4 33.9 0.4 31.6 0.4
18–44 years . . . . . . . . . . . . . . . . . . . . . . . 2.2 0.2 36.8 0.9 31.2 0.9 29.8 0.7
45–64 years . . . . . . . . . . . . . . . . . . . . . . . 1.1 0.1 26.6 0.6 34.3 0.6 38.0 0.6
65 years and over . . . . . . . . . . . . . . . . . . . 1.8 0.2 37.0 0.6 35.2 0.6 26.1 0.5
Men . . . . . . . . . . . . . . . . . . . . . . . . . . . . . * * 31.6 0.6 39.0 0.6 28.5 0.6
Women. . . . . . . . . . . . . . . . . . . . . . . . . . . 2.2 0.2 33.9 0.5 29.9 0.5 34.0 0.5
Social limitation . . . . . . . . . . . . . . . . . . . . . 1.9 0.2 32.5 0.6 32.3 0.6 33.3 0.6
Work limitation. . . . . . . . . . . . . . . . . . . . . . 1.5 0.1 32.7 0.5 33.8 0.4 32.0 0.4
Self-care (ADL or IADL) limitation . . . . . . . . 2.4 0.2 37.7 0.8 30.6 0.7 29.4 0.8
Basic actions dificulty . . . . . . . . . . . . . . . . . . 1.3 0.1 32.9 0.3 35.8 0.3 29.9 0.3
18–44 years . . . . . . . . . . . . . . . . . . . . . . . 1.9 0.2 37.8 0.6 32.0 0.5 28.4 0.5
45–64 years . . . . . . . . . . . . . . . . . . . . . . . 0.8 0.1 26.1 0.5 36.9 0.5 36.2 0.5
65 years and over . . . . . . . . . . . . . . . . . . . 1.4 0.1 36.4 0.5 37.9 0.4 24.3 0.4
Men . . . . . . . . . . . . . . . . . . . . . . . . . . . . . * * 28.7 0.4 43.0 0.5 27.7 0.4
Women. . . . . . . . . . . . . . . . . . . . . . . . . . . 1.9 0.1 36.2 0.4 30.4 0.3 31.6 0.4
Movement difficulty . . . . . . . . . . . . . . . . . . 1.3 0.1 30.0 0.3 35.4 0.4 33.4 0.4
Least severe . . . . . . . . . . . . . . . . . . . . . * * 30.5 0.6 38.6 0.7 29.9 0.6
Level two. . . . . . . . . . . . . . . . . . . . . . . . * * 29.9 0.6 36.3 0.7 32.8 0.6
Level three . . . . . . . . . . . . . . . . . . . . . . 1.3 0.2 29.2 0.7 33.8 0.7 35.6 0.7
Level four . . . . . . . . . . . . . . . . . . . . . . . * * 29.4 0.8 32.0 0.8 36.8 0.9
Most severe. . . . . . . . . . . . . . . . . . . . . . * * 31.2 1.1 31.2 1.1 35.6 1.1
Emotional difficulty . . . . . . . . . . . . . . . . . . . * * 34.5 0.8 30.7 0.8 33.0 0.8
Seeing or hearing difficulty . . . . . . . . . . . . . 1.3 0.1 35.6 0.4 36.0 0.4 27.1 0.4
Cognitive difficulty . . . . . . . . . . . . . . . . . . . * * 39.3 0.9 31.4 0.9 27.2 0.8
No disability . . . . . . . . . . . . . . . . . . . . . . . . . 1.4 0.1 42.8 0.2 37.1 0.2 18.7 0.2
18–44 years . . . . . . . . . . . . . . . . . . . . . . . 1.8 0.1 46.3 0.3 34.2 0.2 17.8 0.2
45–64 years . . . . . . . . . . . . . . . . . . . . . . . 0.7 0.1 36.0 0.3 41.8 0.3 21.5 0.3
65 years and over . . . . . . . . . . . . . . . . . . . 1.0 0.1 41.9 0.6 41.5 0.6 15.6 0.4
Men . . . . . . . . . . . . . . . . . . . . . . . . . . . . . 0.3 0.0 33.2 0.3 46.1 0.3 20.4 0.2
Women. . . . . . . . . . . . . . . . . . . . . . . . . . . 2.5 0.1 52.9 0.3 27.7 0.3 16.9 0.2
* Figure does not meet standards of reliability or precision. 0.0 Quantity more than zero but less than 0.05.
NOTES: Healthy weight for adults is defined as a BMI of 18.5 to less than 25, underweight is a BMI less than 18.5, overweight is greater than or equal to a BMI of 25, and obesity is greater than or equal to a BMI of 30. See the Appendix for questions used to define types of disability. SE is standard error. ADL is activities of daily living. IADL is instrumental activities of daily living.
SOURCE: CDC/NCHS, National Health Interview Survey.
Data table for Figures 1–33 Page 65

Data table for Figure 19. Current cigarette smoking distribution among disabled and nondisabled adults, by age, sex, and type of limitation or difficulty: United States, 2001–2005
Current smoker Not current smoker
Percent SE Percent SE
Complex activity limitation. . . . . . . . . . . . . . . . . . . . . . . . . 26.0 0.4 74.0 0.4
18–44 years . . . . . . . . . . . . . . . . . . . . . . . . . . . . . . . . . 40.4 0.9 58.6 0.9
45–64 years . . . . . . . . . . . . . . . . . . . . . . . . . . . . . . . . . 31.9 0.6 68.1 0.6
65 years and over. . . . . . . . . . . . . . . . . . . . . . . . . . . . . 9.6 0.3 91.1 0.2
Male . . . . . . . . . . . . . . . . . . . . . . . . . . . . . . . . . . . . . . 29.3 0.6 70.7 0.6
Female . . . . . . . . . . . . . . . . . . . . . . . . . . . . . . . . . . . . 23.5 0.4 76.5 0.4
Social limitation . . . . . . . . . . . . . . . . . . . . . . . . . . . . . . 26.1 0.5 74.0 0.5
Work limitation . . . . . . . . . . . . . . . . . . . . . . . . . . . . . . . 27.0 0.4 21.0 0.2
Self-care (ADL or IADL) limitation . . . . . . . . . . . . . . . . . . 20.1 0.6 79.9 0.6
Basic actions difficulty . . . . . . . . . . . . . . . . . . . . . . . . . . . 24.5 0.3 75.5 0.3
18–44 years . . . . . . . . . . . . . . . . . . . . . . . . . . . . . . . . . 37.5 0.5 62.5 0.5
45–64 years . . . . . . . . . . . . . . . . . . . . . . . . . . . . . . . . . 27.8 0.4 72.2 0.4
65 years and over. . . . . . . . . . . . . . . . . . . . . . . . . . . . . 9.1 0.2 90.9 0.2
Male . . . . . . . . . . . . . . . . . . . . . . . . . . . . . . . . . . . . . . 27.3 0.4 72.7 0.4
Female . . . . . . . . . . . . . . . . . . . . . . . . . . . . . . . . . . . . 22.5 0.3 77.5 0.3
Movement difficulty . . . . . . . . . . . . . . . . . . . . . . . . . . . . 23.9 0.3 72.7 0.3
Emotional difficulty . . . . . . . . . . . . . . . . . . . . . . . . . . . . 43.0 0.8 57.1 0.8
Seeing or hearing difficulty. . . . . . . . . . . . . . . . . . . . . . . 23.3 0.4 76.7 0.4
Cognitive difficulty . . . . . . . . . . . . . . . . . . . . . . . . . . . . . 26.7 0.7 73.3 0.7
No disability. . . . . . . . . . . . . . . . . . . . . . . . . . . . . . . . . . . 20.4 0.2 79.6 0.2
18–44 years . . . . . . . . . . . . . . . . . . . . . . . . . . . . . . . . . 22.4 0.3 77.6 0.3
45–64 years . . . . . . . . . . . . . . . . . . . . . . . . . . . . . . . . . 19.5 0.3 80.5 0.3
65 years and over. . . . . . . . . . . . . . . . . . . . . . . . . . . . . 9.2 0.3 90.8 0.3
Male . . . . . . . . . . . . . . . . . . . . . . . . . . . . . . . . . . . . . . 23.2 0.2 76.8 0.2
Female . . . . . . . . . . . . . . . . . . . . . . . . . . . . . . . . . . . . 17.6 0.2 82.4 0.2
NOTES: See the Appendix for questions used to define types of disability. SE is standard error. ADL is activities of daily living. IADL is instrumental activities of daily living.
SOURCE: CDC/NCHS, National Health Interview Survey.
Page 66 Data table for Figures 1–33

Data table for Figure 20. Alcohol use distribution among disabled and nondisabled adults, by age, sex, and type of limitation or difficulty: United States, 2001–2005
Distribution among current drinkers 5 or more drinks on
Current drinker Current Current Current Current 21 or more days (any amount) infrequent light moderate heavy in the past year
Percent SE Percent SE Percent SE Percent SE Percent SE Percent SE
Complex activity limitation . . . . . 40.4 0.4 7.7 0.2 14.8 0.3 11.2 0.2 5.5 0.2 10.1 0.4
18–44 years. . . . . . . . . . . . . . 53.0 0.8 9.4 0.5 20.0 0.7 14.7 0.6 7.2 0.4 15.4 0.8
45–64 years. . . . . . . . . . . . . . 43.6 0.6 8.7 0.4 15.5 0.4 12.2 0.4 5.8 0.3 10.1 0.6
65 years and over . . . . . . . . . 28.7 0.6 5.6 0.3 10.6 0.4 7.8 0.3 4.0 0.2 3.3 0.4
Men . . . . . . . . . . . . . . . . . . . 47.2 0.6 6.5 0.3 15.2 0.5 15.0 0.4 8.8 0.4 15.8 0.6
Women . . . . . . . . . . . . . . . . . 35.5 0.5 8.6 0.3 14.5 0.4 8.4 0.3 3.1 0.2 4.5 0.3
Social limitations . . . . . . . . . . 36.9 0.6 7.3 0.3 13.9 0.4 9.7 0.3 5.1 0.3 9.6 0.5
Work limitations . . . . . . . . . . . 40.0 0.5 7.8 0.2 14.6 0.3 11.1 0.3 5.4 0.2 10.2 0.4
Self-care (ADL or IADL) limitation . . . . . . . . . . . . . . . 28.6 0.6 6.0 0.3 10.8 0.4 7.7 0.4 3.3 0.3 6.5 0.6
Basic actions difficulty . . . . . . . . 52.2 0.4 8.4 0.2 18.7 0.2 15.3 0.2 7.4 0.2 10.5 0.2
18–44 years. . . . . . . . . . . . . . 64.8 0.5 9.9 0.3 24.6 0.4 19.0 0.4 9.1 0.3 15.9 0.5
45–64 years. . . . . . . . . . . . . . 53.6 0.5 9.1 0.3 19.5 0.4 15.7 0.3 7.7 0.3 9.7 0.3
65 years and over . . . . . . . . . 36.7 0.5 6.2 0.2 12.7 0.3 11.4 0.3 5.6 0.2 3.5 0.3
Men . . . . . . . . . . . . . . . . . . . 58.4 0.4 6.5 0.2 18.4 0.4 20.2 0.3 11.3 0.3 16.8 0.4
Women . . . . . . . . . . . . . . . . . 46.2 0.4 9.7 0.2 19.0 0.3 11.7 0.2 4.7 0.1 4.9 0.2
Movement difficulty . . . . . . . . . 47.8 0.4 8.4 0.2 17.8 0.3 13.8 0.2 6.7 0.2 9.4 0.3
Least severe. . . . . . . . . . . . 62.7 0.6 9.0 0.3 22.9 0.5 19.1 0.5 9.8 0.4 11.0 0.5
Level two . . . . . . . . . . . . . . 52.9 0.7 9.0 0.3 19.7 0.5 15.6 0.5 7.4 0.3 8.6 0.5
Level three . . . . . . . . . . . . . 43.0 0.7 8.8 0.4 16.1 0.5 12.1 0.4 4.9 0.3 7.9 0.5
Level four . . . . . . . . . . . . . . 32.5 0.8 7.5 0.5 12.5 0.5 7.5 0.5 4.3 0.3 8.7 0.8
Most severe . . . . . . . . . . . . 22.8 0.9 5.3 0.4 8.7 0.6 5.5 0.4 2.7 0.4 * *
Emotional difficulty . . . . . . . . . 49.9 1.0 8.7 0.5 17.7 0.6 13.5 0.6 8.1 0.4 18.4 0.9
Seeing or hearing difficulty . . . 23.6 0.4 8.2 0.2 18.6 0.3 15.9 0.3 7.8 0.2 10.9 0.4
Cognitive difficulty. . . . . . . . . . 32.3 0.8 6.2 0.4 11.5 0.5 9.1 0.5 4.5 0.3 11.1 0.9
No disability . . . . . . . . . . . . . . . 65.2 0.3 7.3 0.1 23.9 0.2 22.6 0.2 9.2 0.1 11.3 0.2
18–44 years. . . . . . . . . . . . . . 67.0 0.4 7.3 0.1 25.2 0.2 23.3 0.2 9.0 0.2 14.1 0.3
45–64 years. . . . . . . . . . . . . . 65.6 0.4 7.6 0.2 23.0 0.3 22.7 0.3 10.0 0.2 7.3 0.2
65 years and over . . . . . . . . . 50.4 0.6 6.5 0.3 17.4 0.4 17.3 0.4 7.7 0.3 3.1 0.3
Men . . . . . . . . . . . . . . . . . . . 71.1 0.4 5.3 0.1 23.1 0.2 27.5 0.3 12.6 0.2 16.9 0.3
Women . . . . . . . . . . . . . . . . . 59.2 0.4 9.4 0.2 24.7 0.2 17.6 0.2 5.7 0.1 4.6 0.2
* Figure does not meet standards of reliability or precision.
NOTES: Level of alcohol consumption categories are based on self-reported responses to questions about average alcohol consumption. Light drinkers had 3 drinks or fewer per week, moderate drinkers had more than 3 drinks and up to 14 drinks per week for men and more than 3 drinks and up to 7 drinks per week for women, and heavy drinkers had more than 14 drinks per week for men and more than 7 drinks per week for women. The total for the current drinker categories (current infrequent, current light, current moderate, and current heavy) is slightly higher than the sum of the indivdual amount categories because some people reported current drinking but did not specify an amount. See U.S. Department of Agriculture: Dietary Guidelines for Americans, 2000, 5th edition. See the Appendix for questions used to define types of disability. SE is standard error. ADL is activities of daily living. IADL is instrumental activities of daily living.
SOURCE: CDC/NCHS, National Health Interview Survey.
Data table for Figures 1–33 Page 67

Data table for Figures 21 and 22. Leisure-time physical activity distribution among disabled and nondisabled adults, by age, sex, and type of limitation or difficulty: United States, 2001–2005
Unable to do Inactive Some Regular
Percent SE Percent SE Percent SE Percent SE
Complex activity limitation . . . . . . . . . . . . . . .
18–44 years . . . . . . . . . . . . . . . . . . . . . . .
45–64 years . . . . . . . . . . . . . . . . . . . . . . .
65 years and over . . . . . . . . . . . . . . . . . . .
10.8
6.7
10.2
14.1
0.4
0.5
0.5
0.5
47.7
41.0
46.3
53.7
0.6
0.8
0.8
0.7
26.9
30.6
28.7
22.5
0.4
0.8
0.6
0.5
14.7
21.7
14.8
9.7
0.3
0.7
0.4
0.3
Men . . . . . . . . . . . . . . . . . . . . . . . . . . . . .
Women. . . . . . . . . . . . . . . . . . . . . . . . . . .
10.5
10.9
0.5
0.4
45.7
49.2
0.7
0.6
26.8
27.0
0.6
0.5
16.9
13.0
0.5
0.3
Social limitation . . . . . . . . . . . . . . . . . . . . .
Work limitation. . . . . . . . . . . . . . . . . . . . . .
Self-care (ADL or IADL) limitation . . . . . . . .
14.8
11.1
17.1
0.6
0.1
0.7
50.5
47.1
55.2
0.7
0.6
0.8
24.2
27.2
19.8
0.5
0.4
0.6
10.4
14.6
8.1
0.4
0.3
0.4
Basic actions difficulty . . . . . . . . . . . . . . . . . .
18–44 years . . . . . . . . . . . . . . . . . . . . . . .
45–64 years . . . . . . . . . . . . . . . . . . . . . . .
65 years and over . . . . . . . . . . . . . . . . . . .
6.0
3.0
5.6
9.0
0.2
0.2
0.3
0.3
41.7
34.3
40.7
49.5
0.4
0.6
0.5
0.6
31.0
34.2
32.9
26.2
0.3
0.5
0.5
0.4
21.2
28.5
20.8
15.3
0.3
0.5
0.4
0.3
Men . . . . . . . . . . . . . . . . . . . . . . . . . . . . .
Women. . . . . . . . . . . . . . . . . . . . . . . . . . .
5.8
6.1
0.3
0.2
39.8
43.1
0.6
0.5
30.8
31.2
0.5
0.4
23.5
19.6
0.4
0.3
Movement difficulty . . . . . . . . . . . . . . . . . .
Least severe . . . . . . . . . . . . . . . . . . . . .
Level two. . . . . . . . . . . . . . . . . . . . . . . .
Level three . . . . . . . . . . . . . . . . . . . . . .
Level four . . . . . . . . . . . . . . . . . . . . . . .
Most severe. . . . . . . . . . . . . . . . . . . . . .
7.8
1.2
3.5
8.8
16.5
24.7
0.3
0.1
0.2
0.5
0.7
1.1
43.8
30.3
41.4
49.2
57.3
59.5
0.5
0.6
0.7
0.7
0.9
1.2
30.6
38.1
35.3
29.9
19.9
12.2
0.4
0.6
0.6
0.6
0.7
0.7
17.7
30.5
19.8
12.1
6.3
3.5
0.3
0.6
0.5
0.4
0.3
0.4
Emotional difficulty . . . . . . . . . . . . . . . . . . .
Seeing or hearing difficulty . . . . . . . . . . . . .
Cognitive difficulty . . . . . . . . . . . . . . . . . . .
8.9
5.9
12.9
0.6
0.2
1.1
48.6
39.3
53.6
0.9
0.5
1.0
25.2
31.2
23.4
0.7
0.4
0.8
17.2
23.6
10.1
0.6
0.4
0.5
No disability . . . . . . . . . . . . . . . . . . . . . . . . .
18–44 years . . . . . . . . . . . . . . . . . . . . . . .
45–64 years . . . . . . . . . . . . . . . . . . . . . . .
65 years and over . . . . . . . . . . . . . . . . . . .
0.1
0.1
0.1
0.3
0.0
0.0
0.0
0.1
32.8
31.8
33.3
38.4
0.4
0.4
0.4
0.7
32.2
32.4
32.5
29.8
0.2
0.3
0.3
0.5
34.8
35.6
34.1
31.4
0.3
0.3
0.4
0.6
Men . . . . . . . . . . . . . . . . . . . . . . . . . . . . .
Women. . . . . . . . . . . . . . . . . . . . . . . . . . .
. . .
. . .
. . .
. . .
31.3
34.4
0.4
0.4
31.9
32.6
0.3
0.3
36.7
32.9
0.3
0.3
. . . Category not applicable. 0.0 Quantity more than zero but less than 0.05.
NOTES: See the Appendix for details of physical activity variable construction and questions used to define types of disability. SE is standard error. ADL is activities of daily living. IADL is instrumental activities of daily living.
SOURCE: CDC/NCHS, National Health Interview Survey.
Page 68 Data table for Figures 1–33

Data table for Figures 23 and 24. Usual source of medical care and place of care among disabled and nondisabled adults, by age and type of limitation or difficulty: United States, 2001–2005
Place of usual source of medical care
Has usual source No usual source Clinic or Doctor’s Hospital outpatient of medical care of medical care health center office department
Percent SE Percent SE Percent SE Percent SE Percent SE
Complex activity limitation . . . . . . . . 92.2 0.2 7.8 0.2 17.9 0.5 78.3 0.5 2.8 0.1
18–44 years . . . . . . . . . . . . . . . . 83.8 0.6 16.2 0.6 23.6 0.9 72.3 0.9 2.7 0.2
45–64 years . . . . . . . . . . . . . . . . 92.9 0.3 7.1 0.3 20.1 0.6 75.3 0.6 3.3 0.2
65 years and over . . . . . . . . . . . . 97.2 0.2 2.8 0.2 12.3 0.5 84.7 0.6 2.3 0.2
Social limitation. . . . . . . . . . . . . . 93.0 0.3 7.0 0.3 17.8 0.5 79.1 0.6 2.4 0.2
Work limitation . . . . . . . . . . . . . . 92.4 0.2 7.6 0.2 18.0 0.5 77.8 0.6 3.1 0.2
Self-care (ADL or IADL) limitation. . . . . . . . . . . . . . . . . . 95.8 0.3 4.2 0.3 15.8 0.7 81.0 0.7 2.4 0.2
Basic actions difficulty. . . . . . . . . . . 89.6 0.2 10.4 0.2 17.3 0.4 79.8 0.4 2.1 0.1
18–44 years . . . . . . . . . . . . . . . . 79.6 0.4 20.4 0.4 22.2 0.6 74.5 0.6 2.2 0.2
45–64 years . . . . . . . . . . . . . . . . 90.9 0.2 9.1 0.2 18.5 0.5 78.5 0.5 2.3 0.1
65 years and over . . . . . . . . . . . . 97.0 0.2 3.0 0.2 12.4 0.5 85.2 0.5 2.0 0.1
Movement difficulty . . . . . . . . . . . 91.6 0.2 8.4 0.2 16.7 0.4 80.4 0.4 2.2 0.1
Least severe . . . . . . . . . . . . . . 88.4 0.4 11.6 0.4 17.4 0.5 80.0 0.6 1.8 0.2
Level two . . . . . . . . . . . . . . . . 90.9 0.4 9.1 0.4 16.6 0.5 80.4 0.5 2.2 0.2
Level three . . . . . . . . . . . . . . . 93.2 0.3 6.8 0.3 16.9 0.6 80.2 0.6 2.3 0.2
Level four . . . . . . . . . . . . . . . . 94.5 0.4 5.5 0.4 16.8 0.7 80.2 0.8 2.3 0.2
Most severe . . . . . . . . . . . . . . 94.8 0.5 5.2 0.5 14.7 0.8 82.4 0.8 2.4 0.3
Emotional difficulty . . . . . . . . . . . 82.4 0.7 17.6 0.7 23.5 0.8 72.5 0.8 2.9 0.3
Seeing or hearing difficulty . . . . . . 88.7 0.3 11.3 0.3 17.8 0.5 79.4 0.5 2.1 0.1
Cognitive difficulty . . . . . . . . . . . . 92.5 0.4 7.5 0.4 18.5 0.8 77.0 0.8 3.3 0.3
No disability . . . . . . . . . . . . . . . . . . 83.1 0.2 16.9 0.2 16.2 0.3 81.8 0.3 1.2 0.1
18–44 years . . . . . . . . . . . . . . . . 78.4 0.3 21.6 0.3 18.5 0.4 79.4 0.4 1.2 0.1
45–64 years . . . . . . . . . . . . . . . . 89.6 0.2 10.4 0.2 13.6 0.4 84.5 0.4 1.3 0.1
65 years and over . . . . . . . . . . . . 94.9 0.2 5.1 0.2 10.8 0.5 87.6 0.5 1.2 0.1
NOTES: Persons listing emergency department as their usual source of care are considered to have no usual source of medical care. Usual place of care other than the three places listed here comprise less than 2% of places and are not included in this table. See the Appendix for questions used to define types of disability. SE is standard error. ADL is activities of daily living. IADL is instrumental activities of daily living.
SOURCE: CDC/NCHS, National Health Interview Survey.
Data table for Figures 1–33 Page 69

Data table for Figures 25–28. Insurance coverage at time of interview among disabled and nondisabled adults aged 18–64 years, by age, sex, and type of limitation or difficulty: United States, 2001–2005
Uninsured Private Medicaid Medicare
Percent SE Percent SE Percent SE Percent SE
Complex activity limitation . . . . . . . . . . . . . . .
18–44 years . . . . . . . . . . . . . . . . . . . . . . .
45–64 years . . . . . . . . . . . . . . . . . . . . . . .
16.8
21.9
13.6
0.4
0.7
0.4
46.3
40.1
50.3
0.6
0.8
0.7
25.8
32.8
21.3
0.5
0.8
0.6
19.7
11.3
25.0
0.4
0.5
0.5
Men . . . . . . . . . . . . . . . . . . . . . . . . . . . . .
Women. . . . . . . . . . . . . . . . . . . . . . . . . . .
18.4
15.4
0.6
0.4
43.3
48.9
0.8
0.7
23.3
27.8
0.7
0.6
23.2
16.8
0.6
0.5
Social limitation . . . . . . . . . . . . . . . . . . . . .
Work limitation. . . . . . . . . . . . . . . . . . . . . .
Self-care (ADL or IADL) limitation . . . . . . . .
16.1
16.0
11.0
0.5
0.4
0.6
46.8
43.5
38.2
0.8
0.6
1.0
26.1
28.2
38.2
0.7
0.6
1.1
21.1
22.5
30.5
0.6
0.4
0.9
Basic actions difficulty . . . . . . . . . . . . . . . . . .
18–44 years . . . . . . . . . . . . . . . . . . . . . . .
45–64 years . . . . . . . . . . . . . . . . . . . . . . .
18.6
24.6
13.9
0.3
0.5
0.3
61.3
55.5
65.8
0.4
0.6
0.5
14.0
17.0
11.7
0.3
0.4
0.3
9.0
4.3
12.6
0.2
0.2
0.3
Men . . . . . . . . . . . . . . . . . . . . . . . . . . . . .
Women. . . . . . . . . . . . . . . . . . . . . . . . . . .
19.7
17.7
0.4
0.3
60.5
61.9
0.6
0.5
11.4
16.0
0.4
0.3
10.8
7.6
0.3
0.2
Movement difficulty . . . . . . . . . . . . . . . . . .
Least severe . . . . . . . . . . . . . . . . . . . . .
Level two. . . . . . . . . . . . . . . . . . . . . . . .
Level three . . . . . . . . . . . . . . . . . . . . . .
Level four . . . . . . . . . . . . . . . . . . . . . . .
Most severe. . . . . . . . . . . . . . . . . . . . . .
17.1
17.6
17.7
16.8
17.0
13.1
0.3
0.6
0.6
0.6
0.8
1.0
59.9
71.7
64.0
54.4
41.7
35.6
0.5
0.6
0.7
0.8
1.2
1.5
15.8
7.5
12.8
19.7
27.4
34.8
0.3
0.4
0.5
0.7
1.0
1.5
11.4
2.6
7.0
15.5
26.4
32.5
0.3
0.2
0.4
0.6
1.0
1.3
Emotional difficulty . . . . . . . . . . . . . . . . . . .
Seeing or hearing difficulty . . . . . . . . . . . . .
Cognitive difficulty . . . . . . . . . . . . . . . . . . .
28.2
19.7
13.6
0.8
0.4
0.8
38.0
62.3
32.1
0.9
0.5
1.1
26.3
12.4
41.0
0.8
0.4
1.1
13.0
8.5
27.0
0.6
0.3
1.0
No disability . . . . . . . . . . . . . . . . . . . . . . . . .
18–44 years . . . . . . . . . . . . . . . . . . . . . . .
45–64 years . . . . . . . . . . . . . . . . . . . . . . .
18.9
22.4
11.8
0.2
0.3
0.2
75.2
71.0
83.9
0.3
0.3
0.3
4.3
5.4
1.9
0.1
0.1
0.1
0.3
0.2
0.7
–
–
0.1
Men . . . . . . . . . . . . . . . . . . . . . . . . . . . . .
Women. . . . . . . . . . . . . . . . . . . . . . . . . . .
20.9
16.8
0.3
0.2
75.0
75.3
0.3
0.3
2.6
6.1
0.1
0.2
0.3
0.4
–
–
– Quantity zero.
NOTES: Insurance categories are not mutually exclusive; for example, a person could be covered by both Medicare and Medicaid or by Medicare and private insurance. See the Appendix for questions used to define types of disability. SE is standard error. ADL is activities of daily living. IADL is instrumental activities of daily living.
SOURCE: CDC/NCHS, National Health Interview Survey.
Page 70 Data table for Figures 1–33

Data table for Figures 29, 30, and 33. Influenza vaccination within the past 12 months among disabled and nondisabled adults aged 18 years and over, by age, sex, and type of limitation or difficulty: United States, 2001–2005
Influenza shot in past 12 months
Men Women
Percent SE Percent SE
Complex activity . . . . . . . . . . . . . . . . . . . . . . . . . . . . . . .
18–44 years . . . . . . . . . . . . . . . . . . . . . . . . . . . . . . . . .
45–64 years . . . . . . . . . . . . . . . . . . . . . . . . . . . . . . . . .
65 years and over. . . . . . . . . . . . . . . . . . . . . . . . . . . . .
50 years and over . . . . . . . . . . . . . . . . . . . . . . . . . . . . . .
Social limitation . . . . . . . . . . . . . . . . . . . . . . . . . . . . . .
Work limitation . . . . . . . . . . . . . . . . . . . . . . . . . . . . . . .
Self-care (ADL or IADL) limitation . . . . . . . . . . . . . . . . . .
Basic actions . . . . . . . . . . . . . . . . . . . . . . . . . . . . . . . . . .
18–44 years . . . . . . . . . . . . . . . . . . . . . . . . . . . . . . . . .
45–64 years . . . . . . . . . . . . . . . . . . . . . . . . . . . . . . . . .
65 years and over. . . . . . . . . . . . . . . . . . . . . . . . . . . . .
50 years and over . . . . . . . . . . . . . . . . . . . . . . . . . . . . . .
Movement difficulty . . . . . . . . . . . . . . . . . . . . . . . . . . . .
Least severe . . . . . . . . . . . . . . . . . . . . . . . . . . . . . . .
Level two . . . . . . . . . . . . . . . . . . . . . . . . . . . . . . . . .
Level three . . . . . . . . . . . . . . . . . . . . . . . . . . . . . . . .
Level four . . . . . . . . . . . . . . . . . . . . . . . . . . . . . . . . .
Most severe . . . . . . . . . . . . . . . . . . . . . . . . . . . . . . .
Emotional difficulty . . . . . . . . . . . . . . . . . . . . . . . . . . . .
Seeing or hearing difficulty. . . . . . . . . . . . . . . . . . . . . . .
Cognitive difficulty . . . . . . . . . . . . . . . . . . . . . . . . . . . . .
No disability . . . . . . . . . . . . . . . . . . . . . . . . . . . . . . . . . .
18–44 years . . . . . . . . . . . . . . . . . . . . . . . . . . . . . . . . .
45–64 years . . . . . . . . . . . . . . . . . . . . . . . . . . . . . . . . .
65 years and over. . . . . . . . . . . . . . . . . . . . . . . . . . . . .
50 years and over . . . . . . . . . . . . . . . . . . . . . . . . . . . . . .
42.5
21.4
35.5
68.1
53.6
54.9
53.1
57.6
38.6
15.4
31.3
68.7
52.5
53.9
50.1
52.7
55.1
56.9
60.6
42.3
55.4
56.0
19.2
12.4
23.5
57.5
35.4
0.6
1.1
0.9
0.9
0.7
1.1
0.8
1.4
0.4
0.6
0.6
0.7
0.5
0.6
1.2
1.2
1.3
1.5
1.9
2.0
0.8
1.6
0.2
0.3
0.4
0.9
0.5
44.5
20.3
38.1
65.5
55.2
56.4
54.3
58.9
40.0
17.3
34.6
66.0
53.8
54.7
51.0
54.5
57.1
54.0
57.4
44.3
54.9
56.9
23.0
14.7
28.7
58.3
40.7
0.5
0.9
0.8
0.7
0.6
0.8
0.7
0.9
0.4
0.6
0.6
0.5
0.5
0.5
1.1
0.9
0.9
1.1
1.2
1.5
0.7
1.3
0.2
0.2
0.4
0.8
0.5
NOTES: See the Appendix for questions used to define types of disability. SE is standard error. ADL is activities of daily living. IADL is instrumental activities of daily living.
SOURCE: CDC/NCHS, National Health Interview Survey.
Data table for Figures 1–33 Page 71
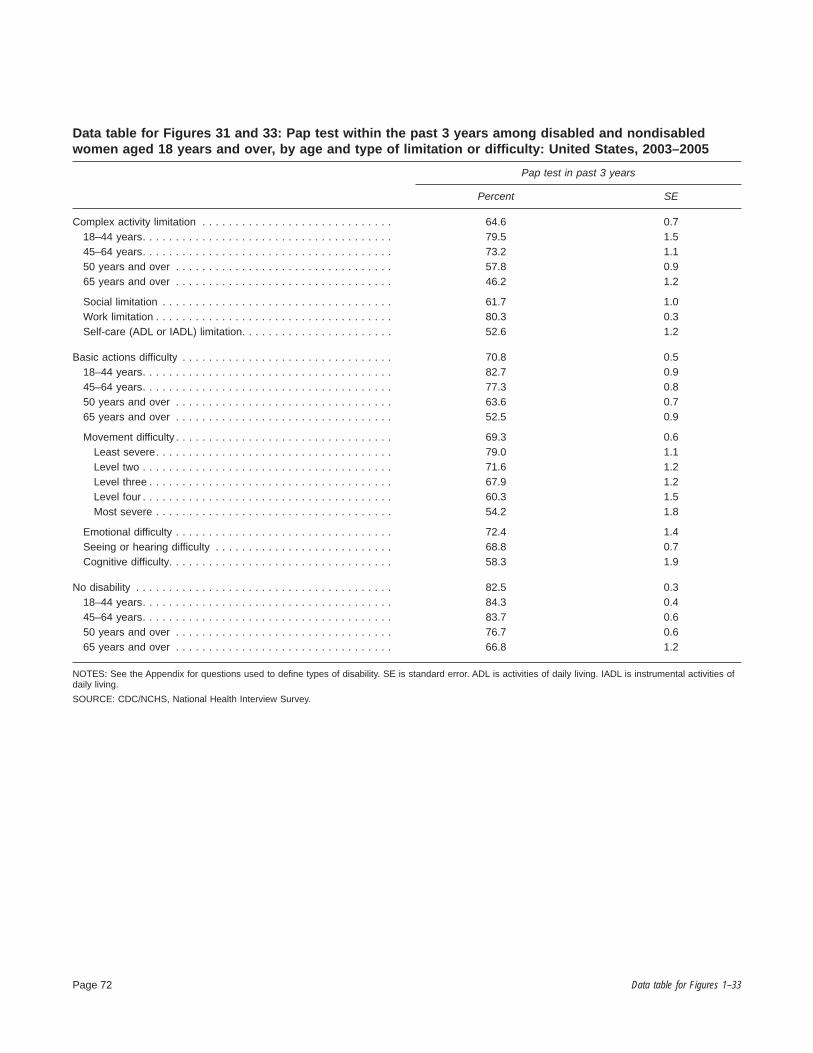
Data table for Figures 31 and 33: Pap test within the past 3 years among disabled and nondisabled women aged 18 years and over, by age and type of limitation or difficulty: United States, 2003–2005
Pap test in past 3 years
Percent SE
Complex activity limitation . . . . . . . . . . . . . . . . . . . . . . . . . . . . .
18–44 years. . . . . . . . . . . . . . . . . . . . . . . . . . . . . . . . . . . . . .
45–64 years. . . . . . . . . . . . . . . . . . . . . . . . . . . . . . . . . . . . . .
50 years and over . . . . . . . . . . . . . . . . . . . . . . . . . . . . . . . . .
65 years and over . . . . . . . . . . . . . . . . . . . . . . . . . . . . . . . . .
Social limitation . . . . . . . . . . . . . . . . . . . . . . . . . . . . . . . . . . .
Work limitation . . . . . . . . . . . . . . . . . . . . . . . . . . . . . . . . . . . .
Self-care (ADL or IADL) limitation. . . . . . . . . . . . . . . . . . . . . . .
64.6
79.5
73.2
57.8
46.2
61.7
80.3
52.6
0.7
1.5
1.1
0.9
1.2
1.0
0.3
1.2
Basic actions difficulty . . . . . . . . . . . . . . . . . . . . . . . . . . . . . . . .
18–44 years. . . . . . . . . . . . . . . . . . . . . . . . . . . . . . . . . . . . . .
45–64 years. . . . . . . . . . . . . . . . . . . . . . . . . . . . . . . . . . . . . .
50 years and over . . . . . . . . . . . . . . . . . . . . . . . . . . . . . . . . .
65 years and over . . . . . . . . . . . . . . . . . . . . . . . . . . . . . . . . .
Movement difficulty . . . . . . . . . . . . . . . . . . . . . . . . . . . . . . . . .
Least severe. . . . . . . . . . . . . . . . . . . . . . . . . . . . . . . . . . . .
Level two . . . . . . . . . . . . . . . . . . . . . . . . . . . . . . . . . . . . . .
Level three . . . . . . . . . . . . . . . . . . . . . . . . . . . . . . . . . . . . .
Level four . . . . . . . . . . . . . . . . . . . . . . . . . . . . . . . . . . . . . .
Most severe . . . . . . . . . . . . . . . . . . . . . . . . . . . . . . . . . . . .
Emotional difficulty . . . . . . . . . . . . . . . . . . . . . . . . . . . . . . . . .
Seeing or hearing difficulty . . . . . . . . . . . . . . . . . . . . . . . . . . .
Cognitive difficulty. . . . . . . . . . . . . . . . . . . . . . . . . . . . . . . . . .
70.8
82.7
77.3
63.6
52.5
69.3
79.0
71.6
67.9
60.3
54.2
72.4
68.8
58.3
0.5
0.9
0.8
0.7
0.9
0.6
1.1
1.2
1.2
1.5
1.8
1.4
0.7
1.9
No disability . . . . . . . . . . . . . . . . . . . . . . . . . . . . . . . . . . . . . . .
18–44 years. . . . . . . . . . . . . . . . . . . . . . . . . . . . . . . . . . . . . .
45–64 years. . . . . . . . . . . . . . . . . . . . . . . . . . . . . . . . . . . . . .
50 years and over . . . . . . . . . . . . . . . . . . . . . . . . . . . . . . . . .
65 years and over . . . . . . . . . . . . . . . . . . . . . . . . . . . . . . . . .
82.5
84.3
83.7
76.7
66.8
0.3
0.4
0.6
0.6
1.2
NOTES: See the Appendix for questions used to define types of disability. SE is standard error. ADL is activities of daily living. IADL is instrumental activities of daily living.
SOURCE: CDC/NCHS, National Health Interview Survey.
Page 72 Data table for Figures 1–33

Data table for Figures 32 and 33. Mammogram within the past 2 years among disabled and nondisabled women aged 18 years and over, by age, sex, and type of limitation or difficulty: United States, 2003–2005
Mammogram in past 2 years
Percent SE
Complex activity limitation . . . . . . . . . . . . . . . . . . . . . . . . . . . . . .
18–44 years . . . . . . . . . . . . . . . . . . . . . . . . . . . . . . . . . . . . . .
45–64 years . . . . . . . . . . . . . . . . . . . . . . . . . . . . . . . . . . . . . .
65 years and over . . . . . . . . . . . . . . . . . . . . . . . . . . . . . . . . . .
56.0
31.7
67.5
55.0
0.8
1.7
1.2
1.3
50 years and over. . . . . . . . . . . . . . . . . . . . . . . . . . . . . . . . . . . .
Social limitation . . . . . . . . . . . . . . . . . . . . . . . . . . . . . . . . . . . .
Work limitation . . . . . . . . . . . . . . . . . . . . . . . . . . . . . . . . . . . .
Self-care (ADL or IADL) limitation. . . . . . . . . . . . . . . . . . . . . . . .
61.4
58.3
62.0
51.2
0.9
1.2
1.1
1.5
Basic actions difficulty . . . . . . . . . . . . . . . . . . . . . . . . . . . . . . . . .
18–44 years . . . . . . . . . . . . . . . . . . . . . . . . . . . . . . . . . . . . . .
45–64 years . . . . . . . . . . . . . . . . . . . . . . . . . . . . . . . . . . . . . .
65 years and over . . . . . . . . . . . . . . . . . . . . . . . . . . . . . . . . . .
59.3
33.0
69.8
62.5
0.6
1.1
0.9
1.0
50 years and over. . . . . . . . . . . . . . . . . . . . . . . . . . . . . . . . . . . .
Movement difficulty . . . . . . . . . . . . . . . . . . . . . . . . . . . . . . . . .
Least severe . . . . . . . . . . . . . . . . . . . . . . . . . . . . . . . . . . . .
Level two . . . . . . . . . . . . . . . . . . . . . . . . . . . . . . . . . . . . . .
Level three . . . . . . . . . . . . . . . . . . . . . . . . . . . . . . . . . . . . .
Level four . . . . . . . . . . . . . . . . . . . . . . . . . . . . . . . . . . . . . .
Most severe . . . . . . . . . . . . . . . . . . . . . . . . . . . . . . . . . . . .
Emotional difficulty. . . . . . . . . . . . . . . . . . . . . . . . . . . . . . . . . .
Seeing or hearing difficulty . . . . . . . . . . . . . . . . . . . . . . . . . . . .
Cognitive difficulty . . . . . . . . . . . . . . . . . . . . . . . . . . . . . . . . . .
66.5
66.4
75.4
69.8
66.3
59.1
54.9
58.4
62.8
52.1
0.7
0.8
1.5
1.4
1.4
1.8
2.0
2.2
1.1
2.2
No disability . . . . . . . . . . . . . . . . . . . . . . . . . . . . . . . . . . . . . . .
18–44 years . . . . . . . . . . . . . . . . . . . . . . . . . . . . . . . . . . . . . .
45–64 years . . . . . . . . . . . . . . . . . . . . . . . . . . . . . . . . . . . . . .
65 years and over . . . . . . . . . . . . . . . . . . . . . . . . . . . . . . . . . .
54.3
32.2
74.5
71.3
0.5
0.6
0.7
1.1
50 years and over. . . . . . . . . . . . . . . . . . . . . . . . . . . . . . . . . . . . 74.4 0.6
NOTES: See the Appendix for questions used to define types of disability. SE is standard error. ADL is activities of daily living. IADL is instrumental activities of daily living.
SOURCE: CDC/NCHS, National Health Interview Survey.
Data table for Figures 1–33 Page 73

Appendix
The Appendix briefly describes the National Health Interview Survey (NHIS) and how disability variables were constructed. It also provides information about the questions on which sociodemographic and health-related variables are based.
National Health Interview Survey
All data presented in this report are from NHIS, which monitors the health of the U.S. population through the collection and analysis of data on a broad range of health topics. A major strength of this survey lies in its ability to analyze health measures by many demographic and socioeconomic characteristics.
NHIS obtains information during household interviews on illnesses, injuries, activity limitation, chronic conditions, health insurance coverage, utilization of health care, and other health topics. Demographic data include age, sex, education, race and ethnicity (reported by respondent or proxy), place of birth, income, and place of residence. Other data collected include risk factors such as lack of exercise, smoking, alcohol consumption, as well as use of prevention services such as vaccinations, mammography, and Pap smears. Special modules and supplements focus on different issues each year and have included topics such as aging, cancer screening, prevention, and alternative and complementary medicine. The NHIS on Disability, which focuses specifically on issues related to the disabled population, was last conducted in 1995.
NHIS has been conducted annually since 1957 with a major redesign every 10 to 15 years. It covers the civilian noninstitutionalized population of the United States. Excluded from the survey are patients in long-term care facilities, those on active duty with the Armed Forces (although their dependents are included), those in prison, and U.S. nationals living in foreign countries.
NHIS is a cross-sectional household interview survey. Sampling and interviewing are continuous throughout each year. The sampling plan follows a multistage area probability design that permits the representative sampling of households. The sampling plan was redesigned in 1995 and again for the 2006 survey. In the 1995 design, which was in effect during the data years covered by this chartbook, the first stage consists of a sample of 358 primary sampling units (PSUs) drawn from approximately 1,900 geographically defined PSUs that cover the 50 states and the District of
Page 74
Columbia. A PSU consists of a county, a small group of contiguous counties, or a metropolitan statistical area.
Within a PSU, two types of second-stage units are used: area segments and permit area segments. Area segments are defined geographically and contain an expected 8 or 12 addresses. Permit area segments cover geographical areas containing housing units built after the 1990 census. The permit area segments are defined using updated lists of building permits issued in the PSU since 1990, and they contain an expected four addresses. Within each segment, all occupied households at the sample addresses are targeted for interview.
The total NHIS sample of PSUs is subdivided into four separate panels, or subdesigns, such that each panel is a representative sample of the U.S. population. This design feature has a number of advantages, including flexibility for the total sample size. The households selected for interview each week in NHIS are a probability sample representative of the target population.
The NHIS questionnaire revision, implemented in 1997, has two basic parts: a core module and one or more supplements that vary by year. The core remains largely unchanged from year to year and allows for trend analysis and for data from more than 1 year to be pooled to increase sample size for analytic purposes. The core contains three components: the family, the sample adult, and the sample child. The family component collects information on everyone in the family and allows NHIS to serve as a sampling frame for additional integrated surveys as needed. Information collected in the family section for all family members includes household composition and sociodemographic characteristics, tracking information, information for matches to administrative databases, health insurance coverage, and basic indicators of health status and utilization of health care services. From each family in NHIS, one sample adult and one sample child (for families with children under 18 years of age) are randomly selected to participate in the sample adult and the sample child questionnaires. Because some health issues are different for children and adults, these two questionnaires differ in some items, but both collect basic information on health status, use of health care services, health conditions, and health behaviors. Most of the data presented in this chartbook are taken from the Sample Adult Core Questionnaire.
From 2001–2005, the sample numbered about 100,000 people each year, with about 31,000 to 33,000 people participating in the Sample Adult Core Questionnaire each year. During 2001–2005, a total of 157,976 sample adults participated in NHIS; the final sample adult response rate was
Appendix

72.7% for the 5-year period. Estimates in this chartbook are based on those sample adults.
For more information, see the NHIS website: www.cdc.gov/nchs/nhis.htm.
Construction of Disability Variables
Complex Activity Limitation
Self-care (ADL or IADL) limitation—The self-care measure is based on NHIS questions on whether a person had difficulty with any component of either the activities of daily living (ADL) index or the instrumental activities of daily living (IADL) index, which are defined here:
ADL are activities related to personal care and include bathing or showering, dressing, getting in or out of bed or a chair, using the toilet, and eating and getting around inside the home. In NHIS, respondents are asked whether they or family members 3 years of age and over need the help of another person with personal care because of a physical, mental, or emotional problem. People are considered to have an ADL limitation in NHIS if they respond affirmatively to the ADL questions and if the condition causing the respondent to need help with the specific activities is chronic (based on permanent chronic conditions such as diabetes or indications that the condition has existed for 3 months or more).
IADL are activities related to independent living and include household chores, doing necessary business, shopping, or getting around for other purposes. In NHIS, respondents are asked whether they or family members 18 years of age and over need the help of another person for handling routine IADL needs because of a physical, mental, or emotional problem. People are considered to have an IADL limitation in NHIS if they respond affirmatively to the IADL questions and if the condition causing the respondent to need help is categorized as chronic (based on permanent chronic conditions such as diabetes or indications that the condition has existed for 3 months or more).
Social limitation—Social limitation is defined on the basis of three NHIS questions:
‘‘By yourself, and without using any special equipment, how difficult is it for you to
. . . Go out to things like shopping, movies, or sporting events?
Appendix
. . . Participate in social activities such as visiting friends, attending clubs and meetings, going to parties?
. . . Do things to relax at home or for leisure (reading, watching TV, sewing, listening to music)?’’
Possible answers for this question included ‘‘not at all difficult,’’ ‘‘a little difficult,’’ ‘‘only somewhat difficult,’’ ‘‘very difficult,’’ or ‘‘can’t do at all.’’ Social limitation is defined as a response of ‘‘somewhat difficult,’’ ‘‘very difficult,’’ or ‘‘cannot do at all’’ for any of the three questions. Other possible answers such as ‘‘do not do this activity,’’ ‘‘refused,’’ or ‘‘don’t know’’ were treated as missing data in the analysis.
Work limitation—Inability to work is operationalized in NHIS as either a respondent-defined limitation in the kind or amount of work that they can do or as a complete inability to work. Two questions are used to identify this status:
‘‘Does a physical, mental, or emotional problem NOW keep {you/anyone in the family (age 18+)} from working at a job or business?’’
If not yes:
‘‘{Are/any of these family members} limited in the kind OR amount of work {you/they} can do because of a physical, mental or emotional problem?’’
Answer categories include ‘‘yes,’’ ‘‘no,’’ ‘‘refused,’’ or ‘‘don’t know.’’ A positive answer on either question identified the person as having a work limitation.
Basic Actions Difficulty
Movement difficulty—Movement actions without the use of assistive equipment are captured in terms of both upper body and lower body functions. The NHIS questions on movement difficulty are listed below and are prefaced with a reference to a health problem.
‘‘The next questions ask about difficulties you may have doing certain activities because of a HEALTH PROBLEM. By ‘health problem’ we mean any physical, mental, or emotional problem of illness (not including pregnancy).’’
‘‘By yourself, and without using any special equipment, how difficult is it for you to
. . . Walk a quarter of a mile—about 3 city blocks?
. . . Walk up 10 steps without resting?
. . . Stand or be on your feet for about 2 hours?
. . . Sit for about 2 hours?
Page 75

. . . Stoop, bend, or kneel?
. . . Reach up over your head?
. . . Use your fingers to grasp or handle small objects?
. . . Lift or carry something as heavy as 10 pounds such as a full bag of groceries?’’
Possible answers include ‘‘not at all difficult,’’ ‘‘only a little difficult,’’ ‘‘only somewhat difficult,’’ ‘‘very difficult,’’ or ‘‘can’t do at all.’’ Movement difficulty is defined as a response of ‘‘somewhat difficult,’’ ‘‘very difficult,’’ or ‘‘can’t do at all’’ on any of the questions. An answer of ‘‘only a little difficult’’ is treated as ’’not at all difficult,’’ and such a response is considered not disabled. Other possible answers such as ‘‘do not do this activity,’’ ‘‘refused,’’ or ‘‘don’t know,’’ were treated as missing data and not included in the analysis. A person is considered to have movement difficulty if they responded that they had any difficulty with any of the movement questions. If a person had missing data on all eight questions about movement difficulty, they were not included in the charts or tables.
Severity of movement difficulty—For adults with any difficulty in movement, as defined above, a measure of movement severity was constructed using the same elements but a slightly different coding. Those with missing data on these questions (defined above) were treated as ‘‘not at all difficult’’ and coded zero in the analysis. People with responses of ‘‘a little difficulty’’ were included in the weighted score. The weighted average score was created as follows: an answer of ‘‘not at all difficult’’ was coded zero, ‘‘a little difficulty’’ was coded one, ‘‘only somewhat difficult’’ was coded as two, ‘‘very difficult’’ was coded as three, and ‘‘can’t do at all’’ was coded as four.
The various types of movement were weighted to reflect how important a particular function would be to maintaining an independent lifestyle. Sitting for 2 hours and stooping, bending, or kneeling were weighted as one; standing on one’s feet and lifting or carrying something as heavy as 10 pounds were each weighted as two; walking up 10 stairs and reaching overhead were each weighted as three; and walking one-fourth of a mile and using the fingers to grasp were each weighted as four.
To calculate the individual score, each person’s response was coded to the level of difficulty and multiplied by the weight of that particular movement. Those numbers were totaled and then divided by 8 (number of types of movements) for each person. Scores greater than zero were divided into quintiles. Scores in the first quintile, which reflected the least severe problems, were greater than zero, but less than 1.125; the second level range was
Page 76
greater than 1.125, but less than or equal to 2.5. The third level of severity included scores greater than 2.5 and less than or equal to 4.625; the fourth level of severity included scores greater than 4.625 but less than or equal to 6.375. Finally, a score greater than 6.375 represented the most severe level of difficulty with movement. The lower the total score, the less severe the movement difficulty based on all the types and difficulty levels of movement reported. The measure of severity as reported in the tables and the charts refers only to people who reported some level of difficulty in one or more of the movement questions.
Emotional difficulty—Emotional difficulty is defined as having a score of 13 or more on the K6 serious psychological distress scale. The K6 instrument is a measure of psychological distress associated with unspecified but potentially diagnosable mental illness that may result in a higher risk for disability and a higher utilization of health services. In NHIS, the K6 is asked of adults 18 years of age and over. The K6 is designed to identify a person with serious psychological distress using as few questions as possible. The six items included in the K6 are as follows:
‘‘During the past 30 days, how often did you feel
. . . So sad that nothing could cheer you up?
. . . Nervous?
. . . Restless or fidgety?
. . . Hopeless?
. . . That everything was an effort?
. . . Worthless?
Possible answers are ‘‘all of the time’’ (4 points), ‘‘most of the time’’ (3 points), ‘‘some of the time’’ (2 points), ‘‘a little of the time’’ (1 point), and ‘‘none of the time’’ (0 points).
To score the K6, the points are added together yielding a possible total of 0 to 24 points. A threshold of 13 points or more is used to define serious psychological distress. Anyone answering some of the time to all six questions would not reach the threshold for serious psychological distress because, to achieve a score of 13, he or she would need to answer most of the time to at least one item.
For more information, see the following reference: Kessler RC, Barker PR, Colpe LJ, et al. Screening for serious mental illness in the general population. Arch Gen Psychiatry 60:184–9. 2003.
Sensory (seeing or hearing) difficulty—Difficulties with seeing and hearing are based on two short sets of NHIS questions:
Appendix

‘‘Do you have any trouble seeing, even when wearing glasses or contact lenses?’’
If the response is yes:
‘‘Are you blind or unable to see at all?’’
Respondents are counted as having a problem seeing if they indicate that they have trouble seeing even when wearing glasses or contact lenses or they report they are blind or are unable to see at all. The second set of questions is the following:
‘‘Have you ever worn a hearing aid?’’
‘‘Which statement best describes your hearing without a hearing aid: Good, a little trouble, a lot of trouble, deaf?’’
Respondents are counted as having a problem hearing if they answer that they have a lot of trouble hearing without a hearing aid or that they are deaf. People who either currently use hearing aids or used them in the past, but do not report difficulty hearing, are not defined as having a problem.
Cognitive difficulty—The measure of cognitive function used here, although limited in breadth, captures at least some of the adults who are experiencing deterioration in memory or who exhibit signs of confusion. The measure is less likely to capture those with limited capacity for reasoning or decision making. The source of this question is the NHIS Family Core Questionnaire.
{Are/Is} {person} LIMITED IN ANY WAY because of difficulty remembering or because {you/they} experience periods of confusion?’’
The answer categories are ‘‘yes,’’ ‘‘no,’’ ‘‘refused,’’ or ‘‘don’t know.’’ A positive answer identifies the respondent as having a cognitive difficulty.
Other Variable Descriptions
Body mass index (BMI)—BMI is a measure that adjusts bodyweight for height and is calculated as weight in kilograms divided by height in meters squared. Healthy weight for adults is defined as a BMI of 18.5 to less than 25, underweight is a BMI less than 18.5, overweight is greater than or equal to a BMI of 25, and obesity is greater than or equal to a BMI of 30. BMI cut points are defined in the following references:
U.S. Department of Agriculture, Agricultural Research Service. The report of the Dietary Guidelines Advisory Committee on dietary guidelines for Americans, 2000.
Appendix
Available from www.health.gov/dietaryguidelines/dgac/. 2000.
National Heart, Blood, and Lung Institute, Obesity Education Initiative Expert Panel. Clinical guidelines on the identification, evaluation, and treatment of overweight and obesity in adults—The evidence report. Rockville, MD: National Institutes of Health. Available from: www.nhlbi.nih.gov/guidelines/obesity/ob_gdlns.htm. 1998.
U.S. Department of Health and Human Services. Tracking Healthy People 2010. Objectives 19.1, 19.2, and 19.3. Washington, DC: U.S. Government Printing Office. Available from: www.healthypeople.gov/document/html/volume2/ 19nutrition.htm. 2000.
Family income—For purposes of NHIS, all people within a household related to each other by blood, marriage, or adoption constitute a family. Each member of a family is classified according to the total income of the family. Unrelated people are classified according to their individual income.
Starting in 1997, NHIS has collected family income data for the calendar year prior to the interview (e.g., 2004 family income data were based on calendar year 2003 information). Family income includes wages, salaries, rents from property, interest, dividends, profits and fees from their own businesses, pensions, and help from relatives. Family income data are used in the computation of poverty status. Multiple imputation of missing income data was performed for survey years 1997 and beyond, with five sets of imputed values created to allow for the assessment of variability caused by imputation. Family income was missing for 31% to 33% of respondents in 2000–2005. A detailed description of the multiple imputation procedure, as well as data files for 1997 and beyond, are available from www.cdc.gov/nchs/nhis.htm via the Imputed Income Files link under that year.
Health insurance—For point-in-time health insurance estimates for data years 1997 to the present, NHIS respondents were asked about their insurance at the time of the interview.
People were categorized as having Medicaid if they reported coverage by Medicaid, a state-sponsored health program, or the State Children’s Health Insurance Program. The uninsured are those who did not have coverage under private health insurance, Medicare, Medicaid, a state-sponsored health plan, other government-sponsored programs, or a military health plan. People with only Indian Health Service coverage were considered uninsured.
Page 77

Two additional questions were added to the health insurance section of NHIS beginning with the third quarter of 2004. One question was asked of adults aged 65 years and over who had not indicated that they had Medicare: ‘‘People covered by Medicare have a card which looks like this. {Are/Is} {person} covered by Medicare?’’ The other question was asked of those under the age of 65 years who had not indicated any type of coverage: ‘‘There is a program called Medicaid that pays for health care for persons in need. In this state it is also called {state name}. {Are/Is} {person} covered by Medicaid?’’
Estimates for this report are calculated using the responses to the two additional probe questions. For a complete discussion of the implications of the addition of these two probe questions on the estimates for insurance coverage, see the following reference: Cohen RA, Martinez ME. Impact of Medicare and Medicaid probe questions on health insurance estimates from the National Health Interview Survey, 2004. Health E-Stat. Available from: http://www.cdc.gov/nchs/ products/pubs/pubd/hestats/impact04/impact04.htm. 2005.
Health status, respondent-assessed—Health status was measured in NHIS by asking the family respondent about his or her health or the health of a family member: ‘‘Would you say {subject’s name} health is excellent, very good, good, fair, or poor?’’
Influenza vaccination—In NHIS, sample adults are asked ‘‘During the past 12 months, have you had a flu shot?’’ Starting in the fourth quarter of 2003, NHIS sample adults were also asked about intranasal influenza vaccination. However, because data presented here combines data years 2001–2005 and because of possible misreporting problems of intranasal influenza vaccination, only ‘‘flu shot’’ prevalence is reported in this chartbook.
Mammography—A mammogram is an x-ray image of the breast used to detect irregularities in breast tissue. In NHIS, questions concerning use of mammography are asked on an intermittent schedule, and question content differed in 2003 and 2005. In 2003, women were asked when they had their most recent mammogram (‘‘give month and year’’). Women who did not respond were given a follow-up question that asked when they had their most recent mammogram in days, weeks, months, or years; women who did not answer the follow-up question were asked whether they had a mammogram ‘‘a year ago or less,’’ ‘‘more than 1 year but not more than 2 years,’’ ‘‘more than 2 years but not more than 3 years,’’ ‘‘more than 3 years but not more than 5 years,’’ or ‘‘over 5 years ago.’’ In 2005, women were asked the same series of mammography questions as those in 2003, but the skip pattern was modified so that more women were asked
Page 78
the follow-up questions. Because additional information was available for women who replied that their last mammogram was 2 years ago, these women were not uniformly coded as having had a mammogram within the past 2 years. Thus, estimates for 2005 are more precise compared with estimates for 2003 and are slightly lower than they would have been without this additional information.
Pap test—A Pap test (also known as a Papanicolaou smear or Pap smear) is a microscopic examination of cells scraped from the cervix that is used to detect cancerous or precancerous conditions of the cervix or other medical conditions. In NHIS, questions concerning the Pap test use are asked on an intermittent schedule, and the question content differed slightly in 2003 and 2005. In 2003, women were asked when they had their most recent Pap smear (‘‘give month and year’’). Women who did not respond were given a follow-up question that asked when they had their most recent Pap smear in days, weeks, months, or years; women who did not answer the follow-up question were asked whether they had a Pap smear ‘‘a year ago or less,’’ ‘‘more than 1 year but not more than 2 years,’’ ‘‘more than 2 years but not more than 3 years,’’ ‘‘more than 3 years but not more than 5 years,’’ or ‘‘over 5 years ago.’’ In 2003, less than 1% of women in the sample answered 3 years ago, and they were coded as having one within the past 3 years. In 2005, women were asked the same series of questions about Pap test use as in the 2003 survey, but the skip pattern was modified so that more women were asked the follow-up questions. Because additional information was available for women who replied their last Pap smear was 3 years ago, these women were not uniformly coded as having had a Pap smear within the past 3 years. Thus, estimates for 2005 are more precise compared with estimates for 2003 and are slightly lower than they would have been without this additional information.
Physical activity, leisure time—All NHIS questions related to leisure-time physical activity are phrased in terms of current behavior and lack a specific reference period. Starting with 1998 data, leisure-time physical activity is assessed in NHIS by asking adults a series of questions about how often they do vigorous or light or moderate physical activity of at least 10 minutes duration and for about how long these sessions generally last. Vigorous physical activity is described as causing heavy sweating or a large increase in breathing or heart rate and light or moderate as causing light sweating or a slight to moderate increase in breathing or heart rate. Adults classified as inactive did not report any sessions of light or moderate or vigorous leisure-time physical activity of at least 10 minutes duration or reported they were unable to perform leisure-time physical activity. Adults classified with
Appendix

some leisure-time activity reported at least one session of light or moderate or vigorous activity of at least 10 minutes duration but did not meet the requirement for regular leisure-time activity. Adults classified with regular leisure-time activity reported at least three sessions per week of vigorous leisure-time physical activity lasting at least 20 minutes in duration or at least five sessions per week of light or moderate physical activity lasting at least 30 minutes in duration.
Poverty—Poverty statistics are based on definitions originally developed by the Social Security Administration. These definitions include a set of money income thresholds that vary by family size and composition (number of children in the family and, for families with two or fewer adults, the age of the adults in the family). Families or individuals with income below their appropriate thresholds are classified as below poverty. These thresholds are updated annually by the U.S. Census Bureau to reflect changes in the Consumer Price Index for all urban consumers. For example, the average poverty threshold for a family of four was $19,307 in 2004. For more information, see the following reference: U.S. Census Bureau. Income, poverty and health insurance coverage in the United States: 2004. Series P-60 No 229. Washington, DC: U.S. Government Printing Office. Available from: www.census.gov/hhes/www/poverty.html.
Race and ethnicity—Race is defined as the respondent-reported race of those who reported only one race, or, if they reported more than one race, the race that the respondent identified as best representing their race. Ethnicity is defined as respondent-reported Hispanic or non-Hispanic origin. Responses were categorized as follows:
Non-Hispanic white: white race and not of Hispanic origin
Non-Hispanic black: black race and not of Hispanic origin
Non-Hispanic Asian: Asian race and not of Hispanic origin
Hispanic: Hispanic origin and any race (other than American Indian or Alaska Native)
Other: American Indian or Alaska Native, Native Hawaiian or Other Pacific Islander, or other race
Respondents who indicated a verbatim response of nonspecific multiracial heritage (e.g., multiracial or biracial) were coded as multiple race. Both race and ethnicity are imputed for people with missing responses. Starting with 2003 data, records for people for whom other race was the only race response were treated as having missing data on race and were added to the pool of records for which selected race and ethnicity variables were imputed. Not enough people with disability in the sample reported their race as American
Appendix
Indian or Alaska Native and Native Hawaiian or Other Pacific Islander to provide reliable estimates for those groups.
Glossary
Assistive devices—Equipment used to support a person in accomplishing basic actions or to adapt a person’s environment to make it more accessible. This equipment or modification is meant to improve the ability to accomplish basic actions and tasks or complex activities. This equipment can be specially designed to fulfill that purpose, or it can be ordinary household or office items that are used in such a way as to facilitate or improve a person’s ability to accomplish a specific task or set of tasks.
Basic actions—Volitional physical and mental operations at the level of the whole person. Examples include walking, climbing steps, reading, and communicating. Basic actions are distinct from body functions, which are defined in the International Classification of Functioning and Health (ICF) as ‘‘physiological functions of body systems,’’ rather than functions of the whole person. Level of basic action functioning can be measured with or without the use of assistive devices. When combined, multiple basic actions are involved in performance of tasks (such as bathing) or complex activities (such as working, going to school, and keeping house).
Complex activities—Execution of specific tasks and organized activities that make up the elements of a social role, ranging from personal care activities to work, attending school, and keeping house. Level of basic action functioning in combination with the effects of the environment can affect the level of functioning in complex activities.
Disability—An umbrella term that reflects the interaction of a person with his or her environment that results in some form of limitations in actions or participation.
Functioning—The execution of an action, task, or activity by a person. Standards for levels of functioning (which usually result in the identification of disability) are generally set by the norms of a particular culture, so that definitions of what is a sufficient level of functioning at any time or place are socially constructed.
Impairment—Any loss or abnormality of psychological, physiological, or anatomical structure or function. It represents the exterior manifestation of an abnormality in the body and as such reflects ongoing or residual disturbances at the organ level. An impairment may be either temporary or permanent.
Page 79

Limitations—Bounds, restraints, or restrictions that a person experiences when attempting to perform basic actions, tasks, or complex activities in everyday life situations.
Task—The execution of a group of volitional actions by a person in order to accomplish a specific purpose. It is an indicator of a series of related basic actions, which, when combined, accomplish a simple objective. Examples include bathing, dressing, and feeding, which are central elements of self-care, or driving a car and planning a meeting, which can be central elements of employment. In ICF, tasks are included in the domain of activity defined as ‘‘the execution of a task or action by an individual, representing the individual perspective of functioning.’’ ICF does not differentiate between actions and tasks, but for measurement purposes, that differentiation is made here.
Page 80 Appendix

U.S. DEPARTMENT OF HEALTH AND HUMAN SERVICES
Centers for Disease Control and Prevention National Center for Health Statistics 3311 Toledo Road Hyattsville, MD 20782
OFFICIAL BUSINESS PENALTY FOR PRIVATE USE $300
CS118023 T31343 (06/2008) DHHS Pub No. 2008–1035