Directors & Officers Liability Survey 1999 Results and Historical Trends
29
Mark W. Larsen Directors & Officers Liability Survey 1999 Results and Historical Trends Casualty Actuaries in Reinsurance June 15, 2000
-
Upload
constance-kim -
Category
Documents
-
view
23 -
download
2
description
Directors & Officers Liability Survey 1999 Results and Historical Trends. Casualty Actuaries in Reinsurance June 15, 2000. Directors & Officers Liability Survey Background. Formerly conducted by Watson Wyatt. Conducted by Tillinghast as of 1998 Survey. - PowerPoint PPT Presentation
Transcript of Directors & Officers Liability Survey 1999 Results and Historical Trends
Mark W. Larsen
Directors & Officers Liability Survey1999 Results and Historical Trends
Casualty Actuaries in ReinsuranceJune 15, 2000
2
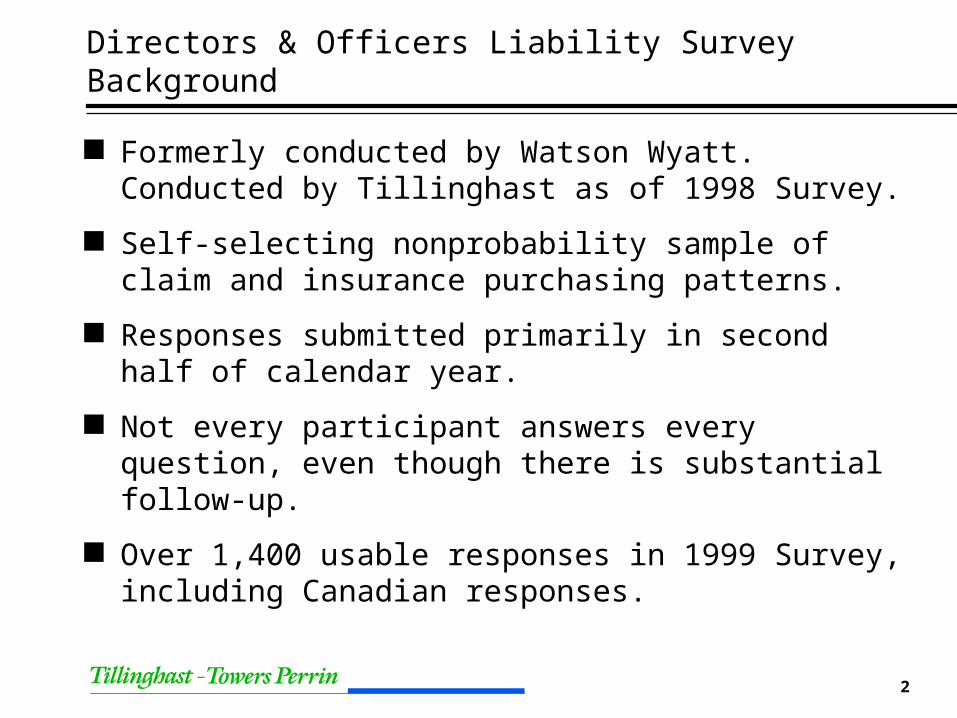
Directors & Officers Liability SurveyBackground
Formerly conducted by Watson Wyatt.Conducted by Tillinghast as of 1998 Survey.
Self-selecting nonprobability sample of claim and insurance purchasing patterns.
Responses submitted primarily in second half of calendar year.
Not every participant answers every question, even though there is substantial follow-up.
Over 1,400 usable responses in 1999 Survey, including Canadian responses.
3
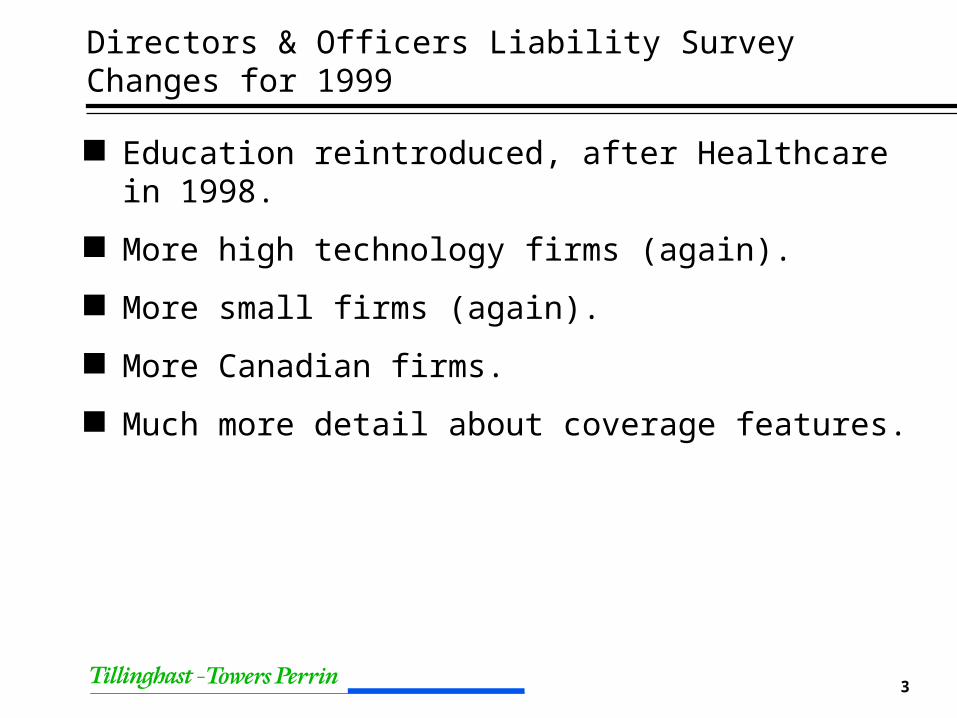
Directors & Officers Liability SurveyChanges for 1999
Education reintroduced, after Healthcare in 1998.
More high technology firms (again).
More small firms (again).
More Canadian firms.
Much more detail about coverage features.
4
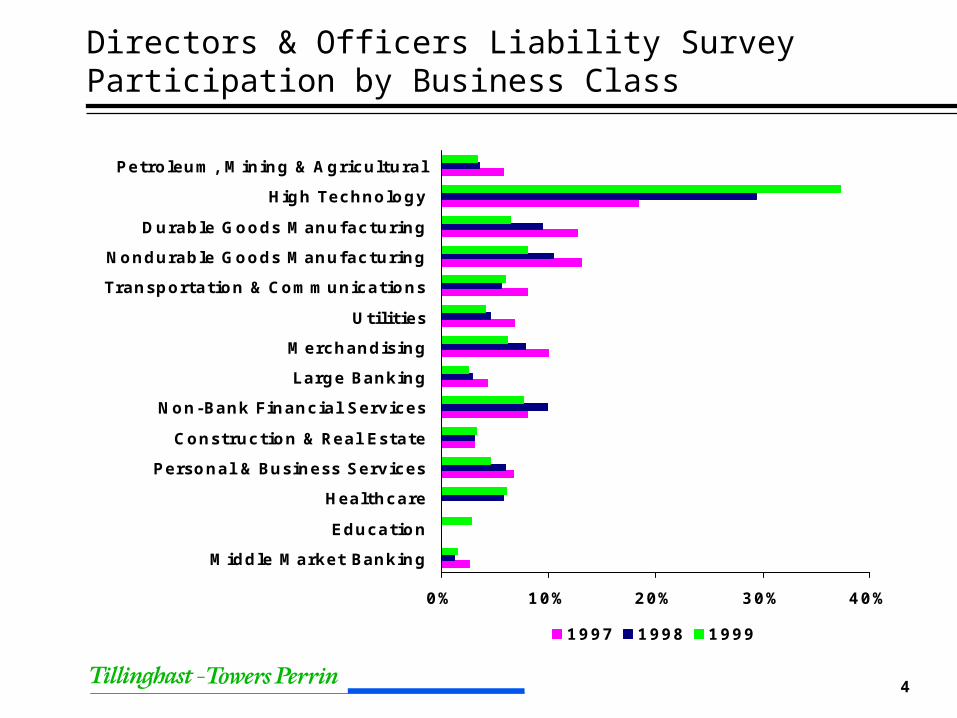
Directors & Officers Liability SurveyParticipation by Business Class
0% 10% 20% 30% 40%
Middle Market Banking
Education
Healthcare
Personal & Business Services
Construction & Real Estate
Non-Bank Financial Services
Large Banking
Merchandising
Utilities
Transportation & Communications
Nondurable Goods Manufacturing
Durable Goods Manufacturing
High Technology
Petroleum, Mining & Agricultural
1997 1998 1999
5
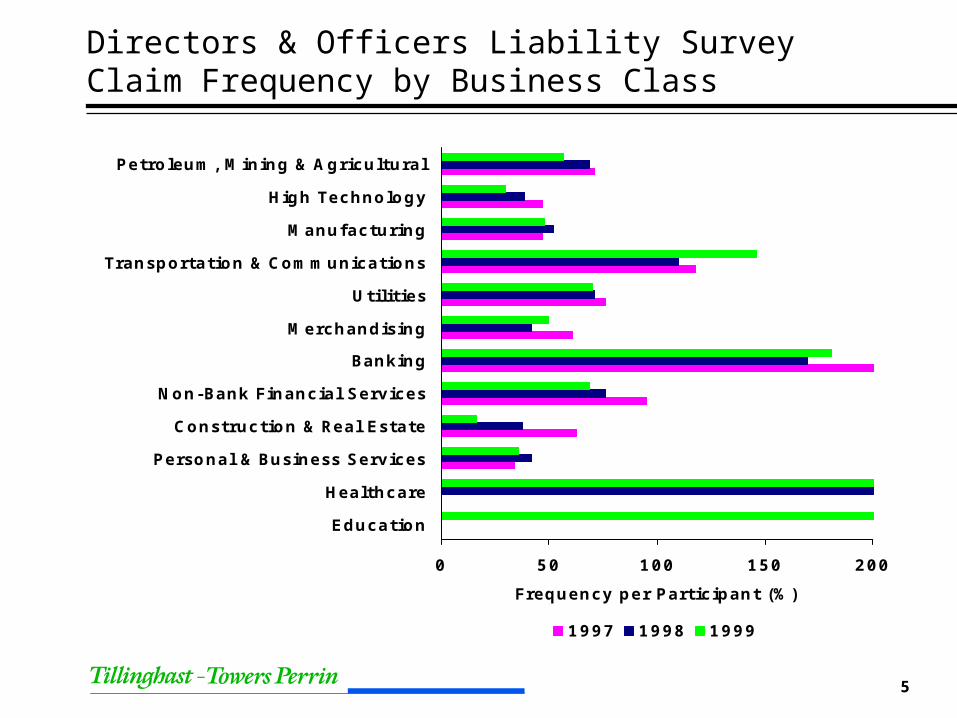
Directors & Officers Liability SurveyClaim Frequency by Business Class
0 50 100 150 200
Education
Healthcare
Personal & Business Services
Construction & Real Estate
Non-Bank Financial Services
Banking
Merchandising
Utilities
Transportation & Communications
Manufacturing
High Technology
Petroleum, Mining & Agricultural
Frequency per Participant (%)
1997 1998 1999
6
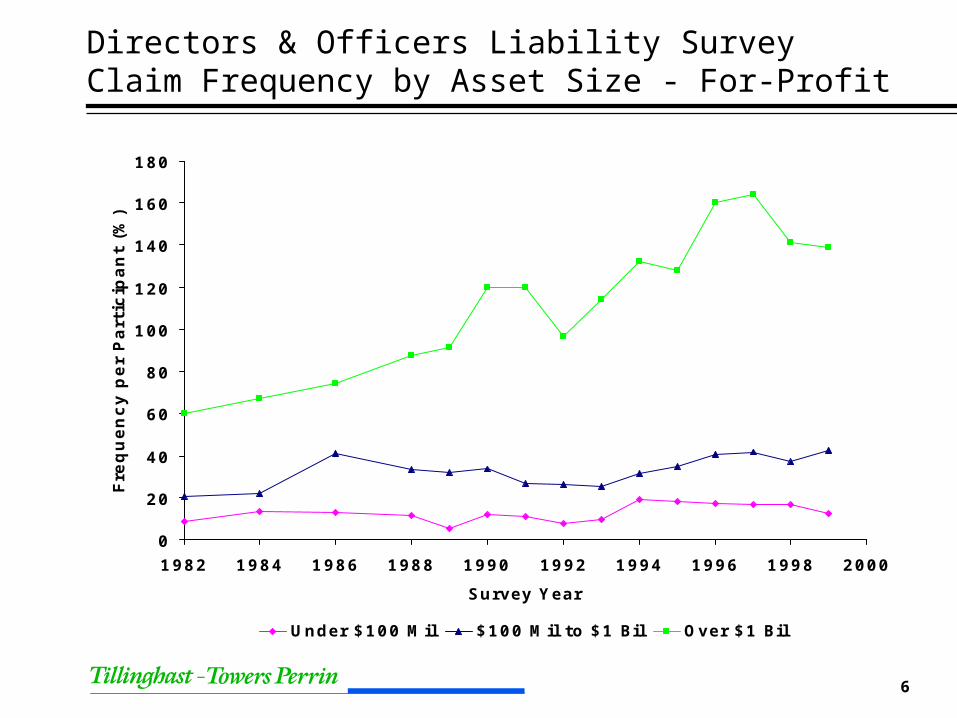
Directors & Officers Liability SurveyClaim Frequency by Asset Size - For-Profit
0
20
40
60
80
100
120
140
160
180
1982 1984 1986 1988 1990 1992 1994 1996 1998 2000
Survey Year
Fre
qu
en
cy p
er
Part
icip
an
t (%
)
Under $100 Mil $100 Mil to $1 Bil Over $1 Bil

7
Directors & Officers Liability SurveyClaim Frequency by Ownership
0
20
40
60
80
100
120
1984 1986 1988 1990 1992 1994 1996 1998 2000
Survey Year
Fre
qu
en
cy p
er
Part
icip
an
t (%
)
Private Public
8
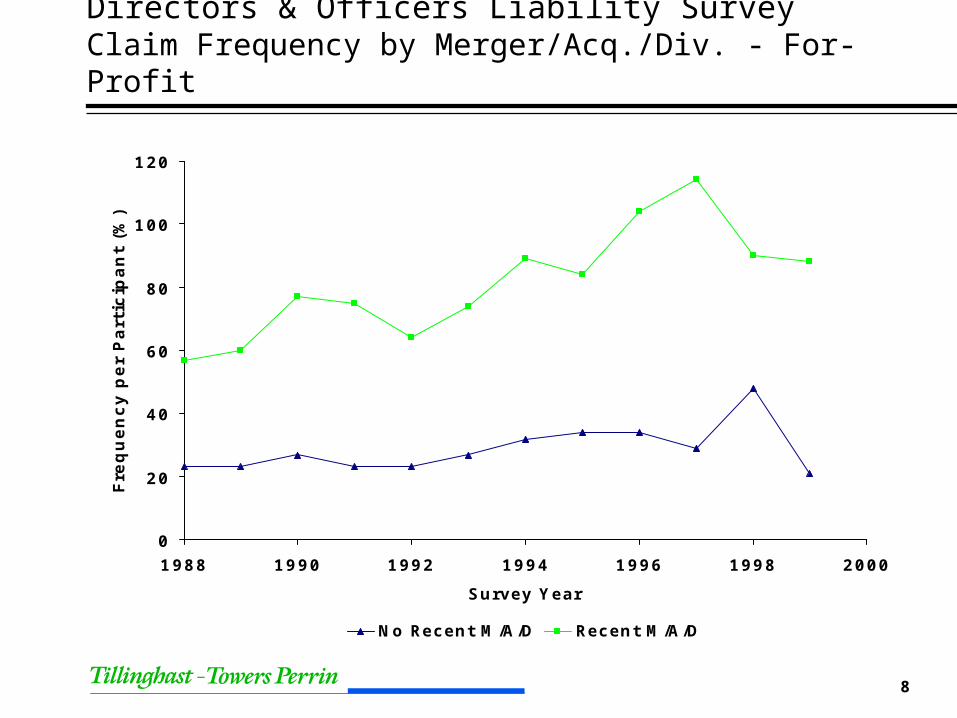
Directors & Officers Liability SurveyClaim Frequency by Merger/Acq./Div. - For-Profit
0
20
40
60
80
100
120
1988 1990 1992 1994 1996 1998 2000
Survey Year
Fre
qu
en
cy p
er
Part
icip
an
t (%
)
No Recent M/A/D Recent M/A/D
9
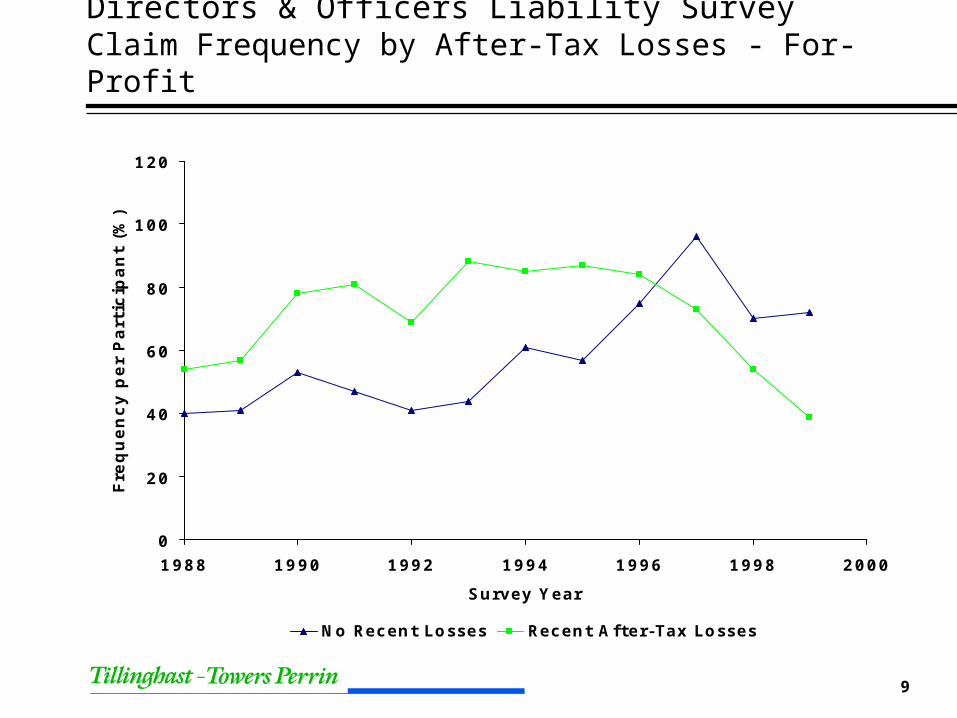
Directors & Officers Liability SurveyClaim Frequency by After-Tax Losses - For-Profit
0
20
40
60
80
100
120
1988 1990 1992 1994 1996 1998 2000
Survey Year
Fre
qu
en
cy p
er
Part
icip
an
t (%
)
No Recent Losses Recent After-Tax Losses
10
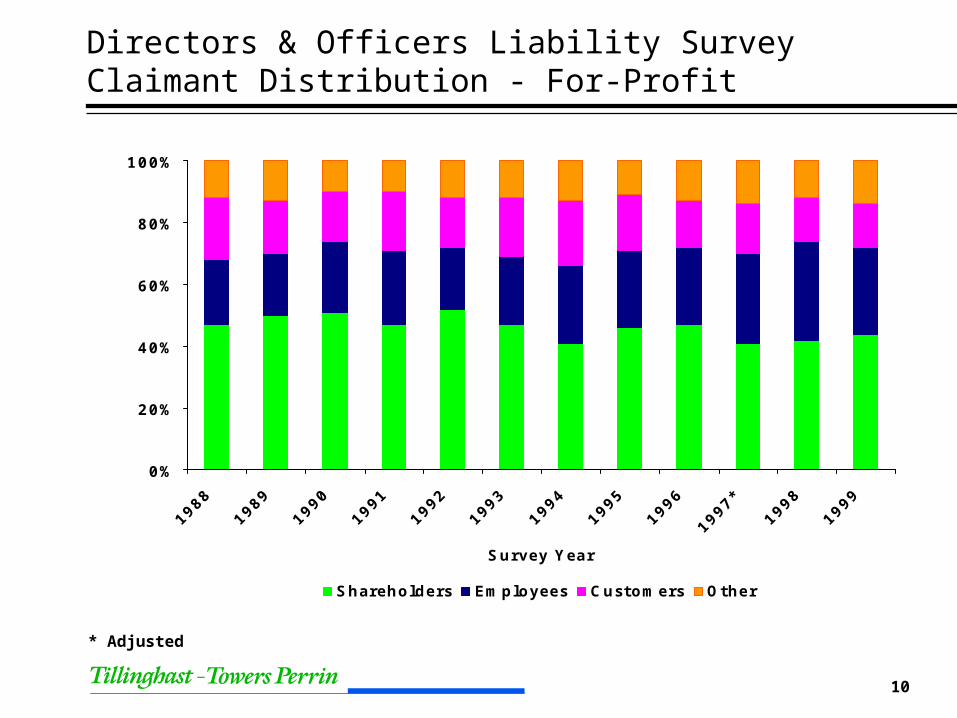
Directors & Officers Liability SurveyClaimant Distribution - For-Profit
0%
20%
40%
60%
80%
100%
1988
1989
1990
1991
1992
1993
1994
1995
1996
1997
*
1998
1999
Survey Year
Shareholders Employees Customers Other
* Adjusted
11
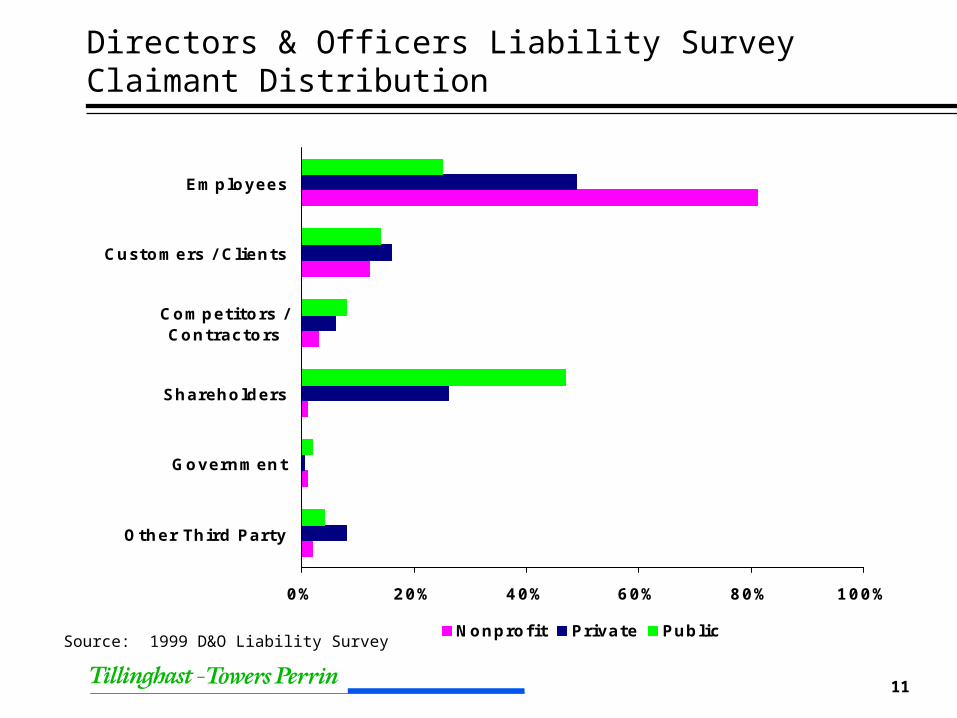
Directors & Officers Liability SurveyClaimant Distribution
0% 20% 40% 60% 80% 100%
Other Third Party
Government
Shareholders
Competitors /Contractors
Customers / Clients
Employees
Nonprofit Private PublicSource: 1999 D&O Liability Survey
12
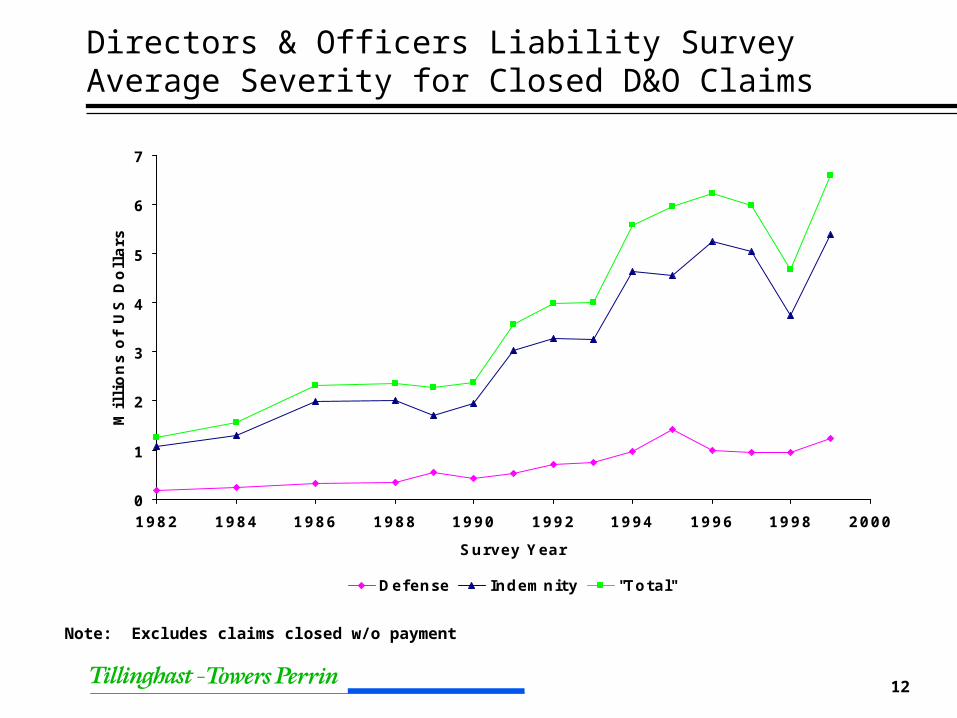
Directors & Officers Liability Survey Average Severity for Closed D&O Claims
0
1
2
3
4
5
6
7
1982 1984 1986 1988 1990 1992 1994 1996 1998 2000
Survey Year
Mil
lio
ns o
f U
S D
oll
ars
Defense Indemnity "Total"
Note: Excludes claims closed w/o payment
13
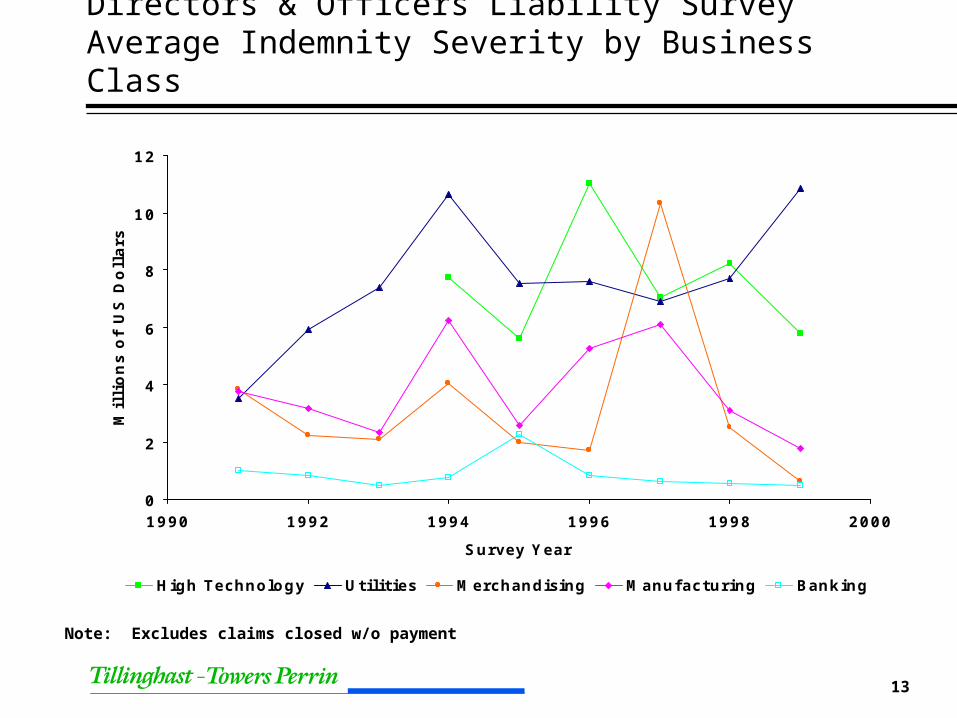
Directors & Officers Liability Survey Average Indemnity Severity by Business Class
0
2
4
6
8
10
12
1990 1992 1994 1996 1998 2000
Survey Year
Mil
lio
ns o
f U
S D
oll
ars
High Technology Utilities Merchandising Manufacturing Banking
Note: Excludes claims closed w/o payment
14
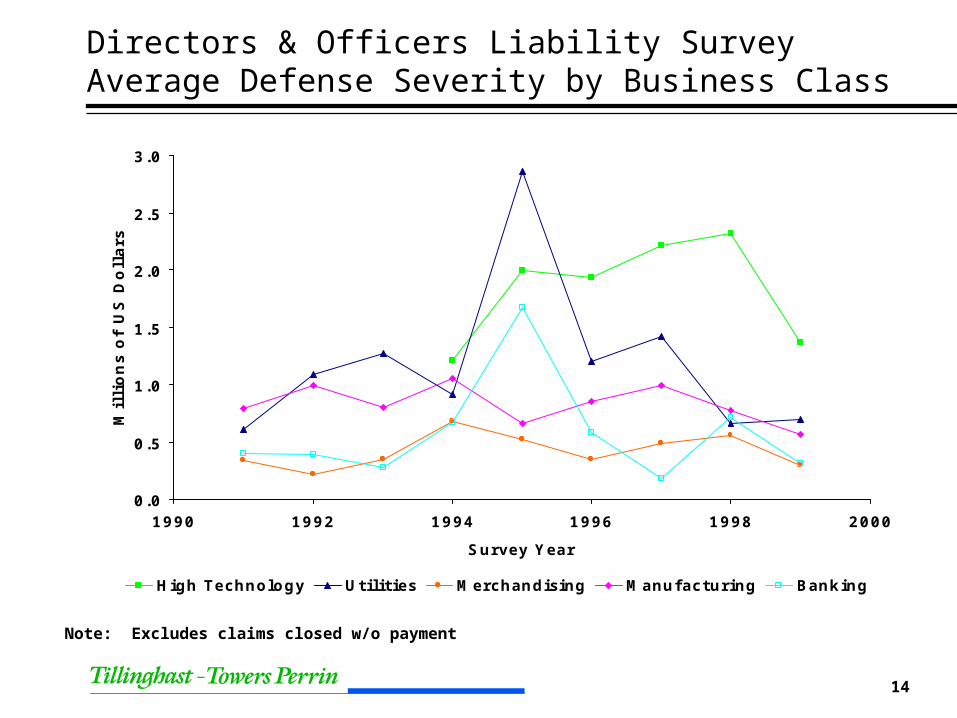
Directors & Officers Liability Survey Average Defense Severity by Business Class
0.0
0.5
1.0
1.5
2.0
2.5
3.0
1990 1992 1994 1996 1998 2000
Survey Year
Mil
lio
ns o
f U
S D
oll
ars
High Technology Utilities Merchandising Manufacturing Banking
Note: Excludes claims closed w/o payment
15
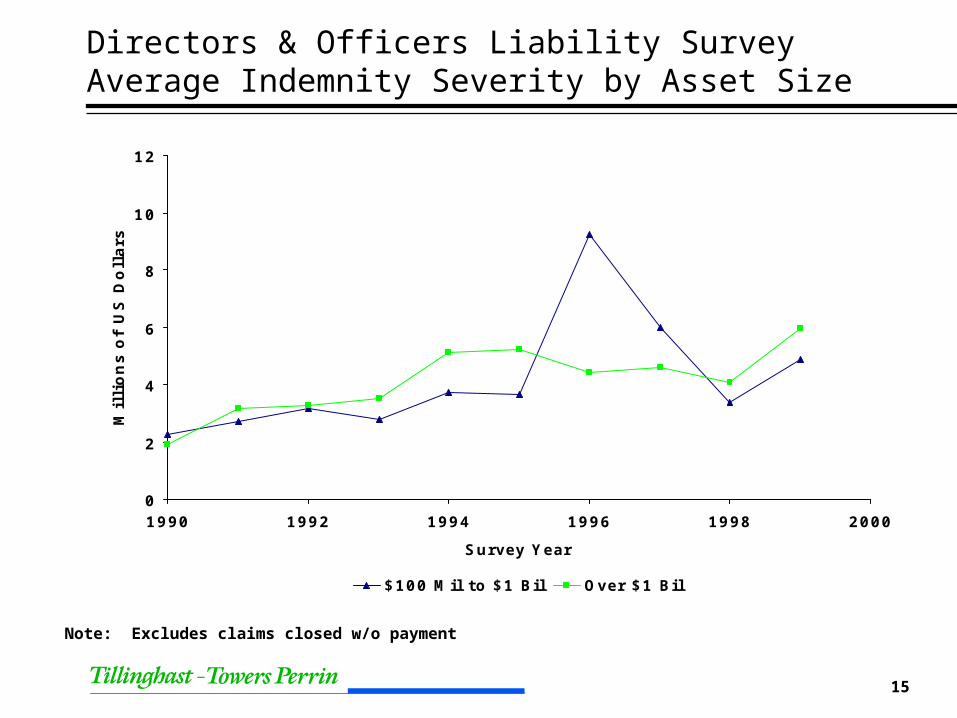
Directors & Officers Liability Survey Average Indemnity Severity by Asset Size
0
2
4
6
8
10
12
1990 1992 1994 1996 1998 2000
Survey Year
Mil
lio
ns o
f U
S D
oll
ars
$100 Mil to $1 Bil Over $1 Bil
Note: Excludes claims closed w/o payment
16
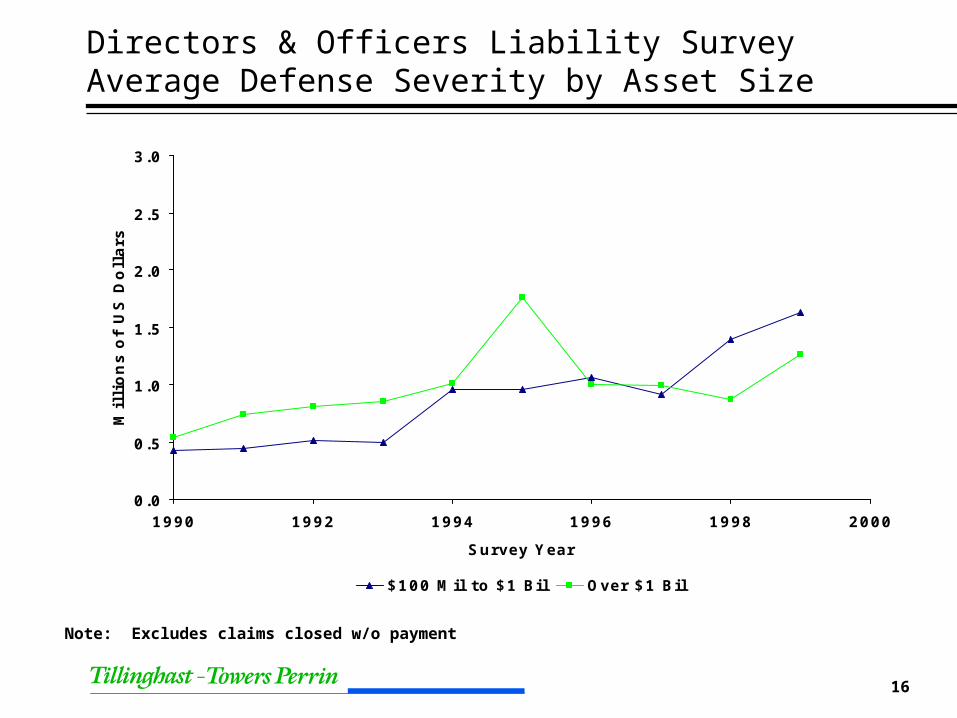
Directors & Officers Liability Survey Average Defense Severity by Asset Size
0.0
0.5
1.0
1.5
2.0
2.5
3.0
1990 1992 1994 1996 1998 2000
Survey Year
Mil
lio
ns o
f U
S D
oll
ars
$100 Mil to $1 Bil Over $1 Bil
Note: Excludes claims closed w/o payment
17
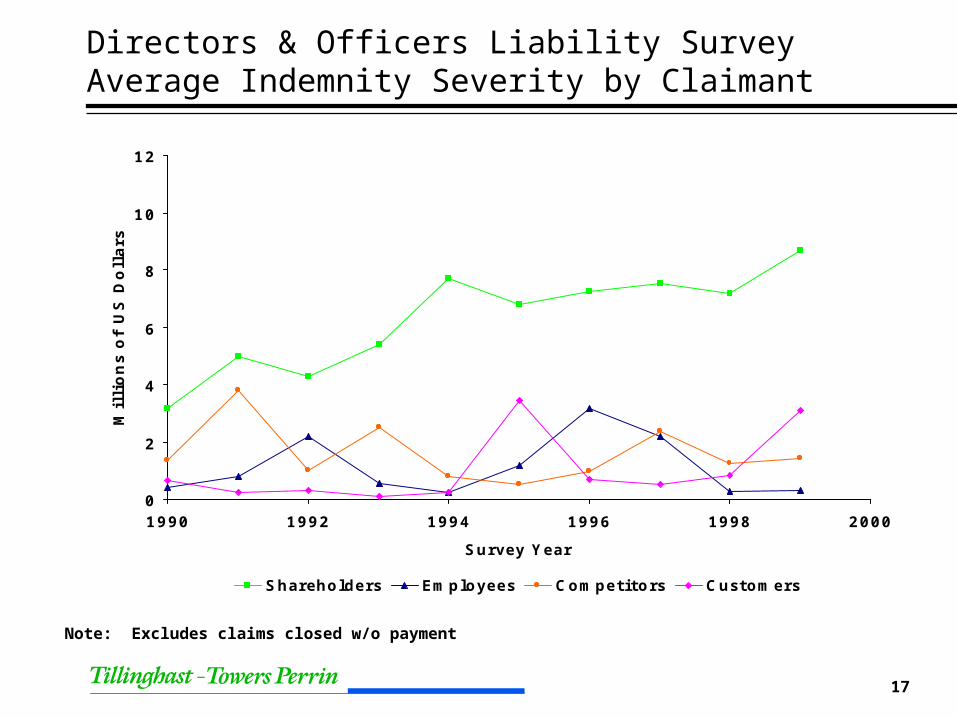
Directors & Officers Liability Survey Average Indemnity Severity by Claimant
0
2
4
6
8
10
12
1990 1992 1994 1996 1998 2000
Survey Year
Mil
lio
ns o
f U
S D
oll
ars
Shareholders Employees Competitors Customers
Note: Excludes claims closed w/o payment
18
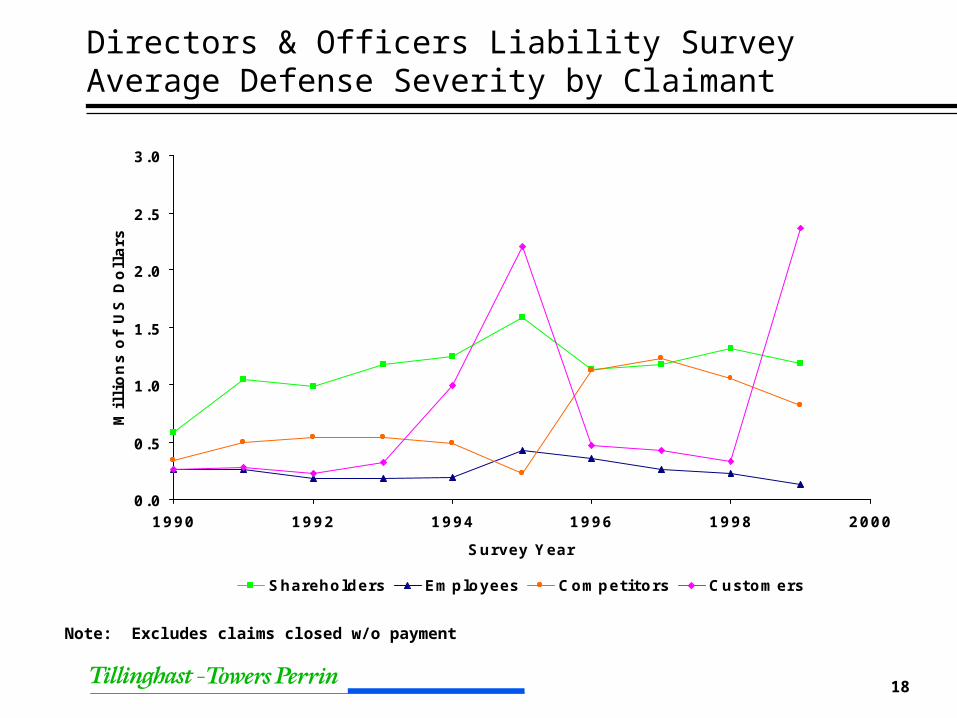
Directors & Officers Liability Survey Average Defense Severity by Claimant
0.0
0.5
1.0
1.5
2.0
2.5
3.0
1990 1992 1994 1996 1998 2000
Survey Year
Mil
lio
ns o
f U
S D
oll
ars
Shareholders Employees Competitors Customers
Note: Excludes claims closed w/o payment
19
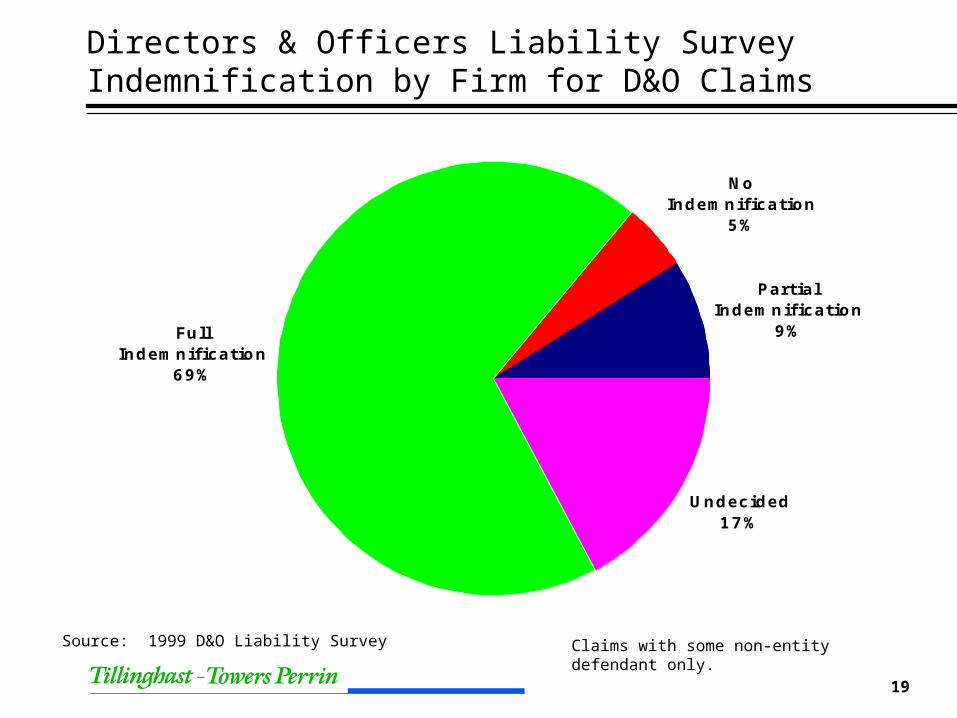
Directors & Officers Liability Survey Indemnification by Firm for D&O Claims
No Indemnification
5%
Partial Indemnification
9%
Undecided17%
Full Indemnification
69%
Source: 1999 D&O Liability Survey Claims with some non-entity defendant only.
20
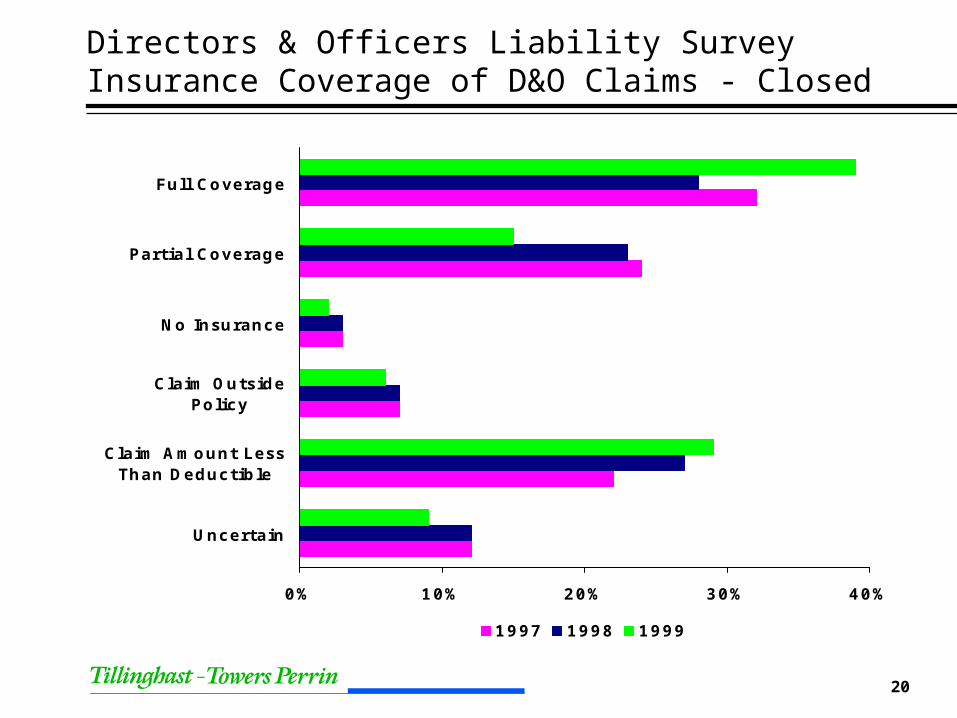
Directors & Officers Liability SurveyInsurance Coverage of D&O Claims - Closed
0% 10% 20% 30% 40%
Uncertain
Claim Amount LessThan Deductible
Claim OutsidePolicy
No Insurance
Partial Coverage
Full Coverage
1997 1998 1999
21
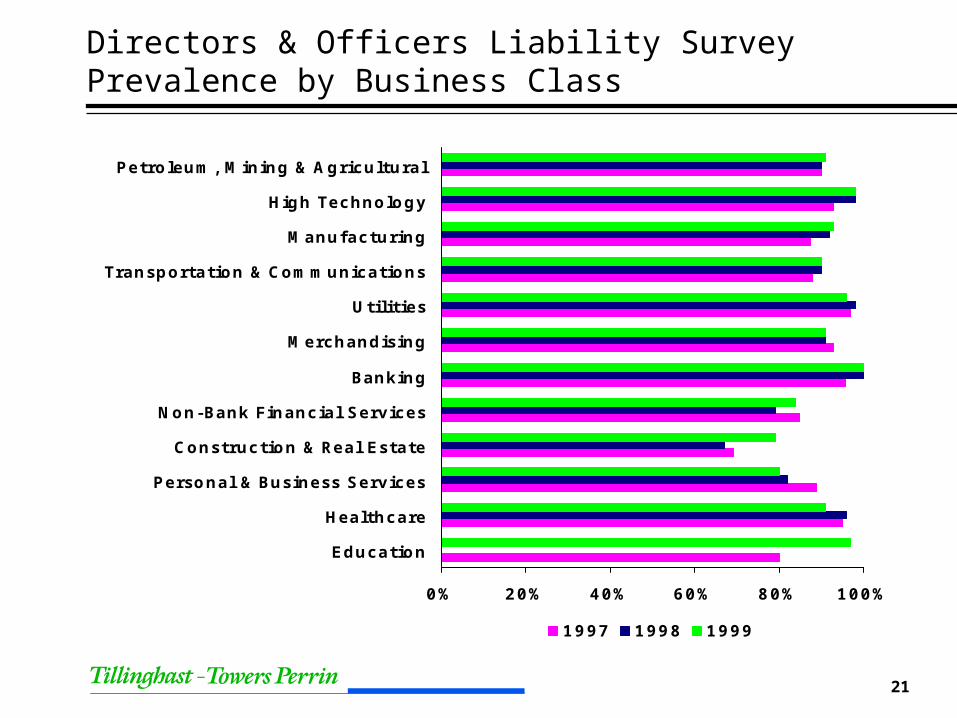
Directors & Officers Liability SurveyPrevalence by Business Class
0% 20% 40% 60% 80% 100%
Education
Healthcare
Personal & Business Services
Construction & Real Estate
Non-Bank Financial Services
Banking
Merchandising
Utilities
Transportation & Communications
Manufacturing
High Technology
Petroleum, Mining & Agricultural
1997 1998 1999
22
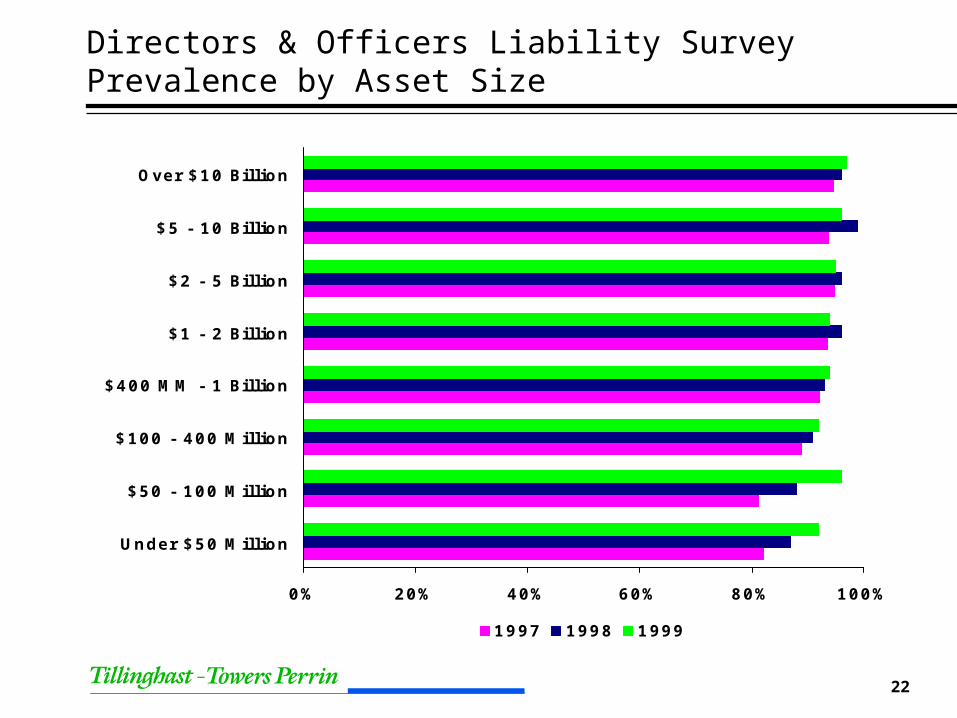
Directors & Officers Liability SurveyPrevalence by Asset Size
0% 20% 40% 60% 80% 100%
Under $50 Million
$50 - 100 Million
$100 - 400 Million
$400 MM - 1 Billion
$1 - 2 Billion
$2 - 5 Billion
$5 - 10 Billion
Over $10 Billion
1997 1998 1999
23
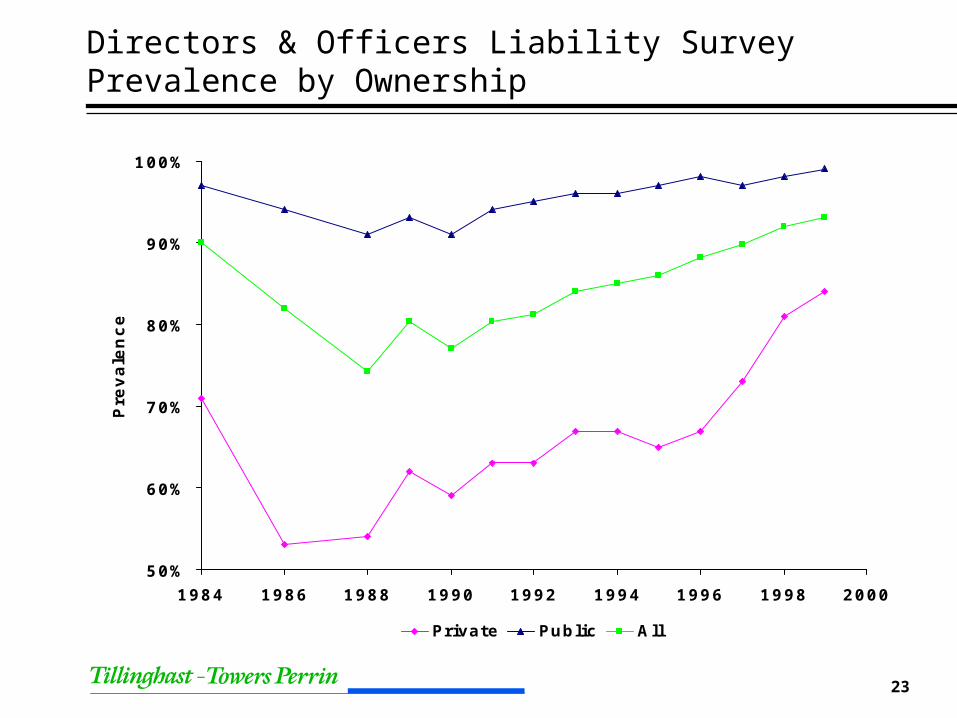
Directors & Officers Liability SurveyPrevalence by Ownership
50%
60%
70%
80%
90%
100%
1984 1986 1988 1990 1992 1994 1996 1998 2000
Pre
vale
nce
Private Public All
24
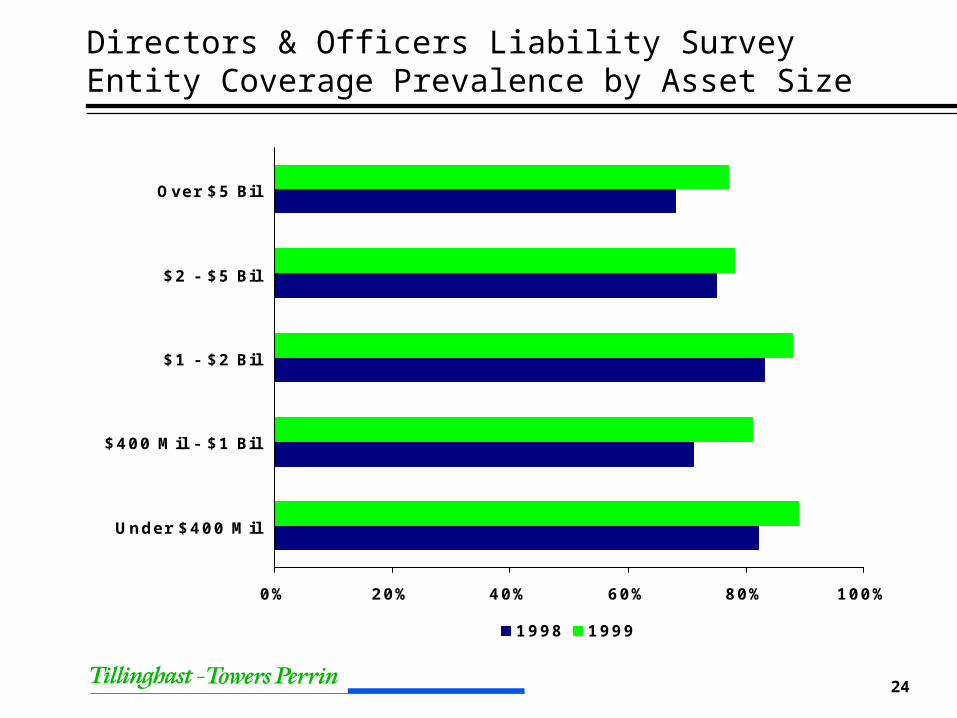
Directors & Officers Liability SurveyEntity Coverage Prevalence by Asset Size
0% 20% 40% 60% 80% 100%
Under $400 Mil
$400 Mil - $1 Bil
$1 - $2 Bil
$2 - $5 Bil
Over $5 Bil
1998 1999
25
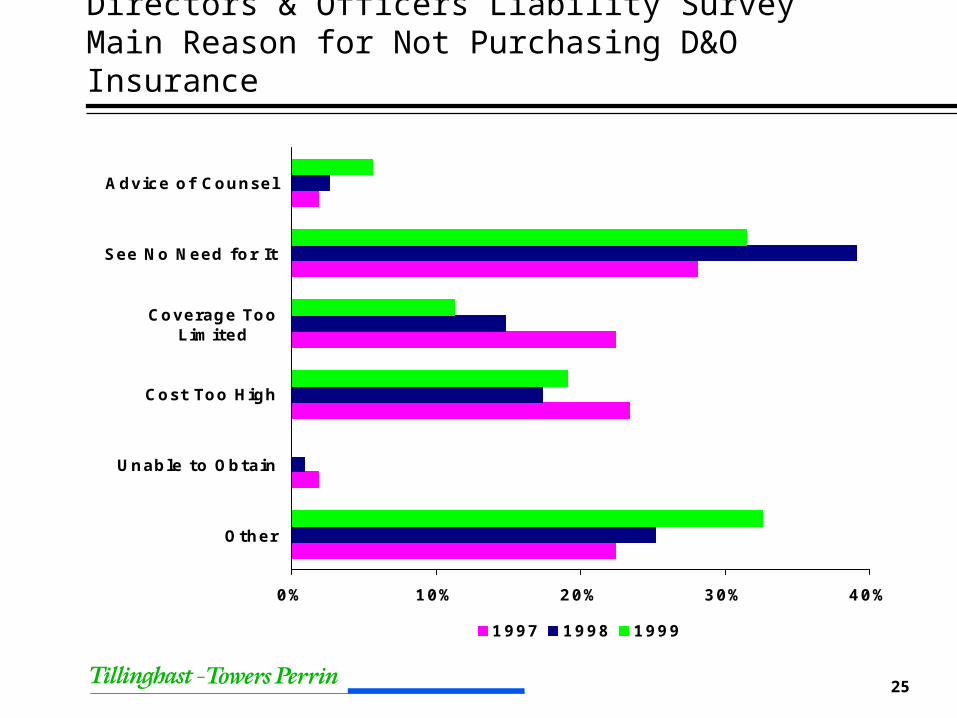
Directors & Officers Liability SurveyMain Reason for Not Purchasing D&O Insurance
0% 10% 20% 30% 40%
Other
Unable to Obtain
Cost Too High
Coverage TooLimited
See No Need for It
Advice of Counsel
1997 1998 1999
26
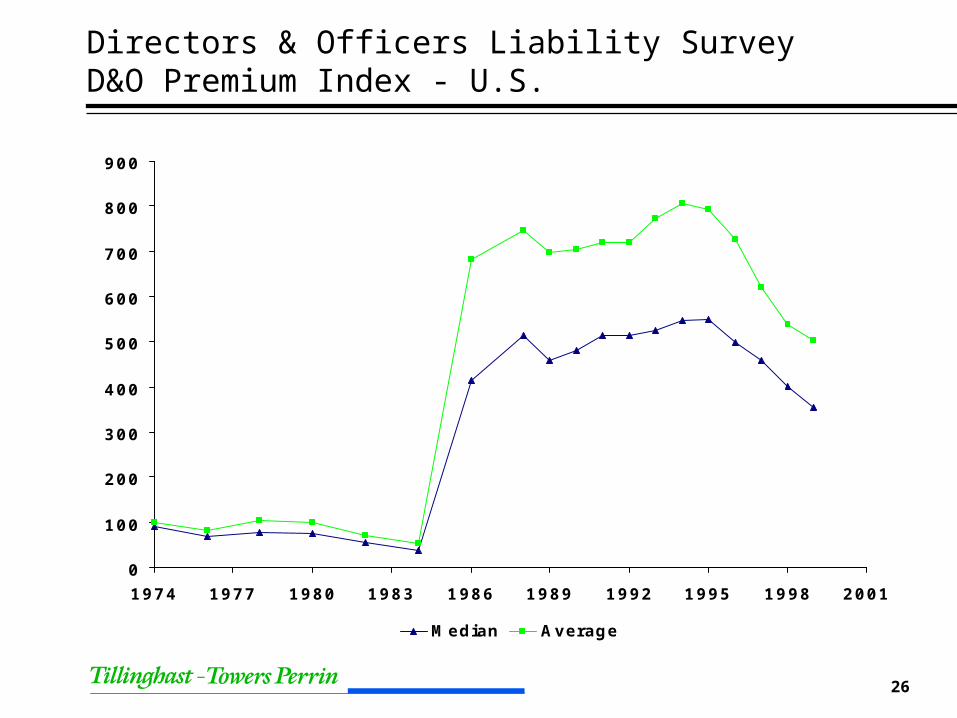
Directors & Officers Liability SurveyD&O Premium Index - U.S.
0
100
200
300
400
500
600
700
800
900
1974 1977 1980 1983 1986 1989 1992 1995 1998 2001
Median Average
27
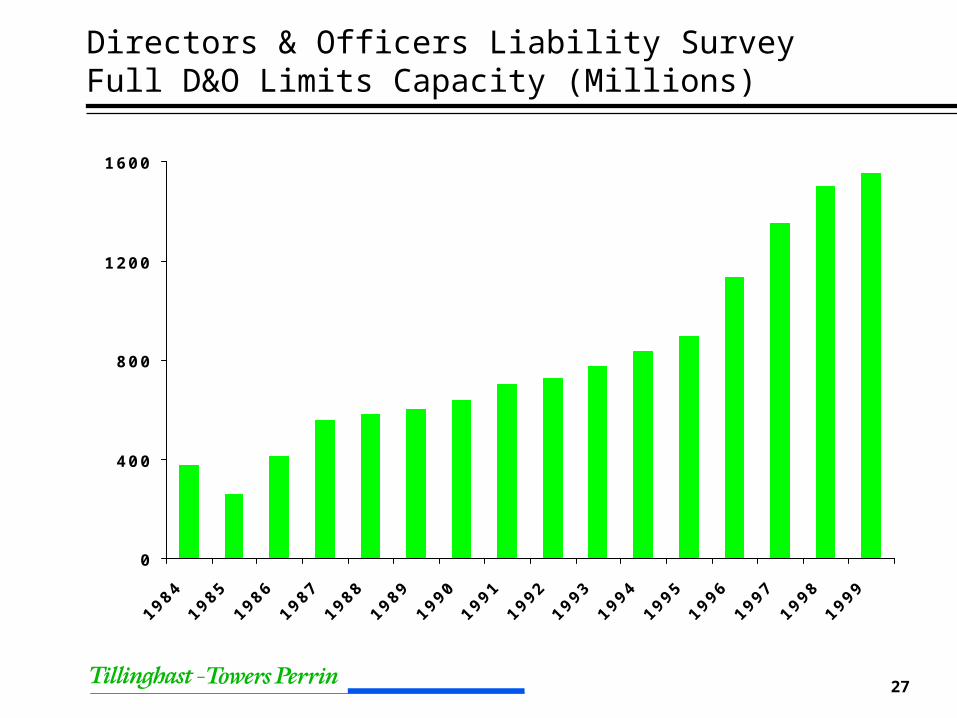
Directors & Officers Liability SurveyFull D&O Limits Capacity (Millions)
0
400
800
1200
1600
1984
1985
1986
1987
1988
1989
1990
1991
1992
1993
1994
1995
1996
1997
1998
1999

28
Directors & Officers Liability SurveyAverage Total Limit by Asset Size
0
20
40
60
80
1984 1986 1988 1990 1992 1994 1996 1998 2000
Lim
it (
$m
illi
on
)
Under 100 Mil $100 - $400 Mil $400 Mil - $1 Bil$1 - $2 Bil Over $2 Bil
29
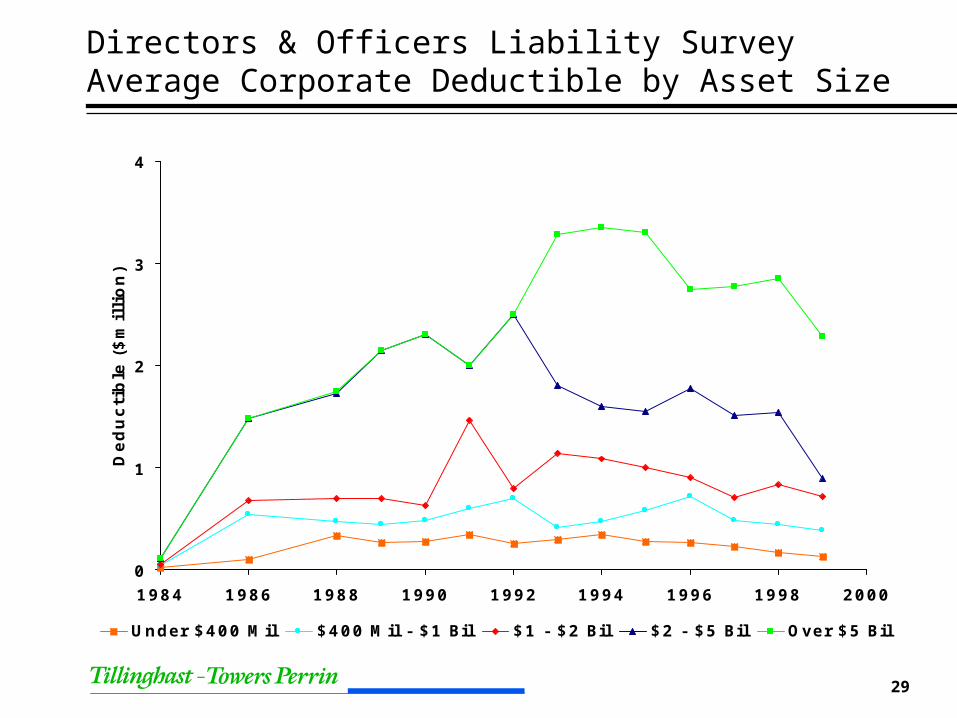
Directors & Officers Liability SurveyAverage Corporate Deductible by Asset Size
0
1
2
3
4
1984 1986 1988 1990 1992 1994 1996 1998 2000
Ded
ucti
ble
($
mil
lio
n)
Under $400 Mil $400 Mil - $1 Bil $1 - $2 Bil $2 - $5 Bil Over $5 Bil