Philippe QUEVAUVILLER European Commission DG Research Directorate I ‘Environment’

DIRECTORATE OF WATER SUPPLYDIRECTORATE GENERAL CIPTA KARYAMINISTRY OF PUBLIC WORKS
= REPUBLIC OF INDONESIA
MDP PRODUCTION TEAM
DIRECTORATE GENERALINTERNATIONAL COOPERATIONMINISTRY OF FOREIGN AFFAIRSKINGDOM OF THE NETHERLANDS
TRAINING MATERIALS FOR WATER ENTERPRISES
VOLUME 5A
I GUIDE FOR USERS OF TRAINING MATERIALS
TRAINING MODULES
GENERAL
ORGANISATIONAL
BasIc knowledge / skills
Processes/procedures
Equipment/materials
• TECHNICAL
Basic knowledge/skills
• Processes/procedures
withdrawal
treatment
distribution
consumption
Equipment/materials
TAPE / SLIDE PROGRAMMES
NAL REFERENCE CENTRE~JNITYWATER SUPPLY AND
~ ~9RC)
- _
2 0 4.1
85 TR
L I
FO~
MDP PRODUCTION TEAM
DHV - IWACO - TGI204. 1—361O—5~

4


IT
/ -
4’
a,
V

D IRECTORATEDIRECTORATEDEPARThIENTGOVERNMENT
OF WATER SUPPLYGENERAL CIPTA KARYA
OF PUBLIC WORKSOF INDONESIA
DIRECTORATE GENERALFOR INTERNATIONAL COOPERATIONMINISTRY OF FOREIGN AFFAIRSGOVERNMENT OF THE NETHERLANDS
1~
MDF’ F~flODUCTION TEAM
T~AININQ MATEF~IALS FOF~ WATET~ ENTERPE~ISES
LIBRARY INT~TION~_L REFERENCE II CEP~TF~FOR COMMUI\I IY WA ER SUPPLy I
AND SANiTATION (tRCjP.O. Box 9319~,2~o9AD The Hague /Tel. (070) 8149fl ext. 14~/142
IL~4sl~~~jj
VOLUME 5ATRAINING MODULE STECHNICAL ~
DHV CONSULTING ENGINEERSIWACO LV.T.G. INTERNATIONAL
JAKARTAAPRIL 1985


PREFACE
following volumes:
training materials
GENERAL+ ORGANIZATIONAL(basic knowledge/skills)
GENERAL+ ORGANIZATIONAL(basic knowledge/skills)
ORGANIZATIONAL (processes/procedures;equipment/materials)
TECHNICAL (basic knowledge/skills)
TECHNICAL (processes/procedures)
TECHNICAL (processes/procedures)
TECHNICAL (Withdrawal + Treatment)
TECHNICAL (Withdrawal + Treatment)
TECHNICAL (Distribution + Consumption)
TECHNICAL (equipment/materials)
This volume is part of the Final Report of the MDP Production Team whichproduced Training Materials for Water Enterprises as part of a projectunder the bilateral cooperation programme between the Government of theRepublic of Indonesia and the Government of the Kingdom of the Nether—
Report contains the
Guide for users of
lands.
This Final
Volume 1
Volume 2A
Volume 2B
Volume 3
Volume 4
Volume 5A
Volume 5B
Volume 6A
Volume 6B
Volume 7
Volume 8
Training
Training
Training
Training
Training
Training
Training
Training
Training
Training
Modules,
Modules,
Modules,
Modules,
Modules,
Modules,
Modules,
Modules,
Modules,
Volume 9 Tape/slide programmes


TABLE OF CONTENTS
TRAINING MODULES
CODE TITLE
TPG 110 Water quality standards
TPG 120 Water quality control
TPG 121 Water quality control — quality parameters
TPG 125 Clear water quality control
TPG 135 Water quality control information routing for water treatmentprocesses
TPG 400 Water treatment
TPC 110 Setting out
TPC 120 Excavation, bedding, and backfilliag

(S

—~-.--~ ~-~--.-—.--- ..~
-—
-~ ~ —:~-. -~ -— ~~—~—-- ~‘ —-.~- ~-..
-4 “~ ~ -~ S.... -~
~ ~~—
~ ~—‘~--~ ~- -~‘ -S. -~ - -~
~ -- -‘- ~~--——----
-~ -~-- ‘-i’ ~—~- -‘--~- C -
-~ -~
‘C —
———--~ -‘
-
- C5CC- - -
S - -~.~
r--
~‘C’ -
~
~‘
-
~
—
~~-=
~
-~-~
.~
rk4DEPARTMENT OF PUBLIC WORKS
DIRECTORATE GENERAL CIPTA KARYA
DIREcTORATE OF WATER~ SUPPLY
MDPP
~IWACO
Module ‘ WA~1’ER QUALITY STANDA~DS
- :. - - -
Code : TPG 110
Edition : 14—03—1985‘C C--
Section 1 : I N F 0 R M A T I 0 N S H E E T Page : 0]. of 01/08
Duration - -~
Train in~ objectives
-‘C-—C-
i~!~_’ ~— 4-—.-
- ~ :~-~ ~- ~ ‘~ ‘-‘~---~--‘-
j~i ~_-;__~ ~--. — -
—
Trainee selection
~ ~2-..~--
• S ~C~-C-~
-~---~~-—9t -fl
~ .~ -
Training aids
_~r.5 ,.
~-~- -~‘a~4~~- -.•- •-;-C-5C ‘C - -
-~•-~-
-~ .;~ ~-5C: -~- -~
SpeciaLieatures
1.~~
Keyword~
45 minutes.
After the session the trainees will be able to:— identify several water quality guidelines,
recommendations and standards;- identify the guidelines for each water quality
parameter.
Director of Water Enterprise;- Head of Technical Department;— Head of Section Production;— Head of Section Distribution;— Head of Sub—section Water Treatment;— Head of Sub—section Laboratory.
— Viewfoils : TPG 110/v 1;— Handout : TPG 110/H 1.
Drinking water quality standards/WHO guidelines!E—coli/colifornis/most probable number/MPN.
‘-5- ~- .-~.- -:~- -
y T~--- -~ .•~ - ~ - - -~--.;-
- -- . -. --~
5-— - S ‘~:-T~~•

4

Module : WATERQUALITY STANDARDS Code : TPG 110
Edition : 14—03—1985
Section2 : SESSION NOTES Page : OlofO2
1. Recommendations for drinking water
— The WHO recognizes a number of guidelineswhich can be met as:
• acceptable;preferable;
• not to be exceeded;• maximum permissible.
— One should aim for the “not to be ex-ceeded” value.
— The standards of the WHO are summarized intables.
2. Expression of the results
— Most results are expressed as mg/i.— The expression ppm (mg/kg) should be aban-
doned.— Chemical components should be expressed in
ions.— Turbidity should be expressed in units of
turbidity (FTU, NTU).— C&lour should be expressed in units on a
platinum—cobalt scale.— Volumes are expressed in ml.— Temperatures are expressed in degrees
Celsius (°C).— Bacteriological examinations are given in
colonies per millilitre of water, with themedium, time and temperature of incubationbeing stated.
— Estimates of’ the number of Coliform organ-
isms indicative of pollution should begiven in terms of the “most probable num-
ber” per 100 ml (MPN/l00 nil).— In reporting chemical analyses, the sen-
sitivity, accuracy, and precision of themethod should be indicated.
— Water treated (e.g. by chlorination):effective treatment followed by chlo-rination will provide water free ofcoliforms;no random sample of 100 ml will revealthe presence of coliforins;
Use whiteboard
Give H 1
Show V 2
3. Bacteriological quality

&
r

Module : WATER QUALITY STANDARDS Code : TPG 110
Edition : 14—03—1985
Section2: SESSION NOTES Page : 02of02 -
• positive samples must always be sub-jected to an appropriate confirmationtest. When this test proves possitivetoo one should immediately check thepurification process.
— Untreated water:• if E—coli are shown to be present in a
100 ml sample the water will be con-sidered unsatisfactory;
• if frequent sampling repeatedly showsthat coliforms are present, steps must
be taken to discover aifd eliminate thecause of pollution;if ~E—co1i exceeds the number of 3 per100 ml, the water must be consideredunusable without prior disinfection.
Use whiteboard

Jr

Module : WATER QUALITY STANDARDS Code : TPG 110
Edition : 14—03—1985
Section3 : TRAINING AIDS Page : OlofOl
Expression of para— TPG 110/V 1meters
EXPRESSION OF PARAMETERS
CHEMICAL PARAMETERS:- —I U ION
PHYSICAL PARAMETERS:- IVNSTDITI ‘TI ITO
-001.005 I.rTON,.,C. 1001.1
- T1U,,•AtU•E ~
BACTERIOLOGICAL PARAMETERS:—c~.~l ,~
“‘OW”
Viol OF INC010ViDIT~asTa ~aaTCa
I ~• -
Drinking water TPG 110/11 1quality standards

1~

DEPARTMENT OF PUBLIC WORKS MDPP
rk4DIRECTORATE GENERAL CIPTA KARYA
______ DIRECTORATE OF WATER SUPPLY IWA~~O
Module : WATERQUALITY STANDARDS Code : TPG 110
Edition : 14—03—1985
Section4: HANDOUT Page : OlofO4
RECOt44ENDATIONS FOR DRINKING WATER
Evaluating water quality requires standards. A number of differentstandards are available and in use, since they were developed indifferent societies under different circumstances.Most commonly reference is made to the standards as issued by theWorld Health Organization. The WHO recognizes a number of guidelinesthat can be met, suc1~ as “acceptable”, “preferable”, “not to beexceeded”, and “maximun~ permissible”. It is obvious that, if feasi-ble, the “not to be exceeded” guideline should be aimed at.The drinking water standards as issued by WHO and Indonesia are shownin table 1.
The main recommendations may be sununarized as follows:
— Expression of results
Results are expressed in mg/i. The expression “parts per million”(ppm) should be abandoned. Wherever possible, chemical componentsshould be expressed in ions. Turbidity should be expressed inunits of turbidity, and colour in units of colour based on theplatinum—cobalt scale. Volumes should be expressed in mullilitres(ml) and the temperature in degrees Celsius (°C). In bacteriolo-gical examinations, the total number of microorganisms developingon solid media should be expressed in significant figures as co—lonies per mi]ljljtre of water, the medium, time and temperature ofincubation being stated. Estimates of the number of coliformorganisms — Escherichia coil and other microorganisms indicative ofpollution — should be given in terms of the “Most Probable Number”per 100 ml (MPN/lOO ml).In reporting chemical analyses, the sensitivity, accuracy, andprecision of the method should be indicated. This includes theproper use of significant figures and the expression of reliabilitylimits.
— Bacteriological quality
The following standards have been laid down for water distributedin pipe systems:
a. Water treated, for example, by chlorination:Effective treatment followed by chlorination or another form ofdisinfection, will normally provide water free of coliforms,however polluted the initial raw water may have been. Inpractice, this means that no random sample of 100 ml of waterwill reveal the presence of coliforms. Any sample taken at theinlet to the network and not conforming to this standard should


I
Module : WATER QUALITY STANDARDS Code TPG 110
Edition : 14—03—198,5
Section4: HANDOUT Page : 02of04
call for an immediate inspection of the purification processand the sampling method. However, when examining chlorinatedwater, the samples assumed to be positive must always be sub—jected to an appropriate confirmation test.
b. Untreated water: -
In this case the ..water entering the distribution network willbe considered unsatisfactory if Escherichia coli are shown tobe present in a sample of 100 ml taken periodically from sriundisinfected network, provided that the intakes and reservoirsare considered to be satisfactory. If sampling repeatedlyshows that coliforms are present, steps must be taken to dis-cover, and if possible eliminate, the cause of the pollution.Where the number of coliforms exceeds 3 per 100 ml the watermust be considered unusable without prior disinfection.
The following recommendations are made for samples taken fromdistribution networks:1. In any one year, at least 95~of the 100 ml samples must be
free of colifornis;2. No single 100 ml sample must contain E—coli;3. No single sample must contain more than 10 coliforms per
100 ml;4. Coliforins must not be detected in 2 successive 100 ml
samples.
If examination of samples reveals the presence of coliforms, atleast one more sample must be taken. If 1 to 10 coliforins (ormore in some samples) per 100 ml are regularly found, there isreason to believe that undesirable substances are entering thewater, and urgent measures are necessary to discover and elimi-nate the cause of the pollution.


Module : WATERQUALITY STANDARDS Code : TPG 110
Edition : 14—03—1985
Section 4 : H A N D 0 U T Page : 03 of 04
Table 1. Maximum acceptable contents of undesirable components in drink-ing water WHOstandards (1970—1971) and Indonesian standards.
2. pH3. Filtrable residue
(TSS)4. Total dissolved
solids5. Turbidity
7.8.9.
10.ii.12.13.14.15.16.17.18.19.20.
Calcium[ron (total)
MagnesiumManganese4’~JmnoniumChlorideBicarbonateNitriteNitrateSulphateDissolved oxygenHardnessAggressive C02Free chloride
mg/iPt/Comg/img/i
mg/i 25
/100 ml--]100 ml
/100 ml
2001.01500.5
600
0.150
400520
0.2 - 1
1000
10
750.1
0.050.05200
20085
0.5
Component UnitsMaximum acceptable Preferably not
to be exceededWHOIndonesia WHO
A. PHYSICALCONDITION
1. Colour
6.9 — 9.2
1,500mg/i
50
6.9 — 9.2
1,500
25
5
7.0 — 8.55
500
5
B. CHEMICALCONDITION
6. Organic matter mg/iKMnO4mg/i Camg/i Femg/i Mgmg/i Mnmg/i NH4~mg/i Clmg/i HCO3mg/l N02mg/i NO~mg/I S042
mg/i 02
mg/i C02mg/i C12
10
2001.01500.50.06002000.020
400
5—100.00.2 — 1
C. BACTERIOLOGICALCONDITION
21. Total count22. E—Coli23. Faecal
streptococci
000


Module : WATER QUALITY STANDARDS Code : TPG 110
Edition : 14—03—1985
Section 4 : H A N D 0 U T Page : 04 of 04
2. STJ4IARY
Various standards exist for judging the quality of drinking water.One of the most widely used sets of standards is that of the WHO, inwhich four types of ranges are indicated: “acceptable”, “preferable”,“not to be exceeded”, and “maximum permissible”.
Results of water quality analyses must be expressedaccording to astandardized format.
“Maximum acceptable” concentrations of undesirable water componentsare shown, according to the Indonesian and WHOstandards.


CODE
TPG 110/V 1
Module : WATER QUALITY STANDARDS Code : TPG 110
Edition : 14—03—1985
Annex : VIEWFOTLS Page : 01 of 02
TITLE
1. Expression of parameters

‘I

Expression of parameters TPG 110/V 1
C,)
wI-w
0.
U-0z0U)w0~
w
U.
U)crww
z0—a.
IC.)
>-
I0.
C’)w-I w0C’) w
0~
0._I0<
~C.)
~rz 0~0O-
~ow —F-OF-
I I I
I!U•C-)
00
4-Ia.
z
U.
C/)
wI-w
a.-j
C-)
wIC-)
z0I-
00—zI-—<U-
E O~E
Cl) <0~z ~0—W0--J


45 minutes.
MDPPDHVTG I
IWACO
After the session the trainees will be able toidentify— subjects covered by water quality control;— activities to be carried out for water qua-
lity control;— types of information routing, for collecting
of information and for trouble shooting.
- - ~T:~-~--~: ~ -
- ;:~---
- -~
~—-~:~! ---.--~:
~-~~-‘ ~-:---—--~.-~~ - -
- ——V- - - ----- --— - - - - .
DEPARTMENT
DIRECTQRATE
DIRECTORATE
c5F PVBLIC WORKS -
GENERAL CIPTA KARYA
OF WATER SUPPLY
- ~
~—~
Module : WA~’ffR QUA IT! O0NTPOI~ - - -
- I~1T~DUCTION -
- -. - -
Code : TPG 120
Edition : 14—03—1985
Section 1 - I N F 0 RM AT 10 N S HEET Page 01 of 01/14
Duration - -
Train in~ objectives
— -~
-
Trainee selection
—~T ~--~
-------~- —i-
-r m—- -
Training aids
-~.--; --~-1~- -
— ~ 1
Special features
--
—
Keywords =
j,~~—- ~:---~
- 4 -
— Director;— Head of Technical Department;— Head of Section Production;— Head of Sub Section Water Treatment;— Head of Section Distribution;— Head of Sub Section Distribution Connections;— Head of Section Planning & Supervision;— Head of Sub Section Laboratory.
— Viewfoiis : TPG 120/V 1—5;— Handout TPG 120/H 1.
Water quality control/drinking water standards!treatment efficiency/source monitoring/processmonitoring/clear water monitoring! informationrouting.


Module : WATER QUALITY CONTROL— INTRODUCTION
-
Code : TPG 120
Edition : 14—03—1985
Section2: SESSION NOTES Page : OiofO3
1. Introduction
— Water quality control can be executed on: Show V 1• water sources;• water treatment processes;
clear water.
— An important aspect is the handling ofinformation. This can comprise:
actions to be taken;• advice to be given.
— Water quality contrql for water sourceshas to cover the following items:- which parameters are exceeding the
drinking water standards;which treatmentprocessesare able toreduce these parametersto an acceptablevalue.
— Water quality control in water treatmentprocesses focuses on:• monitoring processefficiency;• actions to be taken when efficiency
drops.
— Clear water quality control has to beexecuted to check:
• if water is bacteriologically safe;• if the chemical composition of the water
will affect the water supply system.
— Information routing is a process whichdescribes how information obtained istreated and transferred into understand-able information for non—specialists.
— Information routing is differentiatedinto:
routine information routing, or collect-ing and storing data;
- non—routine information routing, orproblem identification and solving(trouble shooting).


Module : WATER QUALITY CONTROL— INTRODUCTION
- - -
Code : TPG 120
Edition l4—O3—l~5
Section2: SESSION NOTES Page : 02of03
2. Water quality control : source aonitoring
— Water quality monitoring can be applied to
all kinds of water sources.
— SoUrcemonitoring is executed as follows: Show V 2a sample is analyzed;
• the result is reported;- the report is sent to the client
(Directors of the Company, externalpeople or Head of Technical Department);
- one copy is saved for the water qualitycontrol files;
- once every three months a period reportis madeand presentedto the client.
3. Co~ents on water quality results fordrinking water supply
— In general, laboratory reports on waterquality will be made.
— A comment on water quality is reported as Show V 3follows:- the data of the laboratory reports are
comparedwith drinking water standards;• parameters which are exceeding the
guidelines are reported;• additional information, comments, are
added;the report is sent to the client;
• a copy is kept on file.
4. Treatmentprocesøes
— Two sources of information are required Use whiteboardwhen a certain water quality has to beimproved to meet drinking water standards.• the drinking water standards;• the effect of separatetreatment proces—
es on water quality;


Module : WATERQUALITY CONTROL— INTRODUCTION
Code : TPG 120
Edition : 14—03—1985
Section2: SESSION NOTES — Page : 03of03
— To select the treatment processes neces— Show V 4sary for the improvement of the waterquality the following procedure must befollowed:• compare the water quality data with
drinking water standards;trace all parameters exceeding thestandards;
• select the treatment units which aremost suitable for the improvement ofthese parameters;
- select the most condensed process out ofthese units. -
5. Treatment proces. control
—-To control the efficiency of the treatment Show V 5process, the following steps must be taken
take samples of the effluent of eachprocess unit;
• analyze the samples;• present the obtained water quality data
in laboratory reports;- compare the data with previous data
obtained;- report any remarkable difference (c. q.
efficiency drop);• take action if necessary;• all actions taken are reported and
stored in the files;all reports are stored in the files.

If

Module : WATER QUALITY CONTROL- INTRODUCTION
Code : TPG 120
Edition : 14—03—1985
Section3 : TRAINING AIDS Page : 01 of 01
Water quality TPG 120/V 1quality control
I ~~‘~°- I L~rCI11~
?OUStU COLI(CTIflI li—I Oo.~TIO H~:.’~rI1~ I
Co.?.”
¶~7
wart. YflATo.MT CLIAS
.ei.Cl ••oClIt WSTInS
Water quality TPG 120/V 2monitoring
Comments on water TPG 120/V 3quality
Advice on water TPG 120/V 4treatment
Process monitoring TPG 120/V 4 Water quality control TPG 120/H 1— introduction

If

DEPARTMENT OF PUBLIC WORKS MDPP
DIRECTORATE GENERAL CIPTA KARYA
DIRECTORATE OF WATER SUPPLY IWACO
Module : WATERQUALITY CONTROL- INTRODUCTION
Code : TPG 120
Edition : 14—03- 1985
Section 4 : H A N D 0 U T Page : 01 of 09
1. INTRODUCTION
Water quality control can be executed on sources of water , watertreatment_processes,and clear_water. An important aspect is handlingof information, i.e. the actions to be taken or the advice to beprovided. The water sources to be discussed are groundwater andsurface water, next to clear water for householduse and drinking.Treatment processes caic be divided in surface water and groundwater
- -
To identify in which way data are handled and transferred to informa-tion that is understandable for the clients, information elaborationand routing is required.
The following types of groundwater can be distinguished:— shallow groundwater;— deep groundwater and— artesian groundwater.
Water quality control of groundwater has to cover the followingitems:— is water quality suitable for drinking water;— if drinking water standards are exceeded, what kind of water
treatment has to be recommended.
For water quality control, surface water, although present inseveral ways, can be treated as one group. Direct household use ofsurface water is unlikely, therefore water quality control has tofocus on the type of water treatment required to obtain a waterquality sufficient for household and drinking water purposes. Themain question is which parameters are exceeding the standards, todetermine the selection of water treatment processes.
Clear water quality control has to be carried out regularly, toidentify those cases where transmission of diseases by water islikely, due to poor water quality, but also to obtain informationwhether the quality of water will give rise to damage of the watersupply system. Clear water quality control comprises the monitoringof water produced at a treatment plant and of water distributed by awater transport system.
The process of water quality control for groundwater and surfacewater treatment processes is In fact similar. Water quality controlfocuses on monitoring of process_efficiency and actions to be takenif efficiency drops.
fnnat~onrouting is a process which describes how information,obtained during water quality control, is treated and transferredinto information Is that understandable for non—specialists.


Module : WATERQUALITY CONTROL— INTRODUCTION
Code : TPG 120
Edition : 14—03—1985
Section 4 : H A N D 0 U T Page : 02 of 09
Information routing for source monitoring is a rather static process,while information routing for clear water and “process” qualitycontrol differentiates into routine and non--routine routing.Routine information routing is static and aims at data collection andstorage, while non—routine information routing is dynamic:a programme of problem identification and solving is required. Foreach type of water treatment and distribution system a specific planof action has in fact t~ be available.
2. WATERQUALITY CONTROL: SOURCEMONITORING
Water quality monitoring can be applied to all kinds of watersources. The general flow sheet for data processing is shown infigure 1.
A sample is analysedand the sampling result is reported. In generalthe result of the chemical examination is sent directly to theclient. However, one copy is saved in the water quality controlfiles. Once every three months the data on the previous period aresummarized in tables and graphs (time dependency) and presented tothe client.The clientpeople, butenterprise.
might be the Directors of the own company, externalalso the Head of the Technical Department of the water
rWASOURCE [
-J TREATMLN~
‘1 PROCESS
-J AR1LWATER I
Fig. 1. Water queiJi~ycontrol; flow chart.


Module : WATER QUALITY CONTROL- INTRODUCTION
Code : WG 120
Edition 14—03—1985
Section4: HANDOUT Page : 03of09
3. CO~+1ENTSON WATERQUALITY RESULTS FOR DRINKING WATERSUPPLY
In general laboratory reports will be available with data to commentwhether the water is fit for water supply purposes or not. Ifrelevant parameters are missing, resampling and chemical/bacterio—logical examination is required.
The data of the laboratory reports are compared with the drinkingwater standards. If nonç of the chemical compounds is exceeding theguidelines, a qualification “fit for water supply” can be issued.If some compounds do not meet the guidelines, the comment shallindicate “parameter ... is too high in concentration for drinkingwater”. Additionally information can be provided on to what degreethe standard is exceeded.
The laboratory report together with the comments is sent to theclient. Besides one copy is kept in on files to build up an own databank.The flow chart is shown in figure 2.

-7-

Module : WATERQUALITY CONTROL- INTRODUCTION
Code : TPG 120
Edition : 14—03—1985
Section4 : HANDOUT Page : 04of09
Fig. 2. Water quality aonitoring; flow chart.

~1~

Module : WATER QUALITY CONTROL Code : TPG 120
Edition : 14—03—1985
Section4 : HANDOUT Page : 05 of 09
4. TREAThiRNT PROCESSES
If a sample is received for which an advice is requested regardingquality and ways to improve the quality up to drinking waterstandards, two types of information are required:1. the set of drinking water standards.2. the various water treatment processes and their effects on
water quality.
The following procedure is recommended:
The results of the physio-chemical biological examination of thewater sample are compared with the drinking water standards. Allparameters exceeding the drinking water quality levels “acceptable”are traced and kept apart.Subsequently for each parameter kept apart, the most common treatmentprocess and alternative treatment processes are determined. In thefollowing step the most condensed treatment process is selected.
The flow chart is shown in figure 3, while the review of treatmentprocesses is shown in the following table.
Fig. 3. Co.ents on water quality; flow chart.


Module : WATER QUALITY CONTROL— INTRODUCTION
Code TPG 120
Edition : 17—04—1985
Section 4 : H A N D 0 U T Page : 07 of 09
SYSTEMATIC REVIEW OF TREAThIENT PROCESSES(Continued)
PARAMETERTREAThIENT PROCESS TO BE SELECTED FOR
-
GROUNDWATER SURFACE WATER
13. nitrite trickling filter!slow sand filter
slow sandfiltration
14. nitrate — —
15. sulphate — —
16. dissolved oxygen aeration aeration
17. hardness — —
18. aggressivecarbon dioxide
aeration/lime dosingmarble filtration
lime dosing/aeration marblefiltration
19. free chlorine chlorine dosing chlorine dosing
20. bacteriological disinfection disinfection


Module : WATER QUALITY CONTROL— INTRODUCTION
Code : TIN] 120
Edition : 14—03—1985
Section4: HANDOUT Page : 08of09
SAMPLE
WATERALIT
OATA
WATTER WAlEROUAUTY
STANDDATA
I TREATS~KT
S~cno”
REAT MENPROCESS
Fig. 4. Advice on water tz-eat.ent; flow chart.
5. TREANENTPROCESSCONTROL
To monitor the efficiency of water treatment processes samples aretaken from specific places of the water treatment plant. Afterchemical, physical and bacteriological examination the water qualitydata are presentedin laboratory reports.
The data of the sheets, i.e. the concentrationsof the severalparameters, are compared with special water treatment efficiencylists. If the removal rates are within the limits, the water qualitycontrol report issues a “no—comment, treatment according tospecifications”.However, if the efficiency of one of the processes drops down tocertain levels, action has to be taken and in the water qualitycontrol report a remark to that effect is incorporated.
Whether commentsor no comments are issued, the water quality reportis presented together with the laboratory results to the client andis also kept on file. The flow chart is shown in figures 4 and 5.


Module : WATERQUALITY CONTROL— INTRODUCTION
Code : TIN] 120
Edition : 14--03—l985
Section4: HANDOUT Page : 09of09
6. 81144ARY
Water quality control can be related to:
— Water sources.— Water treatment processes.— Clear water.
An important aspect is the handling of information,actions to be taken and advice to be provided.
comprising:
Flow charts are provided for:
— Water quality control (general).— Water quality monitoring.— Commentson water quality.— Advice on water treatment.— Process monitoring.
These show the routing of information, whether of a routine nature or
Fig. 5. Process Monitoring; flow chart.
not.


Module : WATERQUALITY CONTROL— INTRODUCTION
Code : TIN] 120
Edition : 17—04—1985
Annex : V I E W F 0 I L S Page : 01 of 06
TITLE CODE
1. Water quality control
2. Water quality monitoring
3. Comments on water quality
4. Advice on water treatment
5. Processmonitoring -
TIN] 120/V 1
TIN] 120/V 2
TRG 120/V 3
TIN] 120/V 4
TiN] 120/V 5


Water quality control TPG 120/V 1
COLLECTIONAND STORAGE
OF DATA
WATER QUALITY
CONTROL


Water quality monitoring TIN] 120/V 2


Comments on water quality TIN] 120/V 3


Advice on water treatment TPG 120/V 4
IWATER1UALIT
DATA
_______ 17
[WATTER I fWATERQUALITY ~ ~QUALrrY
DATA P.
TREATMENTSELECTION
REATMENPROCESS
LI~~III~EPORTING(

I-

Process monitoring TIN] 120/V 5
REATMENTTANDARDS


MOPDHVTG I
IWACO
F~-’C~-iT:
~ bEPAn~M~Nro~ PUBLIC WORKS - -
OIRECTORATE GENERAL CIPTA KARYA______ OIRECTORATE - OF WATER SUPPLY
WATth[QOALITYTëaNTPOL -
rQITYYAI~Th!~- -
Code : TIN] 121
Edition : 14—03—1985
Section 1: I N F 0 H M AT I O N S H tE T Page 01 of 01/10
Duration =
~Training objectives
t1t~~
45 minutes.
After the session the trainees will be able to:— identify the effects caused by water quality
components;— recite the nature of each of the water quality
parameters.
— Managementof the Water Enterprise;— Head of Production and Distribution Section;— Chief (Head) of the Laboratory Section.
— Viewfoils : TIN] 121/V 1—5;— Handout : TPG 121/H 1.
Water quality control/water quality parameters/physical parameters/bacteriological parameters/colour / turbidity /pH/conductivity/temperature/suspended solids/organic matter/free chlorine/hardness/iron and manganese/chloride/sulphate/nitrogen compounds/carbondioxide/b icarbonate/carbonate/aggressive002.
Traine~~election-----4----
-~ t ~ -~
Training aidi -
-i ~‘r—-z ~-
- ~T ~
Special features
Keywords -
- ~ !:
- ~- ~—t-
:!r-~r- :~
3- -~- -- ------ ~
---I ~1-
t_L_____ ~ - - -


Module : WATER QUALITY CONTROL— QUALITY PARM�TERS
Code : TIN] 121
Edition : 14—03—1985
Section2 : SESSION NOTES Page : 01 of 03
1. Introduction
- Water quality control is important be— Write on whiteboardcause:
it protects consumersagainst diseasescaused by the consumptionof water witha poor quality;it prevents corrosion of pipes by ag—
gressive water; -- --
it prevents the people from being forcedback to their traditional and oftensuspectedsourcesbecauseof poor quali-ty of the water from the public watersupply.
2. Review of water quality parameters Explain properties
Show V 1
— Colour:the origin of colour are organic com-pounds and/or some inorganic compoundslike iron.
— Turbidity:turbidity is causedby colloidal matterwhich consists of particles not visibleto the naked eye.
— Conductivity:the higher the conductivity, the higherthe concentration of dissolved compoundsin the water;a high conductivity is mostly caused bythe presenceof chlorides, sulphatesandnitrates.
— Temperature:all biological and chemical reactionsare dependenton the temperature.
- — Suspendedsolids: -
suspended solids are visually detect-able;suspendedsolids are settleable.


Module : WATERQUALITY CONTROL— QUALITY PARAMETERS
Code : TIN] 121
Edition : 14—03—1985
Sectjon2 : SESSION NOTES Page : 02of03
—pH: ShowV2definition: pH — log [He];a pH of 7 indicates a neutral water;a low pH (acidic water) in groundwater
often indicates en aggressive COz con—tent;a high pH (basic water) in surface wateroften indicates algae activity.
ChernicaL~rameters Show V 3Explain properties
— Organic mattersorganic matter can be oxidized by potas-sium perinanganate;water rich in organic matter must besuspectedof bacteriological or chemicalcontamination.
— Free chlorine:• chlorine is a strong oxidizing agent;
it inactivates pathogenic and non patho-genic organisms.
— Hardness:• hardness is the presence of Mg and Ca
ions;hardness is measuredin German degrees(°D);3—6 °D is called soft water, 15—25 °D iscalled hard water;hard water forms insoluble precipitateswith soap and leads to scale forming onpipes and boilers.
— Iron and manganese:if present above a certain concentra-tion, they - impart tastes and stain ar-ticles which are being washed.
— Chloride:chloride in a high concentration causesa salty taste (sea water);chloride can be detrimental to agricul—tural crops.


Module : WATERQUALITY CONTROL— QUALITY PARAMETERS
Code : TIN] 121
Edition : 14—03—1985
Section2: SESSION NOTES Page : 03of03
— Sulphate:sulphate as a salt of magnesiumcausesasalty bitter taste and has a laxativepotential.
— Nitrogen compounds: - - Shov V 4• nitrogen compounds are ammonia, nitrite
and nitrate;• ammonia is forined anaerobically out of
organic matter;• nitrite and nitrate are formed out of
ammonia by aerobic biological processes;• oxidation of ammomia~ to nitrate can
cause a deficiency of oxygen, finallyresulting in anaerobic water of a poorquality.
— Carbon dioxide/bicarbonate/carbonate/ Show V 5aggressive C02:• in waters carbonic acid is present as
C02, HCO3 and C02, in amounts dependingon the pH;CO3 is in equilibrium with Ca forminginsoluble salts;
• C02 is in equilibrium with atmosphericCO2 gas;
• an excess of dissolved C02 will dissolveCaC02 and is called aggressiveCO2;an excess of carbonateswill lead toinsoluble CaCO3 forming scale on struc—
tures in contact with the water.
Bacterjol~gical_parameters Show V 6-~ Write on whiteboard
— The potability of water can only be deter-mined by an additional bacteriologicalexaitination.
— The presence of pollution by faeces isbased on the search for Escherichia Coli.
— Water that contains E—Coli can becomedangerous in the event of an epidemic. Give H 1


Module : WATERQUALITY CONTROL— QUALITY PARAMETERS
Code : TPG 121
Edition : 14—03—1985
Section3: TRAINING AIDS Page : OlofOl
Physical parameters TIN] 121/V 1
PHYSICAL PARAMETERS
• Colour
.Turbidlty
• Conductivity
• Temperatur.
•Suspended solids
•pH
pH values of water TPG 121/v 2sources
pH Vslu.s of w.tsr sources
Chemical parameters TPG 121/V 3
- CHEMICAL PARAMETERS -
Organic matter
• Fre. chiorinsHardness
• Iron and Manganese
• Chiorid.
• SulphateNitrogen Compounds
• Carbon dioxids
Bicarbonate Carbonate
Carbonate system
Aggressive C02
Nitrogen compounds TIN] 121/V 4
NITROGEN COMPOUNDS
[~ganic matt.r -i
bacteria anaerobic process•
~mmonlum (NH4~
bact.rLi!4
LNi~1te (NO~~ aerobic process
bacteria
~trats (NO~) 1oxygsn (02)
Carbonate system TPG 121/V 5
- Carbonate System —
CO2 (gas)
H~CO2 (dissolved) Ca
2
-;;~~/~#
Water quality control TIN] 121/H 1— quality parameters
- - -

4

11DEPARTMENT OF PUBLIC WORKS MDPP
rk4I DIRECTORATE GENERAL CIPTA KARYAIDIRECTORATE OF WATER SUPPLY IWACO
Module : WATERQUALITY CONTROL— QUALITY PARAMETERS
Code : TIN] 121
Edition : 14—03—1985
Section 4 : H A N D 0 U T Page : 01 of 05
1. INTRODUCTION
Water quality control is important as it protects consumers againstdiseases caused by the consumption of water with a poor quality. Butthere are other reasons to practice water quality control. In spe-cial cases human health is threatened by indirect effects of waterquality, such as aggressiveness of water causing corrosion to thepipes of the distribution system, which may result in leakage andthus contamination of drinking water. Some parameters like taste,smell and colour may adversely influence water use, and make thepeople go back to their traditional, and often suspected, sources ofwater supply.
In this section all parameters that are important for water qualitycontrol will be briefly reviewed, considering their physical,chemical and biological properties as far as relevant for watersupply systems.
2. REVIEW OF WATER QUALITY PARAMETERS
1. Physical parameters
Colour
Colour of water is caused by the present of organic matter(brown, yellow, green) and/or certain inorganic compounds — suchas iron (brown to reddish brown). Colour is expressed in unitson the platinum—cobalt scale.
i~rkJi1i~z
Turbidity is caused by the presence of colloids. Colloidalmatter, mostly present in surface water, causes a turbid ap—pearance. The colloidal matter consists of small particles thatare not visible to the naked eye. Colloids behave like dissolvedmatter and remain in suspension even when the water is virtuallyat rest.Turbidity is expressed in units NTU or FTU.
eLf
Inorganic and organic matter dissolved in water, dissociates,forming positives ions (kations) and negative ions (anions). Thesame happens with the water molecule H~’O, which dissociates intoone H
4 ion and one OH- ion.The pH of the water is defined as the negative logaritm of thehydrogen ion concentration: pH - log [H’).


Module : WATERQUALITY CONTROL— QUALITY PARAMETERS
Code : TiN] 121
Edition : 14—03—1985
Section4: HANDOUT Page 02of05
A water with a pH lower than 7 is said to be acidic and a waterwith a pH higher than 7 basic. A low pH of groundwater oftenindicates an aggressive C02 content. A high pH value of surfacewater is often the result of algae activity.
The conductivity of water is a measure of the conductance ofelectricity by the water. Since the conductance is based uponthe transport of electrically charged particles, measuring itgives a direct indication of the presence and quality of dis-solved compounds in the water. The higher their concentration,the higher the measured conductivity.A high conductivity is mostly caused by the presence of chlo-rides, sulphates and nitrates.
2’ep~raturç
For the examination of samples, whatever the source may be,temperature (°C) is important to know, since all biological andchemical processesare temperaturedependent,mostly going fasteras temperatureincreases.
§Y~P~!Lcl2L!2iA~
In water solids are present of which a part is suspended and, incontradiction to colloids, visually detectable. Since they willsettle by gravity, their quantity (mg/l) can be determined easi—ly.
2. Chemical parameters
This term includes all substancesthat can be oxidized by potas-sium permanganate at boiling point. The results are expressedeither in mg/l 02 or in mg/i KMnOs; It is compulsory to statethe reference (1 mg/i 02 = 3.95 mg/i KMnO.). The health signifi-cance of thesesubstancesis not clearly understoodand it is notnecessarydangerous to health to drink water which contains largequantities of organic matter (a cup of tea contains 2,000 mg/l oforganic matter [sugar] expressed as oxygen).


Module : WATERQUALITY CONTROL— QUALITY PARAMETERS
Code : TIN] 121
Edition : l4—03—i985
Sect ion 4 : H A N D 0 U T Page : 03 of 05
Some forms of organic matter give rise to colour and bad taste,as they favour the development of such organisms as algae, fungi,and bacteria, which attach themselves to pipe walls and secreteessences having an unpleasant smell. They can also create mal-odorous compounds by reacting with the chlorine used for disin-fection purposes. Water rich in organic matter must always besuspected of bacteriological or chemical contamination (reducingagents).
Free_chlorine -
Chlorine is a strong oxidizing agent, used for drinking waterdisinfection, i.e. to inactivate pathogenic and non—pathogenicmicro—organisms. In drinking water free chlorine has to bepresent in a certain concentration to ensure the absence ofpathogenic and non—pathogenicmicro—organisms.
Carbon dioxid~bicarbonate/ç~rbonate/~ggressivecathondioxide
In natural waters, carbonic acid is present in several forms(carbon dioxide, bicarbonate or carbonate) dependingon the pH.Apart from this, salts of calcium and magnesiumcarbonates may beformed.Carbon dioxide, a gas (C02), reacts with water forming carbonicacid (IIzCO3). Through dissociation the bicarbonate form will becreated.
In geneal the salts of carbonic acid are insoluble. One of themis calcium carbonate (CaCO~). In water, calcium carbonate is inequilibrium with the soluble calcium bicarbinate and carbon di-oxide according to the following equation:
CaCOa + 1120 + C02 ——> Ca(HCOa)zcalcium water carbon calcium bicarbonatecarbonate dioxide
If some of the compounds are present in excess of the equilibriumconcentration, reactions will take place. If the reaction is dueto an excess of carbon dioxide, the calcium carbonate will dis-solve arid calcium bicarbonate is formed. The amount of carbondioxide capable to dissolve calcium carbonate is called “aggres-sive carbon dioxide”. Water containing aggressive carbon dioxidewill affect concrete and asbestos cement, but also copper andlead pipes in a water supply system.If calcium bicarbonate is present in excess of the equilibriumconcentration (hard water) the reversed reaction will occur,calcium carbonate is formed and precipitates, forming scale onthe surface of structures in contact with the water.


Module : WATERQUALITY CONTROL— QUALITY PARAMETERS
Code : TPG 121
Edition : 14—03—1985
Section4: HANDOUT Page : 04of05
Hardness
Hardness of water is due to the presenceof calcium and magnesium
ions. The hardness can be expressedin American, French orGerman degrees, or as milli—equivalents. Commonly hardness ispresented in German degrees (°D). 10D complies with 10 mg/i CaO.To calculate water hardness in German degrees, the concentrationsof calcium and magn~sium are converted into the equivalent amountof CaO (by weight). -
The classification of water hardness is as follows:
3°D3 — 6°D6 — 10°D
10 — l5°D15 — 25°D
— 25°D
very softsoftrather softrather hardhardvery hard
Hardness forms insoluble precipitates with soap, which leads to
waste. It also leads to scale—forming on pipes and boilers.
Iron and sanganese
Iron and manganeseare natural componentsin water. Although notharmful to human health their presence in clear water will beavoided as much as possible. Iron may causea yellow colour ofwater while both iron and manganeseif present in any concentra-tion above the very lowest, impart taste and stain articles whichare being washed.
Chloride
Chloride is present in water as the soluble salt of sodium,potassium and calcium. Chloride as magnesium salt causes abitter taste in water, while the sodium chloride at a concentra-tion of 500 mg/i or more causes a salty taste (sea water). Toohigh salt levels (> 300 mg/i) can be detrimental to agriculturalcrops, depending on their salt tolerance.
~PJPi~t2
Sulphate in water, mostly present as calcium sulphate (gypsum),is not harmful to human health. However, sulphate as a salt ofmagnesium, which also has a laxative potential, imparts a bittertaste.


Module : WATERQUALITY CONTROL— QUALITY PARAMETERS
Code : TPG 121
Edition : 14- 03—1985
Section4: HANDOUT Page : 05ofO5
The group of nitrogen compounds comprises ammonia (N}L2~), nitrate(N0
3) and nitrite (N02) as inorganic compounds. Moreover,nitrogen can be present in a number of organic compounds. Sincethis group is rather complex, their presence is determined bychemical destruction with a suitable acid to release ammoniacompounds which can’be determined. The concentration obtained inthis way is expressedas Kjeldahl nitrogen. The nitrogen com-pounds originate from a variety of sources, amongst which isfaecal matter, either from animals or man. As organic matter,e.g. plant materials and solid waste, decomposesanaerobically,enmionia is also formed. Nitrate and nitrite are created inaerobic bacteriological processes, from ammonia.Nitrate is not harmful for human beings as long as a concentra-tion of 30.0 mg/i is not exceeded in water.Nitrite is a compound causing infantile inethaemo—globinaemaandshould not be present in drinking water.
Ammonia itself is not detrimental to human health. However, ifpresent in water it can causea deficiency in oxygen and a va-riety of anaerobic microbiological processes may occur, causingdeterioration of water quality.
3. Bacteriological parameter.
Chemical analysis as such is not sufficient for deciding whethera water is potable or not. Information regarding organic matter,nitrogen, etc. can only serve as a guide with respect to thepossibility of pollution. The potability of water can only bedeterminedby additional bacteriological analysis. Bacteriolo-gical analysis is essentially a laboratory matter and involvesspecialists or specially trained people.
Water bacteriology is based on the search for germs of the bac—terium coli type, and in particular Escherichia Coli. Althoughthey are not dangerousin themselvesthey do indicate the pos-sibility of faecal pollution. Water which contains these germscan thus become dangerous in the event of an epidemic.


TITLE
1. Physical parameters
2. pH valves of water sources
3. Chemical parameters
4. Nitrogen compound
5. Carbonate system
Module : WATERQUALITY CONTROL- QUALITY PARAMETERS
Code : TIN] 121
Edition : 14—03—1985
Annex : V I E W F 0 I L S Page : 01 of 06
CODE
TIN]
TPG
TPG
TPG
TIN]
121/V 1
121/V 2
121/V 3
121/V 4
121/V 5


Physical parameters TIN] 121/V 1
C/)ccLUI—LU
cc0.—I
0
>-
I0~
Cl)
.3Cl)
~1)
C
aCl)
C/)
0aE0F-.
>1
.20.
Ia


pH valves of water sources TPG 121/V 2
Cl)0C.)
0Cl)
0
0Cl)~1)
>Ia
z0cc
ccLUF-
L()II
Ia
ccLUF-
LU
C)
cc
(P~4
0C)0
.~Cl)~1)
0)0,


Chemical parameters TPG 121/V 3
— CHEMICAL PARAMETERS -
Organic matter
Free chlorine
Hardness
‘Iron and Manganese
Chloride
Sulphate
Nitrogen Compounds
Carbon dioxide
Bicarbonate
Carbonate
Aggressive CO2
S
.
.
S
.
Carbonatesystem


Nitrogen compound TiN] 121/v 4
K
I
U)U)0C)0aCi
00
CCD
Cl)Cl)0C)0L.
a.C.)
00CD
cs~0C00,
><0
U)
z00.
0C)zLU
0ccI-


Carbonate system TiN] 121/V 5
I
EmU)>1
C,)0
CDC0I..
CDC)
I
Cl)CD0)
0C)
I


~-:
~—--~ —~~-- --—
~- -
—-
-
-~
—~ ~--•.
I
~-
- -~
.
——V--
-—
~~
-- -~ --~---~
rk4DEPAf~TMENT
DIRECTORATE
DIRECTORATE
OF PUBLIC ~WORKS
GENERAL CIPTA KARVA
OF WATER SUPPLY
MDPP
~j?~’(IWACO
Module : CLEAR WATER QUALITY CONT~)L
= ~- — -
Code : TPG 125
Edition: 14—03—1985
Sectionl: INFORMATION SHEET Page : OlofOl/lO
Special features
—
-~ -
- ~4 ~_ - - =-~= ~, - - —
Duration -
Training objectives
+
- — -
-
~ ii~~’i~ -~
Trainee select ion
.~ -~ .- -
-~-- -~Training ajds
45 minutes.
After the session the trainees will be able to:— recite why clear water quality control has to
be executedregularly;— recite how to executewater quality evalua-
tion;— recite how to report results of water quality
control;— identify how to react in case of water quality
conditions that are detrimental to health.
I’
— Head of Section Production;— Head of Sub—section Water Treatment;— Head of Sub—section Laboratory.
— Viewfoils TPG 125/V 1—3;— Handout : TIN] 125/H 1.
Clear water quality monitoring/water deteriora-tion/sampling frequency/free chlorine content/bacteriological condition.
Keywords - -
—~L ~
— —~--- —.
~ ~


Module : CLEAR WATER QUALITY CONT~)L Code : TIN] 125
Edition : 14—03—1985
Section2: SESSION NOTES Page : OlofO3
1. Introduction
—Clear water quality monitoring is requiredto:
prevent transmission of diseases to theConsumer;prevent detrimental effects to thesupply system.
— Clear water quality is checked: Show V 1prior to water distribution (at thestorage reservoir);after distribution~~(at~’the periphery ofthe system).
2. Water quality deterioration
— Water quality deterioration can be caused Use whiteboardby:
intrusion of shallow groundwater ifwater pressure in the distribution sys-tem drops;intrusion of shallow groundwater atdamagedplaces in the piping system;dissolving of pipe materials due toaggressivenessof the water;bacteriological processes due to absenceof sufficient chlorine in the water.
— Bacteriological processes may occur even Show V 2if the chlorine content in the reservoiris found to be sufficient, because freechlorine can be reduced by oxidizablematter that is:• present in the clear water;• entering the distribution system through
leaks.

Module : CLEAR WATER QUALITY CONT~)L Code : TPG 125
Edition : 14—03—1985
Section2: SESSION NOTES Page : 02of03
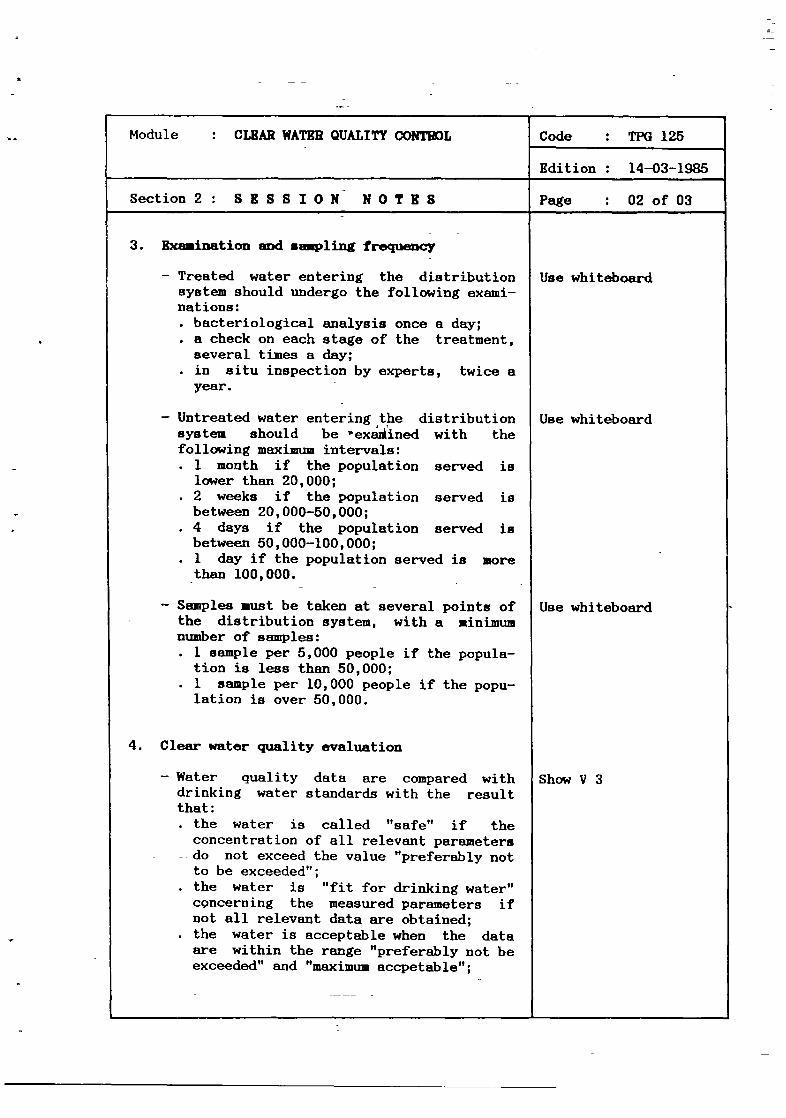
3. Examination and sampling frequency
— Treated water entering the distributionsystem should undergo the following exami-nations:• bacteriological analysis once a day;
a check on each stage of the treatment,several times a day;
• in situ inspection by experts, twice ayear. -
— Untreated water entering the distributionsystem should be ‘exailined with thefollowing maximum intervals:• 1 month if the population served is
lower than 20,000;2 weeks if the population served isbetween 20,000—50,000;
• 4 days if the population served isbetween 50,000—100,000;
• 1 day if the population served is morethan 100,000. --
— Samples must be taken at several points ofthe distribution system, with a minimumnumber of samples:
1 sample per 5,000 people if the popula-tion is less than 50,000;
• 1 sample per 10,000 people if the popu—lation is over 50,000.
4. Clear water quality evaluation
— Water quality data are compared withdrinking water standards with the resultthat:• the water is called “safe” if the
concentration of all relevant parameters-- do not exceed the value “preferably not
to be exceeded”;the water is “fit for drinking water”concerning the measuredparameters ifnot all relevant data are obtained;the water is acceptablewhen the dataare within the range “preferably not beexceeded”and “maximum accpetable”;
Use whiteboard
Use whiteboard
Use whiteboard
Show V 3


• the water is unsuitable when some of theparameters exceed the maximum acceptablestandards.
— The water quality report shall indicatewhich parameters exceed the standard, andwhich impacts can be expected from this.
— Reporting on two parameters needs specialattention, namely:
residual chlorine content in the distri-bution system;bacteriological condition in the distri-bution system. --
— The chlorine dosing unit must be adjustedin such a way that the free chlorine con-tent in the distribution system is:• high enough to prevent bacterial growth
in the system (> 2 mg/l);• low enough to prevent taste and odour
complaints (< 5 ing/l).
— If bacteriological contamination is con-firmed by two successive samples, the Headof the Section Distribution has to imple-ment corrective measures which must bechecked by sampling.
Module : CLEAR WATERQUALITY CONT~)L Code : TPG 125
Edition : 14—03—1985
Section 2 : S E S S I 0 N N 0 T E S Page : 03 of 03
Use whiteboard
Use whiteboard
Give H 1


j CLEAR WATEROUAUTYCONTROL
\\\
\
)~ \
s.c,I—~
0.1.—c
Module : CLEAR WATERQUALITY CONTROL Code : TPG 125
Edition : 14—03—1985
Section3: TRAINING AIDS Page : OlofOl
Clear water quality TPG 125/V 1control
Reduction of free TIN] 125/V 2chlorine
Water quality TIN] 125/V 3monitoring
Clear water quality TPG 125/11 1control
S


1DEPARTMENT OF PUBLIC WORKS MDPP
DIRECTORATEGENERALCIPTA KARYA_J DIRECTORATE OF WATER SUPPLY IWACO
Module : CLEAR WATERQUALITY CONTI~)L Code : TIN] 125
Edition : 14—03—1985
Sectjon4: HANDOUT Page : OlofO5
1. INTRODUCTION
Clear water quality monitoring is required to prevent transmission ofdiseases to the consumer and to prevent possible detrimental effectsto the supply system.
Two places of clear water quality checking can be distinguished:a~prior to water distribution, andb. after distribution (at the periphery of the system).
The difference between theni is that the first one is merely a pro-duction check, while the second one provides a check of water sup-plied to the customer. The latter is important to carry out, sinceduring water transport and distribution water quality may change/de—teriorate due to physio—chemical and bacteriological processes.
2. WATERQUALITY DETERIORATION
Water quality deterioration processes include:— intrusion of shallow groundwater if water pressure in the distribu-
tion system drops;— intrusion of shallow groundwater at damagedplaces in the piping
system;— dissolving of piping materials due to aggressiveness of the water;— bacteriological processes due to the absence of sufficient chlorine
in the water.
The latter possibility may occur, even if the chlorine content in theclear water is found sufficient. Free chlorine is reduced whenoxidizable matter like organic matter, ammonia and iron (II) ispresent in the clear water or enters the distribution system throughleaks. Clear water quality control rust therefore be executed at thesite of storage as well as after supply to the customer.
The chemical composition of water in both cases has to comply withthe “preferably not to be exceeded (WHO) standard” and must notexceed the maximum acceptable standards.
3. EXAMINATION AND SM’WLING FREQUENCY
Treated water, on entering the distribution system should undergo thefollowing examinations:— bacteriological analysis preferably once a day (at least once a
week);


Module : CLEAR WATER QUALITY CONTROL Code : TIN] 125
Edition : 17—04—1985
Sect ion 4 : H A N D 0 U T Page : 02 of 05
— a check at each stage of the chemical treatment several times aday, the results being put on record;
— in situ inspection at least twice a year by engineering and sanita-tion experts acting on behalf of the responsible authorities.
For untreated water entering the distribution system, the followingmaximum intervals betwepn routine examinations are proposed.
Population servedMaximum intervalbetween successivesamplings
up to 20,00020;000 to 50,00050,000 to 100,000
more than 100,000
1 month2 weeks4 days1 day
For samples taken at several points of thefollowing sampling frequency is proposed,previously been treated or not:
Maximum intervalserved between successive
samplings
Minimum number ofsamples to be takenfrom entiredistribution system
20,000 1 month50,000 2 weeks
100,000 4 days100,000 1 day
1 sample per 5,000of population permonth
1 sample per10,000 of popula-tion per month
4. CLEAR WATERQUALITY EVALUATION
The aim of monitoring the quality of clear water is to identifywhether the water is fit for drinking or: that the water doesn’tcause detrimental effects to the consumer.
distribution systemwhether the water
thehas


Module : CLEAR WATER QUALITY CONTROL Code : TIN] 125
Edition : 14—03—1985
Section4: HANDOUT Page : 03of05
The procedure to be followed is very simple: The water quality dataare comparedwith the water quality standards. If the concentrationsof all parameters mentioned do not exceed the values “preferably notto be exceeded”, the water can be classified as safe. If data ononly a part of the compounds are covered and do not exceed the above—mentioned values, the water is fitfring~~.
After taking into accoui~tthe raw water source, i.e. groundwater orsurface water, it can be concluded whether additional data should beobtained for water quality evaluation or not.
If the water quality data are within the range between “preferablynot to be exceeded” and “maximum acceptable” the water has to beconsidered as a~ç~ptab1e.However, notice shall be given that waterquality is marginal and that measures to improve the drinking waterquality with respect to the relevant parameter have to be taken onthe long run.
If some of the water quality data exceed the maximum acceptablestandards, usage of the water for drinking water should be rejected.
The water quality control report shall clearly indicate which para—meters exceed the standard, and which impacts can be expected as aresult of this.The flow chart is shown in Fig. 1.


Module : CLEAR WATER QUALITY CONTROL Code : TPG 125
Edition : 14—03—1985
Section4: HANDOUT Page : 04of05
SAFE BUTIMPROVEMENTRECOMMENDED
Fig. 1. Water quality monitoring; flow chart.


Module : CLEAR WATERQUALITY CONTROL Code : TPG 125
Edition : 14—03—1985
Section 4 : H A N D 0 U T Page : 05 of 05
The water quality data on two important parametersfor drinking waterquality control need special attention. The free chlorine contentand the bacteriological condition of water distributed through apiped system.
If the free chlorine content of the water at the periphery of thesystem is too low or too high, the responsible management of thewater works enterprise ~hall be informed at once. In this way bacte-riological growth in the distribution system and urzhygienic anddetrimental water conditions should be prevented.
If the quality of water, from a bacteriological point of view, isexceeding the standards, a check sample has to be taken Immediately,to confirm the first one. At the same time people in charge shouldbe notified of a “presumably dangerous” water condition. If thesecond sample also indicates a bacteriological contamination, themanagement of the distribution section has to be informed immediatelyabout the results of the tests.
After the corrective activities have been taken by the distributionsection, again a water sample has to be taken and analysed, followingthe same procedure of reporting, until the test results comply withthe standards.
5. SLM4ARY
Monitoring the clear water quality is necessary to prevent thatdiseases are transmitted to the consumers and/or the water supplysystem is adversely affected. Because the water quality can deterio-rate due to a number of factors, the quality of the water should bechecked regularly, both prior to distribution and after distribution(at the periphery of the system).
A number of water quality parameters must be checked, the most im—portant of which are the bacteriological quality and residual chlo-rine content. *
The number of samples to be taken and the sampling frequency aredetermined by the size of the water supply system.


Module : CLEAR WATERQUALITY CONTROL Code : TPG 125
Edition : 17—04—1985
Annex : VIRWFOILS Page : OlofO4
TITLE CODE
1. Clear water quality control
2. Reduction of the free chlorine
3. Water quality monitoring
TPG 125/V 1
TPG 125/V 2
TPG 125/V 3


-j
0I-z00>-
I-.
0
wI-.
w—I0
Clear water quality control TPG 125/V 1
z0
I-
I—C/)
LUF-C’)>-C/)
IP
£c:~O
Ow~.Cl),i~ LU
1~ £
£


Reduction of the free chlorine TPG 125/V 2
NH~
ORGANICMATTER
FREE
CHLORINE
BACTERIA


Water quality monitoring rpG 125/V 3
AFE BUTIMPROVEMENTRECOMMENDED


45 minutes.
After the ses8ion the trainees will be able to:— identify the value of and the need for a water
quality control script;— identify how to use a water quality script for
process management;— identify how to anticipate deviation in clear
water chlorine content and bacteriologicalcount;identify how the process of reporting isi~pleaented.
— Director;— Head of Section Production;- Head of Sub—section Water Treat.ent;— Head of Section Distribution;— Head of Sub—section Distribution Connections;— Head of Section Planning & Supervisions;— Head of Sub—section Laboratory.
— Viewfoils : TPG 135/V 1—2;— Handout TPG 135/H 1.
Water quality monitoring/information routing/attention range/action range/data handling/labo-ratory journal/performance reports/residualchlorine/bacteriological tests.
~I4
DEPARTMENT O~F PU~BLIC WORKS -
DIRECTORATE GENERAL CIPTA KARVA
______ DIRECTORATE OF WATER SUPPLY
:~
MDPPDHVTGI
IWACO
Module : WA?Kfl QUALITY CONTROL -
1:NrO~4ATIONROUTING -
TREATMENTPROCESSES
Code : TPG 135
Edition : 14—03—1985
Section 1 : I NT 0 EM AT I 0 N S H E B T Page : 01 of 01/11
Duration
Training’ objectives
Trainee
Training aids
Special features
Keywords
- --
- -.
--
—I ~ ----=-~ -~ —


Module : WATERQUALITY CONTROL- - INFO1~4ATION ROUTING —
TREA’flIENT PROCESSES
Code : TPG 135
Edition : 14—03—1985
Section2 : SESSION NOTES Page : OlofO4
1. Introduction
— For implementing water quality control, anunderstanding of the treatment processesis required.One should know:• which parameters provide basic
in format ion;which parameters influence theefficiency of the process.
— For each treatment plant a script has tobe available indicating how to act undercertain circumstances to ensure acontinuous and proper process operation.
2. Methodology
(dosing rate,
Use whiteboard
Show V 1
Explain using V 1
— First, one has to determine the acceptablevalues of the water quality parameters forthe effluent of the separate units.
— Three ranges of concentrations arepossible:
the normal concentration range;the concentration range wherebyattention is necessary;the concentration range whereby directaction is necessary. -
— Explain the methodology for the parameters“turbidity”:
for raw water; action if NTU > 150;attention if NTU > 50;for clarified water; action if NTU > 9,attention if NTU > 6;for filtered water; action if NTU > 2,attention if NTU > 1;for clear water; action if NTU > 2,attention if NTU > 1.
— Direct action (when the parameters is inthe action range) involves the following:
performing the jar test and adjustingthe alum dosing rate;
• checking of the processmixing, stirring);-backwashing or filter bed inspection;


Module : WATERQUALITY CONTROLIN1’O~4ATION ROUTING -
TREATMENTPROCESSES
Code : TPG 135
Edition : 14—03—1985
Section 2 : S B S S I 0 N N 0 T B S Page : 02 of 04
• inspection of the reservoir (onsediments, etc.)
3. Data handling
— The Head of Laboratory should enter allinformation related to water quality con-trol in the laboratory journal.
— The regular reports on water quality andevaluation are summarized in monthly,quarterly and year1y~performance reportsand sent to:• the Management of the Waterworks;• the Head of the Section Production;• the Head of the Sub—section Water Treat-
ment
4. Special procedure8
Chlorine
— The free chlorine content of clear water Show V 2has to be 0.2 — 0.5 mg/i.
— If the chlorine content is outside therange of 0.2 — 0.5 mg/i the following mustbe checked:
dosing rate; -
• solution strength;chlorine demand of the clear water.
— The results of all checking and controlprocedures are reported and sent to theHead of Sub—section Water Treatment; acopy is kept on file.

V

Module : WATER QUALITY CONTROLINFO~4ATIONROUTING —
TREATMENTPROCESSES
Code : TPG 135
Edition : 14—03—1985
Section2: SESSION NOTES Page : 03of04
5. Bacteriological water quality
— Normally micro organisms should be absentfrom clear water.
— The results of the test will be either ofthe following:
the test complies with the standard anda report is sent to the Head of Sub-section Water Treatment;the test exceeds the standard : anothertest must be performed to confirm thefirst one, whereafter tbe Heads of Sec-tions Production and Distribution mustbe informed.
— If the test is positive, an action planmust be set up by the Heads of the SectionProduction and Distribution, comprising:• a check of free chlorine content;• sampling of water in the distribution
network to identify whether water conta-mination has already spread to otherareas;
— The following measuresmust be taken:adjustment of the chlorine dosing if theresidual chlorine content is too low;
• flushing and disinfection of the distri-bution systems if the contamination hasspread.
— The results of all checking, control andaction procedures are reported and sent tothe Heads of the Sections Production andDistribution; one copy is kept on file.
6. Monthly, quarterly and annual performancereports
— The reports on water quality control are Use whiteboardregularly summarizedand issued as:• monthly;• quarterly and;• annual performance reports.


Module : WATER QUALITY CONTROLINFO~4ATI0N ROUTING —
TREATMENTPROCESSES
Code : TPG 135
Edition : 14—03—1985
Section2: SESSION NOTES Page : 04of04
— The reports should cover:volume of water treated;volume of water distributed;
• consumption of chemicals;physical and chemical analyses, shown asaverages, with maxima and minima indi-cated;
• bacteriological asaly~es, shown asaverages, with maxima and minima indi-cated;comparison of the data, with comments;
• special actions taken for operation ordistribution.
— These reports are sent to:• the Head of Section Production;• the Management of the Waterworks Enter—
prise.
Use whiteboard
— The Head ofresponsiblehandling of
the Sub—section Laboratory isfor all reports and the
information.


Module : WATERQUALITY CONTROLINFO~4ATION ROUTING -
TREATMENT PROCESSES
Code : TPG 135
Edition : 14—03—1985
Section3: TRAINING AIDS Page : OlofOl
Quality control TPG 135/V 1flow chart
jjjE:I.
Chlorine control TPG 135/V 2
~LM
Water quality control TPG 135/H 1information routing —
treatment processes


1OEPARTMENT OF PUBLIC WORKS MDPP
‘44 1 DIRECTORATEGENERAL CIPTA KARVAI DIRECTORATE OF WATER SUPPLY IWACO
Module : WATER QUALITY CONTROLINFOII4ATION ROUTING —
TREATMENT PROCESSES
Code : TPG 135
Edition : 14—03—1985
Section 4 : H A N D 0 U T Page : 01 of 05
1. INTRODUCTION
Water quality control for water treatment processes means monitoringthe performance of the processes. In this respect it must be kept inmind that in a sequence of processes the malfunctioning of one of theprocesses influences the other.The procedure of water quality monitoring merely identifies where thereal problems are.
To implement water quality monitoring, an understanding of the treat-ment processes is required. One should know which parameters providethe basic information and which parameters and circumstancesinfluence the efficiency of processes.
~pZ~c~~ach_tr atmentascrlpt has to be availab le~ndicatinghow to act under certain circumstances to ensure a continuous andP~22_2r22P~P2p.
A water quality monitoring script for a surface water treatment plantis demonstrated in this section. The treatment comprises coagulation,flocculation, sedimentation, filtration and disinfection. Specialattention will be paid to three water quality parameters, namely:turbidity, residual chlorine and bacteriological quality.
2. METHODOLOGY
The first step is to determine for each of the parameters the accept-
able concentrations in the effluent of the separate treatment units.
For each parameter three concentration ranges are given:
— The normal concentrations range;— The concentration range whereby increased attention should be paid
to process control;— The concentration range whereby direct action has to be taken.
For turbidity the following script can be developed to demonstratethe methodology.
R~water
The normal turbidity range is : 10 — 50 NTU.The attention range is 50 — 150 NTIJ. If the raw water turbidityfluctuates in this range the alum dosing has to be adjusted regularlyaccording to the results of the jar test.


Module WATER QUALITY CONTROLINFOI~4ATION ROUTING —
TREATMENT PROCESSES
Code : TPG 135
Edition : 14—03—1985
Section4: HANDOUT Page 02of05
The action range is reached when the turbidity is greater than 150NTU. The jar test should be performed more times a day and the alumdosing should be adjusted. Becausealum added to the water will lowerthe pH, the lime or soda ash dosing should be regulated in such a waythat the optimum pH is reached.
Clarified water -
The normal turbidity range is 2—6 NTU. The attention range is 6—9NTU. In that case it can be expected that some minor process irregu-larities have occurred, such as a change in raw water conditions, orincorrect dosing of alum. It is possible that a more frequent sludgedraining of the sedimentation tank is required.Attention should be given to process operation and checks have to becarried out.Action must be taken when the turbidity exceeds 9 NTU. Problems willnow certainly arise at the subsequent step, the filtration. Filterswill clog rapidly, and it is to be expected that the turbidity of thefilter effluent will not meet the drinking water standards anymore.Immediate action has to be taken, 8uch as checking the dosing rate,determining new dosing rates with the jar test and checking theprocess itself.
Filtered water
The normal turbidity range is lower than 1 NTU. The attention rangeis 1—2 NTU.An effluent quality up to 2 NTU is acceptable, but not preferable. Ifeffluent turbidity is in this range, attention should be given toprocess operation. First the filter influent quality (clarifiedwater) must be checked; if its turbidity is too high, the procedureas described for “clarified water” has to be followed. If the clari-fied water quality is not deviating from the normal values the reasonfor the increased turbidity of the filtered water is to be sought atthe filters; inspection of operation procedures and filter conditionis required.
The action range is reached when the turbidity exceeds 2 NTU.The water produced does not comply with the standards. Immediateactions have to be taken. If the influent quality is according to thespecifications and a backwashing process does not restore theeffluent quality, a filter bed inspection is required.
The Heads of the Section Production and Sub-section Water Treatmentshould be informed that the filter that causes the high effluentturbidity has to be taken out of operation for direct repair ormaintenance.


Module : WATER QUALITY CONTROLINFOI~4ATI0N ROUTING —
TREATMENT PROCESSES
Code : TPG 135
Edition : 14—03—1985
Section 4 : H A N D 0 U T Page : 03 of 05
Clear water
The normal range of the turbidity is lower than 1 NTU; the attentionrange 1—2 NTU.If the turbidity of the clear water is above 1 NTU, the effluentturbidity of the filters has to be checked. If these are according tothe specifications, the reason for an increased turbidity level mustbe found at the reservoir.The action range is reached when the turbidity exceeds 2 NTU.In fact the same procedures as described above can be applied. How-ever, the difference is that when the water quality is in the actionrange, action has to be taken at once.
3. DATA HANDLING
The Head of Sub—section Laboratory should enter all informationobtained on water quality control in the laboratory journal.The information is stored in the files, and a copy is sent to theresponsible manager/operator/analyst of the water treatment plantaccording to the following scheme.
Normal processperformance results and circumstancesare reported tothe Heads of the Section Production and of the Sub—section WaterTreatment. Parameters classified in the “attention” range are alsoreported to them. On the basis of the report the Head of the Sub-section Water Treatment will prepare a plan for inspection, main-tenance or repairs as well as a time schedule for these.Circumstancesclassified in the “action” range have to be reported tothe Head of the Sub—section Water Treatment, while at the same timeservices have to be provided to solve the trouble.
The regular reports on water quality and its evaluation are summa-rized into monthly or quarterly and annual performance reports andsent to the management of the water works and the Heads of theSection Production and of the Sub—sectionWater Treatment.
4. SPECIAL PROCEDURES
Chlorine
The procedure for residual chlorine monitoring is much simpler, sinceit only involves one treatment step. First the clear water is checkedon the presence of chlorine, which has to amount to 0.2 — 0.5 mg/l.


Module : WATER QUALITY CONTROLINFOI~4ATION ROUTING —
TREATMENT PROCESSES
Code : TPG 135
Edition : 14—03—1985
Section4: HANDOUT Page : 04of05
If this value is found, the report comments “normal” and is put onfile and sent to the Head of the Sub—section Water Treatment. Thechlorine demand test is executed when the residual chlorine concen-tration is not in the range of 0.2 — 0.5 mg/i.The water quality report serves as a reminder that the chlorinecontent must be adjusted. If the chlorine concentration is outsidethe range levels the dosing rate has to be checked, as well as thestrength of the chlo~ine solution and the chlorine demand of theclear water. If the chlorine demand of the water is too high, theeffluent turbidity as well as the organic matter content have to bechecked. At the same time the clear water storage reservoir ischecked upon accumulation with suspended and settled solids.The results of the checking procedure are written down in the waterquality control report and sent to the head of plant operation. Acopy is kept in archive.
Bacteriological water quality control
The final procedure to be discussed is the monitoring ofteriological condition of the clear water. Under normaloperations, micro—organisms should be absent from the clearTheir presence in water presents a potential health riskconsumer.
test.
Human health must be protected. If theadjustment of the chlorine dosing has toIf the contamination has already spreada programme of flushing and disinfection
the bac—process
water.to the
whether
chlorine content is too low,be carried out immediately.into the distribution systemhas to be considered.
The exceedingactions takencontrol reportDistribution,
If the results of the tests do comply with the standards, the resultsare only reported to the Head of the Sub—section Water Treatment, aswas mentioned earlier for the physical parameters. If the standardsare exceeded a resanipling has to be carried out to confirm the first
I~ the tests again show that the standards are exceeded, the Beads ofthe Sections Production and Distribution are warned immediately, todiscuss and implement a plan of action.
This plan comprises:— Checking of the residual chlorine content.— Sampling of water in the distribution network to identify
water contamination has already spread.
of the bacteriological standards, as well as theand their results are reported in the water qualityand sent to the Heads of the Sections Production and
and of the Sub Section Water Treatment. A copy isfiled.


Module : WATERQUALITY CONTROLINFOE~4ATI0N ROUTING -
TREANENTPROCESSES
Code : TPG 135
Edition : 14—03—1985
Section4: HANDOUT Page : 05of05
5. MONTHLY, QUARTERLYAND ANNUAL PERFOI~4ANCEREPORTS
The reports on water quality monitoring are reguarly summarized andissued as monthly, quarterly and annual performance reports. They aresent to the management of the waterworks enterprise and to the Headsof the Section Production and of the Sub—section Water Treatment.The reports should deal with
— Volume of water treatec~ per month, related to the full plant capa—
indicated as monthly
The Head of the Sub—section Laboratory is responsible for thecontents (lay—out) of all above mentioned reports as well as for thedaily reports and the handling of information contained therein.
6. S~H4ARY
For implementing a water quality control programme, an understandingof the treatment processe is required. For each of these processes anumber of relevant water quality parameters must be monitored andreported upon.The obtained information and any action taken on the basis thereofare laid down in (daily,) monthly, quarterly and annual performancereports.
In addition to routine reporting, information on the water qualityfailing to meet the relevant standards must be given to the Heads ofthe Section Production and of the Sub—section Water Treatment. Incase the bacteriological quality of the distributed water does notmeet the standrads, also the Head of the Section Distribution must beinformed.The Head of the Sub—section Laboratory is reponsible for the compila-tion of the water quality data arid the reporting thereon.
city. -
— Volume of water distributed per month.— Consumption of chemicals per month.— Results of physical/chemical analyses,
averages, with minimum and maximum values.— Results of bacteriological analyses, indicated as monthly averages
with minimum and maximum values indicated, both for productionwater and for distributed water.
— Comparison with and comments on the compliance with the relevantwater quality standards, of both the produced and distributedwater.
— Special actions undertaken in order to adjust treatment operationand improve the quality of water in the distribution network.


Module : WATERQUALITY CONTROLINFO~~4ATION ROUTING -
TREATMENTPROCESSES
Code : TPG 135
Edition : 14—03—1985
Annex : V I E W F 0 I L S Page : 01 of 03
TITLE CODE
1. Quality control flow chart
2. Chlorine control
TPG 135/V 1
TPG 135/V 2


Quality control flow chart TPG 135/V I


Chlorine control TP~135/V 2
~1
NO


4~ t
rIJDEPARTMENT OF PUBLIC WORKS
DIRECTORATE GENERAL CIPTA KARVA
______ DIRECTORATE OF WATER SUPPLY
:it’’— ~ - - -
—__ —
MDPPDHVTG I
IWACO
Module WATER TREAV4~Nt - -
-
- ----t- —~:---- ---
Code : TIN] 400
Edition : 14—03—1985
Section 1: INFORMATI0N~ SHEET Page : 01 of 01/16
Duration
Training objectives
Trainee selection
Training aids
SpecialS features
Keywordr
90 minutes.
After this session the trainees will be able to:— recite the basic principles of water treat-
ment;— recite the usual unit operations in water
treatment;— define a complete water treatment scheme for
the purification of ground water and surfacewater.
— All employees of water enterprise.
— Viewfoils : TEN] 400/V 1—8;— Handout TIN] 400/11 1.
Ground water/surface water/unit treatment opera-tions/water treatment schemes.


Module : WATER TREATMENT Code : TPG 400
Edition : 14—03—1985
Section2: SESSION NOTES Page : OlofO5
1. Principles
Introduction
— Water treatment is aimed at the conversionof raw water into clean water for humanconsumption or other purposes. The rawwater may be rainwater, groundwater orsurface water.
— Most important in water treatment is theremoval of:• pathogenic organism~
toxic substances.
— Other substances which needto be removedare
suspended matter causing turbidity;iron and manganese, for the bitter tastethey give to water, and the stains theycause on laundry;excessive C02 as it corrodes concreteand metal parts;obnoxious gases, causing bad taste andodour.
Type of impurities
— Impurities occur in three, progressively Show V 1finer, modifications:
suspended;colloidal;dissolved.
A major difference between the threemodifications is the size of the suspendedcolloidal and dissolved particles, i.e.suspended > colloidal > dissolved.
— Suspended matter isnormally settleable when water is atrest;
• found in the water due to surface run-off (erosion) and sediment transport inwaterways.


Module : WATERTREATMENT Code : TPG 400
Edition : 14—03—1985
Section2 : SESSION NOTES Page : 02of05
— Colloids have the following characteris-tics:• the particles are not visible by the
naked eye;colloids cause turbidity and colour;
• they remain in suspension when the wateris at rest.
— Dissolved solids may:cause colour, but riot turbidity;
• be picked up by the water in the under-ground or during surface run—off;
• cause hardness of water (e.g. calcium,magnesium);
• give water an undesirable taste (e.g.iron, manganese).
— Dissolved gases may have the followingeffects:
excessive CO2 corrodes concrete andmetal parts;
• a low oxygen content causes an un-pleasant taste and/or smell.
Water sources
— Water sources can be divided into:• groundwater;• surface water.
— In general, groundwater has the following Show V 2characteristics:
bacteriologically safe;no turbidity;a high CO2 content;a low oxygen content;
• a high content of various dissolvedsolids.
— Surface water can be taken from:• rivers;
streams;lakes;irrigation canals.


— In general, surface water hasing characteristics:• bacteriologically polluted;• a high turbidity;.• presence of organic matter;• a low content of various
solids.
— Water treatment processes may be aimed at: Use whiteboardaeration/degasatior~ ~
• coagulation/flocculation;• sedimentation;• slow sand filtration;
rapid sand filtration;• disinfection.
— The aeration/degasation process is aimed Show V 3at increase of oxygen and/or reduction ofdissolved gases (e.g. CO2) and character-ized by an intimate contact betweenwaterand air.
— The coagulation and flocculation process Show V 4is aimed at the removal of colloids byagglomeration and characterized by:• addition of chemicals;• rapid mixing;
gentle stirring.
— The sedimentation process is aimed at: Show V 5removal of settleable suspended solidsand characterized by;low velocity of water;
• sludge removal.
— The slow sand filtration process is aimed Show V 6at removal of bacterioligical contamina-tion and minor quantities of suspended!colloidal matter. It is characterized by:• schmutzdecke;
a bed of fine sand;removal of suspendedmatter in top sec-tion of filter medium;
• removal of micro—organisms in schinutz—decke and filter medium;
Module : WATERTREATMENT Code : TPG 400
Edition : 14—03—1985
Section2: SESSION NOTES Page : 03of05
Show V 2the follow—
dissolved
2. Water purification


• filter cleaning by removal of the toplayer of filter.
— The rapid sand filtration process Is aimedat the removal of suspendedmatter. It ischaracterized by: —
a bed of’ coarser sand;• higher filtration rate (25 — 100 times)
than in the slow sand filtration pro-cess;
• retaining suspended matter deep infilter bed;
• cleaning by backwas~iing;
— The disinfection process is aimed at thedestruction of pathogenic micro-organismsand characterizedby:• addition of chemicals;• contact period.
3. Water treatment sch’~efi
— Groundwater treatment — for spring:• normally clear water;
containing aggressive CO2;• conditioning for the removal of CO~ by
aeration or neutralization;• disinfection to prevent bacterial growth
in the distribution system;
— Groundwater treatment — for shallow well!borehole:• high C02 content;• high iron and manganese content;• aeration to remove C02 and to oxidize Fe
(II);• rapid filtration to retain insoluble Fe
(III) precipitates;• disinfection to prevent bacterial growth
in the distribution system.
— Surface water treatment:• high turbidity;
polluted with micro-organisms.• sedimentation followed by slow sand
filtration when suspended matters arepresent and turbidity relatively low;
Module : WATERTREATMENT - -- -
.
Code : TPG 400
Edition : 14—03—1985
Section2: SESSION NOTES - Page : 04of05
Show V 6
Use whiteboard
Show V 7
Show V 7
Show V 8

*

• coagulation/flocculation, sedimentationand rapid sand filtration when colloidsare present and turbidity relativelyhigh; -
• disinfection for the inactivation ofbacteria
Module : WATERTREATMENT
- -
Code : TPG 400
Edition : 14—03—1985
Section2: SESSION NOTES Page : 05of05
4. Su~ary Give H 1


Module : WATER TREATMENT Code : TPG 400
Edition : 14—03—1985
Section3 : TRAINING AIDS Page : OlofO2
Types of impurities TPG 400/V 1in water
TYPES OF IMPURITIES IN WATER
- Suspended matter
— Colloidal matter
- Dissolved matter- solids• gases
Sizes of matter / particles :
SUSPENDED) COLLOIDAL > DISSOLVED
•
Water sources TPG 400/V 2
G~c~1jNDWA~:
BaCteriologlcaliy safeNo tirbidltyHigh Co
1 Content
Low 0, contentHigh content of dissolved solids
SURFACEWATER:
B3Ct~rlOIOglCOlly pollutedHigh turbldty~ matt.r (alga., faecss)
Low conhint of dlssolv.d solids
The aeration/degasa— TPG 400/V 3tion process
RAWWATER
AERATION
~
AERATED/DEGASIFIEDWATER
The coagulation and TPG 400/V 4flocculation process
c——cs,.
~TI•-~—~
•••••.~x1xI~C,st•LST,O. I•,•_ s~ •LSCCVLA?IU
%SCCI~sTlIUfl.ylSe
The sedimentation TPG 400/V 5process
~~
“U...
Sand filtration TPG 400/V 6
I--~----~-‘-----1~L_..~-J LJL I ~ I
‘fly’.
•-~~
•5?.•


Module : WATERTREATMENT Code : TPG 400
Edition : 14—03—1985
Section3: TRAINING AIDS Page : 02of02
Ground water TPG 400/V 7treatment
Ground water treatment
1. SPRINGS
es__sr.. — L,~•.,u..•..I__a...
2. WELLS
.a flTeP •—.~_•‘~~‘~°—I—l•~,~j4...s.e.cv.o~j..ci... nfl.
I.
Surface water TPG 400/V 8treatment
Surface watef trsatm.nt
I 4 WflVfl ~ -
y JCO ~ c•.s.“°“~°~ U~’’!..t~~~1!ro~j —syl.
Water treatment TPG 400/H 1


1 DEPARTMENT OF PUBLIC WORKS MDPP
r4.4DIRECTORATEGENERAL CIPTA KARYA
______ DIRECTORATE OF WATER SUPPLY IWACO
Module : WATER TREATMENT Code : TPG 400
Edition : 14—03—1985
Section 4 : H A N D 0 U T Page : 01 of 08
1. PRINCIPLES
Introduction
The purpose of water treatment is to convert “raw water”, taken froma ground or surface source, into “product” water suitable for domes-tic use (drinking water) or other purposes. Most important is theremoval of pathogenic organisms and toxic substances causing healthhazards. Other substances may also need to be removed or at leastconsiderably reduced. These include: suspended matter causing turbi-dity, iron and manganese compounds imparting a bitter taste or stain-ing laundry, and excessive carbon dioxide corroding concrete andmetal parts. For small community water supply, other water qualitycharacteristics such as hardness, total dissolved solids and organiccontent would generally be less important. They should be reduced toacceptable levels but the extent to which the water is treated willusually be limited.
Type of impurities
Absolutely pure water is rarely found in nature. Impurities con-tained by water occur in three progressively finer states: suspended,colloidal and dissolved matter. Different methods of treatment arerequired for their removal or reduction to acceptable limits.
— ~~p~D~ed_matter
Apart from the probability that a river might be carrying floatingdebris, running water has the capacity to pick up and transportsolid particles of higher density than water : the higher thevelocity, the bigger the particles picked up. Rivers in floodconditions (e.g. during banjirs) are therefore normally at theirmost turbid because of the increased velocity.
— Colloids
The finer particles, called colloids, may not be visible to thenaked eye, but in their finest forms they impart turbidity andcolour to the the water. Colloids remain in suspension even whenthe water is virtually at rest.
— Dissolved solids
In its passage over or through the ground, water also picks up suchsoluble substances as calcium, magnesium, sodium, potassium, ironand manganese. In their soluble forms, these are normally combinedwith bicarbonates, suiphates, chlorides, nitrates and other salts.


Module : WATERTRKAI?4ENT Code : TPG 400
Edition : 14—03—1985
Section 4 : H A N D 0 U T Page : 02 of 08
Bicarbonates, suiphates and chlorides of calcium and magnesium arecommonly found in water and cause hardness. Hardness forms in-soluble precipitates with soap. It also causes boiler scale.Iron and manganese, if present in any concentration at all, imparttaste, and stain laundry during washing.
— Dissolved g~ses
Gases may be also found adsorbed in water, particularly carbondioxide, oxygen, nitrogen and ammonia.A high COz content causes corrosiveness towards metals and concretestructures. A low oxygen content will cause the water to taste andsmell unpleasantly.
Water sources
Generally spoken water sources can be divided into groundwater andsurface water.
— Groundwater
Groundwater will normally be free from turbidity and pathogenicorganisms. When it originates from a clean sand aquifer, otherhazardous or objectionable substances will also be absent. Inthese cases, a direct use of the water as drinking water may bepermitted without any treatment. When the water comes from anaquifer containing organic matter, however, oxygen will have beenconsumed and the carbon dioxide content of the water is likely tobe high. The water will then be corrosive. In cases where theamount of organic matter in the aquifer is high, the oxygen may becompletely depleted. The water containing no oxygen (anaerobicwater) will dissolve iron, manganese and heavy metals from theunderground. Through treatment these substances can be removed.
— Surface water
Surface water can be taken from streams, rivers, lakes or irriga-tion canals. Water in such surface sources originates partly fromgroundwater outflows and partly from rainwater that has flowed overthe ground to the receiving bodies of surface water. The ground-water outflows will bring dissolved solids into the surface water.The surface run—off is the main contributor of turbidity andorganic Latter, as well as pathogenic organisms present in surfacewater. In surface water, the dissolved mineral particles willremain unchanged but the organic impurities are degraded throughchemical and microbiological processes. Sedimentation in impoundedor slow—flowing surface water results in the removal of suspendedsolids. Pathogenic organisms will die off due to lack of suitable


Module : WATER TREANENT Code : TPG 400
Edition : 14—03—1985
Section 4 : H A N D 0 U T Page : 03 of 08
nutrients. However, new contamination of the surface water islikely to take place as a result of waste influents and growth ofalgae, which may serve as nutrients for micro—organisms.
2. WATERPURIFICATION~1
A treatment plant may copsist of several processes,such as aeration,coagulation, flocculation, sedimentation, filtration and disinfec—tion. Each of these processes is intended to perform one mainfunction although it may enhanceother treatment processes. Theimpurities are removed in order of size : the bigger ones (suspendedmatter) are eliminated first. Not all water contains all the impuri-ties and therefore not every type of water requires all the treatmentprocesses.The impurities are largely removed by the following processes.
Aeration
Aeration is the treatment process wherebywater is brought intointimate contact with air for the purpose of:
a. increasing the oxygen content;b. reducing the carbon dioxide content (removal of free and
inparticular aggressive C02), andc. removing hydrogen sulfide, methane and various volatile organic
compoundsresponsible for taste and odour.
The treatment processes mentioned under (a) and (c) are alwaysadvisable in the production of good drinking water. Reducing thecarbon dioxide content is of special importance for the protection ofpipelines and appurtenancesagainst corrosion if the water containsaggressive C02.The oxygen transferred to the water during aeration may be used tooxidize dissolved material such as iron and manganase so as to enabletheir removal during subsequent filtration.
Coagulation and flocculation
Coagulation and flocculation are steps in a water treatment processwhereby finely divided suspended and colloidal matter in the water ismade to agglomerate and form flocs by the addition of chemicals,normally alum and soda ash. This enables their removal by sedimenta-tion and/or filtration. Colloidal particles (colloids) are midway insize between dissolved solids and suspendedmatter.


Module WATERTREAThENT Code : TPG 400
Edition : 14—03—1985
Section 4 H A N D 0 U T Page : 04 of 08
The substances that frequently are to be removed by coagulation andflocculation are those that cause turbidity and colour. Surfacewaters in tropical countries are often turbid and contain colouringmaterial.Both turbidity and colour are mostly present as colloidal particles.
Sedimentation
Sedimentation is the seftling and removal of suspended particles thattakes place when water stands still in a basin, or flows slowlythrough it. Due to the low velocity of flow, turbulence willgenerally be absent or negligible, and particles having a massdensity (specific weight) higher than water will be allowed tosettle. These particles will ultimately be deposited on the bottomof the tank, forming a sludge layer. The water reaching the tankoutlet will be in a clarified condition.
Slow sand filtration
Filtration is the process whereby water is purified by passing itthrough a porous material (or “medium”). In slow sand filtration abed of fine sand with grain sizes of 0.15 — 0.35 mm is used, throughwhich the water slowly percolates downwards. Due to the fine grainsize, the pores of the filter bed are small. The suspended matterpresent in the raw water is largely retained in the upper 0.5—2 cm ofthe filter bed. This allows the filter to be cleaned by scrapingaway the top layer of sand. The top section of the filter bed of aslow sand filter contains the so—called “Schmutzdecke”, which con—sj.sts of a very broad range of micro—biological species. These micro-biological species are responsible for the remarkable improvement ofthe physical, chemical and bacteriological quality of water treatedby slow sand filtration. As low rates of filtration are used (0.1—0.4rn/hour = 2—10 rn/day), the interval between two successive filtercleanings will be fairly long, usually several months. The filtercleaning operation need not take wore than one day, but after clean-ing, one or two days more are required for the filter bed to becomefully effective again (reripening of the Schmutzdecke).
Rapid sand filtration
As explained in the preceding paragraph on slow sand filters, filtra-tion is the process whereby water is purified by passing it through aporous material (or “medium”). For rapid filtration, sand is common-ly used as the filter medium, but the process is quite different fromslow sand filtration. This is so because much coarser sand is used,with an effective grain size in the range of 0.6—1.2 mm, and the


Module : WATER TREA’IMENT Code : TPG 400
Edition : 14—03—1985
Section 4 : H A N D 0 U T Page : 05 of 08
filtration rate is much higher, generally between 5 arid 15 m/hour(120—360 ni/day). Due to the coarse sand used, the pores of thefilter bed will be relatively large and the impurities contained inthe raw water will penetrate deep into the filter bed. Thus thecapacity of the filter bed to store deposited impurities is much moreeffectively utilized and even very turbid river water can be treatedwith rapid filtration. For cleaning a rapid filter bed, it is notsufficient to scrape off the top layer. Cleaning of rapid filters iseffectuated by backwash~.ng. This is directing a high—rate flow ofwater backwards through the filter bedw)Iereby this expands and isscoured. The backwash water carries the depositedmaterial out ofthe filter. The cleaning of a rapid filter can be carried out quick-ly; it need not take more than about half an hour. It shall be doneas frequently as required, normally every 24—48 hours.
Disinfection
The single most important requirement of drinking water is that itshould be free from any micro—organisms that could transmit diseasesto the consumer. Processessuch as storage, sedimentation, coagula-tion and flocculation, slow sand filtration and rapid filtrationreduce the bacterial content of water to varying degrees. However,these processescannot assure that the water they produce is bacte—riologically safe. Final disinfection is needed. In cases where noother methods of treatment are available, disinfection may beresorted to as a single treatment against bacteriological contami-nation of drinking water.
Disinfection of water provides for destruction, or at least completeinactivation, of harmful micro—organisms present in the water. It iscarried out by adding a suitable chemical, such as chlorine, to thewater, usually in the form of kaporit.
SIY44ARY OF WATERPURIFICATION PW)CESSES
Summarizing, the treatment steps required in order to reduce thespecified impurities are presented in the following table.


Module : WATER TREANENT Code : TPG 400
Edition : 14—03—1985
Section4: HANDOUT Page : 06of08
Aera—tion/Dega—sation
Coag./floc—-cula—tion
Sedj-men—tation
Slowfil—tra—tiori
Rapidfil—tra—tion
Dis-in—fec—tion
Turbiditylowhigh x x
X
x
Colour x x x
Taste/odour x
Iron/manganese x x
Aggressive CO2 x
L0w02 X
Bacteria 0 X
Colloids x x x
Suspended solids o x 0 - o
x = essential; o = optional
3. WATERTREATMENT SCH~4ES
For every kind of raw water specific purification processes arerequired to meet the quality standards for safe drinking water. Theyvary from mere disinfection to a very extensive treatment. To acertain extent the type of treatment can be related to the source,although the necessity or the sufficiency of a particular method mustbe studied carefully in each case separately.
Groundwater
-
A spring is normally a source of clean water. It may, however,yield aggr’essive water. Therefore conditioning, by means ofdegasation of C02 (aeration) or addition of a base such as lime,soda ash or caustic soda, is executed before it is distributed.


Module : WATERTREATMENT Code : TPG 400
Edition : 14—03—1985
Section 4 : H A N D 0 U T Page : 07 of 08
Disinfection is excecuted to prevent bacterial growth in the dis-tribution system, and as a safety precaution against recontamina-tion.
RAW ———> CONDITIONING —--—> DISINFECTION —-----> CLEANWATER WATER
- Shalow_we11sLdee~or~holes
A typical layout of a treatment and purification process forgroundwater is given below:
RAW —> AERATION ——-> RAPID SAND -——> DISINFECTION -—-> CLEANWATER FILTRATION WATER
This combination has the following aims. Gasessuch as CO2/Hz areremoved by way of degasation/aerationand this brings oxygen intothe water at the same time. The oxygen can be used for oxidation ofiron, manganese and ammonia. After that the iron, manganeseandammonia can be removed in the sand filter. Disinfection is neededfor killing contageous micro—organisms. If groundwaterdoes notcontain any iron or manganese ammonia the treatment would besimpler. The quality of groundwater at some places is so good, thattreatment is not necessaryat all (except for disinfection).
Surface water
Often surface water has an unacceptable turbidity and iswith pathogenic micro—organisms. Two examples are givensurface water treatment.
2. RAW ——>COAGULATION —> SEDIMENTATION —>
WATER FLOCCULATION
DISINFECTION ——> CLEANWATER
pollutedhere for
RAPID SANI) —>
FILTRATION
The second example is a more advanced system, but, under currentcircumstances, in rural areas often difficult to realize. Then slowsand filtration preceded by presedimentation is a good alternative,if turbidity is not too high. Although disinfection is recommended,
1. RAW —> SEDIMEN———> SLOW SAND —> DISINFEC— ——> CLEAN
WATER TATION FILTRATION TION WATER


Module : WATERTREATMENT Code : TPG 400
Edition : 14—03—1985
Section4: HANDOUT Page : 08of08
often slow sand filtration is the last step under these circumstancesproducing an acceptable quality most of the time, because pathogenicmicro—organisms as well as organic matter are biochemically removed.
4. SIH4ARY
Water treatment is conve~’ting“raw water”,water source, into “product” water, e.g.types of water sourcesnormally typicaldesigned since groundwater often containsiron and manganese content, while surfacegically polluted and has a high turbidity.
from a ground or surfacedrinking water. For both
treatment schemes can beaggressive C02 and a highwater is often bacteriolo—
xxx


Module : WATER TREATMENT Code : TPG 400
Edition : 14—03—1985
Annex : VIEWFOILS Page : OlofO9
TITLE : CODE
1. Types of impurities in water TPG 400/V 1
2. Water sources TPG 400/V 2
3. Aeratiori/degasation process TPG 400/V 3
4. Coagulation/flocculation process TPG 400/V 4
5. Sedimentation process TPG 400/V 5
6. Sand filtration TPG 400/V 6
7. Ground water treatment TPG 400/V 7
8. Surface water treatment TPG 400/V 8


Types of impurities in water TPG 400/V 1
crwI-
(I)wE0.
Li.0Cl)wa.I-.
I..
CD
CD
0CooI I
a)CD
E(0(1)
>OCD~O,C)U) ‘I
Cl)6I
aw>-J0C/)U)a
a5.~1-J00
awazwa-U)
U)
I.
Cl)
Ii)
C~5


Water sources TPG 400/V 2
Cl)
.5U)
a)>.5Cl)U)
-
cDCO—o ~00~
o000
I—i’
Cl)_ 0
U—
0a).0
.0 CD~a)—
a)0= CDU)0 O)U)
U— ~ —a)~a)0 .— — —
0•~j~c~
0caiO..j
a)CDU)
.~0
).2.2a)
4-’
0CD
>1
0z
U.
ccwI—
az0cc
ccwI-
w0LL.ccC/)
. S S • .


ccwI-
cc
aw
waawI-
ccw
Aeration/degasation process TPC 400/V 3
z0z
0
ccw cc
wI-
~-:E
— -a-. ~
-— —


U)-J
C)
w=C-)
z~ 0
<0I.~
trWOW
I-_.j Wu~cn
z0
I-
—I
C-)C-,0-J
Coagulation/flocculation process TPG 400/V 4
z
z‘C
0-JCl)
WI-
z
z‘C
0~
z0I.-
-j
Ii
0C-)


Sedimentation process TPG 400/V 5
Lii
WF-
W
—-jtrLL<F-
00
LiiI-
4<
-JCl)


Sand filtration
0-JU-I-
0
WI-
Lii
LiiI—-j
U-
TPG 400/V 6


Ground water treatment TPG 400/V 7
wECD
a)CD
01~
wI—
zw~1C-)
z0
I—C)wU.zCl)
wI.-
z
w-JC-)
tz0I-C-,wLL.z(1)
Cl)’-
tz0
Ui
4ThUiI-.
C/)
z0.(1)
U
C,)-J-Jw


-J
-t-.
z0I-C)LiiU..zC,)
Izo
U)LL
W-J
o2
,“ C.,
tWI-
Surface water treatment TPG 400/V 8
E4-’CD
4-’
I-
a)CD
a)0CD
‘4-L.
U)


r~4
DEPARTMENT
DIRECTORATE
______ DIRECTORATE
OF PUBLiC WORKS
GENERAL CIPTA KARVA
OF WATER SUPPLY
MDPPDHVTGI
IWACO
Module SETTING OUT
-~
Code : TPC 110
Edition: l5—03—~I985
Section 1 : I N F 0 R M A ~ I 0 N S II ~ E T Page : 01 of 01/08
Duration
Training objectives
Trainee selection
-t
90 minutes.
After the session the trainees will be able to- to set straight lines;— to set angles;— to level trenches.
— Head of Section Distribution;— Head of Subsection Distribution &
House Connections;— Pipelayer;— Pipeline inspector;— Head of Subsection Construction Supervision;— Construction Supervisor.
— Angle boards;-~ Ranging rods;— Chalk;—Measuring tape (20 in);
Sighting boards;— Traveller;— Viewfoils : TPC 110/V 1—2;— Handout : TPC 110/H 1.
Setting out.
Training aids
Special features’--
Keywords• • -.t~:~ --
• -‘- ~-

4-

Module : SETTING OUT Code : TPC 110
Edition : 15—03—1985
Section2 : SESSION NOTES Page : 01 of 02
1. Introduction
— Demonstrateuse ranging rods asfixed points;
— line—in another— ranging rod between
the two fixed pointsand mark with chalkson ground;
— Allow trainees topractice;
— Check by usingstring to checkpoints between thetwo fixed points.
— Demonstrateof angle(fixed andable);
- Show V 1— Allow trainees to
practice;— Demonstrate use of
3—4—5 method ofsetting right angleand 45’angles;
— Allow trainees topractice.
Use whiteboard— It is important to lay water mains on thecorrect line.
—Some joints are flexible while others areinflexible.
— Mains are normally laid in• straight lines;- with angles linking straight lines;
at right angles to straight lines;• at correct depth.
2, Setting atraight lines
— Fixed points are set at beginning and endof the line and lining—in by sight anypoint between.
— Mark line with chalk, lime, etc.
3. Setting angles
— Angles are set using prefabricated 30°,450, 60°, 900 angleboards (or adjustable
angle boards).
— For setting 45° the 3—4—5 ratio(Pythagoras Theorem) is used.
— Also for setting right angles the 3—4—5ratio is used.
the useboards
adjust—


Module : SETTING OUT Code : TPC 110
Edition 15—03—1985
Section 2 : S E S S I 0 N N 0 T E S Page : 02 of 02
4. Trench levelling
— Explain on whiteboard the basictheory of levels
- Show V 2
— Demonstrate use ofsighting boards andallow trainees topractice.
— Explain basic theory of levels.
— Explain use of sighting boards and travel-ler.
5. Summary
— Correct setting out of trenches concernsstraight lines;angles;correct depths.
Give H 1


Module : SETTING OUT Code : TPC 110
Edition : 15—03—1985
Section3: TRAINING AIDS Page : OlofOl
Pythageras theorem TPC 110/V 1
~
b2 . a2+ C2
Trenthing with TPC 110/V 3profiles (a—c)
Setting out TPC 110/H 1


1DEPARTMENT OF PUBLIC WORKS MDPP
rk~I DIRECTORATE GENERAL CIPTA KARYAiDIRECTORATE OF WATER SUPPLY IWACO
Module SETTING OUT Code TPC 110
Edition : 15—03—1985
Section 4 : H A N D 0 U T Page : 01 of 04
1. INTRODUCTION
Water pipes are made straight. Therefore it is essential to lay thepipe in a continuous straight line except where the design calls forbends, junctions (“Tees”) or minor deviations.Some joints are flexible allowing for a 5° angle of deviation at eachjoint. However, generally water mains are laid
in straight lines;• with angles linking straight lines;• at right angles to straight lines;and, very important, at the correct depth.
2. SETTING STRAIGHT LINES
Points should be fixed at the beginning and the end of the line.Various methods can be implementedto line-in between these twopoints. This can be done with a long cord placed on the ground,pulled taut and the line markedor, more commonly, by fixing rangingrods at the beginning and end of the straight line and lining—in athird rod by eye at points in between. These points can then bemarked on the ground using chalk, lime, etc.
3. SETTING ANGLES
Angles are easiest set out using prefabricated angle boards. Theseare normally triangles always with sides of approximately one metrelenght. Two are required, one with internal angles of 22.5°, 67.5°,and 90°, and the other with internal angles of 45°, 90° and 45°.
These can be set on the ground and the angles marked with chalk.As an alternative to fixed angle boards, adjustable angle boards canbe prefabricated.Additionally, 90° angles can be constructed on site using Pythagoras’Theorem. This theorem states that the square of the lenght of thehypotenuse in any right—angled triangle is equal to the sum of thesquaresof the other two sides (See Fig. 1 on next page).


Module : SETTING OUT Code : TPC 110
Edition : 15—03—1985
Section 4 H A N D 0 U T Page : 02 of 04
For most triangles the arithmetic, whilst simple, produces lines withdimensions that are difficult to construct accurately on site.One triangle, however, is relatively straightforwarda right—angled triangle can have a hypotenuseof 5sides lengths of 3 and 4, respectively, which makesconstruct on site a triangle with an internal angle
CHECK : b2a2+c2
SUBSTITUTE : 52 32 + 42
25 = 9 + 16
4. TRENCH LEVELLING
The sighting boards and traveller are normally used for settingtrench bed levels when laying water mains.Two sighting boards are placed across the trench at each end and a“Tee” shaped Traveller used to level in between (see fig. 2 on next
b2 a2 +c2 A
C
BC a
and the other twoit very simple toof 90°
page).

k

Module : SETTING OUT Code : TPC 110
Edition : 15—03—1985
Section 4 : H A N D 0 U T Page : 03 of 04
Figure 2
CORRECTPLANNEDTRENCH
BOTTOM
TRENCH
U 1BOTTOM
OF
— — — — — — — — — —— — — — —


Module : SETTING OUT Code : TPC 110
Edition : 15—03—1985
Sect ion 4 H A N D 0 U T Page : 04 of 04
5. StJ44ARY
It is important to set out the line of trenches in a correct manner,by setting outa. straight linesb. angles,and also to maintain the correct depth.
xxx


Module : SETTING OUT Code : TPC 110
Edition : 15—03—1985
Annex : V I E W F 0 I L S Page : 01 of 03
TITLE CODE
1. Pythagoras’ theorem
2. Trenching with profiles
TPC 110/V 1
TPC 110/V 2


Pythagoras’ theorem TPC 110/V 1
A
C
B
b
C a
b2:a2+


Trenching with profiles TPC 110/V 2
LJ
TRENCHBOTTOM
LJ
TOP OFPIPE
CORRECTBOTTOM PLANNED TRENCHTOO HIGH BOTTOM
-Ø
— — —— —
::~—‘.4
—
— —
— —

¼

~LDEPARTMENT
DIRECTORATE
_______ DIRECTORATE
~
MDPPDHVTGI
IWACO
I — — —~
OF PUBLIC WORKS
GENERAL CIPTA KARYA
OF WATER SUPPLY
Module : EXCAVATION, BEDDINGAND BACKFILLING
Code : TPC 120
Edition 15—03—1985
Section 1 : I NF 0 RM AT I ON SHE E T Page : 01 of 01/li
Duration
Training objectives
-1-
Trainee th~1e~tion
Training aids
Special features
Keywords
45 minutes.
After the session the trainees will be able to:— list the 3 important steps in laying under-
ground pipes;— identify the tools to be used in excavation,
bedding and backfiiling;— state the safety practices required during
excavation, bedding and backfilling.
—Head of Technical Department;— Head of Section Distribution;— Head of Sub—section Distribution & Connec—
tions;- Pipelayer;— Pipeline Inspector;— Head of Sub—sectionSupervision;— Construction Supervisor.
— Viewfoils : TPC 120/V 1—6;— Handout : TPC 120/H 1.
Excavation/bedding/backfill ing.
‘a-
~i~i-~--


Module : EXCAVATION, BEDDINGAND BACKFILLING
Code : TPC 120
Edition : 15—03—1985
Section2 : SESSION NOTES Page : 01 of 02
1. Introduction
— To ensure good pipelaying undergroundthree important steps must be undertakento ensure that the pipe is undamaged andprotected:a. excavation;b. bedding;c. backfilling.
2. Excavation
— Important items for an excavation:alignment set out correctly, including“Tees” etc.;depth;levels;correct tools;safety;trench supports.
3. Bedding
— Issues in bedding are:depth of bedding;bedding material;provision for joints;tools.
4. lackfilling
— Explain issues bedding are:type of backfill;
• compaction by layers;- . compact ionn around pipe;reinstatement.
Use whiteboard
Show V 1—2
Show H 3—4
Show V 5—6


Module : EXCAVATION, BEDDINGAND BACKFILLING
Code : TPC 120
Edition : 15—03—1985
Section2: SESSION NOTES Page : 02of02
5. Safety
— Safety measuresshould concern:• obstruction of traffic flow;• barriers;
pedestrians;• workers in trench;• tools.
6. Suary Give H 1.


EXCAVATION, BEDDINGAND BACKFILLING
Code : TPC 120
Edition : 15—03—1985
Section3: TRAINING AIDS Page : 01 of.02
Excavation require—ments
•TPC 120/V 1 Timber trench support TPC 120/V 2
L11. I~ie —
PS Teat. Pt
— Ta’ PeaiF S~ie
to —
~:.
IA~ 1’~C.. i4~LL~ T.aPO�I *.a,~? ie~ Ofl~
Depression in bedding TDC 200/V 3 Pipe bedding TPC 120/V 4(a—c)
~T ~C ~. Ua; ia.e went
lt~ iii— r — a ,Fe?i
II• TIC li..JLWCaS, IT eli L.a SitO flCflLTh pta
.p.a, a’ pta li.OOs TICPfl Vea Us tMIT PS S.Ccam.
Backfilling by layers
•ACKFILLING Y LAYE!S
TPC 120/V 5 Backfilling
• — — Clv Ifl nfl~—i—I’.
LIC —.
• ._t — — Ii Pta PC C PC
TPC 120/V 6
• Tie — C1C~~.fl —,e•_ .as at Sn ~i
UI •w—n.Lat a’ — 1.1% Cli —
Ita — .,a 1 eli
U• SSa—liL a’ PC li~
ir
aaa.t UO1MkVFe
ieaaTI STStCT.a


Module EXCAVATION, BEDDINGAND BACKFILLING
Code : TPC 120
Edition : 15—03—1985
Section3: TRAINING AIDS Page : 02of02
Excavation, bedding TPC 120/H 1and backfilling


DEPARTMENTDIRECTORATE
DIRECTORATE
OF PUBLIC WORKS
GENERAL CIPTA KARYA
OF WATER SUPPLY
1. INTRODUCTION
When laying underground water mains there are three very importantsteps which must be undertaken to ensure that the pipe is laid in anundamaged and protected way. Badly laid pipes lead to many compli-cated maintenance problems in future years.The three steps area. excavation;b. bedding; -
c. backfilling.
2. EXCAVATION
Before starting excavations for main laying, the pipe alignment must-be correctly set out according to the design drawings.All bends, “Tees”, valves or special fitments should be checked tomake sure that their positioning does not conflict with any permanentfeature already installed.
SLOPES OF THE TRENCHSHOULD BE SUCH THATSLIDES WILL NOT OCCUR
LEVEL EXCAVATION HASTO BE EQUAL TO THELEVEL OF THE UNDERSIDEOF THE FOUNDATION SLABS
M DPPDHVTG IWACO
Module : EXCAVATION, BEDDINGAND BACKFILLING
Code : TPC 120
Edition : 15—03—1985
Section4 : HANDOUT Page : 01 of 06
DRAINAGE ISNECESSARY FORACCURATE CONSTRUCTION
WIDTH OF EXCAVATIONHAS TO BE SUFFICIENTTO BE ABLE TO WORKEASILY IN THE TRENCH
Fig. 1. Excavation requirements for the laying of pipes


Module : EXCAVATION, BEDDINGAND BACKFILLING
Code : TPC 120
Edition : 15—03—1985
Section 4 : H A N D 0 U T Page : 02 of 06
When the excavation is made either with machine or by hand it isextremely important that the depth of the trench is planned before-hand. The sides of the trench should be clean and free of anydangerous obstructions like rocks protruding into the trench, whichmay become a safety hazard for people within the trench. If the sidesof the trench or the spoil above the trench are unstable in any waythen the trench sides should be supported properly using timberconstructed in the correct manner and the spoil be preferably removedfrom near the trench edge to a safer position.
IFOR SHALLOW TRENC~ESANOH~DrIGOTFER SERVICE!
Fig. 2. Supporting trench sides
It is also essential that the correct tools are used in the excava-tion. This may seem a simple statement to make but pick axes aredesigned to break up rock only and shovels for moving earth to anoth-er place. We have all seen pick axes used as hammers.The practice of using mechanical tools e.g. rammers, compressors etc.by workmen wearing no protective shoes but merely flip—flops appearsrather dangerous. They should be encouraged to take all necessarysafety precautions when working in trenches.
3. BEDDING
After excavation of the pipe trench, the pipe should be laid on abedding of fine granular material. This can include sand, goodquality top soil or pea gravel etc. The position of the joints shouldbe marked in the bedding material and a small depression formed toallow the socket of the joint to rest in the depression leaving theremaining pipe evenly supported along its entire length (see figureson next page).
~WPORTU~TP.i8ER


Module EXCAVATION, BEDDINGAND BACKFILLING
Code : TPC 120
Edition : 15—03—1985
Section 4 : H A N D 0 U T Page : 03 of 06
correct The pipe is supportedover its entire lenght.
wrong The pipe is supported ontwo or more points only(i.e. on the couplings).Statically it acts like a
~ beam. When back—filledthe whole weight of thecover rests on the pipewhich may cause it tofracture in due course.
10 m
tlOOmm
Fig. 3. Bedding requirements
Fig. 4. Pipe bedding

4

Module EXCAVATION, BEDDINGAND BACKFILLING
Code : TPC 120
Edition : 15—03—1985
Section 4 H A N D 0 U T Page : 04 of 06
4. BACKFILLING
Much damage has been done to newly laid water pipes by ineffectivemethods of backfillLng. A trench should be backfilled in layers ofapproximately 20 cm and rammed progressively (see figure below).Immediately around the pipe similar fine granular material as usedfor pipe bedding should be used. This must also be rammed and conso-lidated. As the trench is filled progressively, coarser backfillingmaterial e.g. larger stones can be used towards the surface. Becauseof the excessive rain and heat experienced in Indonesia it is criti-cal that the trench is reinstated as quickly as possible after back—filling, to prevent erosion by rain water. It should be reinstated ina material similar to the area e.g. tarmac on roads and grass onfields.
BACKFILLING BY LAYE R S
LARGER COMPACTEDMATERIAL
300 MM.
LARGER COMPACTEDMATERIALAPPROX 300 MM.
COMPACTEDMATERIALAROUNDPIPE
BEDDING 100MM.
Fig. 5. Cross--section through pipe trench

4

Module : EXCAVATION, BEDDINGAND BACKFILLING
Code : TPC 120
Edition : 15—03—1985
Section4 HANDOUT Page 05 of 06
1. Place soil up to 1/2 external diameter.
2. Tamp soil under pipes and between pipelineand trench wall at both sides. Water tainpingmay be used where drainage is good.
3. Place soil up to the top of the pipe.
4. Tamp soil between pipeline and trench wallat both sides.
5. Backfi].ling by hand until 20 cm over thepipe. Tamp each 10 an layer.
6. Backfilling of the remaining trenches.
Fig. 6. Backfilling sequence


Module EXCAVATION, BEDDINGAND BACKFILLING
Code : TPC 120
Edition : 15—03—1985
Section 4 : H A N D 0 U T Page 06 of 06
5. SAFETY
Safety standards in Indonesia, as in many other countries, are re-grettably low. Care must be taken at all times to ensure that safetypractices are observed not only by the workmen but also by theirsupervisors and anyone else who comes on site.
6. SiJ44ARY
There is no shortcut to good excavation, bedding and backfilling. Itshould be planned correctly and executed efficiently, using the rightmaterials and tools, and always bearing safety in mind.

4

TITLE
1. Prefabricated pipes
2. Timber trench support
3. Depression in bedding
4. Pipe bedding
5. Backfilling by layers
6. Backfilling
Module : EXCAVATION, BEDDING -AND BACKFILLING
Code TPC 120
Edition : 15—03—1985
Annex : V I E W F 0 I L S Page : 01 of 07
CODE
TPC
TPC
TPC
TPC
TPC
TPC
120/V 1
120/V 2
120/V 3
120/V 4
120/V 5
120/V 6

I
4

Prefabricated pipes TPC 120/v 1
C/)
4
U) 2co4wU)XI’~Z
I-~9ZOZI-1- 0
)<OLi~IL.wwow
WOW’-> >WOwu....JI-~j0
z0
I-C-)
I-U)
00(/)ta~O
400~i:wo
I—
zz
<IL>i&.4:,
~U)
IL0
O~
I-
—4
OW
I-
0
LLJ~j0—
U)0<
I
0
W
I-
WII-.
U-0
C/)Ui0~0-JU)
<c~
~_0
I.-0DCfl~j
-JW
0—i-i(/)Cl)

4

Timber trench support TPC 120/V 2
U)w0>
w(I)
crwI
0z
C’)r1iLLJtS20>ZQ~WW0cn
~W‘-‘I
-Jo
(n~00ILl
(9
0(/)ZDw
ow
cD(flF-
w0U,
w(n0~

-¾-

(9z00w
Depression in bedding TPC 120/V 3
I-z0-D N
S.’
‘S.
\ \
EE
4 -~ I
E0
+

4-
4

Pipe bedding TPC 120/V 4
~LLi ~
I
WZQ~IQ~DZ i-~j.jI-~ 0
0-I0LLJ ~w~3j°~w
(fl~I—~U~I :,zS~2w 22a~Z ~
WV)Q..’~cfl~LLJLL0~c~z F-
wWI> IZ~IWZ.HO
I—0W 0z za: 0 0O a: a:0

4.

Backfilling by layers
0~ C
00 0
040 0~~o
c—. 0
~~ ~ ~0
0 0¾r (.,c~%
~ 0 ç
0 ~a
~ oOO 0
~ ~. a0 ~ c
0~
~
— ~
~ 0 0
-I4
a:UiI-4
WcLI-00
Q-D
0-4
TPC 120/V 5
0UiI—0-40..
00
a:UiCDa:4-I
00
a:oI-a-<a.
0UiI-C-)4a-0C.)
a:UiCDa:4-J
000
0..i~4.-xa:0Wa:
<a.
CDz00LU
~‘
—:~~:,:~.:
.—: :~
(~t)
w>-
-j
>-
(9z-J-JU-
0
In

S

Backfilling TPC 120/V 6
Ia: 0ILl Z> Iii0 a:
0z4(/)
LU
. 0>..0<Cu-I
I-
C!)Z~
WO~~JWIa-F--~0
0zWI-W<~~-jWj04
=~~X
a.Z~W<a:I-F-
HOZ~~—OXZO4<1W
>-a-~(!)<z~~W—a.‘~
~W<IOF-
4~LUa:LU~I-
IL0
C!)z-~1-~
IL
‘0<0
I~, CD
._J4Za:LUI—xLU
C~J‘~
F--0a.:,
5a:COW
W~o~j~a.0
ZI1iJ
1..0LUbLU~I-WF-04W
in0-iZ.J>C~<4<0
~OU)W1CD9~)Zcooz~
a:~
z~
4~a:Sw<°
~Wa.—Jc,~~W~jW<a-OX~-a:~
LU
II—
U~~‘
a-0I-
LUIF-
0
a.:,
5(1)
LUu<.J~-a-a.
N N)
A~A~/iAWIKff1KW!AV~i

t


C
1!4.

S

C
4-
-t
F