Director’s report 1 – 3 · H.H. Shaikh Ahmad Bin Saeed Al Maktoum Chairman Mr. Hesham Abdulla...
68
CELEBRATING 100 YEARS OF ZAYED EMIRATES NBD BANK PJSC GROUP CONSOLIDATED FINANCIAL STATEMENTS FOR THE YEAR ENDED 31 DECEMBER 2018
Transcript of Director’s report 1 – 3 · H.H. Shaikh Ahmad Bin Saeed Al Maktoum Chairman Mr. Hesham Abdulla...

CELEBRATING100 YEARS OF
ZAYEDEMIRATES NBDBANK PJSCGROUP CONSOLIDATEDFINANCIAL STATEMENTS
FOR THE YEARENDED 31 DECEMBER 2018

EMIRATES NBD BANK PJSC - GROUP CONSOLIDATED FINANCIAL STATEMENTS - FOR THE YEAR ENDED 31 DECEMBER 2018
EMIRATES NBD BANK PJSC
GROUP CONSOLIDATED FINANCIAL STATEMENTS
Contents Page
Director’s report 1 – 3
Independent auditors’ report on the Group consolidated financial statements 4 – 8
Group consolidated statement of financial position 9
Group consolidated income statement 10
Group consolidated statement of comprehensive income 11
Group consolidated statement of cash flows 12
Group consolidated statement of changes in equity 13 – 14
Notes to the Group consolidated financial statements 15 – 130
1 2EMIRATES NBD BANK PJSC - GROUP CONSOLIDATED FINANCIAL STATEMENTS - FOR THE YEAR ENDED 31 DECEMBER 2018
DIRECTORS’ REPORT
The Directors have pleasure in presenting their report together with the audited consolidated financial statements of Emirates NBD PJSC (“the Bank”) and its subsidiaries (collectively known as “the Group”) for the year ended31 December 2018.
The Bank was incorporated in the UAE on 16 July 2007, pursuant to the approval from the Central Bank of the UAE on 3 July 2007, to grant the Bank a banking license.
Basis of Preparation of Financial Statements
The Group consolidated financial statements have been prepared in accordance with IFRS issued by the International Accounting Standards Board (IASB) and applicable requirements of the laws of the U.A.E.
Financial Commentary
The Group reported a consolidated profit (attributable to equity holders) of AED 10,040 million for the year 2018, which represent an increase of 20.31 % over 2017. The Group has continued to focus on:
• Delivering appropriate returns and long term sustainable value for shareholders;
• Maintaining a strong risk oversight whilst continuing to improve cost of risk;
• Maintaining a strong capital base, liquidity and funding positions;
• Optimizing and expanding our overseas presence;
• Investing in people whilst strengthening culture and conduct with a focus on National talent development;
• Investment in IT transformation with a focus on innovation, analytics and digitalization.
The UAE economy has continued to be resilient despite volatility in the global economic climate and variousgeo-political events dominating the global arena. The Group’s business and support units delivered another strong performance in 2018 with net profits at AED 10 billion. The balance sheet remains healthy as demonstrated by strong funding & capital ratios coupled with a further improvement in credit quality.
Group Earning per Share improved to AED 1.70 (2017: AED 1.40).
The Group achieved a return on average tangible equity of 22.1 % (2017: 20.2 %) and return on average total assets of 2.1 % (2017: 1.8 %).
Equity and Note Holders’ Funds
Total equity and note holders’ funds as at the end of 2018 stands at AED 64,015 million (2017: AED 59,354 million).
Proposed Appropriations
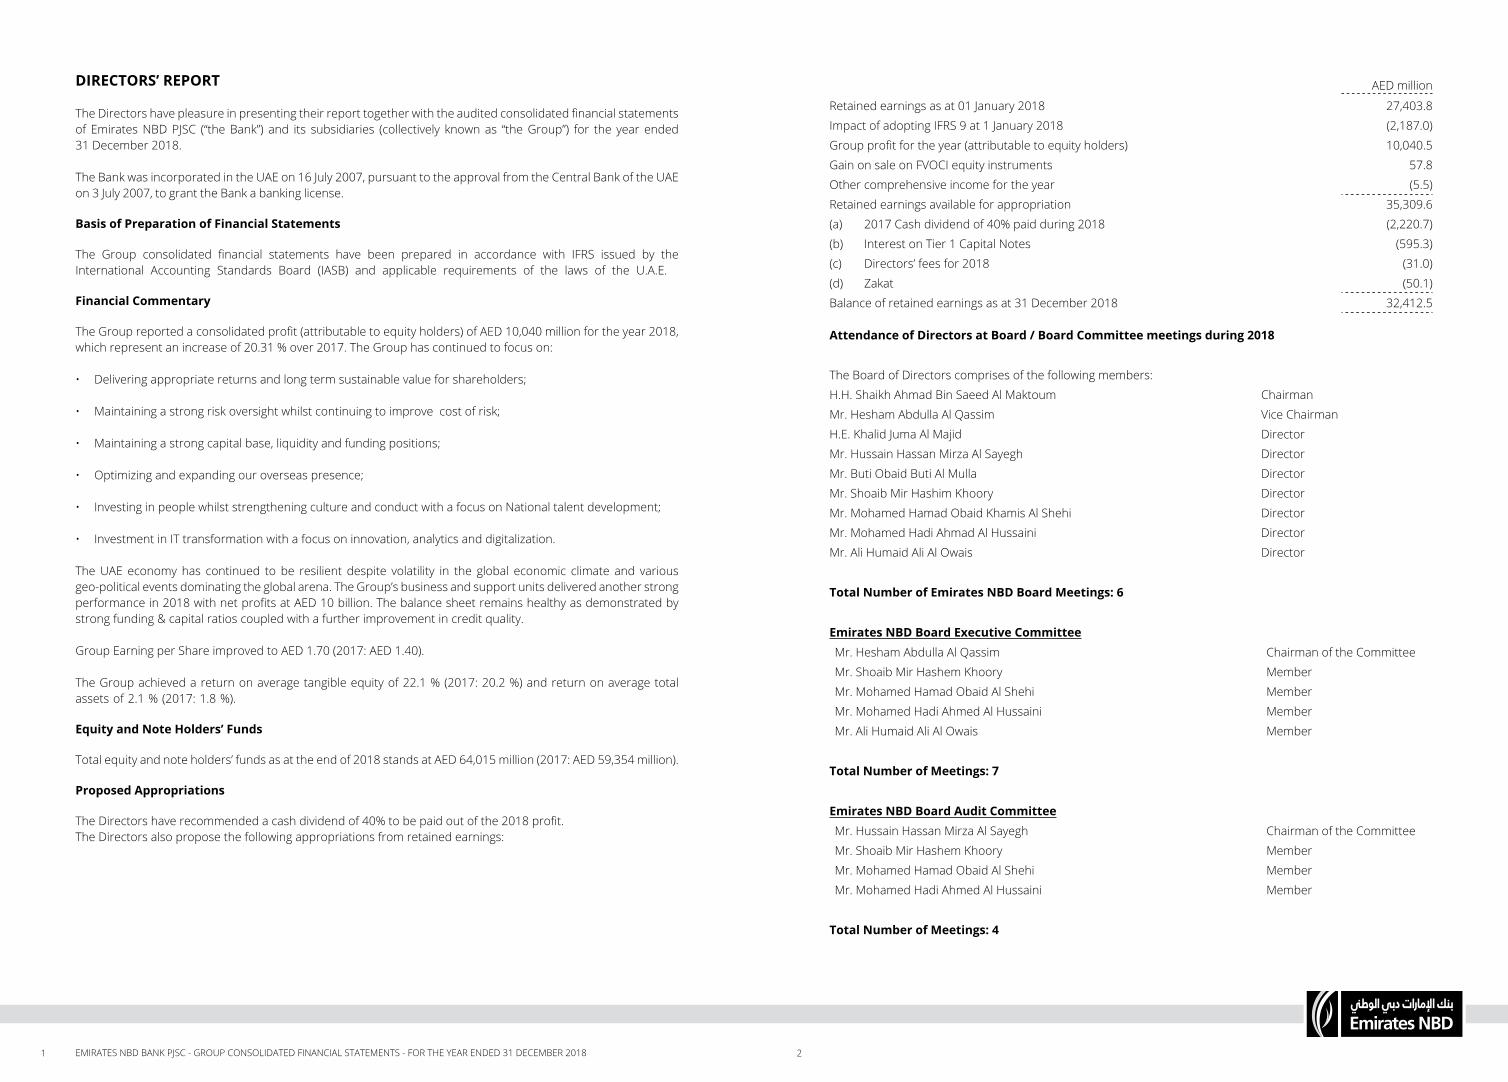
The Directors have recommended a cash dividend of 40% to be paid out of the 2018 profit.The Directors also propose the following appropriations from retained earnings:
AED million
Retained earnings as at 01 January 2018 27,403.8
Impact of adopting IFRS 9 at 1 January 2018 (2,187.0)
Group profit for the year (attributable to equity holders) 10,040.5
Gain on sale on FVOCI equity instruments 57.8
Other comprehensive income for the year (5.5)
Retained earnings available for appropriation 35,309.6
(a) 2017 Cash dividend of 40% paid during 2018 (2,220.7)
(b) Interest on Tier 1 Capital Notes (595.3)
(c) Directors’ fees for 2018 (31.0)
(d) Zakat (50.1)
Balance of retained earnings as at 31 December 2018 32,412.5
Attendance of Directors at Board / Board Committee meetings during 2018
The Board of Directors comprises of the following members:
H.H. Shaikh Ahmad Bin Saeed Al Maktoum Chairman
Mr. Hesham Abdulla Al Qassim Vice Chairman
H.E. Khalid Juma Al Majid Director
Mr. Hussain Hassan Mirza Al Sayegh Director
Mr. Buti Obaid Buti Al Mulla Director
Mr. Shoaib Mir Hashim Khoory Director
Mr. Mohamed Hamad Obaid Khamis Al Shehi Director
Mr. Mohamed Hadi Ahmad Al Hussaini Director
Mr. Ali Humaid Ali Al Owais Director
Total Number of Emirates NBD Board Meetings: 6
Emirates NBD Board Executive Committee Mr. Hesham Abdulla Al Qassim Chairman of the Committee
Mr. Shoaib Mir Hashem Khoory Member
Mr. Mohamed Hamad Obaid Al Shehi Member
Mr. Mohamed Hadi Ahmed Al Hussaini Member
Mr. Ali Humaid Ali Al Owais Member
Total Number of Meetings: 7
Emirates NBD Board Audit CommitteeMr. Hussain Hassan Mirza Al Sayegh Chairman of the Committee
Mr. Shoaib Mir Hashem Khoory Member
Mr. Mohamed Hamad Obaid Al Shehi Member
Mr. Mohamed Hadi Ahmed Al Hussaini Member
Total Number of Meetings: 4

3 4EMIRATES NBD BANK PJSC - GROUP CONSOLIDATED FINANCIAL STATEMENTS - FOR THE YEAR ENDED 31 DECEMBER 2018
Emirates NBD Board Nomination and Remuneration CommitteeMr. Buti Obaid Buti Al Mulla Chairman of the Committee
Mr. Mohamed Hamad Obaid Al Shehi Member
Mr. Mohamed Hadi Ahmad Al Hussaini Member
Mr. Ali Humaid Ali Al Owais Member
Total Number of Meetings: 2
Emirates NBD Board Risk CommitteeMr. Hesham Abdulla Al Qassim Chairman of the Committee
Mr. Hussain Hassan Mirza Al Sayegh Member
Mr. Buti Obaid Buti Al Mulla Member
Mr. Ali Humaid Ali Al Owais Member
Total Number of Meetings: 4
Emirates NBD Board Credit and Investment Committee Mr. Hesham Abdulla Al Qassim Chairman of the Committee
Mr. Shoaib Mir Hashem Khoory Member
Mr. Mohamed Hadi Ahmad Al Hussaini Member
Mr. Ali Humaid Ali Al Owais Member
Total Number of Meetings: 47
Auditors:Ernst and Young were appointed as auditors of the Emirates NBD Group for 2018 financial year in the Annual General Meeting held on 27 March 2018.
On behalf of the Board
ChairmanDubai, UAE15 January 2019
INDEPENDENT AUDITORS’ REPORT TO THE SHAREHOLDERS OF EMIRATES NBD BANK PJSC
Report on the audit of the consolidated financial statements
OpinionWe have audited the consolidated financial statements of Emirates NBD Bank PJSC (the “Bank”) and its subsidiaries (collectively referred to as the “Group”), which comprise the consolidated statement of financial position as at31 December 2018, and the consolidated income statement, consolidated statement of comprehensive income, consolidated statement of cash flows and consolidated statement of changes in equity for the year then ended, and notes to the consolidated financial statements, including a summary of significant accounting policies.
In our opinion the accompanying consolidated financial statements present fairly, in all material respects, the consolidated financial position of the Group as at 31 December 2018, and its consolidated financial performance and its consolidated cash flows for the year then ended in accordance with International Financial Reporting Standards.
Basis of opinionWe conducted our audit in accordance with International Standards on Auditing (ISAs). Our responsibilities under those standards are further described in the Auditor’s responsibilities for the audit of the consolidated financial statements section of our report. We are independent of the Group in accordance with the International Ethics Standards Board for Accountants’ Code of Ethics for Professional Accountants (the “IESBA Code”) together with ethical requirements that are relevant to our audit of the consolidated financial statements and we have fulfilled our other ethical responsibilities in accordance with these requirements and the IESBA Code. We believe that the audit evidence we have obtained is sufficient and appropriate to provide a basis for our opinion.
Key audit mattersKey audit matters are those matters that, in our professional judgment, were of most significance in our audit of the consolidated financial statements of the current period. These matters were addressed in the context of our audit of the consolidated financial statements as a whole and in forming our opinion thereon, and we do not provide a separate opinion on these matters. For each matter below, our description of how our audit addressed the matter is provided in that context.
We have fulfilled the responsibilities described in the Auditor’s responsibilities for the audit of the consolidated financial statements section of our report, including in relation to these matters. Accordingly, our audit included the performance of procedures designed to respond to our assessment of the risks of material misstatement of the consolidated financial statements. The results of our audit procedures, including the procedures performed to address the matters below, provide the basis for our audit opinion on the accompanying consolidated financial statements.
(a) Impairment of loans and advances
Refer to note 7 of the consolidated financial statements for a description of the accounting policy and note 50 for analysis of credit risk.
Due to the inherently judgmental nature of the computation of expected credit losses (“ECL”) for loans and advances and Islamic financing receivables, there is a risk that the amount of ECL may be misstated.
On adoption, the Group has applied the requirement of IFRS 9 retrospectively without restating the comparatives. The difference between previously reported carrying amounts as of 31 December 2017 and new carrying amounts as of 1 January 2018, mainly arising from impairment, has been recognized in opening retained earnings.

5 6EMIRATES NBD BANK PJSC - GROUP CONSOLIDATED FINANCIAL STATEMENTS - FOR THE YEAR ENDED 31 DECEMBER 2018
Key audit matters (continued)
How the matter was addressed during our audit:To audit the balances due from the related parties and the related income, we performed a combination of tests of controls, analytical review procedures and specific substantive audit procedures to test related parties and transactions. Key controls in the loan and overdraft granting, booking and monitoring processes were identified, documented and tested. Balances were confirmed by the borrower. The calculation of income was re-performed on a sample basis to determine whether it had been recognized in accordance with International Financial Reporting Standards. We reviewed minutes of meetings of management, the Board of Directors and shareholders, and compared identified related party transactions with those identified by management. We assessed the adequacy of these disclosures by assessing whether a reasonable user of the consolidated financial statements could understand the exposure of the Bank to concentration and related risks, and by considering the ability of such a user to reasonably estimate the extent of transactions with the majority shareholder of the parent, including the income arising from the balance due from them, based on the disclosures provided.
Other information
Management is responsible for the other information. Other information consists of the information included in the Group’s 2018 Annual Report, other than the consolidated financial statements and our auditors’ report thereon. We obtained the report of the Bank’s Board of Directors, prior to the date of our auditors’ report, and we expect to obtain the remaining sections of the Group’s 2018 Annual Report after the date of our auditors’ report.
Our opinion on the consolidated financial statements does not cover the other information and we do not and will not express any form of assurance conclusion thereon.
In connection with our audit of the consolidated financial statements, our responsibility is to read the other information identified above and, and in doing so, consider whether the other information is materially inconsistent with the consolidated financial statements or our knowledge obtained in the audit, or otherwise appears to be materially misstated. If, based on the work we have performed on the other information that we obtained prior to the date of this auditor’s report, we conclude that there is a material misstatement of this other information, we are required to report that fact. We have nothing to report in this regard.
Responsibilities of management and those charged with governance for the consolidated financial statements
Management is responsible for the preparation and fair presentation of these consolidated financial statements in accordance with International Financial Reporting Standards and in compliance with the applicable provisions of the Bank’s Memorandum and Articles of Association and of the UAE Federal Law No. (2) of 2015, and for such internal control as management determines is necessary to enable the preparation of consolidated financial statements that are free from material misstatement, whether due to fraud or error.
In preparing the consolidated financial statements, management is responsible for assessing the Group’s ability to continue as a going concern, disclosing, as applicable, matters related to going concern and using the going concern basis of accounting unless management either intends to liquidate the Group or to cease operations, or has no realistic alternative but to do so.
Those charged with governance are responsible for overseeing the Group’s financial reporting process.
Auditor’s responsibilities for the audit of the consolidated financial statements
Our objectives are to obtain reasonable assurance about whether the consolidated financial statements as a whole are free from material misstatement, whether due to fraud or error, and to issue an auditor’s report that includes our opinion. Reasonable assurance is a high level of assurance, but is not a guarantee that an audit conducted in accordance with ISAs will always detect a material misstatement when it exists. Misstatements can arise from fraud or error and are considered material if, individually or in the aggregate, they could reasonably be expected to influence the economic decisions of users taken on the basis of these consolidated financial statements.
Key audit matters (continued)
The key areas of judgement include:
1. The identification of exposure with a significant deterioration in credit quality.
2. Assumptions used in the ECL model such as financial condition of counterparty, expected future cash flows, forward looking macroeconomic factors etc.
3. The need to apply additional overlays to reflect current or future external factors that might not be captured by the expected credit loss model.
How the matter was addressed during our audit:
In assessing the impairment, we performed the following procedures:
1. We assessed the modelling techniques and methodology against the requirements of IFRS 9.
2. We tested the data, both current and historical, used in determining the ECL.
3. We tested the expected credit loss models including build, validation and governance of models.
4. We tested the material modelling assumptions in addition to any overlays.
5. We examined a sample of exposures and performed procedures to determine whether significant increase in credit risk had been identified on a timely basis.
6. We reperformed the ECL computation for sample of credit facilities.
7. We checked appropriateness of opening balance adjustments mainly arising from impairment.
8. We assessed the accuracy of disclosures in the consolidated financial statements.
(b) Concentration to related party balances
Refer to note 7 of the consolidated financial statements for a description of the accounting policy and note 43 for related party balances.
Under IFRS 7 Financial Instruments: Disclosures, specific disclosures are required for each type of risk arising from financial instruments. These include qualitative disclosures around how exposures arise and how they are measured and managed, summary quantitative data about an entity’s exposure to each type of risk, and information about an entity’s credit risk exposure, including significant credit risk concentrations (“concentration risk”). In addition, for government-controlled entities such as Emirates NBD Bank PJSC, disclosure is required under IAS 24 Related Party Disclosures of a qualitative or quantitative indication of the extent of transactions with the government or related entities.
Significant management judgment is involved in determining the disclosures required by IFRS 7 and IAS 24 to address the concentration and related risks and related party disclosures arising from this balance and the income arising from it. As such, we consider this to be a key audit matter.
7 8EMIRATES NBD BANK PJSC - GROUP CONSOLIDATED FINANCIAL STATEMENTS - FOR THE YEAR ENDED 31 DECEMBER 2018
Report on other legal and regulatory requirements
Further, as required by UAE Federal Law No. (2) of 2015, we report that:
• the Group has maintained proper books of account;
• we have obtained all the information and explanations we considered necessary for the purposes of our audit;
• the consolidated financial statements have been prepared and comply, in all material respects, with the applicable provisions of the Bank’s Memorandum and Articles of Association and the UAE Federal Law No. (2) of 2015;
• the consolidated financial information included in the Directors’ report is consistent with the books of account and records of the Group;
• investments in shares and stocks during the year ended 31 December 2018 are disclosed in note 11 to the consolidated financial statements;
• note 43 reflects the disclosures relating to related party transactions and the terms under which they were conducted;
• based on the information that has been made available to us nothing has come to our attention which causes us to believe that the Bank has contravened, during the financial year ended 31 December 2018, any of the applicable provisions of the UAE Federal Law No. (2) of 2015 or of its Memorandum and Articles of Association which would materially affect its activities or its consolidated financial position as at 31 December 2018; and
• note 52 reflects the social contributions made during the year.
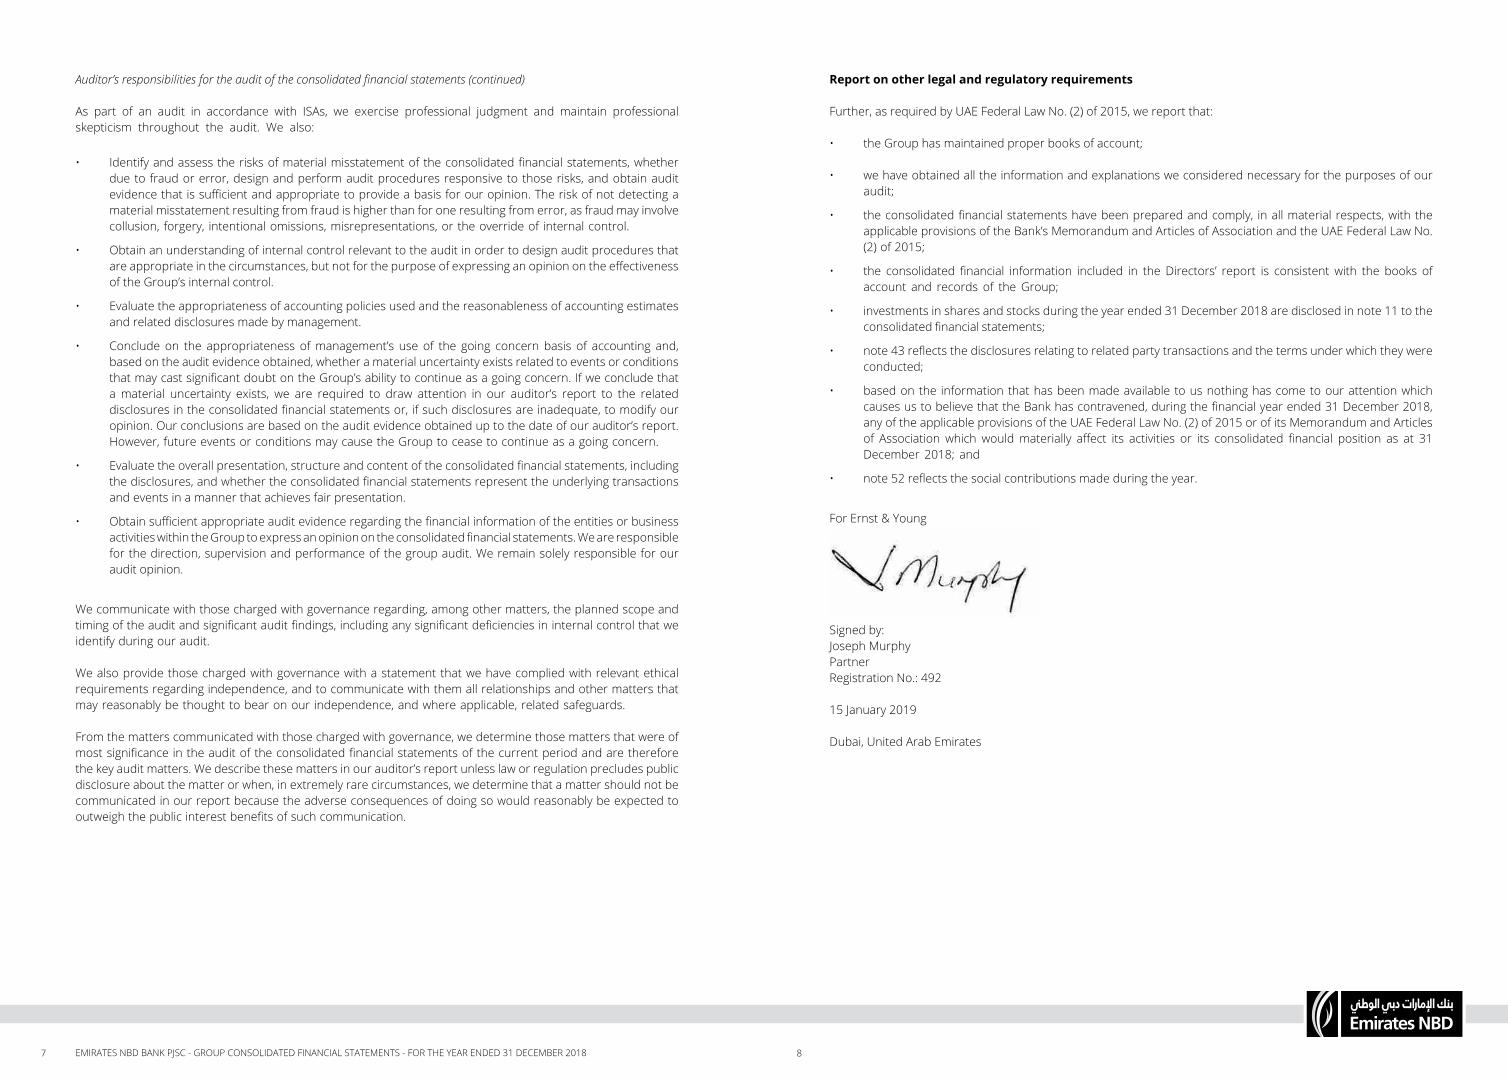
For Ernst & Young
Signed by:Joseph MurphyPartnerRegistration No.: 492
15 January 2019
Dubai, United Arab Emirates
Auditor’s responsibilities for the audit of the consolidated financial statements (continued)
As part of an audit in accordance with ISAs, we exercise professional judgment and maintain professional skepticism throughout the audit. We also:
• Identify and assess the risks of material misstatement of the consolidated financial statements, whether due to fraud or error, design and perform audit procedures responsive to those risks, and obtain audit evidence that is sufficient and appropriate to provide a basis for our opinion. The risk of not detecting a material misstatement resulting from fraud is higher than for one resulting from error, as fraud may involve collusion, forgery, intentional omissions, misrepresentations, or the override of internal control.
• Obtain an understanding of internal control relevant to the audit in order to design audit procedures that are appropriate in the circumstances, but not for the purpose of expressing an opinion on the effectiveness of the Group’s internal control.
• Evaluate the appropriateness of accounting policies used and the reasonableness of accounting estimates and related disclosures made by management.
• Conclude on the appropriateness of management’s use of the going concern basis of accounting and, based on the audit evidence obtained, whether a material uncertainty exists related to events or conditions that may cast significant doubt on the Group’s ability to continue as a going concern. If we conclude that a material uncertainty exists, we are required to draw attention in our auditor’s report to the related disclosures in the consolidated financial statements or, if such disclosures are inadequate, to modify our opinion. Our conclusions are based on the audit evidence obtained up to the date of our auditor’s report. However, future events or conditions may cause the Group to cease to continue as a going concern.
• Evaluate the overall presentation, structure and content of the consolidated financial statements, including the disclosures, and whether the consolidated financial statements represent the underlying transactions and events in a manner that achieves fair presentation.
• Obtain sufficient appropriate audit evidence regarding the financial information of the entities or business activities within the Group to express an opinion on the consolidated financial statements. We are responsible for the direction, supervision and performance of the group audit. We remain solely responsible for our audit opinion.
We communicate with those charged with governance regarding, among other matters, the planned scope and timing of the audit and significant audit findings, including any significant deficiencies in internal control that we identify during our audit.
We also provide those charged with governance with a statement that we have complied with relevant ethical requirements regarding independence, and to communicate with them all relationships and other matters that may reasonably be thought to bear on our independence, and where applicable, related safeguards.
From the matters communicated with those charged with governance, we determine those matters that were of most significance in the audit of the consolidated financial statements of the current period and are therefore the key audit matters. We describe these matters in our auditor’s report unless law or regulation precludes public disclosure about the matter or when, in extremely rare circumstances, we determine that a matter should not be communicated in our report because the adverse consequences of doing so would reasonably be expected to outweigh the public interest benefits of such communication.

9 10EMIRATES NBD BANK PJSC - GROUP CONSOLIDATED FINANCIAL STATEMENTS - FOR THE YEAR ENDED 31 DECEMBER 2018
GROUP CONSOLIDATED INCOME STATEMENTFOR THE YEAR ENDED 31 DECEMBER 2018
Notes 2018AED 000
2017AED 000
Interest and similar income 27 16,930,894 13,573,947
Interest and similar expense 27 (5,997,538) (4,615,211)
Net interest income 10,933,356 8,958,736
Income from Islamic financing and investment products 28 2,870,213 2,632,045
Distribution on Islamic deposits and profit paid to Sukuk holders 29 (916,022) (804,821)
Net income from Islamic financing and investment products 1,954,191 1,827,224Net interest income and income from Islamic financing and investment products net of distribution to depositors 12,887,547 10,785,960
Fee and commission income 4,022,106 3,938,309
Fee and commission expense (1,165,624) (981,346)
Net fee and commission income 30 2,856,482 2,956,963
Net gain / (loss) on trading securities 31 53,526 142,917
Other operating income 32 1,604,741 1,569,320
Total operating income 17,402,296 15,455,160
General and administrative expenses 33 (5,619,671) (4,844,229)
Operating profit before impairment 11,782,625 10,610,931
Net impairment loss on financial assets 34 (1,748,181) (2,228,517)
Operating profit after impairment 10,034,444 8,382,414
Share of profit / (loss) of associates and joint ventures 136,019 72,167
Group profit for the year before tax 10,170,463 8,454,581
Taxation charge (128,940) (108,785)
Group profit for the year after tax 10,041,523 8,345,796
Attributable to:
Equity holders of the Group 10,040,485 8,345,024
Non-controlling interest 1,038 772
Group profit for the year after tax 10,041,523 8,345,796
Earnings per share 37 1.70 1.40
The attached notes 1 to 52 form an integral part of these Group consolidated financial statements.The independent auditors’ report on the Group consolidated financial statements is set out on pages 4 to 8.
GROUP CONSOLIDATED STATEMENT OF FINANCIAL POSITIONAS AT 31 DECEMBER 2018
ASSETS Notes 2018AED 000
2017AED 000
Cash and deposits with Central Banks 9 84,604,316 71,852,618
Due from banks 10 39,907,253 49,726,135
Investment securities 11 20,066,403 19,048,242
Loans and receivables 13 278,064,013 257,604,666
Islamic financing receivables 15 49,866,487 46,487,948
Investments in associates and joint ventures 1,581,180 1,624,330
Positive fair value of derivatives 38 3,670,892 2,851,520
Investment properties 549,705 537,680
Customer acceptances 42 7,736,164 6,111,947
Property and equipment 2,515,884 2,442,833
Goodwill and intangibles 16 5,686,258 5,688,203
Other assets 17 6,094,191 6,396,161
TOTAL ASSETS 500,342,746 470,372,283
LIABILITIES
Due to banks 18 22,339,668 21,311,193
Customer deposits 19 290,920,920 265,712,916
Islamic customer deposits 20 56,945,102 60,815,385
Debt issued and other borrowed funds 21 40,715,230 39,788,848
Sukuk payable 22 3,685,160 5,526,649
Negative fair value of derivatives 38 3,767,748 2,252,495
Customer acceptances 42 7,736,164 6,111,947
Other liabilities 23 10,208,391 9,491,313
TOTAL LIABILITIES 436,318,383 411,010,746
EQUITY
Issued capital 24 5,557,775 5,557,775
Treasury shares (46,175) (46,175)
Tier I capital notes 25 9,477,076 9,477,076
Share premium reserve 24 12,270,124 12,270,124
Legal and statutory reserve 26 2,778,888 2,778,888
Other reserves 26 2,869,533 2,869,533
Fair value reserve 26 (72,904) 261,568
Currency translation reserve 26 (1,231,558) (1,219,088)
Retained earnings 32,412,538 27,403,808
TOTAL EQUITY ATTRIBUTABLE TO EQUITY AND NOTE HOLDERS OF THE GROUP 64,015,297 59,353,509
Non-controlling interest 9,066 8,028
TOTAL EQUITY 64,024,363 59,361,537
TOTAL LIABILITIES AND EQUITY 500,342,746 470,372,283
The attached notes 1 to 52 form an integral part of these Group consolidated financial statements.The independent auditors’ report on the Group consolidated financial statements is set out on pages 4 to 8.
____________________ ____________________________ _____________________________ Chairman Vice Chairman Chief Executive Officer
15 January 2019

11 12EMIRATES NBD BANK PJSC - GROUP CONSOLIDATED FINANCIAL STATEMENTS - FOR THE YEAR ENDED 31 DECEMBER 2018
GROUP CONSOLIDATED STATEMENT OF CASH FLOWSFOR THE YEAR ENDED 31 DECEMBER 2018
Notes 2018AED 000
2017AED 000
OPERATING ACTIVITIES
Group profit before tax for the year 10,170,463 8,454,581
Adjustment for non-cash items (refer Note 46) 2,082,404 2,741,672
Operating profit before changes in operating assets and liabilities 12,252,867 11,196,253
(Increase)/decrease in interest free statutory deposits (153,286) (2,505,361)
(Increase)/decrease in certificate of deposits with Central Banks maturing after three months (14,190,167) (3,901,118)
(Increase)/decrease in amounts due from banks maturing after three months (5,413,906) 1,767,024
Increase/(decrease) in amounts due to banks maturing after three months 362,294 (349,054)
(Increase)/decrease in other assets 892,271 2,095,539
Increase/(decrease) in other liabilities (85,743) (4,315)
(Increase)/decrease in positive fair value of derivatives (902,951) 613,271
Increase/(decrease) in negative fair value of derivatives 1,506,853 (588,731)
Increase/(decrease) in customer deposits 25,208,004 11,014,714
Increase/(decrease) in Islamic customer deposits (3,870,283) 4,761,148
(Increase)/decrease in trading securities - (1,989,705)
(Increase)/decrease in loans and receivables (22,794,882) (16,696,496)
(Increase)/decrease in Islamic financing receivables (5,334,600) 720,817
(12,523,529) 6,133,986
Taxes paid (123,749) (100,808)
Net cash flows from/(used in) operating activities (12,647,278) 6,033,178
INVESTING ACTIVITIES
(Increase)/decrease in investment securities (1,349,317) (2,174,142)
(Increase)/decrease in investments in associates and joint ventures 179,005 128,113
(Increase)/decrease of property and equipment (470,683) (396,169)
Net cash flows from/(used in) investing activities (1,640,995) (2,442,198)
FINANCING ACTIVITIES
Issuance of debt issued and other borrowed funds 15,710,677 10,394,762
Repayment of debt issued and other borrowed funds (14,056,360) (9,445,340)
Repayment of sukuk borrowing (1,836,250) (1,836,250)
Interest on Tier I capital notes (595,284) (589,813)
Dividends paid (2,220,749) (2,220,749)
Net cash flows from/(used in) financing activities (2,997,966) (3,697,390)
Increase/(decrease) in cash and cash equivalents (refer Note 46) (17,286,239) (106,410)
The attached notes 1 to 52 form an integral part of these Group consolidated financial statements.The independent auditors’ report on the Group consolidated financial statements is set out on pages 4 to 8.
GROUP CONSOLIDATED STATEMENT OF COMPREHENSIVE INCOMEFOR THE YEAR ENDED 31 DECEMBER 2018
2018AED 000
2017AED 000
Group profit for the year after tax 10,041,523 8,345,796
Other comprehensive income
Items that will not be reclassified subsequently to Income statement:
Actuarial gains / (losses) on retirement benefit obligations (5,476) 13,868
Movement in fair value reserve (equity instruments):
- Net change in fair value (98,706) -
- Net amount transferred to retained earnings 57,776 -
Items that may be reclassified subsequently to Income statement:Cost of hedging for forward element of a forward and currency basis spread excluded from hedge effectiveness testing:Net change in the cost of hedging (16,703) -
Cash flow hedges:
- Effective portion of changes in fair value (50,455) 294,302
Fair value reserve (debt instruments):
- Net change in fair value (38,205) -
- Net amount transferred to income statement (11,828) -
Fair value reserve (available-for-sale financial assets):
- Net change in fair value - 62,911
- Net amount transferred to income statement - (206,436)
Currency translation reserve (25,319) (106,920)
Hedge of a net investment in foreign operations 12,849 (9,159)
Other comprehensive income for the year (176,067) 48,566
Total comprehensive income for the year 9,865,456 8,394,362
Attributable to:
Equity holders of the Group 9,864,418 8,393,590
Non-controlling interest 1,038 772
Total comprehensive income for the year 9,865,456 8,394,362
The attached notes 1 to 52 form an integral part of these Group consolidated financial statements.The independent auditors’ report on the Group consolidated financial statements is set out on pages 4 to 8.

13 14EMIRATES NBD BANK PJSC - GROUP CONSOLIDATED FINANCIAL STATEMENTS - FOR THE YEAR ENDED 31 DECEMBER 2018
GRO
UP
CON
SOLI
DA
TED
STA
TEM
ENT
OF
CHA
NG
ES IN
EQ
UIT
YFO
R TH
E YE
AR E
ND
ED 3
1 D
ECEM
BER
2018
ATT
RIBU
TABL
E TO
EQ
UIT
Y A
ND
NO
TE H
OLD
ERS
OF
THE
GRO
UP
Issu
ed
capi
tal (
a)Tr
easu
ry
shar
es
Tier
I ca
pita
l no
tes
(b)
Shar
e pr
emiu
m
rese
rve
(a)
Lega
l and
st
atut
ory
rese
rve
(c)
Oth
er
rese
rves
(c)
Fair
val
ue
rese
rve
(c)
Curr
ency
tr
ansl
atio
n re
serv
e (c
)Re
tain
ed
earn
ings
Tota
l
Non
-co
ntro
lling
in
tere
stG
roup
To
tal
AED
000
AED
000
AED
000
AED
000
AED
000
AED
000
AED
000
AED
000
AED
000
AED
000
AED
000
AED
000
Bala
nce
as a
t 1 Ja
nuar
y 20
175,
557,
775
(46,
175)
9,47
7,07
612
,270
,124
2,77
8,88
82,
869,
533
110,
791
(1,1
03,0
09)
21,9
38,6
5953
,853
,662
7,25
653
,860
,918
Profi
t for
the
year
--
--
--
--
8,34
5,02
48,
345,
024
772
8,34
5,79
6
Oth
er c
ompr
ehen
sive
inco
me
for t
he ye
ar-
--
--
-15
0,77
7(1
16,0
79)
13,8
6848
,566
-48
,566
Inte
rest
on
Tier
1 c
apita
l not
es-
--
--
--
-(5
89,8
13)
(589
,813
)-
(589
,813
)
Div
iden
ds p
aid
--
--
--
--
(2,2
20,7
49)
(2,2
20,7
49)
-(2
,220
,749
)
Dire
ctor
s’ fe
es (r
efer
not
e 35
)-
--
--
--
-(3
1,00
0)(3
1,00
0)-
(31,
000)
Zaka
t-
--
--
--
-(5
2,18
1)(5
2,18
1)-
(52,
181)
Bala
nce
as a
t 31
Dec
embe
r 20
175,
557,
775
(46,
175)
9,47
7,07
612
,270
,124
2,77
8,88
82,
869,
533
261,
568
(1,2
19,0
88)
27,4
03,8
0859
,353
,509
8,02
859
,361
,537
In a
ccor
danc
e w
ith th
e M
inis
try
of E
cono
my
inte
rpre
tatio
n, D
irect
ors’
fees
hav
e be
en tr
eate
d as
an
appr
opria
tion
from
equ
ity.
The
atta
ched
not
es 1
to 5
2 fo
rm a
n in
tegr
al p
art o
f the
se G
roup
con
solid
ated
fina
ncia
l sta
tem
ents
.
The
inde
pend
ent a
udito
rs’ r
epor
t on
the
Gro
up c
onso
lidat
ed fi
nanc
ial s
tate
men
ts is
set
out
on
page
s 4
to 8
.
Not
es:
(a)
For
furt
her d
etai
ls re
fer t
o N
ote
24
(b)
For
furt
her d
etai
ls re
fer t
o N
ote
25
(c)
For
furt
her d
etai
ls re
fer t
o N
ote
26
GRO
UP
CON
SOLI
DA
TED
STA
TEM
ENT
OF
CHA
NG
ES IN
EQ
UIT
YFO
R TH
E YE
AR E
ND
ED 3
1 D
ECEM
BER
2018
ATT
RIBU
TABL
E TO
EQ
UIT
Y A
ND
NO
TE H
OLD
ERS
OF
THE
GRO
UP
Issu
ed
capi
tal (
a)Tr
easu
ry
shar
es
Tier
I ca
pita
l no
tes
(b)
Shar
e pr
emiu
m
rese
rve
(a)
Lega
l and
st
atut
ory
rese
rve
(c)
Oth
er
rese
rves
(c)
Fair
val
ue
rese
rve
(c)
Curr
ency
tr
ansl
atio
n re
serv
e (c
)Re
tain
ed
earn
ings
Tota
l
Non
-co
ntro
lling
in
tere
stG
roup
To
tal
AED
000
AED
000
AED
000
AED
000
AED
000
AED
000
AED
000
AED
000
AED
000
AED
000
AED
000
AED
000
Bala
nce
as a
t 1 Ja
nuar
y 20
185,
557,
775
(46,
175)
9,47
7,07
612
,270
,124
2,77
8,88
82,
869,
533
261,
568
(1,2
19,0
88)
27,4
03,8
0859
,353
,509
8,02
859
,361
,537
Impa
ct o
f ado
ptin
g IF
RS 9
at 1
Janu
ary
2018
--
--
--
(118
,575
)-
(2,1
86,9
71)
(2,3
05,5
46)
-(2
,305
,546
)
Rest
ated
bal
ance
at 1
Janu
ary
2018
5,55
7,77
5(4
6,17
5)9,
477,
076
12,2
70,1
242,
778,
888
2,86
9,53
314
2,99
3(1
,219
,088
)25
,216
,837
57,0
47,9
638,
028
57,0
55,9
91
Profi
t for
the
year
--
--
--
--
10,0
40,4
8510
,040
,485
1,03
810
,041
,523
Oth
er c
ompr
ehen
sive
inco
me
for t
he ye
ar-
--
--
-(1
58,1
21)
(12,
470)
(5,4
76)
(176
,067
)-
(176
,067
)
Gai
n/lo
ss o
n sa
le o
f equ
ity in
stru
men
ts
class
ified
as
Fair
Valu
e Th
roug
h O
ther
Co
mpr
ehen
sive
Inco
me
(FVO
CI)
--
--
--
(57,
776)
-57
,776
--
-
Inte
rest
on
Tier
1 c
apita
l not
es-
--
--
--
-(5
95,2
84)
(595
,284
)-
(595
,284
)
Div
iden
ds p
aid
--
--
--
--
(2,2
20,7
49)
(2,2
20,7
49)
-(2
,220
,749
)
Dire
ctor
s’ fe
es (r
efer
not
e 35
)-
--
--
--
-(3
1,00
0)(3
1,00
0)-
(31,
000)
Zaka
t-
--
--
--
-(5
0,05
1)(5
0,05
1)-
(50,
051)
Bala
nce
as a
t 31
Dec
embe
r 20
185,
557,
775
(46,
175)
9,47
7,07
612
,270
,124
2,77
8,88
82,
869,
533
(72,
904)
(1,2
31,5
58)
32,4
12,5
3864
,015
,297
9,06
664
,024
,363
In a
ccor
danc
e w
ith th
e M
inis
try
of E
cono
my
inte
rpre
tatio
n, D
irect
ors’
fees
hav
e be
en tr
eate
d as
an
appr
opria
tion
from
equ
ity.
The
atta
ched
not
es 1
to 5
2 fo
rm a
n in
tegr
al p
art o
f the
se G
roup
con
solid
ated
fina
ncia
l sta
tem
ents
.
The
inde
pend
ent a
udito
rs’ r
epor
t on
the
Gro
up c
onso
lidat
ed fi
nanc
ial s
tate
men
ts is
set
out
on
page
s 4
to 8
.
Not
es:
(a)
For
furt
her d
etai
ls re
fer t
o N
ote
24
(b)
For
furt
her d
etai
ls re
fer t
o N
ote
25
(c)
For
furt
her d
etai
ls re
fer t
o N
ote
26

15 16EMIRATES NBD BANK PJSC - GROUP CONSOLIDATED FINANCIAL STATEMENTS - FOR THE YEAR ENDED 31 DECEMBER 2018
NOTES TO THE GROUP CONSOLIDATED FINANCIAL STATEMENTSFOR THE YEAR ENDED 31 DECEMBER 2018
NOTES TO THE GROUP CONSOLIDATED FINANCIAL STATEMENTSFOR THE YEAR ENDED 31 DECEMBER 2018
1 CORPORATE INFORMATION
Emirates NBD Bank PJSC (the “Bank”) was incorporated in the United Arab Emirates on 16 July 2007 consequent to the merger between Emirates Bank International PJSC (“EBI”) and National Bank of Dubai PJSC (“NBD”), under the Commercial Companies Law (Federal Law Number 8 of 1984 as amended) as a Public Joint Stock Company. The Federal Law No. 2 of 2015, concerning Commercial Companies has come into effect from 1 July 2015, replacing the existing Federal Law No. 8 of 1984.
The consolidated financial statements for the year ended 31 December 2018 comprise the financial statements of the Bank and its subsidiaries (together referred to as the “Group”) and the Group’s interest in associates and joint ventures.
The Bank is listed on the Dubai Financial Market (TICKER: “EMIRATESNBD”). The Group’s principal business activities are corporate banking, consumer banking, treasury and Islamic banking. The Bank’s website is www.emiratesnbd.com. For details of activities of subsidiaries, refer to Note 40.
The registered address of the Bank is Post Box 777, Dubai, United Arab Emirates (“UAE”).
The parent company of the Group is Investment Corporation of Dubai, a company in which the Government of Dubai is the majority shareholder.
2 BASIS OF ACCOUNTING
Statement of compliance
The Group consolidated financial statements have been prepared in accordance with International Financial Reporting Standards (IFRS) issued by the International Accounting Standards Board (IASB) and applicable requirements of the laws of the UAE.
The principal accounting policies adopted in the preparation of the Group consolidated financial statements are set out below. These policies have been consistently applied to all years presented, unless otherwise stated.
3 FUNCTIONAL AND PRESENTATION CURRENCY
The presentation currency of the consolidated financial statements is the United Arab Emirates Dirham (AED). The functional currency for a significant proportion of the Group’s assets, liabilities, income and expenses is also AED. However, certain subsidiaries have functional currencies other than AED and the AED is the presentation currency.
4 BASIS OF MEASUREMENT
The Group consolidated financial statements have been prepared under the historical cost basis except for the following:
• derivative financial instruments are measured at fair value;• financial instruments classified as trading and at fair value through profit or loss (FVTPL) are measured
at fair value; • available-for-sale financial assets are measured at fair value (before 1 January 2018);• financial assets at fair value through other comprehensive income (applicable from 1 January 2018);• recognised assets and liabilities that are hedged are measured at fair value in respect of the risk that is
hedged.
The preparation of financial statements in conformity with IFRS requires the use of certain critical accounting estimates. It also requires management to exercise judgment in the process of applying the Group’s accounting policies. The areas involving a higher degree of judgment or complexity, or areas where assumptions and estimates are significant to the Group consolidated financial statements are disclosed in note 5.
5 USE OF JUDGEMENTS AND ESTIMATES
The preparation of the Group consolidated financial statements requires management to make certain estimates and assumptions that affect the reported amount of financial assets and liabilities and the resultant allowances for impairment and fair values. In particular, considerable judgment by management is required in the estimation of the amount and timing of future cash flows when determining the level of allowances required for impaired loans and receivables as well as allowances for impairment provision for unquoted investment securities. Estimates and judgments are continually evaluated and are based on historical experience and other factors including expectations of future events that are believed to be reasonable under the circumstances.
Significant items where the use of estimates and judgments are required are outlined below:
(i) Financial instruments (applicable from 1 January 2018)
Judgements made in applying accounting policies that have most significant effects on the amounts recognized in the consolidated financial statements of the year ended 31 December 2018 pertain to the changes introduced as a result of adoption of IFRS 9: Financial instruments which impact:
• Classification of financial assets: assessment of business model within which the assets are held and assessment of whether the contractual terms of the financial assets are solely payment of principal and interest of the principal amount outstanding.
• Calculation of expected credit loss (ECL): changes to the assumptions and estimation uncertainties
that have a significant impact on ECL for the year ended 31 December 2018 pertain to the changes introduced as a result of adoption of IFRS 9: Financial instruments. The impact is mainly driven by inputs, assumptions and techniques used for ECL calculation under IFRS 9 methodology.

17 18EMIRATES NBD BANK PJSC - GROUP CONSOLIDATED FINANCIAL STATEMENTS - FOR THE YEAR ENDED 31 DECEMBER 2018
NOTES TO THE GROUP CONSOLIDATED FINANCIAL STATEMENTSFOR THE YEAR ENDED 31 DECEMBER 2018
NOTES TO THE GROUP CONSOLIDATED FINANCIAL STATEMENTSFOR THE YEAR ENDED 31 DECEMBER 2018
5 USE OF JUDGEMENTS AND ESTIMATES (CONTINUED)
(i) Financial instruments (continued)
Inputs, assumptions and techniques used for ECL calculation – IFRS9 Methodology (continued)
The Group base case scenario is based on macroeconomic forecasts published by the Group’s Economic Research team and other publicly available data. Upside and downside scenarios are set relative to the Group base case scenario based on reasonably possible alternative macroeconomic conditions. Scenario design, including the identification of additional downside scenarios will occur on at least an annual basis and more frequently if conditions warrant.
Scenarios are probability-weighted according to the Group best estimate of their relative likelihood based on historical frequency and current trends and conditions. Probability weights are updated on a quarterly basis (if required). All scenarios considered are applied to all portfolios subject to ECL with the same probabilities.
Sensitivity assessment due to movement in each macroeconomic variable and the respective weights under the three scenarios is periodically assessed by the Group.
In some instances the inputs and models used for calculating ECLs may not always capture all characteristics of the market at the date of the financial statements. To reflect this, qualitative adjustments or overlays are occasionally made as temporary adjustments when such differences are significantly material. Such cases are subjected to the Group’s Governance process for oversight.
Definition of default
The definition of default used in the measurement of ECL and the assessment to determine movement between stages is consistent with the definition of default used for internal credit risk management purposes. IFRS 9 does not define default, but contains a rebuttable presumption that default has occurred when an exposure is greater than 90 days past due.
Expected Life
When measuring ECL, the Group must consider the maximum contractual period over which the Bank is exposed to credit risk. All applicable contractual terms are considered when determining the expected life, including prepayment options and extension and rollover options. For certain revolving credit facilities that do not have a fixed maturity, the expected life is estimated based on the period over which the Group is exposed to credit risk and where the credit losses would not be mitigated by management actions.
Governance
In addition to the existing risk management framework, the Group has established an internal Committee to provide oversight to the IFRS 9 impairment process. The Committee is comprised of senior representatives from Finance, Risk Management and Economist team and will be responsible for reviewing and approving key inputs and assumptions used in the Group ECL estimates. It also assesses the appropriateness of the overall allowance results to be included in the Group financial statements.
5 USE OF JUDGEMENTS AND ESTIMATES (continued)
(i) Financial instruments (continued)
Inputs, assumptions and techniques used for ECL calculation – IFRS9 Methodology
Key concepts in IFRS 9 that have the most significant impact and require a high level of judgment, as considered by the Group while determining the impact assessment, are:
Assessment of Significant Increase in Credit Risk
The assessment of a significant increase in credit risk is done on a relative basis. To assess whether the credit risk on a financial asset has increased significantly since origination, the Group compares the risk of default occurring over the expected life of the financial asset at the reporting date to the corresponding risk of default at origination, using key risk indicators that are used in the Group’s existing risk management processes.
The Group assessment of significant increases in credit risk is being performed at least quarterly for each individual exposure based on three factors. If any of the following factors indicates that a significant increase in credit risk has occurred, the instrument will be moved from Stage 1 to Stage 2:
1. The Group has established thresholds for significant increases in credit risk based on movement in Probability of Default relative to initial recognition.
2. Additional qualitative reviews have been performed to assess the staging results and make adjustments, as necessary, to better reflect the positions which have significantly increased in risk.
3. IFRS 9 contains a rebuttable presumption that instruments which are 30 days past due have experienced a significant increase in credit risk.
Movements between Stage 2 and Stage 3 are based on whether financial assets are credit-impaired as at the reporting date. The determination of credit-impairment under IFRS 9 will be similar to the individual assessment of financial assets for objective evidence of impairment under IAS 39.
Macroeconomic Factors, Forward Looking Information (FLI) and Multiple Scenarios
The measurement of ECL for each stage and the assessment of significant increases in credit risk considers information about past events and current conditions as well as reasonable and supportable forecasts of future events and economic conditions. The estimation and application of forward-looking information requires significant judgment.
Probability of Default (PD), Loss Given Default (LGD) and Exposure At Default (EAD) inputs used to estimate Stage 1 and Stage 2 credit loss allowances are modelled based on the macroeconomic variables (or changes in macroeconomic variables) such as occupancy rates, housing price index and GDP (where applicable), that are closely correlated with credit losses in the relevant portfolio. Each macroeconomic scenario used in the Group’s ECL calculation will have forecasts of the relevant macroeconomic variables.
The Group estimation of ECL in Stage 1 and Stage 2 is a discounted probability-weighted estimate that considers a minimum of three future macroeconomic scenarios.

19 20EMIRATES NBD BANK PJSC - GROUP CONSOLIDATED FINANCIAL STATEMENTS - FOR THE YEAR ENDED 31 DECEMBER 2018
NOTES TO THE GROUP CONSOLIDATED FINANCIAL STATEMENTSFOR THE YEAR ENDED 31 DECEMBER 2018
NOTES TO THE GROUP CONSOLIDATED FINANCIAL STATEMENTSFOR THE YEAR ENDED 31 DECEMBER 2018
5 USE OF JUDGEMENTS AND ESTIMATES (CONTINUED)
(vi) Impairment loss on investment in associates and jointly controlled entities
Management reviews its share of investments in associates and jointly controlled entities to assess impairment on a regular basis. In determining the assessment, management compares the recoverable amount with the carrying value of the investment. Estimating recoverable amount using value in use requires the Group to make an estimate of the expected future cash flows from the associates and jointly controlled entities and choosing a suitable discount rate in order to calculate the present value of those cash flows.
(vii) Contingent liability arising from litigations
Due to the nature of its operations, the Group may be involved in litigations arising in the ordinary course of business. Provision for contingent liabilities arising from litigations is based on the probability of outflow of economic resources and reliability of estimating such outflow. Such matters are subject to many uncertainties and the outcome of individual matters is not predictable with assurance.
Estimates and underlying assumptions are reviewed on an ongoing basis. Revisions to estimates are applied prospectively.
6 CHANGES IN ACCOUNTING POLICIES
The Group has consistently applied the accounting policies as set out in note 7 to all periods presented in these consolidated financial statements, except for the following accounting policies which are applicable from 1 January 2018:
(a) IFRS 9 Financial Instruments
The Group has adopted IFRS 9 Financial Instruments issued in July 2014 with a date of initial application of 1 January 2018. The requirements of IFRS 9 represents a significant change from IAS 39 Financial Instruments: Recognition and Measurement. The new standard brings fundamental changes to the accounting for financial assets and to certain aspects of the accounting for financial liabilities.
(i) Classification of financial assets and financial liabilities
On initial recognition, a financial asset is classified as measured: at amortised cost, FVOCI or FVTPL.
A financial asset is measured at amortised cost if it meets both the following conditions and is not designated as at FVTPL:
• the asset is held within a business model whose objective is to hold assets to collect contractual cash flows; and
• the contractual terms of the financial asset give rise on specified dates to cash flows that are solely payments of principal and interest on the principal amount outstanding.
5 USE OF JUDGEMENTS AND ESTIMATES (CONTINUED)
(ii) Allowances for impairment of loans and receivables and Islamic financing receivables (applicable before 1 January 2018)
The Group reviews its loans and receivables portfolio and Islamic financing receivables to assess impairment on a regular basis. In determining whether an impairment loss should be recorded in the income statement, the Group makes judgments as to whether there is any observable data indicating that there is a measurable decrease in the contractual future cash flows from a loan or homogenous group of loans or Islamic financing receivables. The methodology and assumptions used for estimating both the amount and timing of future cash flows are reviewed regularly to reduce any differences between loss estimates and actual loss.
In addition to specific allowance against individually significant loans and receivables and Islamic financing receivables, the Group also makes a collective impairment allowance to recognise that at any reporting date, there will be an amount of loans and receivables and Islamic financing receivables which are impaired even though a specific trigger point for recognition of the loss has not yet been evidenced (known as the “emergence period’).
(iii) Impairment of available-for-sale investment securities (applicable before 1 January 2018)
The Group determines the impairment of available-for-sale equity securities when there has been a significant or prolonged decline in the fair value below its cost. This determination of what is significant or prolonged requires judgment. In making this judgment, the Group evaluates several market and non-market factors.
(iv) Fair value of financial instruments
Where the fair values of financial assets and financial liabilities recorded in the statement of financial position cannot be derived from quoted prices, they are determined using a variety of valuation techniques that include the use of mathematical models. The input to these models is taken from observable market data where possible, but where this is not possible, a degree of judgment is required in establishing fair values. The judgments include consideration of liquidity and model inputs such as correlation and volatility for longer dated derivatives.
Fair values are subject to a control framework designed to ensure that they are either determined or validated, by a function independent of the risk taker.
(v) Impairment of goodwill
On an annual basis, the Group determines whether goodwill is impaired. This requires an estimation of the recoverable amount using value in use of the cash generating units to which the goodwill is allocated. Estimating the value in use requires the Group to make an estimate of the expected future cash flows from the cash generating units and also to choose a suitable discount rate in order to calculate the present value of those cash flows.

21 22EMIRATES NBD BANK PJSC - GROUP CONSOLIDATED FINANCIAL STATEMENTS - FOR THE YEAR ENDED 31 DECEMBER 2018
NOTES TO THE GROUP CONSOLIDATED FINANCIAL STATEMENTSFOR THE YEAR ENDED 31 DECEMBER 2018
NOTES TO THE GROUP CONSOLIDATED FINANCIAL STATEMENTSFOR THE YEAR ENDED 31 DECEMBER 2018
6 CHANGES IN ACCOUNTING POLICIES (CONTINUED)
(a) IFRS 9 Financial Instruments (continued)
(i) Classification of financial assets and financial liabilities (continued)
Assessment whether contractual cash flows are solely payments of principal and interest:
For the purposes of this assessment, ‘principal’ is defined as the fair value of the financial asset on initial recognition. ’Interest’ is defined as consideration for the time value of money and for the credit risk associated with the principal amount outstanding during a particular period of time and for other basic lending risks and costs (e.g. liquidity risk and administrative costs), as well as profit margin.
In assessing whether the contractual cash flows are solely payments of principal and interest, the Group considers the contractual terms of the instrument. This includes assessing whether the financial asset contains a contractual term that could change the timing or amount of contractual cash flows such that it would not meet this condition. In making the assessment, the Group considers:
• contingent events that would change the amount and timing of cash flows;• leverage features;• prepayment and extension terms;• terms that limit the Group’s claim to cash flows from specified assets (e.g. non-recourse asset
arrangements); and• features that modify consideration of the time value of money – e.g. periodical reset of interest
rate.
Reclassifications:
Financial assets are not reclassified subsequent to their initial recognition, except in the period after the Group changes its business model for managing financial assets.
Derecognition:
Any cumulative gain/loss recognised in OCI in respect of equity investment securities designated as FVOCI is not recognised in profit or loss account on derecognition of such securities.
(ii) Impairment
The Group recognises loss allowances for ECL on the following financial instruments that are not measured at FVTPL:
• financial assets that are debt instruments;• financial guarantee contracts issued; and• loan commitments issued.
6 CHANGES IN ACCOUNTING POLICIES (CONTINUED)
(a) IFRS 9 Financial Instruments (continued)
(i) Classification of financial assets and financial liabilities (continued)
A debt instrument is measured at FVOCI only if it meets both of the following conditions and is not designated as at FVTPL:
• the asset is held within a business model whose objective is achieved by both collecting contractual cash flows and selling financial assets; and
• the contractual terms of the financial asset give rise on specified dates to cash flows that are solely payments of principal and interest on the principal amount outstanding.
On initial recognition of an equity investment that is not held for trading, the Group may irrevocably elect to present subsequent changes in fair value in other comprehensive income (OCI). This election is made on an investment-by-investment basis.
All other financial assets are classified as measured at FVTPL.
In addition, on initial recognition, the Group may irrevocably designate a financial asset that otherwise meets the requirements to be measured at amortised cost or at FVOCI as at FVTPL if doing so eliminates or significantly reduces an accounting mismatch that would otherwise arise.
Business model assessment:
The Group makes an assessment of the objective of a business model in which an asset is held at a portfolio level as this best reflects the way the business is managed and information is provided to management. The information considered includes:
• the stated policies and objectives for the portfolio and the operation of those policies in practice. In particular, whether management’s strategy focuses on earning contractual interest revenue, maintaining a particular interest rate profile, matching the duration of the financial assets to the duration of the liabilities that are funding those assets or realizing cash flows through the sale of the assets;
• how the performance of the portfolio is evaluated and reported to the Group’s management;• the risks that affect the performance of the business model (and the financial assets held within
that business model) and how those risks are managed;• how managers of the business are compensated – e.g. whether compensation is based on the
fair value of the assets managed or the contractual cash flows collected; and• the frequency, volume and timing of sales in prior periods, the reasons for such sales and its
expectations about the future sales activity. However, information about sales activity is not considered in isolation, but as part of an overall assessment of how the Group’s stated objective for managing the financial assets is achieved and how cash flows are realised.
Financial assets that are held for trading or managed and whose performance is evaluated on a fair value basis are measured at FVTPL because they are neither held to collect contractual cash flows nor held both to collect contractual cash flows and to sell financial assets.

23 24EMIRATES NBD BANK PJSC - GROUP CONSOLIDATED FINANCIAL STATEMENTS - FOR THE YEAR ENDED 31 DECEMBER 2018
NOTES TO THE GROUP CONSOLIDATED FINANCIAL STATEMENTSFOR THE YEAR ENDED 31 DECEMBER 2018
NOTES TO THE GROUP CONSOLIDATED FINANCIAL STATEMENTSFOR THE YEAR ENDED 31 DECEMBER 2018
6 CHANGES IN ACCOUNTING POLICIES (CONTINUED)
(a) IFRS 9 Financial Instruments (continued)
(ii) Impairment (continued)
Evidence that a financial asset is credit-impaired includes the following observable data:• significant financial difficulty of the borrower or issuer;• a breach of contract such as a default or past due event;• the restructuring of a loan or advance by the Group on terms that the Group would not consider
otherwise;• it is becoming probable that the borrower will enter bankruptcy or other financial reorganization;
or• the disappearance of an active market for a security because of financial difficulties.
Purchased or originated credit impaired assets (POCI)
POCI assets are financial assets that are credit impaired on initial recognition. POCI assets are recorded at fair value at original recognition and interest income is subsequently recognised based on a credit-adjusted EIR. Life time ECLs are only recognised or released to the extent that there is a subsequent change in the ECL.
Revolving facilities
The Group’s product offering includes a variety of corporate and retail overdraft and credit cards facilities, in which the Group has the right to cancel and/or reduce the facilities at a short notice. The Group does not limit its exposure to credit losses to the contractual notice period, but, instead calculates ECL over a period that reflects the Group’s expectations of the customer behaviour, its likelihood of default and the Group’s future risk mitigation procedures, which could include reducing or cancelling the facilities.
Based on past experience and the Group’s expectations, the period over which the Group calculates ECLs for these products, is estimated based on the period over which the Group is exposed to credit risk and where the credit losses would not be mitigated by management actions.
Write-off
Loans and debt securities are written off (either partially or in full) when there is no realistic prospect of recovery. This is generally the case when the Group has exhausted all legal and remedial efforts to recover from the customers. However, financial assets that are written off could still be subject to enforcement activities in order to comply with the Group’s procedures for recovery of amounts due.
(iii) Financial guarantees and loan commitments
Financial guarantees are contracts that require the Group to make specified payments to reimburse the holders for a loss they incur because a specified debtor fails to make payment when due, in accordance with the terms of a debt instrument. The financial guarantee liability is carried at amortised cost when payment under the contract has become probable.
‘Loans commitments’ are firm irrevocable commitments to provide credit under pre-specified terms and conditions.
6 CHANGES IN ACCOUNTING POLICIES (CONTINUED)
(a) IFRS 9 Financial Instruments (continued)
(ii) Impairment (continued)
No impairment loss is recognised on equity investments.
The Group measures loss allowances at an amount equal to lifetime ECL, except for the financial instruments on which credit risk has not increased significantly since their initial recognition.
12-month ECL are the portion of life time ECL that result from default events on a financial instrument that are possible within the 12 months after reporting date.
Measurement of ECL
ECL are probability-weighted estimate of credit losses. They are measured as follows:
• financial assets that are not credit-impaired at the reporting date: as the present value of all cash shortfalls (i.e. the difference between the cash flows due to the entity in accordance with the contract and the cash flows that the Group expects to receive);
• financial assets that are credit-impaired at the reporting date: as the difference between the gross carrying amount and the present value of estimated future cash flows;
• undrawn loan commitments: as the present value of the difference between the contractual cash flows that are due to the Group if the commitment is drawn down and the cash flows that the Group expects to receive; and
• financial guarantee contracts: the expected payments to reimburse the holder less any amounts that the Group expects to recover.
Restructured financial assets
If the terms of a financial asset are renegotiated or modified or an existing financial asset is replaced with a new one due to financial difficulties of the borrower, then an assessment is made of whether the financial asset should be derecognized and ECL are measured as follows:
• If the expected restructuring will not result in derecognition of the existing asset, then the expected cash flows arising from the modified financial asset are included in calculating the cash shortfalls from the existing asset.
• If the expected restructuring will result in derecognition of the existing asset, then the expected fair value of the new asset is treated as the final cash flow from the existing financial asset at the time of its derecognition. This amount is included in calculating the cash shortfalls from the existing financial asset. The cash shortfalls are discounted from the expected date of derecognition to the reporting date using the original effective interest rate of the existing financial asset.
Credit-impaired financial assets
At each reporting date, the Group assesses whether financial assets carried at amortised cost and debt financial assets carried at FVOCI are credit-impaired. A financial asset is ‘credit-impaired’ when one or more events that have a detrimental impact on the estimated future cash flows of the financial asset have occurred.

25 26EMIRATES NBD BANK PJSC - GROUP CONSOLIDATED FINANCIAL STATEMENTS - FOR THE YEAR ENDED 31 DECEMBER 2018
NOTES TO THE GROUP CONSOLIDATED FINANCIAL STATEMENTSFOR THE YEAR ENDED 31 DECEMBER 2018
NOTES TO THE GROUP CONSOLIDATED FINANCIAL STATEMENTSFOR THE YEAR ENDED 31 DECEMBER 2018
6 CHANGES IN ACCOUNTING POLICIES (CONTINUED)
(a) IFRS 9 Financial Instruments (continued)
(v) Foreign currencies
Foreign currency differences arising on translation are generally recognized in profit or loss. However, foreign currency differences arising from the translation of equity investments in respect of which an election has been made to present subsequent changes in fair value in OCI are recognised through OCI.
(vi) Loans and advances
‘Loans and advances’ captions in the statement of financial position include:
• Loans and advances measured at amortised cost: they are initially measured at fair value plus incremental direct transaction costs, and subsequently at their amortised cost using the effective interest method; and
• Loans and advances measured at FVTPL or designated as at FVTPL: these are measured at fair value with changes recognised immediately in profit or loss, if applicable.
When the Group purchases a financial asset and simultaneously enters into an agreement to resell the asset (or a substantially similar asset) at a fixed price on a future date (reverse repo or stock borrowing), the arrangement is accounted for as a loan or advance or due from banks, and the underlying asset is not recognised in the Group’s financial statements.
(vii) Investment securities
The ‘investment securities’ caption in the statement of financial position includes:
• debt investment securities measured at amortised cost: these are initially measured at fair value plus incremental direct transaction costs, and subsequently at their amortised cost using the effective interest method;
• debt and equity investment securities measured at FVTPL or designated as at FVTPL: these are at fair value with changes recognised immediately in profit or loss;
• debt securities measured at FVOCI; and• equity investment securities designated as FVOCI.
For debt securities measured at FVOCI, gains and losses are recognised in OCI, except for the following, which are recognised in profit or loss in the same manner as for financial assets measured at amortised cost.
• Interest revenue using the effective interest method;• ECL and reversals; and• Foreign exchange gains and losses.
When debt security measured at FVOCI is derecognised, the cumulative gain or loss previously recognised in OCI is reclassified from equity to profit or loss.
6 CHANGES IN ACCOUNTING POLICIES (CONTINUED)
(a) IFRS 9 Financial Instruments (continued)
(iii) Financial guarantees and loan commitment (continued) Financial guarantees issued or irrevocable commitments to provide credit are initially measured at
fair value and their initial fair value is amortised over the life of the guarantee or the commitment. Subsequently, they are measured at the higher of this amortised amount and the amount of loss allowance.
(iv) Derivatives and hedging
IFRS 9 introduces a new hedge accounting model that expands the scope of hedged items and risks eligible for hedge accounting and aligns hedge accounting more closely with risk management. The new model no longer specifies quantitative measures for effectiveness testing and does not permit hedge de-designation. As a result the 80-125% range under IAS 39 is replaced by an objectives-based test that focuses on the economic relationship between the hedged item and the hedging instrument, and the effect of credit risk on that economic relationship.
IFRS 9 also introduces rebalancing of hedging relationships, whereby, if a hedging relationship ceases to meet the hedge effectiveness requirement relating to the hedge ratio under IFRS 9, but the risk management objective for that designated hedging relationship remains the same, the Group shall adjust the hedge ratio of the hedging relationship so that it meets the qualifying criteria again.
Gains and losses arising from changes in the fair value of derivatives that are not the hedging instrument in a qualifying hedge are recognised as they arise in profit or loss. Gains and losses are recorded in ‘income from trading activities’ except for gains and losses on those derivatives that are managed together with financial instruments designated at fair value; these gains and losses are included in ‘other operating income’.
An embedded derivative is a component of a hybrid instrument that also includes a non-derivative host contract with the effect that some of the cash flows of the combined instrument vary in a way similar to a stand-alone derivative. An embedded derivative causes some or all of the cash flows that otherwise would be required by the contract to be modified according to a specified interest rate, financial instrument price, commodity price, foreign exchange rate, index of prices or rates, credit rating or credit index, or other variable, provided that, in the case of a non-financial variable, it is not specific to a party to the contract. A derivative that is attached to a financial instrument, but is contractually transferable independently of that instrument, or has a different counterparty from that instrument, is not an embedded derivative, but a separate financial instrument.
From 1 January 2018, with the introduction of IFRS 9, the Group has taken the aforementioned approach to account for derivatives embedded in financial liabilities and non-financial host contracts. Financial assets are classified based on the business model and SPPI assessments as outlined in Note 6 (a)(i).
27 28EMIRATES NBD BANK PJSC - GROUP CONSOLIDATED FINANCIAL STATEMENTS - FOR THE YEAR ENDED 31 DECEMBER 2018
NOTES TO THE GROUP CONSOLIDATED FINANCIAL STATEMENTSFOR THE YEAR ENDED 31 DECEMBER 2018
NOTES TO THE GROUP CONSOLIDATED FINANCIAL STATEMENTSFOR THE YEAR ENDED 31 DECEMBER 2018
6 CHANGES IN ACCOUNTING POLICIES (CONTINUED)
(b) IFRS 15 Revenue from contracts with customers (continued)
The Group also operates a rewards programme which allows customers to accumulate points when they purchase products on the Group’s credit cards. The points can then be redeemed for shopping rewards, cash back or air miles, subject to a minimum number of points being obtained.
The core principle of IFRS 15 is that an entity recognizes revenue as it transfers the promised goods or services to customers in an amount that reflects the consideration to which the entity expects to be entitled in exchange for those goods or services.
IFRS 15 also includes a comprehensive set of disclosure requirements that will result in an entity providing users of financial statements with comprehensive information about the nature, amount, timing and uncertainty of revenue and cash flows arising from the entity’s contracts with customers.
The Group has assessed that the impact of IFRS 15 is not material on the consolidated financial statements of the Group as at the adoption date and the reporting date.
7 SIGNIFICANT ACCOUNTING POLICIES
The Group has consistently applied the following accounting policies to all periods presented in these Group consolidated financial statements, except for the changes explained in note 6.
(a) Principles of consolidation
(i) Subsidiaries
Subsidiaries are all entities (including structured entities) over which the Group has control.
The Group controls an entity when the Group is exposed to, or has rights to, variable returns from its involvement with the entity and has the ability to affect those returns through its power over the entity.
The Group re-assesses whether or not it controls an investee if facts and circumstances indicate that there are changes to one or more of the three elements of control. Subsidiaries are consolidated from the date of acquisition, being the date on which the Group obtains control, and continue to be consolidated until the date that such control ceases.
The list of the Group’s subsidiary companies is shown in Note 40.
Basis of consolidation
The Group consolidated financial statements comprise the financial statements of the Bank and its subsidiaries as at the end of the reporting period. The financial statements of the subsidiaries used in the preparation of the Group consolidated financial statements are prepared for the same reporting date as the Bank with the exception of Emirates NBD Capital PSC, an insignificant subsidiary, whose year end is 31 March and hence the Group uses their reviewed 12 months accounts as at 31 December. Consistent accounting policies are applied to like transactions and events in similar circumstances.
6 CHANGES IN ACCOUNTING POLICIES (CONTINUED)
(a) IFRS 9 Financial Instruments (continued)
(vii) Investment securities (continued)
The Group elects to present in OCI changes in the fair value of certain investments in equity instruments that are not held for trading. The election is made on an instrument-by-instrument basis on initial recognition and is irrevocable.
Gains and losses on such equity instruments are never reclassified to profit or loss and no impairment is recognised in profit or loss. Dividends are recognised in profit or loss unless they clearly represent a recovery of part of the cost of the investment, in which case they are recognised in OCI. Cumulative gains and losses on equity instruments recognised in OCI are transferred to retained earnings on disposal of an investment.
(viii) Transition
Changes in accounting policies resulting from the adoption of IFRS 9 have been applied retrospectively, except as described below:
• Comparative periods have not been restated. Differences in the carrying amounts of financial assets and financial liabilities resulting from the adoption of IFRS 9 are recognised in retained earnings and reserves as at 1 January 2018. Accordingly, the information presented for 2017 does not reflect the requirements of IFRS 9 and therefore not comparable to the information presented for 2018 under IFRS 9.
• The following assessments have been made on the basis of the facts and circumstances that existed at the date of initial application.
o The determination of the business model within which a financial asset is held;o The designation and revocation or previous designations of certain financial assets and
financial liabilities as measured at FVTPL; ando The designation of certain investments in equity instruments not held for trading as FVOCI.
For more information and details on the changes and implications resulting from the adoption of IFRS 9, see Note 45.
(b) IFRS 15 Revenue from contracts with customers
This standard on revenue recognition replaces IAS 11, ‘Construction contracts’, and IAS 18,’Revenue’ and related interpretations.
IFRS 15 is more prescriptive, provides detailed guidance on revenue recognition and reduces the use of judgment in applying revenue recognition policies and practices as compared to the replaced IFRS and related interpretations.
Revenue is recognized when a customer obtains control of a good or service. A customer obtains control when it has the ability to direct the use of and obtain the benefits from the good or service.

29 30EMIRATES NBD BANK PJSC - GROUP CONSOLIDATED FINANCIAL STATEMENTS - FOR THE YEAR ENDED 31 DECEMBER 2018
NOTES TO THE GROUP CONSOLIDATED FINANCIAL STATEMENTSFOR THE YEAR ENDED 31 DECEMBER 2018
NOTES TO THE GROUP CONSOLIDATED FINANCIAL STATEMENTSFOR THE YEAR ENDED 31 DECEMBER 2018
7 SIGNIFICANT ACCOUNTING POLICIES (CONTINUED)
(a) Principles of consolidation (continued)
(ii) Special Purpose Entities
Special Purpose Entities (SPEs) are entities that are created to accomplish a well-defined objective such as the securitisation of particular assets, or the execution of a specific borrowing or lending transaction. An SPE is consolidated if the Group is exposed to variable returns from its involvement in the SPE and has the ability to affect those returns through its power over the SPE based on an evaluation of the substance of its relationship with the Group.
The following circumstances may indicate a relationship in which, in substance, the Group controls and consequently consolidates an SPE:
a. the Group has power over the SPE;b. the Group has exposure to, or rights, to variable returns from its involvement with the SPE; andc. the Group has the ability to use its power over the SPE to affect the amount of the Group’s
returns.
The assessment of whether the Group has control over an SPE is carried out at inception and reassessed at each period end date.
Information about the Group’s securitisation activities is set out in Note 14.
(iii) Fund Management
The Group manages and administers funds on behalf of investors. The financial statements of these funds are not included in these consolidated financial statements. Information about the Group’s fund management activity is set out in Note 48.
(iv) Fiduciary activities
Assets held in trust or in a fiduciary capacity are not treated as assets of the Group and, accordingly, are not included in these Group consolidated financial statements.
(v) Transactions with non-controlling interests
Non-controlling interest represents the equity in subsidiaries not attributable, directly or indirectly, to owners of the Bank and is presented separately in the Group consolidated statement of comprehensive income and within equity in the Group consolidated balance sheet, separately from equity attributable to owners of the Bank.
Changes in the Group’s ownership interest in a subsidiary that do not result in a loss of control are accounted for as equity transactions. In such circumstances, the carrying amounts of the controlling and non-controlling interests are adjusted to reflect the changes in their relative interests in the subsidiary. Any difference between the amount by which the non-controlling interest is adjusted and the fair value of the consideration paid or received is recognised directly in equity and attributed to owners of the Group.
7 SIGNIFICANT ACCOUNTING POLICIES (CONTINUED)
(a) Principles of consolidation (continued)
(i) Subsidiaries (continued)
Basis of consolidation (continued)
All intra-group balances, income and expenses and unrealised gains and losses resulting from intra-group transactions are eliminated.
Business combinations are accounted for by applying the acquisition method. Identifiable assets acquired and liabilities assumed in a business combination are measured initially at their fair values at the acquisition date. Acquisition-related costs are recognised as expenses in the periods in which the costs are incurred and the services are received.
When the Group acquires a business, it assesses the financial assets and liabilities assumed for appropriate classification and designation in accordance with the contractual terms, economic circumstances and pertinent conditions as at the acquisition date. This includes the separation of embedded derivatives in host contracts by the acquiree.
Any contingent consideration to be transferred by the acquirer will be recognised at fair value at the acquisition date.
Subsequent changes to the fair value of the contingent consideration which is deemed to be an asset or liability will be recognised in accordance with IFRS 9 in profit or loss. If the contingent consideration is classified as equity, it is not remeasured until it is finally settled within equity.
In business combinations achieved in stages, previously held equity interests in the acquiree are restated to fair value at the acquisition date and any corresponding gain or loss is recognised in profit or loss.
The Group elects for each individual business combination, whether non-controlling interest in the
acquiree (if any) is recognised on the acquisition date at fair value, or at the non-controlling interest’s proportionate share of the acquiree’s identifiable net assets.
Any excess of the sum of the fair value of the consideration transferred in the business combination, the amount of non-controlling interest in the acquiree (if any), and the fair value of the Group’s previously held equity interest in the acquiree (if any), over the net fair value of the acquiree’s identifiable assets and liabilities is recorded as goodwill. The accounting policy for goodwill is set out in Note 7 (t). In instances where the latter amount exceeds the former, the excess is recognised as gain on bargain purchase in profit or loss on the acquisition date.
Upon the loss of control, the Group derecognises the assets and liabilities of the subsidiary, any non-controlling interests and the other components of equity related to the subsidiary. Any surplus or deficit arising on the loss of control is recognised in profit or loss. If the Group retains any interest in the previous subsidiary, then such interest is measured at fair value at the date that control is lost. Subsequently it is accounted for as an equity-accounted investee or in accordance with the Group’s accounting policy for financial instruments depending on the level of influence retained.

31 32EMIRATES NBD BANK PJSC - GROUP CONSOLIDATED FINANCIAL STATEMENTS - FOR THE YEAR ENDED 31 DECEMBER 2018
NOTES TO THE GROUP CONSOLIDATED FINANCIAL STATEMENTSFOR THE YEAR ENDED 31 DECEMBER 2018
NOTES TO THE GROUP CONSOLIDATED FINANCIAL STATEMENTSFOR THE YEAR ENDED 31 DECEMBER 2018
7 SIGNIFICANT ACCOUNTING POLICIES (CONTINUED)
(a) Principles of consolidation (continued)
(vii) Associates (continued)
After application of the equity method, the Group determines whether it is necessary to recognise an additional impairment loss on the Group’s investment in its associates. The Group determines at each balance sheet date whether there is any objective evidence that the investment in the associate is impaired. If this is the case, the Group calculates the amount of impairment as the difference between the recoverable amount of the associate and its carrying value and recognises the amount in the profit or loss.
The financial statements of the associates are prepared as of the same reporting date as for the
Group. Where necessary, adjustments are made in the Group financial statements to align the accounting policies of the Associates in line with those of the Group.
Upon loss of significant influence over the associate, the Group measures any retained investment at its fair value.
Any difference between the carrying amount of the associate upon loss of significant influence and
the fair value of the aggregate of the retained investment and proceeds from disposal is recognised in profit or loss.
(b) Foreign currencies Monetary items denominated in foreign currencies are retranslated at the rates prevailing at the reporting date. The resulting gain / loss on monetary items is taken to the ‘Other operating income’ in the income statement. Non-monetary items carried at fair value that are denominated in foreign currencies are retranslated at the rates prevailing at the date when the fair value was determined. Non-monetary items that are measured in terms of historical cost in a foreign currency are not retranslated.
In the Group consolidated financial statements, assets and liabilities in foreign operations are translated into UAE Dirhams at rates of exchange ruling at the reporting date, and the resulting gains and losses are taken to the Group consolidated translation reserve.
Any goodwill arising on the acquisition of a foreign operation and any fair value adjustments to the carrying amounts of assets and liabilities arising on the acquisition are treated as assets and liabilities of the foreign operation and translated at the exchange rate at the reporting date.
Forward exchange contracts are valued at market rates applicable to their respective maturities.
Exchange differences arising from the translation of the net investment in overseas operations are taken directly to currency translation reserve.
Foreign currency differences arising on translation are generally recognized in profit or loss. However, foreign currency differences arising from the translation of the following are recognized in OCI:
• Qualifying cash flow hedges to the extent that the hedge is effective.
7 SIGNIFICANT ACCOUNTING POLICIES (CONTINUED)
(a) Principles of consolidation (continued)
(vi) Joint Ventures
The Group has interests in joint ventures which are jointly controlled entities. A joint venture is a contractual arrangement whereby two or more parties undertake an economic activity that is subject to joint control.
The consolidated financial statements include the Group’s share of the total recognised gains and losses of its jointly controlled entities on an equity accounted basis, from the date that joint control commences until the date that joint control ceases. When the Group’s share of losses exceeds the carrying amount of the investment, the investment is reported as nil and recognition of losses is discontinued except to the extent of the Group’s commitment (if any).
The carrying amounts of the jointly controlled entities are reviewed at each balance sheet date to determine whether there is any indication of impairment. If such indication exists, the recoverable amount is estimated and an impairment loss is recognised whenever the carrying amount exceeds the recoverable amount. The impairment loss is charged to income statement.
Upon loss of joint control, the Group measures any retained investment at its fair value. Any difference between the carrying amount of the former joint venture entity upon loss of joint venture control and the aggregate of the fair value of the retained investment and proceeds from disposal is recognised in the income statement.
(vii) Associates
Associates are the entities over which the Group has significant influence but not control, generally accompanying a shareholding of over 20% of the voting rights, not being a subsidiary or a joint venture.
An associate is equity accounted for from the date the Group obtains significant influence until the date the Group ceases to have significant influence over the associate.
Under the equity method, the investment in associate is measured in the balance sheet at cost plus post-acquisition changes in the Group’s share of net assets of the associate.
The profit or loss reflects the share of the results of operations of the associates. Where there has been a change recognised in other comprehensive income by the associates, the Group recognises its share of such changes in other comprehensive income. Unrealised gains and losses resulting from transactions between the Group and the associate are eliminated to the extent of the interest in the associates.
The Group’s share of the profit or loss of its associates is shown on the face of the consolidated income statement.
When the Group’s share of losses in an associate equals or exceeds its interest in the associate, the Group does not recognise further losses, unless it has incurred obligations or made payments on behalf of the associate.

33 34EMIRATES NBD BANK PJSC - GROUP CONSOLIDATED FINANCIAL STATEMENTS - FOR THE YEAR ENDED 31 DECEMBER 2018
NOTES TO THE GROUP CONSOLIDATED FINANCIAL STATEMENTSFOR THE YEAR ENDED 31 DECEMBER 2018
NOTES TO THE GROUP CONSOLIDATED FINANCIAL STATEMENTSFOR THE YEAR ENDED 31 DECEMBER 2018
7 SIGNIFICANT ACCOUNTING POLICIES (CONTINUED)
(c) Interest (continued)
Presentation
Interest income and expense presented in the income statement include:
• interest on financial assets and financial liabilities measured at amortised cost calculated on an effective interest basis;
• interest on debt instruments measured at FVOCI calculated on an effective interest basis;• the effective portion of fair value changes in qualifying hedging derivatives designated in cash flow
hedges of variability in interest cash flows, in the same period as the hedged cash flows affect interest income/expense; and
• the effective portion of fair value changes in qualifying hedging derivatives designated in fair value hedges of interest rate risk.
(d) Fees and commission
Fee income, which is not an integral part of the effective interest rate of a financial instrument, is earned from a diverse range of services provided by the Group to its customers, and are accounted for in accordance with IFRS 15 ‘Revenue from Contracts with Customers’. Under the IFRS 15, fee income is measured by the Group based on the consideration specified in a contract with a customer and excludes amounts collected on behalf of third parties. The Group recognises revenue when it transfers control over a product or service to a customer.
Fee income is accounted for as follows:
(i) income earned on the execution of a significant act is recognised as revenue when the act is completed (for example, fees arising from negotiating, or participating in the negotiation of a transaction for a third-party, such as an arrangement for the acquisition of shares or other securities);
(ii) income earned from the provision of services is recognised as revenue as the services are provided (for example, asset management, portfolio and other management advisory and service fees); and
(iii) Other fees and commission income and expense are recognised as the related services are performed or received.
Fee income which forms an integral part of the effective interest rate of a financial instrument is recognised as an adjustment to the effective interest rate (for example, certain loan commitment fees) and recorded in ‘Interest income’.
(e) Net trading income
‘Net trading income’ comprises gains less losses to trading assets and liabilities, and includes all fair value changes, dividends and foreign exchange differences.
(f) Dividend income
Dividend income is recognised when the Group’s right to receive the dividend is established.
7 SIGNIFICANT ACCOUNTING POLICIES (CONTINUED)
(c) Interest
Effective interest rate
Interest income and expense are recognised in profit or loss using the effective interest method. The ‘effective interest rate’ is the rate that exactly discounts estimated future cash payments or receipts through the expected life of the financial instrument to:
• the gross carrying amount of the financial asset; or • the amortised cost of the financial liability.
When calculating the effective interest rate for financial instruments other than credit-impaired assets, the Group estimates future cash flows considering all contractual terms of the financial instrument, but not ECL. For credit-impaired financial assets, a credit-adjusted effective interest rate is calculated using estimated future cash flows including ECL.
The calculation of the effective interest rate includes transaction costs and fees that are an integral part of the effective interest rate. Transaction costs include incremental costs that are directly attributable to the acquisition or issue of a financial asset or financial liability.
Amortised cost
The ‘amortised cost’ of a financial asset or financial liability is the amount at which the financial asset or financial liability is measured at initial recognition minus the principal repayments, plus or minus the cumulative amortization of the difference between the initial amount and the maturity amount using the effective interest method and, for financial assets, adjusted for any loss allowance.
Gross carrying amount
The ‘gross carrying amount of a financial asset’ is the amortised cost of a financial asset before adjusting any loss allowance.
Calculation of interest income and expense
In calculating interest income and expense, the effective interest rate is applied to the gross carrying amount of the asset (when the asset is not credit-impaired) or to the amortised cost of the liability.
However, for financial assets that have become credit-impaired subsequent to initial recognition, interest income is calculated by applying the effective interest rate to the amortised cost (as explained above) of the financial asset. If the financial asset is no longer credit-impaired, then the calculation of interest income reverts to the gross carrying amount (as explained above).
For the financial assets that were credit-impaired on initial recognition, interest income is calculated by applying the credit-adjusted effective interest rate to the amortised cost (as explained above) of the financial asset. The calculation of interest income does not revert to a gross carrying amount (as explained above), even if the credit risk of the asset improves.
For policy on when financial assets are credit-impaired after 1 January 2018, see Note 6(a)(ii).

35 36EMIRATES NBD BANK PJSC - GROUP CONSOLIDATED FINANCIAL STATEMENTS - FOR THE YEAR ENDED 31 DECEMBER 2018
NOTES TO THE GROUP CONSOLIDATED FINANCIAL STATEMENTSFOR THE YEAR ENDED 31 DECEMBER 2018
NOTES TO THE GROUP CONSOLIDATED FINANCIAL STATEMENTSFOR THE YEAR ENDED 31 DECEMBER 2018
7 SIGNIFICANT ACCOUNTING POLICIES (CONTINUED)
(j) Financial assets and financial liabilities (continued)
(ii) Classification
The policy applicable from 1 January 2018 (due to application of IFRS 9) is described in note 6.
The Group classified its financial assets into one of the following categories:• loans and receivables;• held to maturity;• available-for-sale;• at FVTPL, and within this category as:
o held for trading; oro designated as at FVTPL.
See note on Investment Securities, Loans and advances and Cash and cash equivalents for further details.
The Group classifies its financial liabilities, other than financial guarantees and loan commitments, as measured at amortised cost or FVTPL.
The Group classifies financial liabilities as held for trading when they have issued primarily for short term profit making through trading activities or form part of a portfolio of financial instruments that are managed together for which there is evidence of a recent pattern of short-term profit taking. Gains and losses arising from changes in fair values are included in the consolidated income statement in the year in which they arise.
(iii) Derecognition
The Group derecognises a financial asset when the contractual rights to the cash flows from the financial asset expires, or it transfers the rights to receive the contractual cash flows in a transaction in which substantially all of the risks and rewards of the ownership of the financial asset are transferred or in which the Group neither transfers nor retains substantially all of the risks and rewards or ownership and it does not retain control of the financial asset.
On derecognition of a financial asset, the difference between the carrying amount of the asset (or the carrying amount allocated to the portion of the asset derecognised) and the sum of (i) the consideration received (including any new asset obtained less any new liability assumed) and (ii) any cumulative gain or loss that had been recognised in OCI is recognised in profit or loss.
Any interest in transferred financial assets that qualify for derecogniton that is created or retained by the Group is recognised as a separate asset or liability.
The Group enters into transactions whereby it transfers assets recognised on its statement of financial position, but retains either all or substantially all of the risks and rewards of the transferred assets or a portion of them. In such cases, the transferred assets are not derecognised. Examples of such transactions are securities lending and sale-and-repurchase transactions.
7 SIGNIFICANT ACCOUNTING POLICIES (CONTINUED)
(g) Property related income
Property related income includes rental income, which is recognised on a straight line basis over the term of the lease.
(h) Leases
The total payments made under operating leases, such as leases for premises, are charged to the Group consolidated income statement on a straight line basis over the period of the lease.
(i) Income taxes and deferred taxation
The current income tax charge is calculated on the basis of the tax laws enacted or substantively enacted at the balance sheet date in the countries where the Bank and its subsidiaries operate and generate taxable income. Management periodically evaluates positions taken in tax returns with respect to situations in which applicable tax regulation is subject to interpretation. It establishes provisions where appropriate on the basis of amounts expected to be settled with the tax authorities.
Deferred tax is accounted for using the asset and liability method. Deferred tax assets and liabilities are recognised for the full tax consequences of all temporary differences between the financial statements carrying amounts of existing assets and liabilities and their respective tax bases. Recognition of deferred tax assets are, however, restricted to the extent that it is probable that sufficient taxable profits will be available against which the deductible temporary differences can be utilised. Deferred tax assets and liabilities are measured using tax rates that are expected to apply to the period in which the asset is expected to be realised or the liability is expected to be settled.
Deferred tax assets are reviewed periodically to reduce the carrying amount by the extent to which it is no longer probable that sufficient taxable profits will be available to utilise the differences.
(j) Financial assets and financial liabilities
(i) Recognition and initial measurement
The Group initially recognises loans and advances, deposits, debts and sukuks issued on the date on which they are originated or acquired. All other financial instruments (including regular-way purchases and sales of financial assets) are recognised on the trade date, which is the date on which the Group becomes a party to the contractual provisions of the instrument.
A financial asset or financial liability is measured initially at fair value plus, for an item not at FVTPL, transaction costs that are directly attributable to its acquisition or issue.
37 38EMIRATES NBD BANK PJSC - GROUP CONSOLIDATED FINANCIAL STATEMENTS - FOR THE YEAR ENDED 31 DECEMBER 2018
NOTES TO THE GROUP CONSOLIDATED FINANCIAL STATEMENTSFOR THE YEAR ENDED 31 DECEMBER 2018
NOTES TO THE GROUP CONSOLIDATED FINANCIAL STATEMENTSFOR THE YEAR ENDED 31 DECEMBER 2018
7 SIGNIFICANT ACCOUNTING POLICIES (CONTINUED)
(j) Financial assets and financial liabilities (continued)
(vi) Fair value Measurement
Fair value is the price that would be received to sell an asset or paid to transfer a liability in an orderly transaction in the principal market at the measurement date. The fair value measurement is based on the presumption that the transaction to sell the asset or transfer the liability takes place either:
• In the principal market for the asset or liability; or• In the absence of principal market, in the most advantageous market for the asset and liabilities.
If an asset or a liability measured at fair value has a ‘Bid’ price and an ‘Ask’ price, then the Group measures assets and long positions at a ‘Bid’ price and liabilities and short positions at an ‘Ask’ price.
The Group recognises transfers between levels of the fair value hierarchy as of the end of the reporting period during which the change has occurred.
Fair value is applicable to both financial and non-financial instruments. (vii) Impairment
The policy applicable from 1 January 2018 (after application of IFRS 9) is described in note 6.
Impairment of loans and advances
Losses for impaired loans are recognised promptly when there is objective evidence that impairment of a loan or portfolio of loans has occurred. Impairment allowances are calculated on individual loans and on groups of loans assessed collectively. Impairment losses are recorded as charges to the income statement. The carrying amount of impaired loans on the balance sheet is reduced through the use of impairment allowance accounts.
Individually assessed loans and advances
For all loans that are considered individually significant, the Group assesses on a case-by-case basis each quarter and more frequently when circumstances require whether there is any objective evidence of impairment. The criteria used by the Group to determine that there is such objective evidence include:
• known cash flow difficulties experienced by the borrower;• past due contractual payments of either principal or interest;• breach of loan covenants or conditions;• decline in the realisable value of the security;• the probability that the borrower will enter bankruptcy or other financial realisation; and• a significant downgrading in credit rating by an external credit rating agency.
7 SIGNIFICANT ACCOUNTING POLICIES (CONTINUED)
(j) Financial assets and financial liabilities (continued)
(iii) Derecognition (continued)
In transactions in which the Group neither retains nor transfers substantially all of the risks and rewards of ownership of a financial asset and it retains control over the asset, the Group continues to recognise the asset to the extent of its continuing involvement, determined by the extent to which it is exposed to changes in the value of the transferred asset.
The Group derecognises a financial liability when its contractual obligations are discharged or cancelled, or expired. (iv) Modification of financial assets and financial liabilities
If the terms of a financial asset are modified, the Group evaluates whether the cash flows of the modified asset are substantially different. If the cash flows are substantially different, then the contractual rights to cash flows from the original financial asset are deemed to have expired. In this case, the original financial asset is derecognised and a new financial asset is recognised at fair value.
If the cash flows of the modified asset carried at amortised cost are not substantially different, then the modification does not result in derecognition of the financial asset. In this case, the Group recalculates the gross carrying amount of the financial asset and recognises the amount arising from adjusting the gross carrying amount as modification gain or loss in profit or loss. If such a modification is carried out because of financial difficulties of the borrower, then the gain or loss is presented together with impairment losses. In other cases, it is presented as interest income.
The Group derecognises a financial liability when its terms are modified and the cash flows of the modified liability are substantially different. In this case, a new financial liability based on the modified terms is recognised at fair value. The difference between the carrying amount of the financial liability extinguished and the new financial liability with modified terms is recognised in profit or loss.
(v) Offsetting
Financial assets and financial liabilities are offset and the net amount presented in the Group consolidated statement of financial position when, and only when, the Group currently has legally enforceable rights to set off amounts and it intends either to settle them on a net basis or through realize the asset and settle the liability simultaneously.
Income and expenses are presented on a net basis only when permitted under IFRS, or for gains and losses arising from a group of similar transactions such as in the Group’s trading activities.
39 40EMIRATES NBD BANK PJSC - GROUP CONSOLIDATED FINANCIAL STATEMENTS - FOR THE YEAR ENDED 31 DECEMBER 2018
NOTES TO THE GROUP CONSOLIDATED FINANCIAL STATEMENTSFOR THE YEAR ENDED 31 DECEMBER 2018
NOTES TO THE GROUP CONSOLIDATED FINANCIAL STATEMENTSFOR THE YEAR ENDED 31 DECEMBER 2018
7 SIGNIFICANT ACCOUNTING POLICIES (CONTINUED)
(j) Financial assets and financial liabilities (continued)
(vii) Impairment (continued)
Collectively assessed loans and advances (continued)
The collective impairment allowance is determined after taking into account:
• historical loss experience in portfolios of similar credit risk characteristics (for example, by industry sector, loan grade or product);
• the estimated period between impairment occurring and the loss being identified and evidenced by the establishment of an appropriate allowance against the individual loan; and
• management’s experienced judgement as to whether current economic and credit conditions are such that the actual level of inherent losses at the balance sheet date is likely to be greater or less than that suggested by historical experience.
The period between a losses occurring and its identification is estimated by management for each identified portfolio.
Homogeneous groups of loans and advances (Consumer loans)
Statistical methods are used to determine impairment losses on a collective basis for homogeneous groups of loans that are not considered individually significant, because individual loan assessment is impracticable.
Losses in these groups of loans are recorded on an individual basis when individual loans are written off, at which point they are removed from the group.
Write-off of loans and advances
Loans (and the related impairment allowance) are normally written off, in full, when there is no realistic prospect of recovery. Where loans are secured, this is after receipt of any proceeds from the realisation of security, if any.
Reversals of impairment
If the amount of an impairment loss decreases in a subsequent period, and the decrease can be related objectively to an event occurring after the impairment was recognised, the excess is written back by reducing the loan impairment allowance account accordingly. The write-back is recognised in the income statement.
Impairment of Available-for-sale securities
At each reporting date an assessment is made of whether there is any objective evidence of impairment in the value of a financial asset. Impairment losses are recognised if, and only if, there is objective evidence of impairment as a result of one or more events that occurred after the initial recognition of the financial asset (a ‘loss event’) and that loss event (or events) has an impact on the estimated future cash flows of the financial asset that can be reliably estimated.
7 SIGNIFICANT ACCOUNTING POLICIES (CONTINUED)
(j) Financial assets and financial liabilities (continued)
(vii) Impairment (continued)
For those loans where objective evidence of impairment exists, impairment losses are determined considering the following factors:
• the Group’s aggregate exposure to the customer;• the viability of the customer’s business model and their capacity to trade successfully out of
financial difficulties and generate sufficient cash flow to service debt obligations;• the amount and timing of expected receipts and recoveries;• the likely dividend available on liquidation or bankruptcy;• the extent of other creditors’ commitments ranking ahead of, or pari passu with, the Group and
the likelihood of other creditors continuing to support the company;• the complexity of determining the aggregate amount and ranking of all creditor claims and the
extent to which legal and insurance uncertainties are evident;• the realisable value of security (or other credit mitigants) and likelihood of successful repossession;• the likely deduction of any costs involved in recovery of amounts outstanding;• the ability of the borrower to obtain, and make payments in, the currency of the loan if not
denominated in local currency; and• when available, the secondary market price of the debt.
Impairment losses are calculated by discounting the expected future cash flows of a loan at its
original effective interest rate and comparing the resultant present value with the loan’s current carrying amount. The impairment allowances on individually significant accounts are reviewed at least quarterly and more regularly when circumstances require. This normally encompasses re-assessment of the enforceability of any collateral held and the timing and amount of actual and anticipated receipts. Individually assessed impairment allowances are only released when there is reasonable and objective evidence of a reduction in the established loss estimate.
Collectively assessed loans and advances
Impairment is assessed on a collective basis in two circumstances:
• to cover losses which have been incurred but have not yet been identified on loans subject to individual assessment; and
• for homogeneous groups of loans that are not considered individually significant.
Incurred but not yet identified impairment (Corporate loans)
Individually assessed loans for which no evidence of loss has been specifically identified on an individual basis are grouped together according to their credit risk characteristics for the purpose of calculating an estimated collective loss. This reflects impairment losses that the Group has incurred as a result of events occurring before the balance sheet date, which the Group is not able to identify on an individual loan basis, and that can be reliably estimated. These losses will only be individually identified in the future. As soon as information becomes available which identifies losses on individual loans within the group, those loans are removed from the group and assessed on an individual basis for impairment.
41 42EMIRATES NBD BANK PJSC - GROUP CONSOLIDATED FINANCIAL STATEMENTS - FOR THE YEAR ENDED 31 DECEMBER 2018
NOTES TO THE GROUP CONSOLIDATED FINANCIAL STATEMENTSFOR THE YEAR ENDED 31 DECEMBER 2018
NOTES TO THE GROUP CONSOLIDATED FINANCIAL STATEMENTSFOR THE YEAR ENDED 31 DECEMBER 2018
7 SIGNIFICANT ACCOUNTING POLICIES (CONTINUED)
(j) Financial assets and financial liabilities (continued)
(ix) Sale and repurchase agreements
Securities sold subject to repurchase agreements (‘repos’) are disclosed in the notes to the Group consolidated financial statements when the transferee has the right by contract or custom to sell or re-pledge the collateral; the counterparty liability is included as a separate deposit. Securities purchased under agreements to resell (‘reverse repos’) are recorded as loans and receivables to either banks or customers, as appropriate. The difference between sale and repurchase price is treated as interest and accrued over the life of the agreements using the effective interest method.
(k) Cash and cash equivalents
‘Cash and cash equivalents’ include notes and coins on hand, unrestricted balances held with Central Banks and highly liquid financial assets with original maturities of three months or less from the date of acquisition that are subject to an insignificant risk of changes in their fair value, and are used by the Group in the management of its short-term commitments.
Cash and cash equivalents are carried at amortized cost in the statement of financial position.
(l) Trading assets and liabilities
Trading assets are those assets and liabilities that the Group acquires or incurs principally for the purpose of selling or repurchasing in the near term, or holds as part of a portfolio that is managed together for short-term profit or position taking.
Trading assets and liabilities are initially recognized and subsequently measured at fair value in the statement of financial position, with transaction costs recognized in profit or loss. All changes in fair value are recognized as part of net trading income in profit or loss.
(m) Derivatives held for risk management purposes and hedge accounting
Hedging instruments include futures, forwards, options and swaps in the interest rate and foreign exchange markets. The Group utilises these instruments to satisfy the requirements of its customers, for proprietary trading purposes and to hedge its own exposure to interest rates and currency risk.
Where there is a hedging relationship as defined by IAS 39 (before 1 January 2018) between a derivative instrument and a related item being hedged, the hedging instrument is measured at fair value, with any resultant gains and losses being accounted as set out below.
The fair value of derivative hedging instruments is calculated in the same way as the fair value of financial instruments.
The method of recognising the resulting fair value gain or loss depends on whether the derivative is designated as a hedging instrument, and if so, the nature of the item being hedged. The Group designates certain derivatives as either:
• Hedges of the exposure to changes in fair value of recognised assets or liabilities or firm commitments (fair value hedge);
• Hedges of highly probable future cash flows attributable to a recognised asset or liability, or a forecasted transaction (cash flow hedge); or
7 SIGNIFICANT ACCOUNTING POLICIES (CONTINUED)
(j) Financial assets and financial liabilities (continued)
(vii) Impairment (continued)
Impairment of Available-for-sale securities (continued)
If the available-for-sale financial asset is impaired, the difference between the financial asset’s acquisition cost (net of any principal repayments and amortisation) and the current fair value, less any previous impairment loss recognised in the income statement, is removed from other comprehensive income and recognised in the income statement.
Reversals of impairment
Once an impairment loss has been recognised on an available-for-sale financial asset, the subsequent accounting treatment for changes in the fair value of that asset differs depending on the nature of the available-for-sale financial asset concerned.
Available-for-sale debt securities
If the fair value of a debt security increases in a subsequent period, and the increase can be objectively related to an event occurring after the impairment loss was recognised in the income statement, the impairment loss is reversed through the income statement to the extent of the increase in fair value.
Available-for-sale equity securities
Subsequent increases in the fair value of the instrument are treated as a revaluation and are recognised in other comprehensive income. Impairment losses recognised on the equity security are not reversed through the income statement. Subsequent decreases in the fair value of the available-for-sale equity security are recognised in the income statement.
(viii) Designated at FVTPL
At initial recognition, the Group has designated certain financial assets as at FVTPL because this designation eliminates or significantly reduces an accounting mismatch, which would otherwise arise.
Before 1 January 2018, the Group also designated certain financial assets as at FVTPL because the assets were managed, evaluated and reported internally on a fair value basis.
The Group has designated certain financial liabilities as at FVTPL in either of the following circumstances:
(a) The liabilities are managed, evaluated and reported internally on a fair value basis; or(b) The designation eliminates or significantly reduces an accounting mismatch which would
otherwise arise.
A description of the basis of each designation is set out in relevant notes for the asset or liability class.

43 44EMIRATES NBD BANK PJSC - GROUP CONSOLIDATED FINANCIAL STATEMENTS - FOR THE YEAR ENDED 31 DECEMBER 2018
NOTES TO THE GROUP CONSOLIDATED FINANCIAL STATEMENTSFOR THE YEAR ENDED 31 DECEMBER 2018
NOTES TO THE GROUP CONSOLIDATED FINANCIAL STATEMENTSFOR THE YEAR ENDED 31 DECEMBER 2018
7 SIGNIFICANT ACCOUNTING POLICIES (CONTINUED)
(m) Derivatives held for risk management purposes and hedge accounting (continued)
(iv) Derivatives that do not qualify for hedge accounting
Certain derivative instruments do not qualify for hedge accounting. Changes in the fair value of any derivative instrument that does not qualify for hedge accounting are recognised immediately in the income statement.
(v) Embedded derivatives
Derivatives embedded in financial assets, liabilities and non-financial host contacts, are treated as separate derivatives and recorded at fair value if they meet the definition of a derivative, their economic characteristics and risks are not closely related to those of the host contract, and the host contract is not itself held for trading or designated at FVPL. The embedded derivatives separated from the host are carried at fair value in the trading portfolio with changes in fair value recognised in the income statement.
(n) Loans and advances
‘Loans and advances’ are non-derivative financial assets with fixed or determinable payments that are not quoted in an active market. They arise when the Group provides money, goods or services directly to a debtor with no intention of trading the receivables. Loans and receivables are carried at amortised cost less impairment and include:
• Originated loans and syndicated loans funded on origination; and• Other debt securities acquired (purchased by the Group) either from the issuer or another source,
provided that they are not quoted in an active market.
(o) Investment securities
Investment securities were initially measured at fair value plus, in the case of investment securities not at FVTPL, incremental direct transaction costs, and subsequently accounted for depending on their classification as either held-to-maturity, FVTPL or available-for-sale.
(p) Islamic financing receivables
Islamic financing receivables are non-derivative financial assets with fixed or determinable payments that are not quoted in an active market. These products are carried at amortised cost less impairment.
(i) Definitions
The following terms are used in Islamic financing:
Murabaha An agreement whereby the Group sells to a customer a commodity, which the Group has purchased
and acquired, based on a promise received from the customer to buy the item purchased according to specific terms and conditions. The selling price comprises the cost of the commodity and an agreed profit margin.
7 SIGNIFICANT ACCOUNTING POLICIES (CONTINUED)
(m) Derivatives held for risk management purposes and hedge accounting (continued)
• Hedge of net investment in a foreign operation.
Hedge accounting is used for derivatives designated in this way provided certain criteria are met.
(i) Fair value hedge
When a derivative is designated as the hedging instrument in a hedge of the change in fair value of a recognised asset or liability or a firm commitment that could affect profit or loss, changes in the fair value of the derivative are recognised immediately in profit or loss together with changes in the fair value of the hedged item that are attributable to the hedged risk.
If the hedging derivative expires or is sold, terminated, or exercised, or the hedge no longer meets the criteria for fair value hedge accounting, or the hedge designation is revoked, then hedge accounting is discontinued prospectively. Any adjustment up to that point to a hedged item for which the effective interest method is used, is amortised to profit or loss as part of the recalculated effective interest rate of the item over its remaining life.
(ii) Cash flow hedge
When a derivative is designated as the hedging instrument in a hedge of the variability in cash flows attributable to a particular risk associated with a recognised asset or liability or a highly probable forecast transaction that could affect profit or loss, the effective portion of changes in the fair value of derivative is recognised in other comprehensive income within ‘Cash flow hedges – fair value gains / (losses)’. Any gain or loss in fair value relating to an ineffective portion is recognised immediately in the income statement.
The accumulated gains and losses recognised in other comprehensive income are reclassified to the income statement in the periods in which the hedged item will affect profit or loss. However, when the forecast transaction that is hedged results in the recognition of a non-financial asset or a non-financial liability, the gains and losses previously recognised in other comprehensive income are removed from equity and included in the initial measurement of the cost of the asset or liability.
When a hedging instrument expires or is sold, or when a hedge no longer meets the criteria for hedge accounting or the hedge designation is revoked, then hedge accounting is discontinued prospectively, any cumulative gain or loss recognised in other comprehensive income at that time remains in equity until the forecast transaction is eventually recognised in the income statement. When a forecast transaction is no longer expected to occur, the cumulative gain or loss that was recognised in other comprehensive income is immediately reclassified to the income statement.
(iii) Net investment hedges
When a derivative instrument or a non-derivative financial liability is designated as the hedging instrument in a hedge of a net investment in a foreign operation, the effective portion of changes in the fair value of the hedging instrument is recognised in other comprehensive income in the translation reserve. Any ineffective portion of the changes in the fair value of the derivative is recognised immediately in income statement. The amount recognised in other comprehensive income is reclassified to the income statement as an adjustment on disposal of the foreign operation.

45 46EMIRATES NBD BANK PJSC - GROUP CONSOLIDATED FINANCIAL STATEMENTS - FOR THE YEAR ENDED 31 DECEMBER 2018
NOTES TO THE GROUP CONSOLIDATED FINANCIAL STATEMENTSFOR THE YEAR ENDED 31 DECEMBER 2018
NOTES TO THE GROUP CONSOLIDATED FINANCIAL STATEMENTSFOR THE YEAR ENDED 31 DECEMBER 2018
7 SIGNIFICANT ACCOUNTING POLICIES (CONTINUED)
(p) Islamic financing receivables (continued)
(ii) Revenue recognition (continued)
Ijara
Income from Ijara is recognised on an accrual basis over the period of the contract.
Mudaraba
Income on Mudaraba financing is recognised on distribution by the Mudarib, whereas the losses are charged to income on their declaration by the Mudarib.
Wakala
Estimated income from Wakala is recognised on an accrual basis over the period, adjusted by actual income when received. Losses are accounted for on the date of declaration by the agent.
(q) Inventory
Properties acquired in settlement of debt are held as inventory and are stated at lower of cost or net realisable value. Directly attributable costs incurred in the acquisition of inventory is included as part of cost of the inventory.
Net realisable value is the estimated selling price in the ordinary course of the business, based on market prices at the reporting date.
(r) Property, equipment and depreciation
Property and equipment are stated at cost less accumulated depreciation. Historical cost includes expenditure that is directly attributable to the acquisition of the assets.
Subsequent costs are included in the asset’s carrying amount or are recognised as a separate asset, as appropriate, only when it is probable that future economic benefits associated with the item will flow to the Group and the cost of the item can be measured reliably. All other repairs and maintenance are charged to the income statement during the financial period in which they are incurred.
Freehold land and fixed assets not commissioned are not depreciated. The estimated useful life of fixed assets for the Group is as follows:
Freehold premises 25 - 60 yearsFreehold improvements 10 yearsLeasehold improvements 7 yearsFurniture, fixtures and office equipment 5 yearsComputer hardware and software 4 - 5 yearsCore banking software 5 - 7 yearsMotor vehicles 3 - 5 years
Assets are depreciated on a straight-line basis over their estimated useful lives as given above.
7 SIGNIFICANT ACCOUNTING POLICIES (CONTINUED)
(p) Islamic financing receivables (continued)
(i) Definitions (continued)
Istisna’a An agreement between the Group and a customer whereby the Group would sell to the customer
a developed property according to agreed upon specifications. The Group would develop the property either on its own or through a subcontractor and then hand it over to the customer on a fixed date at an agreed price.
Ijara An agreement, whereby the Group (lessor) leases an asset to a customer (lessee), for a specific
period and against certain rent instalments. Ijara could end by transferring the ownership of the asset to the lessee at the end of the agreement or substantially all the risks and returns related to the ownership.
Mudaraba An agreement between two parties; wherein one of them provides the funds and is called Rab-Ul-
Mal and the other provides efforts and expertise and is called the Mudarib and he is responsible for investing such funds in a specific enterprise or activity in return for a pre-agreed percentage of the Mudaraba income. In case of normal loss; the Rab-Ul-Mal would bear the loss of his funds while the Mudarib would bear the loss of his efforts. However, in case of default, negligence or violation of any of the terms and conditions of the Mudaraba agreement, only the Mudarib would bear the losses. The Group may act as Mudarib when accepting funds from depositors and as Rab-Ul-Mal when investing such funds on a Mudaraba basis.
Wakala An agreement whereby the Group provides a certain sum of money to an agent who invests it
according to specific conditions in return for a certain fee (a lump sum of money or a percentage of the amount invested). The agent is obliged to return the invested amount in case of default, negligence or violation of any of the terms and conditions of the Wakala.
(ii) Revenue recognition
Revenue is recognised on the above Islamic products as follows:
Murabaha
The profit is quantifiable and contractually determined at the commencement of the contract. Profit is recognised as it accrues over the life of the contract using an effective profit method on the balance outstanding.
Istisna’a
Istisna’a revenue and the associated profit margin (difference between the cash price to the customer and the bank’s total Istisna’a cost) are accounted for on a time proportion basis.

47 48EMIRATES NBD BANK PJSC - GROUP CONSOLIDATED FINANCIAL STATEMENTS - FOR THE YEAR ENDED 31 DECEMBER 2018
NOTES TO THE GROUP CONSOLIDATED FINANCIAL STATEMENTSFOR THE YEAR ENDED 31 DECEMBER 2018
NOTES TO THE GROUP CONSOLIDATED FINANCIAL STATEMENTSFOR THE YEAR ENDED 31 DECEMBER 2018
7 SIGNIFICANT ACCOUNTING POLICIES (CONTINUED)
(t) Intangible assets (continued)
(i) Goodwill (continued)
Measurement (continued)
The cash-generating unit to which goodwill has been allocated is tested for impairment annually and whenever there is an indication that the cash-generating unit may be impaired. Impairment is determined for goodwill by assessing the recoverable amount of each cash-generating unit (or group of cash-generating units) to which the goodwill relates. Where the recoverable amount of the cash-generating unit is less than the carrying amount, an impairment loss is recognised in the income statement. Impairment losses recognised for goodwill are not reversed in subsequent periods.
Where goodwill forms part of a cash-generating unit and part of the operation within that unit is disposed of, the goodwill associated with the operation disposed of is included in the carrying amount of the operation when determining the gain or loss of disposal of the operation. Goodwill disposed of in this circumstance is measured based on the relative fair values of the operations disposed of and the portion of the cash-generating unit retained.
(ii) Capitalised software
Software acquired by the Group is stated at cost less accumulated amortisation and accumulated impairment losses.
Subsequent expenditure on software assets is capitalised only when it increases the future economic benefits embodied in the specific asset to which it relates. All other expenditure is expensed as incurred.
Amortisation is recognised in the Group consolidated income statement on a straight-line basis over the estimated useful life of the software, from the date that it is available for use.
(iii) Other intangible assets
Intangibles acquired separately are measured on initial recognition at cost. The cost of the intangibles acquired in a business combination is at fair value as at the date of acquisition. Following initial recognition, intangibles are carried at cost less any accumulated amortisation and any accumulated impairment losses. The useful lives of intangible asset are assessed to be either finite or indefinite. Intangibles with finite lives are amortised over the useful economic life and assessed for impairment whenever there is an indication that the intangibles may be impaired. The amortisation period and amortisation method for intangibles with a finite useful life is reviewed at least at each financial year end. Changes in the expected useful life or the expected pattern of consumption of future economic benefits embodied in the asset are accounted for by changing the amortisation period or method, as appropriate, and treated as changes in an accounting estimate. The amortisation expense on intangibles with finite lives is recognised in the Group consolidated income statement in the expense category consistent with the function of the intangibles.
7 SIGNIFICANT ACCOUNTING POLICIES (CONTINUED)
(r) Property, equipment and depreciation (continued)
Fixed assets not commissioned are stated at cost. When commissioned, they are transferred to the appropriate property and equipment category and depreciated in accordance with the Group’s policies.
Gains and losses on disposals are determined by comparing proceeds with the carrying amount. These are included in the Group consolidated income statement.
(s) Investment properties
The Group holds certain properties as investments to earn rental income, for capital appreciation, or both. Investment properties are measured initially at cost, including transaction costs. The carrying amount includes the cost of replacing part of an existing investment property at the time that cost is incurred, if the recognition criteria are met, and excludes the costs of day-to-day servicing of an investment property. Subsequent to initial recognition, investment properties are stated at cost less depreciation and impairment (if any). Investment properties are derecognised when either they have been disposed of or when the investment property is permanently withdrawn from use and no future economic benefit is expected from its disposal. Any gains or losses on the retirement or disposal of an investment property are recognised in the income statement in ‘Other operating income’ in the year of retirement or disposal.
Transfers to and from investment properties are made only when there is a change in use based on the business model.
(t) Intangible assets
(i) Goodwill
Goodwill arises on the acquisition of subsidiaries.
Goodwill on acquisitions
Goodwill acquired in a business combination represents the excess of the cost of the business combination over the Group’s interest in the net fair value of the identifiable assets, including intangibles, liabilities and contingent liabilities of the acquiree. When the excess is negative (negative goodwill), it is recognised immediately in the Group consolidated income statement.
Measurement
Goodwill is initially measured at cost. Following initial recognition, goodwill is measured at cost less any accumulated impairment losses.
For the purpose of impairment testing, goodwill acquired in a business combination is, from the acquisition date, allocated to each of the Group’s cash-generating units that are expected to benefit from the synergies of the combination, irrespective of whether other assets or liabilities of the acquiree are assigned to those units.

49 50EMIRATES NBD BANK PJSC - GROUP CONSOLIDATED FINANCIAL STATEMENTS - FOR THE YEAR ENDED 31 DECEMBER 2018
NOTES TO THE GROUP CONSOLIDATED FINANCIAL STATEMENTSFOR THE YEAR ENDED 31 DECEMBER 2018
NOTES TO THE GROUP CONSOLIDATED FINANCIAL STATEMENTSFOR THE YEAR ENDED 31 DECEMBER 2018
7 SIGNIFICANT ACCOUNTING POLICIES (CONTINUED)
(x) Employee benefits (continued)
(ii) Termination gratuity benefit scheme
In compliance with UAE labour law, the Group has a termination gratuity benefit scheme covering all of its expatriate salaried employees who have been employed with the Group for more than one year. The provision for gratuity is recorded through the income statement.
The present value of the gratuity obligations depends on a number of factors that are determined on an actuarial basis using a number of assumptions. The assumptions used in determining the net cost (income) for gratuities include the discount rate. Any changes in these assumptions will impact the carrying amount of gratuity obligations. The value of the gratuity obligations is based on the report submitted by an independent actuarial firm.
(y) Dividend on shares
Dividends on shares are recognised as a liability and deducted from equity when they are approved by the Group’s shareholders in the Annual General Meeting. Dividends approved after the year end are recognised as a liability in the subsequent period.
(z) Share capital and reserves
(i) Perpetual Bonds
The Group classifies capital instruments as financial liabilities or equity instruments in accordance with the substance of the contractual terms of the instruments. The Group’s perpetual bonds are not redeemable by holders and bear an entitlement to distributions that is non-cumulative and at the discretion of the board of directors. Accordingly, they are presented as a component of issued capital within equity. Distributions thereon are recognised in equity. Related income tax is accounted for in accordance with IAS 12 – Income taxes.
(ii) Share issue costs
Incremental costs that are directly attributable to the issue of an equity instrument are deducted from the initial measurement of the equity instruments.
(aa) Earnings per share
The Group presents basic and diluted earnings per share (EPS) data for its ordinary shares. Basic EPS is calculated by dividing the profit or loss attributable to ordinary shareholders of the Group by the weighted average number of ordinary shares outstanding during the year. Diluted EPS is determined by adjusting the profit or loss attributable to ordinary shareholders and the weighted average number of ordinary shares outstanding for the effects of all dilutive potential ordinary shares.
(ab) Operating segments
For management purposes, the Group is organised into operating segments based on their products and services which are independently managed by the respective segment managers responsible for the performance of the segments under their charge.
7 SIGNIFICANT ACCOUNTING POLICIES (CONTINUED)
(u) Impairment of non financial assets`The carrying amounts of the Group’s non-financial assets are reviewed periodically to determine whether there is any indication of impairment. If any such indication exists then the asset’s recoverable amount is estimated.
An impairment loss is recognised if the carrying amount of an asset or its cash generating unit exceeds its recoverable amount. A cash generating unit is the smallest identifiable asset group that generates cash flows that largely are independent from other assets and groups. Impairment losses are recognised in the income statement. Impairment losses recognised in respect of cash generating units are allocated first to reduce the carrying amount of any goodwill allocated to the units and then to reduce the carrying amount of other assets in the unit (group or units) on a pro rata basis.
The recoverable amount of an asset or cash generating unit is the greater of its value in use and its fair value less costs to sell. In assessing value in use, the estimated future cash flows are discounted to their present value using a discount rate that reflects current market assessments of the time value of money and the risks specific to the asset.
(v) Deposits, debts and sukuks issued Deposits, debts and sukuks issued are the main sources of funding for the Group.
Deposits, debts and sukuks issued are initially measured at fair value minus incremental direct transaction costs, and subsequently measured at their amortised cost using the effective interest method.
(w) Provisions
Provisions are recognised when the Group has a present obligation (legal or constructive) as a result of past events, and it is probable that an outflow of resources embodying economic benefits will be required to settle the obligation, and a reliable estimate can be made of the amount of the obligation.
(x) Employee benefits
(i) Pension obligations
The Group operates a pension scheme in respect of eligible UAE national employees in compliance with the UAE Federal Law on Pensions and Social Security. Arrangements for benefits for overseas employees is made in accordance with local regulations and customs. Full provision is made for all accrued benefits.
The Group also pays contributions to trustee administered funds on a contractual or voluntary basis. The Group has no further payment obligations once the contributions have been paid. The contributions are recognised as employee benefit expense when they are due. Prepaid contributions are recognised as an asset to the extent that a cash refund or a reduction in the future payments is available. The entitlement to these benefits is usually conditional on the employee remaining in service up to retirement age and the completion of a minimum service period.

51 52EMIRATES NBD BANK PJSC - GROUP CONSOLIDATED FINANCIAL STATEMENTS - FOR THE YEAR ENDED 31 DECEMBER 2018
NOTES TO THE GROUP CONSOLIDATED FINANCIAL STATEMENTSFOR THE YEAR ENDED 31 DECEMBER 2018
NOTES TO THE GROUP CONSOLIDATED FINANCIAL STATEMENTSFOR THE YEAR ENDED 31 DECEMBER 2018
8 STANDARDS ISSUED BUT NOT YET ADOPTED
Certain new standards, amendments to standards and interpretations are not yet effective for the year ended 31 December 2018, with the Group not opting for early adoption. These have, therefore, not been applied in preparing these consolidated financial statements.
Standard Description Effective date
IFRS 16, ‘Leases’ The IASB issued the new standard for accounting for leases in January 2018.
(a) The new standard does not significantly change the accounting for leases for lessors. However, it does require lessees to recognise most leases on their balance sheets as lease liabilities, with the corresponding right-of-use assets.
(b) Lessees must apply a single model for all recognised leases, but will have the option not to recognise ‘short-term’ leases and leases of ‘low-value’ assets.
(c) Generally, the profit or loss recognition pattern for recognised leases will be similar to today’s finance lease accounting, with interest and depreciation expense recognised separately in the statement of profit or loss.
Early application is permitted provided the new revenue standard, IFRS 15, is applied on the same date.
Lessees must adopt IFRS 16 using either a full retrospective or a modified retrospective approach.
1 January 2019
The Group has assessed the impact of above standard. Based on the assessment, the above standard has no material impact on the consolidated financial statements of the Group as at the reporting date.
7 SIGNIFICANT ACCOUNTING POLICIES (CONTINUED)
(ab) Operating segments (continued)
The segment managers report directly to the management of the Group who regularly review the segment results in order to allocate resources to the segments and to assess the segment performance. Additional disclosures on each of these segments are shown in note 39.
(ac) Related parties
A party is considered to be related to the Group if:
(a) the party, directly or indirectly through one or more intermediaries:(i) controls, is controlled by, or is under common control with, the Group;(ii) has an interest in the Group that gives it significant influence over the Group; or(iii) has joint control over the Group;
(b) the party is an associate;(c) the party is a jointly-controlled entity;(d) the party is a member of the key management personnel of the Group;(e) the party is a close member of the family of any individual referred to in (a) or (d); or (f) the party is an entity that is controlled, jointly controlled or significantly influenced by or for which
significant voting power in such entity resides with, directly or indirectly, any individual referred to in (d) or (e); or
(g) the party is a post-employment benefit plan for the benefit of the employees of the Group, or of any entity that is a related party of the Group.

53 54EMIRATES NBD BANK PJSC - GROUP CONSOLIDATED FINANCIAL STATEMENTS - FOR THE YEAR ENDED 31 DECEMBER 2018
NOTES TO THE GROUP CONSOLIDATED FINANCIAL STATEMENTSFOR THE YEAR ENDED 31 DECEMBER 2018
NOTES TO THE GROUP CONSOLIDATED FINANCIAL STATEMENTSFOR THE YEAR ENDED 31 DECEMBER 2018
11 INVESTMENT SECURITIES
31 December 2018 Domestic*AED 000
Regional**AED 000
International***AED 000
TotalAED 000
TRADING SECURITIESMEASURED AT FVTPLGovernment Bonds 85,810 1,008,040 346,019 1,439,869
Corporate Bonds 303,713 157,090 1,123,893 1,584,696
389,523 1,165,130 1,469,912 3,024,565
DESIGNATED AS AT FVTPL
Equity 181,667 200,461 50,123 432,251
Others 51,996 111,555 153,368 316,919
233,663 312,016 203,491 749,170MEASURED AT AMORTISED COSTGovernment Bonds 1,619,602 6,946,644 2,900,218 11,466,464
Corporate Bonds 429,065 447,738 1,606,661 2,483,464
2,048,667 7,394,382 4,506,879 13,949,928Less: Allowances for impairment (29,902)
13,920,026MEASURED AT FVOCI - DEBT INSTRUMENTSGovernment Bonds - 271,213 300,687 571,900
Corporate Bonds 1,317,534 - 423,051 1,740,585
1,317,534 271,213 723,738 2,312,485Less: Allowances for impairment (5,949)
2,306,536MEASURED ATFVOCI - EQUITY INSTRUMENTSEquity 1,663 61,319 3,124 66,106
1,663 61,319 3,124 66,106
Gross Investment securities 3,991,050 9,204,060 6,907,144 20,102,254
Net Investment securities 20,066,403
The difference between year end fair value and carrying amount of investments reclassified between the investment categories (AFS to Amortised Cost and FVTPL to Amortised Cost) due to IFRS 9 transition is not material.
*Domestic: These are securities issued within UAE. **Regional: These are securities issued within Middle East. ***International: These are securities issued outside the Middle East region.
9 CASH AND DEPOSITS WITH CENTRAL BANKS
2018AED 000
2017AED 000
Cash 3,307,930 3,624,504Statutory and other deposits with Central Banks 32,135,965 31,982,679Interest bearing placements with Central Banks 267,718 1,118,141Murabahas and interest bearing certificates of deposits with Central Banks 48,901,963 35,127,294
Less: Allowances for impairment (ECL) (9,260) -84,604,316 71,852,618
The reserve requirements which are kept with the Central Banks of the countries in which the Group operates are not available for use in the Group’s day to day operations and cannot be withdrawn without the approval of the Central Banks. The level of reserves required changes periodically in accordance with the directives of the Central Banks.
10 DUE FROM BANKS
31 December 2018Local (UAE)
AED 000Foreign
AED 000Total
AED 000Time loans 8,732,304 26,278,347 35,010,651Overnight, call and short notice 1,140,063 3,859,586 4,999,649Gross due from banks 9,872,367 30,137,933 40,010,300Less: Allowances for impairment (ECL) (103,047)
39,907,253
31 December 2017Local (UAE)
AED 000Foreign
AED 000Total
AED 000Time loans 7,849,859 30,093,155 37,943,014Overnight, call and short notice 1,571,730 10,231,686 11,803,416Gross due from banks 9,421,589 40,324,841 49,746,430Less: Allowances for impairment - (20,295) (20,295)
9,421,589 40,304,546 49,726,135
The average yield on these placements was 2.32 % p.a. (2017: 1.53% p.a.)

55 56EMIRATES NBD BANK PJSC - GROUP CONSOLIDATED FINANCIAL STATEMENTS - FOR THE YEAR ENDED 31 DECEMBER 2018
NOTES TO THE GROUP CONSOLIDATED FINANCIAL STATEMENTSFOR THE YEAR ENDED 31 DECEMBER 2018
NOTES TO THE GROUP CONSOLIDATED FINANCIAL STATEMENTSFOR THE YEAR ENDED 31 DECEMBER 2018
11 INVESTMENT SECURITIES (CONTINUED)
As at 31 December 2018, the carrying value of investments in Abraaj Holdings amounted to AED Nil and the carrying value of investment in funds managed by Abraaj Holdings amounted to AED 52 million which are underpinned by the underlying assets of the respective funds.
Investment Name Investment Type
Cost (AED million)
Carrying Value (AED
million)Abraaj Holdings Equity 78 -
The Infrastructure And Growth Capital Fund L.P. Fund 44 32
The Abraaj Buyout Fund II L.P. Fund 18 18
IGCF India Portfolio Holding Limited Fund 2 2
142 52
12 ACQUISITION OF DENIZBANK A.S
The Group has entered into an agreement with Sberbank of Russia to acquire its 99.85% stake in Denizbank A.S. In accordance with the signed agreement, the consideration for 99.85% equals Turkish Lira (TRY) 14.609 billion under a locked box mechanism, based on consolidated equity capital of Denizbank A.S. as of October 31, 2017.
The transaction is subject to regulatory approval in Turkey, Austria, Russia, the UAE and other relevant jurisdictions where Denizbank A.S. operates.
11 INVESTMENT SECURITIES (CONTINUED)
31 December 2017 Domestic*AED 000
Regional**AED 000
International***AED 000
TotalAED 000
HELD FOR TRADING:
Government Bonds 324,188 772,362 913,843 2,010,393
Corporate Bonds 176,049 123,260 1,234,288 1,533,597
Equity 11,307 - - 11,307
511,544 895,622 2,148,131 3,555,297
HELD TO MATURITY:
Government Bonds 10,828 1,118,923 - 1,129,751
Corporate Bonds 33,923 14,547 - 48,470
44,751 1,133,470 - 1,178,221
AVAILABLE-FOR-SALE:
Government Bonds 1,224,250 5,806,618 2,225,337 9,256,205
Corporate Bonds 966,189 701,138 2,342,843 4,010,170
Equity 268,410 443,420 57,725 769,555
Others 67,355 51,713 153,816 272,884
2,526,204 7,002,889 4,779,721 14,308,814
DESIGNATED AT FVTPL - 130 5,780 5,910
Others - 130 5,780 5,910
3,082,499 9,032,111 6,933,632 19,048,242
*Domestic: These are securities issued within UAE.**Regional: These are securities issued within Middle East.***International: These are securities issued outside the Middle East region.

57 58EMIRATES NBD BANK PJSC - GROUP CONSOLIDATED FINANCIAL STATEMENTS - FOR THE YEAR ENDED 31 DECEMBER 2018
NOTES TO THE GROUP CONSOLIDATED FINANCIAL STATEMENTSFOR THE YEAR ENDED 31 DECEMBER 2018
NOTES TO THE GROUP CONSOLIDATED FINANCIAL STATEMENTSFOR THE YEAR ENDED 31 DECEMBER 2018
14 LOANS SECURITISATION
(a) Incorporation of Emirates NBD Asset Finance Companies in Ireland and Cayman Islands for asset securitisation
On 8 June 2012, ENBD Asset Finance Company No.1 Designated Activity Company (DAC) and on 1 June 2012, ENBD Asset Finance Company No. 2 Limited were incorporated under the respective Companies Law (Ireland and Cayman Islands) as Special Purpose Entities (SPEs). The principal activities of these companies are to purchase portfolios of loans through issuance of notes.
On 9 October 2012, the Group transferred corporate loans and receivables amounting to AED 1,876 million to ENBD Asset Finance Company No.1 DAC. However, the Group is exposed to all the credit risk and rewards associated with the transferred assets and hence the Group continues to recognise these assets within loans and receivables and the transfers are accounted for as secured financing transactions. The associated liability of AED 1,876 million, secured by these assets, is included under debt issued and other borrowed funds and is carried at amortised cost. Further, the Group through ENBD Asset Finance Company No.2 Limited, entered into a total return swap contract referencing these notes’ liability, thereby retaining all the risks and rewards associated with the loan exposures.
On 28 October 2014, the Group transferred out loans and receivables amounting to AED 918 million and through ENBD Asset Finance Company No.2 Limited, entered into a total return swap contract referencing such loans and receivables thereby retaining all the risks and rewards associated with the loan exposure. The funding of AED 918 million secured by these assets is included under debt issued and other borrowed funds carried at amortised cost.
Since the Group is exposed to variable returns from its involvement in the SPEs and has the ability to affect those returns through its power over the SPEs, these SPEs are consolidated in compliance with IFRS 10.
As at 31 December 2018, the corporate loans and receivables balance transferred to Ireland and Cayman SPEs is AED 1,044 million [2017: AED 1,264 million] and the associated liability secured by these assets and included under debt issued and other borrowed funds is AED 1,044 million [2017: AED 1,264 million].
(b) Securitisation of Islamic Financing Receivables
Sukuk issuance of AED 3.7 billion was made during the year 2016 to raise US Dollar denominated medium term finance via a Sharia’a compliant sukuk financing arrangement. As at 31 December 2018 the total outstanding sukuk payable is AED 3.7 billion [2017: AED 5.5 billion].
The Group transferred certain identified Ijara and Murabaha assets totalling to AED 3.7 billion (the “co-owned assets”) of its Subsidiary, Emirates Islamic Bank, to EIB Sukuk company limited – (the “Issuer”), a special purpose vehicle formed for the issuance of these sukuk. This medium term finance is carried at amortised cost.
In substance, the co-owned assets remain in control of the Group; accordingly these assets continue to be recognised by the Group. In case of any default, the Group has provided an undertaking to make good all losses to the sukuk holders. The assets are in the control of the Group and shall continue to be serviced by the Group.
The issuer will pay a semi-annual distribution amount from returns received in respect of the co-owned assets. Such proceeds are expected to be sufficient to cover the semi-annual distribution amount payable to the sukuk holders on the semi-annual distribution dates. Upon maturity of the sukuk, the Group has undertaken to repurchase the assets at the exercise price.
13 LOANS AND RECEIVABLES
2018AED 000
2017AED 000
(a) By Type
At Amortised Cost
Overdrafts 137,047,799 124,651,482
Time loans 143,647,199 136,814,451
Loans against trust receipts 9,262,543 7,779,801
Bills discounted 2,326,177 2,596,675
Credit card receivables 6,397,236 5,767,317
Others 500,084 591,617
Gross loans and receivables 299,181,038 278,201,343
Other debt instruments - 51,357
Total loans and receivables 299,181,038 278,252,700
Less: Allowances for impairment (21,117,025) (20,648,034)
278,064,013 257,604,666
Total of impaired loans and receivables 15,922,201 14,772,946
2018AED 000
2017AED 000
(b) By Business Units
Corporate banking 241,507,233 223,779,753
Consumer banking 36,556,780 33,772,980
Treasury - 20,471
Others - 31,462
278,064,013 257,604,666
Allowances for impairment on Loans and receivables have been disclosed in further detail in note 50 (I).

59 60EMIRATES NBD BANK PJSC - GROUP CONSOLIDATED FINANCIAL STATEMENTS - FOR THE YEAR ENDED 31 DECEMBER 2018
NOTES TO THE GROUP CONSOLIDATED FINANCIAL STATEMENTSFOR THE YEAR ENDED 31 DECEMBER 2018
NOTES TO THE GROUP CONSOLIDATED FINANCIAL STATEMENTSFOR THE YEAR ENDED 31 DECEMBER 2018
16 GOODWILL AND INTANGIBLES
Goodwill Intangibles on Acquisition Total
Banking license Software
Customer relationships
Core deposit
intangibles31 December 2018 AED 000 AED 000 AED 000 AED 000 AED 000 AED 000
Cost
Balance as at 1 January 5,553,022 140,084 9,281 157,490 664,174 6,524,051
Foreign exchange movement* (534) (1,411) - - - (1,945)
5,552,488 138,673 9,281 157,490 664,174 6,522,106
Less: Amortisation and impairment
Balance as at 1 January 4,903 - 9,281 157,490 664,174 835,848
Amortisation and impairment for the year - - - - - -
Balance as at 31 December 4,903 - 9,281 157,490 664,174 835,848
Net Goodwill and Intangibles 5,547,585 138,673 - - - 5,686,258
31 December 2017
Cost 5,553,022 140,084 9,281 157,490 664,174 6,524,051
Less: Amortisation andimpairment 4,903 - 9,281 157,490 664,174 835,848
Net Goodwill andIntangibles 5,548,119 140,084 - - - 5,688,203
Foreign exchange movement relates to translation of acquired Goodwill and intangibles pertaining to Emirates NBD Egypt using the period end exchange rate.
Impairment testing of goodwill
The goodwill acquired through business combinations with indefinite life is reviewed annually for impairment by comparing the recoverable amount based on value-in-use calculations for cash generating units (CGUs) to which goodwill has been allocated with its carrying value.
The goodwill has been allocated to four cash-generating units:
• Corporate banking • Consumer banking • Treasury • Emirates NBD Egypt
15 ISLAMIC FINANCING RECEIVABLES
2018AED 000
2017AED 000
At Amortised Cost
Murabaha 34,259,339 31,038,125
Credit cards receivable 1,331,436 1,203,012
Wakala 408,788 1,005,933
Istisna'a 1,726,396 1,872,266
Ijara 18,888,088 17,529,473
Others 912,548 1,119,027
Total Islamic financing receivables 57,526,595 53,767,836
Less: Deferred income (2,074,625) (2,634,875)
Less: Allowances for impairment (5,585,483) (4,645,013)
49,866,487 46,487,948
Total of impaired Islamic financing receivables 5,057,128 5,538,151
Corporate Ijara assets amounting to AED 2.3 billion [2017: 4.8 billion] and Murabaha assets amounting to AED 1.4 billion [2017: 2.2 billion] were securitised for the purpose of issuance of Sukuk liability (refer Note
22).
Allowances for impairment on Islamic financing receivables have been disclosed in further detail in note 50 (I).
61 62EMIRATES NBD BANK PJSC - GROUP CONSOLIDATED FINANCIAL STATEMENTS - FOR THE YEAR ENDED 31 DECEMBER 2018
NOTES TO THE GROUP CONSOLIDATED FINANCIAL STATEMENTSFOR THE YEAR ENDED 31 DECEMBER 2018
NOTES TO THE GROUP CONSOLIDATED FINANCIAL STATEMENTSFOR THE YEAR ENDED 31 DECEMBER 2018
16 GOODWILL AND INTANGIBLES (CONTINUED)
Intangibles
Acquired intangibles are recognised at their “fair value” upon initial recognition.
The specific criteria which needs to be satisfied for an intangible asset to be recognised separately from goodwill in an acquisition is that the intangible asset must be clearly identifiable, in that it either;
• Be separable, that is, be capable of being separated or divided from the entity and sold, transferred, licensed, rented or exchanged, either individually or together with a related contract, asset or liability; or
• Arise from contractual or other legal rights, regardless of whether those rights are transferable or separable from the entity or from other rights and obligations.
Intangibles excluding banking license are amortised using the straight-line method over the useful life of the asset, which is estimated to be between 3 and 11 years. If an indication of impairment arises, the recoverable amount is estimated and an impairment loss is recognised if the recoverable amount is lower than the carrying amount.
The banking license has an indefinite life and is tested for impairment annually. For impairment testing purposes, the banking license is allocated to the relevant cash generating unit.
17 OTHER ASSETS
2018AED 000
2017AED 000
Accrued interest receivable 2,224,081 1,599,981Islamic Profit receivable 186,237 132,901Prepayments and other advances 304,583 280,532Sundry debtors and other receivables 1,118,133 1,288,224Inventory 1,115,159 1,279,410Fair value of deposit (a) 66,667 143,492Others 1,079,331 1,671,621
6,094,191 6,396,161
(a) On acquisition of Dubai Bank in October 2011, the Group received a deposit from the Ministry of Finance of the UAE amounting to AED 2.8 billion at a discount compared to the market available interest rate. As per the Group policy, the financial liability should be recognised initially at its fair value plus the transaction costs that are directly attributable to the acquisition or issue of the financial liability. Since the deposit was received at an interest rate which is below the market available interest rate, a fair value gain of AED 543 million was recognised in the financial statements in 2011 and amortised over the term of the deposit
(8 years) at the effective interest rate.
16 GOODWILL AND INTANGIBLES (CONTINUED)
Key assumptions used in impairment testing for goodwill
The recoverable amount of the cash-generating units has been determined based on a value in use calculation, using cash flow projections covering a five-year period and by applying a terminal growth rate thereafter.
The calculation of value in use in the cash-generating units is most sensitive to the following assumptions:
• Interest margins; • Discount rates; • Market share during the projection period; • Projected growth rates used to extrapolate cash flows beyond the projection period; • Current local Gross Domestic Product (“GDP”); and • Local inflation rates.
Interest margins
Interest margins are based on prevailing market rates at the start of the budget period. These are changed over the budget period for anticipated market conditions.
Discount rates
Discount rates reflect management’s estimate of return on capital employed (“ROCE”) required in each business. This is the benchmark used by management to assess operating performance and to evaluate future investment proposals. Discount rates are calculated by using the Weighted Average Cost of Capital (“WACC”).
Projected growth rate, GDP and local inflation rates
Assumptions are based on published industry research.
At 31 December 2018, the goodwill allocated to Corporate Banking was AED 3,589 million (2017: AED 3,589 million), the goodwill allocated to Consumer Banking was AED 1,700 million (2017: AED 1,700 million) and the goodwill allocated to Treasury was AED 206 million (2017: AED 206 million).
The recoverable amount of goodwill of CGUs, determined on the basis of value in use calculation, uses cash flow projections covering a five year period, with an appropriate terminal growth rate applied thereafter. The forecast cash flows have been discounted using the WACC in the jurisdiction where the CGU operates. A one percentage point change in the discount rate or the terminal growth rate would reduce the recoverable amount of the CGUs as mentioned in the table below:
Cash generating units (CGUs) One percentage change in discount rate (AED million)
One percentage change in terminal growth rate
(AED million)Corporate Banking 39,122 34,312Consumer Banking 43,895 38,497Treasury 7,034 6,169Emirates NBD Egypt S.A.E 103 55
Based on the current impairment assessment, goodwill is not impaired as at 31 December 2018.

63 64EMIRATES NBD BANK PJSC - GROUP CONSOLIDATED FINANCIAL STATEMENTS - FOR THE YEAR ENDED 31 DECEMBER 2018
NOTES TO THE GROUP CONSOLIDATED FINANCIAL STATEMENTSFOR THE YEAR ENDED 31 DECEMBER 2018
NOTES TO THE GROUP CONSOLIDATED FINANCIAL STATEMENTSFOR THE YEAR ENDED 31 DECEMBER 2018
21 DEBT ISSUED AND OTHER BORROWED FUNDS
2018AED 000
2017AED 000
Medium-term note programme* 32,359,770 32,098,003Term loans from banks 7,311,043 6,426,875Borrowings raised from loan securitisations (refer Note 14) 1,044,417 1,263,970
40,715,230 39,788,848 *Includes Tier 2 notes amounting to AED 146 million (2017: AED 3,752 million) raised through public and
private placements.
Some of the Debts issued and other borrowed funds have been hedged for cash flow and fair value risks and amount to AED 17,306 million. For details of hedging instruments please refer to Note 38.
2018AED 000
2017AED 000
Balance as at 1 January 39,788,848 38,695,734New issues 15,710,677 10,394,762Repayments (14,056,360) (9,445,340)Other movements* (727,935) 143,692Balance at end of period 40,715,230 39,788,848
*Represents exchange rate and fair value movements on debts issued in foreign currency. The Group hedges the foreign currency risk on public issuances through derivative financial instruments.
As at 31 December 2018, the outstanding medium term borrowings totalling AED 40,715 million (2017: AED 39,789 million) is falling due as below:
2018AED millions
2017AED millions
2018 - 4,0802019 6,976 13,2512020 8,719 7,2032021 10,094 1,7262022 7,816 7,8772023 1,555 3,6792024 348 5292025 710 1602026 159 1252027 743 7552028 1,370 -2032 256 2572033 350 -2037 146 1472038 439 -2048 1,034 -
40,715 39,789
The interest rate paid on the above averaged 3.53 % p.a in 2018 (2017: 3.17% p.a.).
18 DUE TO BANKS
2018AED 000
2017AED 000
Demand and call deposits 2,277,365 2,178,650Balances with correspondent banks 1,611,125 1,385,690Repurchase agreements with banks 235,706 358,070Time and other deposits 18,215,472 17,388,783
22,339,668 21,311,193
The interest rates paid on the above averaged 2.11 % p.a. (2017: 1.43% p.a).
19 CUSTOMER DEPOSITS
(a) By Type2018
AED 0002017
AED 000Demand, call and short notice 121,171,522 123,766,654Time 136,554,828 108,935,161Savings 26,737,564 26,269,769Others 6,457,006 6,741,332
290,920,920 265,712,916
(b) By Business Units2018
AED 0002017
AED 000Corporate banking 124,051,141 109,565,596Consumer banking 140,023,165 136,442,825Treasury 26,846,614 19,704,495
290,920,920 265,712,916
The interest rates paid on the above deposits averaged 1.38 % p.a (2017: 1.13% p.a.).
20 ISLAMIC CUSTOMER DEPOSITS
(a) By Type2018
AED 0002017
AED 000Demand, call and short notice 17,585,142 17,247,786Time 28,884,361 31,951,247Savings 10,014,757 11,025,549Others 460,842 590,803
56,945,102 60,815,385
(b) By Business Units2018
AED 0002017
AED 000Corporate banking 16,066,907 21,985,002Consumer banking 39,920,136 37,272,087Treasury 958,059 1,558,296
56,945,102 60,815,385
The profit rates paid on the above deposits averaged 1.31 % p.a. (2017: 1.04% p.a.).

65 66EMIRATES NBD BANK PJSC - GROUP CONSOLIDATED FINANCIAL STATEMENTS - FOR THE YEAR ENDED 31 DECEMBER 2018
NOTES TO THE GROUP CONSOLIDATED FINANCIAL STATEMENTSFOR THE YEAR ENDED 31 DECEMBER 2018
NOTES TO THE GROUP CONSOLIDATED FINANCIAL STATEMENTSFOR THE YEAR ENDED 31 DECEMBER 2018
25 TIER I CAPITAL NOTES
The Group has issued a number of regulatory Tier 1 capital notes with details mentioned in the table below. The notes are perpetual, subordinated and unsecured. The Group can elect not to pay a coupon at its own discretion. Note holders will not have a right to claim the coupon and such event will not be considered an event of default. The notes carry no maturity date and have been classified as equity.
Issuance Month / Year Issued Amount Coupon Rate
September 2014 USD 500 million (AED 1.83 billion) Fixed interest rate with a reset after six years
May 2013 USD 1 billion (AED 3.67 billion) Fixed interest rate with a reset after six years
June 2009 AED 4 billionFixed interest rate for the first five years and on a floating rate basis thereafter
26 RESERVES
Legal and statutory reserves
In accordance with the Bank’s Articles of Association, and in compliance with Decretal Federal Law No. (14) of 2018, a minimum of 10% of profit should be transferred to a non-distributable legal and statutory reserve until such time as this reserve equals 50% of the Bank’s issued capital. Since the legal reserve is equal to 50% of the Bank’s issued capital, profit was not appropriated to the legal reserve during the year.
Other reserve
10% of the profit is also transferable to a non-distributable regular reserve until such time as this reserve equals 10% of the Bank’s issued capital. Since the regular reserve is equal to 10% of the Bank’s issued capital, profit was not apportioned to the regular reserve during the year.
Legal and statutory reserve Regular reserve Other reserves Total
AED 000 AED 000 AED 000 AED 000At 1 January 2018 2,778,888 555,800 2,313,733 5,648,421Transfer from retained earnings - - - -At 31 December 2018 2,778,888 555,800 2,313,733 5,648,421
Prior year comparatives are shown in the statement of changes in equity.
Fair value reserve
Fair value reserve includes the net change in fair value of FVOCI financial assets and the net effective portion of changes in fair value of cash flow hedges.
Currency translation reserve
Currency translation reserve represents the exchange differences arising from re-translating the opening net investment in foreign operations.
22 SUKUK PAYABLE
2018AED 000
2017AED 000
Balance as at 1 January 5,526,649 7,368,138Repayments (1,836,250) (1,836,250)Other movements (5,239) (5,239)Balance at end of period 3,685,160 5,526,649
As at 31 December 2018, the outstanding Sukuk payable totaling AED 3,685 million (31 December 2017: AED 5,527 million) is falling due as below:
2018AED millions
2017AED millions
2018 - 1,8362021 3,685 3,691
3,685 5,527
23 OTHER LIABILITIES
2018AED 000
2017AED 000
Accrued interest payable 2,381,338 1,621,982Profit payable to Islamic depositors 149,249 142,691Managers’ cheques 1,238,897 1,350,049Trade and other payables 2,113,941 1,835,223Staff related liabilities 1,079,772 1,030,213Provision for taxation (refer Note 36) 68,834 63,643Others 3,176,360 3,447,512
10,208,391 9,491,313
24 ISSUED CAPITAL AND SHARE PREMIUM RESERVE
Authorised, issued and fully paid: 5,557,774,724 ordinary shares of AED 1 each (2017: 5,557,774,724 ordinary shares).
At the forthcoming Annual General Meeting, the Group is proposing a cash dividend of AED 0.40 per share
for the year (2017: AED 0.40 per share) amounting to AED 2,223 million (2017: AED 2,223 million).

67 68EMIRATES NBD BANK PJSC - GROUP CONSOLIDATED FINANCIAL STATEMENTS - FOR THE YEAR ENDED 31 DECEMBER 2018
NOTES TO THE GROUP CONSOLIDATED FINANCIAL STATEMENTSFOR THE YEAR ENDED 31 DECEMBER 2018
NOTES TO THE GROUP CONSOLIDATED FINANCIAL STATEMENTSFOR THE YEAR ENDED 31 DECEMBER 2018
29 DISTRIBUTION ON ISLAMIC DEPOSITS AND PROFIT PAID TO SUKUK HOLDERS
2018 2017AED 000 AED 000
Distribution to depositors 787,268 601,012
Profit paid to sukuk holders 128,754 203,809
916,022 804,821
Distribution on Islamic deposits represents the share of income between depositors and equity holders. The allocation and distribution to depositors is approved by the Fatwa and Sharia’a Supervisory Board of the Islamic banking subsidiaries.
Profit paid to sukuk holders represents the distribution of returns received in respect of leased assets transferred to the EIB Sukuk Company Limited which was specifically formed for this transaction.
30 NET FEE AND COMMISSION INCOME
2018 2017AED 000 AED 000
Commission income on Trade finance products / services 674,354 678,404
Fee income 3,164,582 3,084,603
Brokerage fees 56,641 79,307
Portfolio and other management fees 126,529 95,995
Total fee and commission income 4,022,106 3,938,309
Fee and commission expense (1,165,624) (981,346)
2,856,482 2,956,963
Asset management fees relate to fees earned by the Group on trust and fiduciary activities in which the Bank holds or invests assets on behalf of its customers.
31 NET GAIN / (LOSS) ON TRADING SECURITIES
2018 2017AED 000 AED 000
Realised gain / (loss) on trading securities 88,886 153,346
Unrealised gain / (loss) on trading securities (35,360) (10,429)
53,526 142,917
27 NET INTEREST INCOME
2018AED 000
2017AED 000
Interest and similar income
Loans and receivables to customers 14,724,408 12,096,323
Loans and receivables to banks 1,148,403 603,400
Other debt securities 40 1,083
Investment securities at FVOCI (2017: Available-for-sale) 305,729 592,386
Investment securities at amortised cost (2017: Held to maturity) 481,691 168,376
Trading securities and designated at FVTPL investment securities 95,096 73,310
Others 175,527 39,069
Total interest income 16,930,894 13,573,947
Interest and similar expense
Deposits from customers (3,850,825) (2,991,279)
Borrowings from banks and financial institutions (312,752) (224,609)
Securities lent and repurchase agreements (24,468) (6,769)
Others (1,809,493) (1,392,554)
Total interest expense (5,997,538) (4,615,211)
Net interest income 10,933,356 8,958,736
28 INCOME FROM ISLAMIC FINANCING AND INVESTMENT PRODUCTS
2018 2017
AED 000 AED 000
Murabaha 1,626,943 1,441,064
Ijara 858,627 888,442
Istissna’a 56,110 51,127
Wakala 44,095 47,575
Others 284,438 203,837
2,870,213 2,632,045
69 70EMIRATES NBD BANK PJSC - GROUP CONSOLIDATED FINANCIAL STATEMENTS - FOR THE YEAR ENDED 31 DECEMBER 2018
NOTES TO THE GROUP CONSOLIDATED FINANCIAL STATEMENTSFOR THE YEAR ENDED 31 DECEMBER 2018
NOTES TO THE GROUP CONSOLIDATED FINANCIAL STATEMENTSFOR THE YEAR ENDED 31 DECEMBER 2018
32 OTHER OPERATING INCOME
2018 2017AED 000 AED 000
Dividend income on equity investments measured at FVOCI 2,888 -Dividend income on equity investments measured at FVTPL 18,416 -Dividend income - 33,946Gain from sale of debt investment securities measured at FVOCI 11,828 -Gain from sale of available-for-sale investment securities - 206,436Gain / (loss) from investment securities designated at fair value through profit or loss (108,609) 2,369
Rental income 39,411 48,466Gain on sale of properties (investment properties / inventories) 1,783 16,220Foreign exchange income* 1,252,421 1,193,684Derivative income 118,917 73,593Other income (net) 267,686 (5,394)
1,604,741 1,569,320
*Foreign exchange income comprises trading and translation gain and gain on dealings with customers.
33 GENERAL AND ADMINISTRATIVE EXPENSES
2018 2017AED 000 AED 000
Staff cost 3,451,057 3,031,722Occupancy cost 381,744 357,937Equipment and supplies 126,961 117,906Information technology cost 233,911 212,357Communication cost 183,704 150,565Service, legal and professional fees 158,987 105,826Marketing related expenses 266,643 158,234Depreciation 397,632 350,532Amortisation of intangibles - 37,000Others 419,032 322,150
5,619,671 4,844,229
34 NET IMPAIRMENT LOSS ON FINANCIAL ASSETS
The charge to the income statement for the net impairment loss on financial assets is made up as follows:
2018 2017AED 000 AED 000
Net impairment of cash and deposits with central bank (3,148) -Net impairment of due from banks / other assets 53,050 8,870Net impairment of investment securities 16,442 47,227Net impairment of loans and receivables (refer note 50 I) 1,595,748 1,704,447Net impairment of Islamic financing receivables (refer note 50 I) 549,668 574,927Bad debt written off / (recovery) - net (463,579) (106,954)
1,748,181 2,228,517
35 DIRECTORS FEES
This comprises of fees payable to the directors of the Group of AED 31 million (2017: AED 31 million).
36 TAXATION
At 31 December 2018 provisions for tax on overseas branch operations and subsidiary amount to AED 69 million (2017: AED 64 million) (refer Note 23).
37 EARNINGS PER SHARE
The Group presents basic and diluted Earnings Per Share (EPS) data for its ordinary shares. Basic EPS is calculated by dividing the profit or loss attributable to ordinary shareholders (further adjusted for interest expense on tier I capital notes) of the Bank by the weighted average number of ordinary shares outstanding during the period. Diluted EPS is determined by adjusting the profit or loss attributable to ordinary shareholders and the weighted average number of ordinary shares outstanding for the effects of all diluted potential ordinary shares, if any.
2018 2017AED 000 AED 000
Profit for the year attributable to equity holders 10,040,485 8,345,024Deduct: Interest on Tier 1 capital notes (595,284) (589,813)Net profit attributable to equity holders 9,445,201 7,755,211Weighted average number of equity shares in issue (‘000) 5,551,872 5,551,872Earnings per share* (AED) 1.70 1.40
*The diluted and basic EPS were the same at the year end.
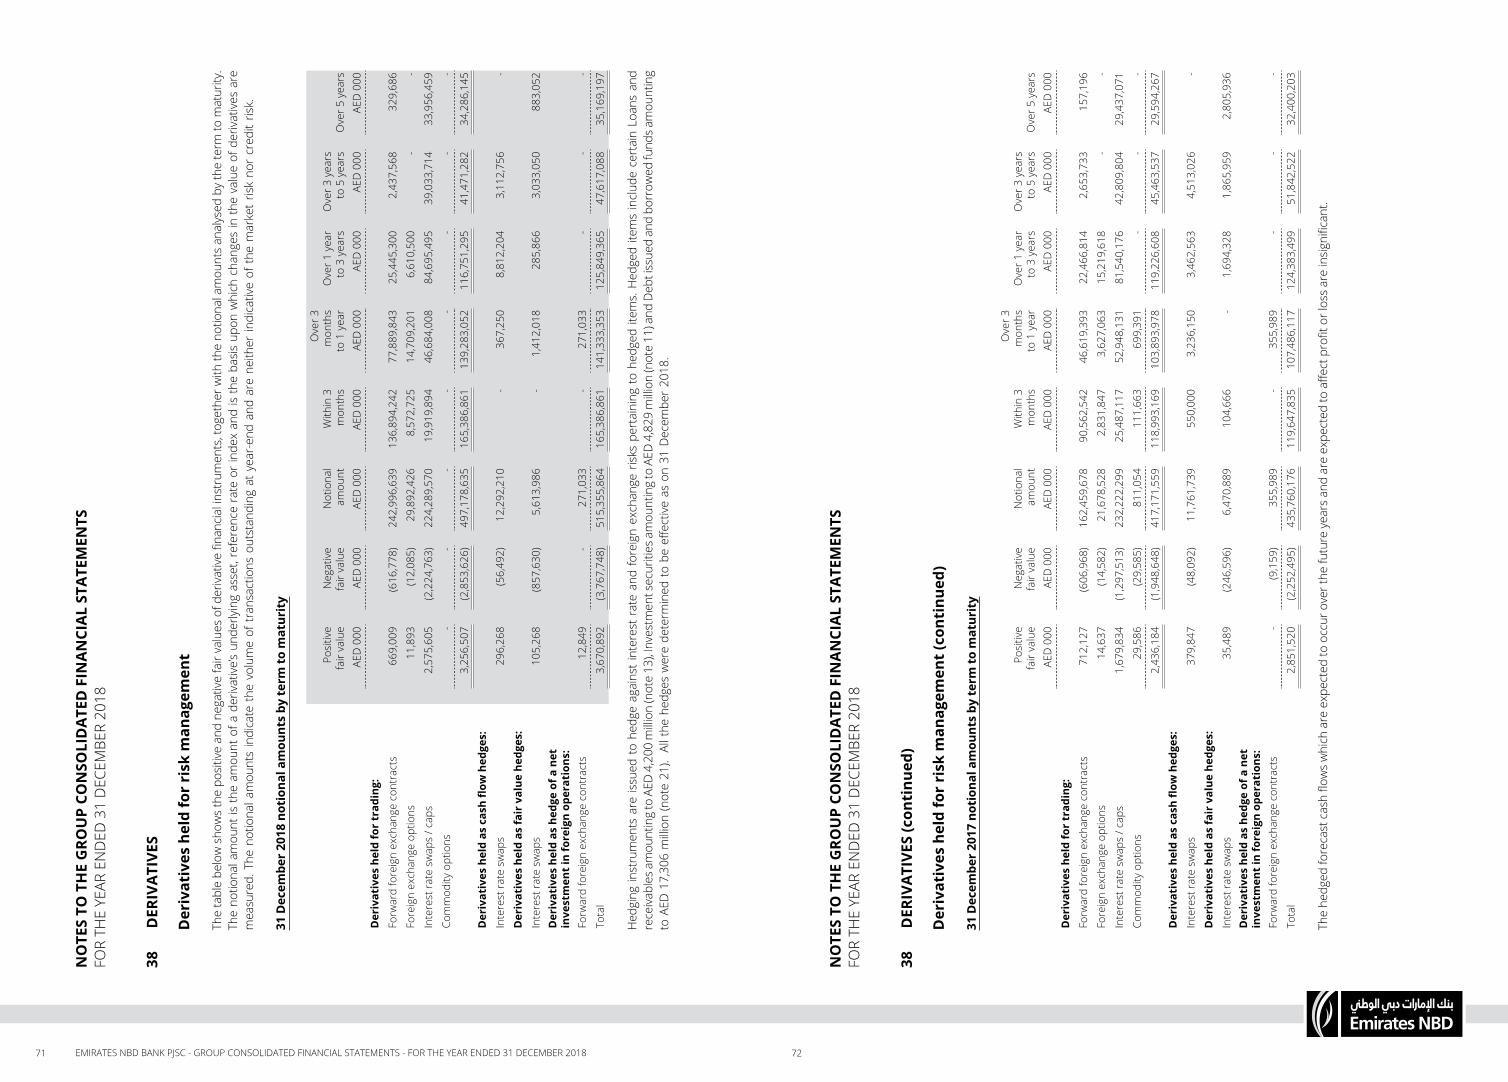
71 72EMIRATES NBD BANK PJSC - GROUP CONSOLIDATED FINANCIAL STATEMENTS - FOR THE YEAR ENDED 31 DECEMBER 2018
38
D
ERIV
ATI
VES
D
eriv
ativ
es h
eld
for
risk
man
agem
ent
Th
e ta
ble
belo
w s
how
s th
e po
sitiv
e an
d ne
gativ
e fa
ir va
lues
of d
eriv
ativ
e fin
anci
al in
stru
men
ts, t
oget
her w
ith th
e no
tiona
l am
ount
s an
alys
ed b
y th
e te
rm to
mat
urity
. Th
e no
tiona
l am
ount
is th
e am
ount
of a
der
ivat
ive’
s un
derly
ing
asse
t, re
fere
nce
rate
or
inde
x an
d is
the
basi
s up
on w
hich
cha
nges
in th
e va
lue
of d
eriv
ativ
es a
re
mea
sure
d. T
he n
otio
nal a
mou
nts
indi
cate
the
vol
ume
of t
rans
actio
ns o
utst
andi
ng a
t ye
ar-e
nd a
nd a
re n
eith
er in
dica
tive
of t
he m
arke
t ris
k no
r cr
edit
risk.
31
Dec
embe
r 20
18 n
otio
nal a
mou
nts
by te
rm to
mat
urit
y
Posi
tive
fair
valu
eN
egat
ive
fair
valu
eN
otio
nal
amou
ntW
ithin
3
mon
ths
Ove
r 3
mon
ths
to 1
yea
rO
ver 1
yea
r to
3 y
ears
Ove
r 3 y
ears
to
5 y
ears
Ove
r 5 y
ears
AED
000
AED
000
AED
000
AED
000
AED
000
AED
000
AED
000
AED
000
Der
ivat
ives
hel
d fo
r tr
adin
g:Fo
rwar
d fo
reig
n ex
chan
ge c
ontr
acts
669,
009
(616
,778
)24
2,99
6,63
913
6,89
4,24
277
,889
,843
25,4
45,3
002,
437,
568
329,
686
Fore
ign
exch
ange
opt
ions
11,8
93(1
2,08
5)29
,892
,426
8,57
2,72
514
,709
,201
6,61
0,50
0-
-
Inte
rest
rate
sw
aps
/ cap
s2,
575,
605
(2,2
24,7
63)
224,
289,
570
19,9
19,8
9446
,684
,008
84,6
95,4
9539
,033
,714
33,9
56,4
59
Com
mod
ity o
ptio
ns-
--
--
--
-
3,25
6,50
7(2
,853
,626
)49
7,17
8,63
516
5,38
6,86
113
9,28
3,05
211
6,75
1,29
541
,471
,282
34,2
86,1
45
Der
ivat
ives
hel
d as
cas
h fl
ow h
edge
s:In
tere
st ra
te s
wap
s29
6,26
8(5
6,49
2)12
,292
,210
-36
7,25
08,
812,
204
3,11
2,75
6-
Der
ivat
ives
hel
d as
fair
val
ue h
edge
s:In
tere
st ra
te s
wap
s10
5,26
8(8
57,6
30)
5,61
3,98
6-
1,41
2,01
828
5,86
63,
033,
050
883,
052
Der
ivat
ives
hel
d as
hed
ge o
f a n
etin
vest
men
t in
fore
ign
oper
atio
ns:
Forw
ard
fore
ign
exch
ange
con
trac
ts12
,849
-27
1,03
3-
271,
033
--
-
Tota
l3,
670,
892
(3,7
67,7
48)
515,
355,
864
165,
386,
861
141,
333,
353
125,
849,
365
47,6
17,0
8835
,169
,197
H
edgi
ng in
stru
men
ts a
re is
sued
to
hedg
e ag
ains
t in
tere
st r
ate
and
fore
ign
exch
ange
ris
ks p
erta
inin
g to
hed
ged
item
s. H
edge
d ite
ms
incl
ude
cert
ain
Loan
s an
d re
ceiv
able
s am
ount
ing
to A
ED 4
,200
milli
on (n
ote
13),
Inve
stm
ent s
ecur
ities
am
ount
ing
to A
ED 4
,829
milli
on (n
ote
11) a
nd D
ebt i
ssue
d an
d bo
rrow
ed fu
nds
amou
ntin
g to
AED
17,
306
milli
on (n
ote
21).
All
the
hedg
es w
ere
dete
rmin
ed to
be
effec
tive
as o
n 31
Dec
embe
r 20
18.
38
D
ERIV
ATI
VES
(con
tinu
ed)
D
eriv
ativ
es h
eld
for
risk
man
agem
ent
(con
tinu
ed)
31
Dec
embe
r 20
17 n
otio
nal a
mou
nts
by te
rm to
mat
urit
y
Posi
tive
fair
valu
eN
egat
ive
fair
valu
eN
otio
nal
amou
ntW
ithin
3
mon
ths
Ove
r 3
mon
ths
to 1
yea
rO
ver 1
yea
r to
3 y
ears
Ove
r 3 y
ears
to
5 y
ears
Ove
r 5 y
ears
AED
000
AED
000
AED
000
AED
000
AED
000
AED
000
AED
000
AED
000
Der
ivat
ives
hel
d fo
r tr
adin
g:Fo
rwar
d fo
reig
n ex
chan
ge c
ontr
acts
712,
127
(606
,968
)16
2,45
9,67
890
,562
,542
46,6
19,3
9322
,466
,814
2,65
3,73
315
7,19
6
Fore
ign
exch
ange
opt
ions
14,6
37(1
4,58
2)21
,678
,528
2,83
1,84
73,
627,
063
15,2
19,6
18-
-
Inte
rest
rate
sw
aps
/ cap
s1,
679,
834
(1,2
97,5
13)
232,
222,
299
25,4
87,1
1752
,948
,131
81,5
40,1
7642
,809
,804
29,4
37,0
71
Com
mod
ity o
ptio
ns29
,586
(29,
585)
811,
054
111,
663
699,
391
--
-
2,43
6,18
4(1
,948
,648
)41
7,17
1,55
911
8,99
3,16
910
3,89
3,97
811
9,22
6,60
845
,463
,537
29,5
94,2
67
Der
ivat
ives
hel
d as
cas
h fl
ow h
edge
s:In
tere
st ra
te s
wap
s37
9,84
7(4
8,09
2)11
,761
,739
550,
000
3,23
6,15
03,
462,
563
4,51
3,02
6-
Der
ivat
ives
hel
d as
fair
val
ue h
edge
s:In
tere
st ra
te s
wap
s35
,489
(246
,596
)6,
470,
889
104,
666
-1,
694,
328
1,86
5,95
92,
805,
936
Der
ivat
ives
hel
d as
hed
ge o
f a n
etin
vest
men
t in
fore
ign
oper
atio
ns:
Forw
ard
fore
ign
exch
ange
con
trac
ts-
(9,1
59)
355,
989
-35
5,98
9-
--
Tota
l2,
851,
520
(2,2
52,4
95)
435,
760,
176
119,
647,
835
107,
486,
117
124,
383,
499
51,8
42,5
2232
,400
,203
Th
e he
dged
fore
cast
cas
h flo
ws
whi
ch a
re e
xpec
ted
to o
ccur
ove
r the
futu
re y
ears
and
are
exp
ecte
d to
affe
ct p
rofit
or l
oss
are
insi
gnifi
cant
.
NO
TES
TO T
HE
GRO
UP
CON
SOLI
DA
TED
FIN
AN
CIA
L ST
ATE
MEN
TSFO
R TH
E YE
AR E
ND
ED 3
1 D
ECEM
BER
2018
NO
TES
TO T
HE
GRO
UP
CON
SOLI
DA
TED
FIN
AN
CIA
L ST
ATE
MEN
TSFO
R TH
E YE
AR E
ND
ED 3
1 D
ECEM
BER
2018

73 74EMIRATES NBD BANK PJSC - GROUP CONSOLIDATED FINANCIAL STATEMENTS - FOR THE YEAR ENDED 31 DECEMBER 2018
NOTES TO THE GROUP CONSOLIDATED FINANCIAL STATEMENTSFOR THE YEAR ENDED 31 DECEMBER 2018
NOTES TO THE GROUP CONSOLIDATED FINANCIAL STATEMENTSFOR THE YEAR ENDED 31 DECEMBER 2018
38 DERIVATIVES (continued)
Derivatives held for risk management (continued) Derivative product types
Forwards are contractual agreements to either buy or sell a specified currency, commodity or financial instrument at a specific price and date in the future. Forwards are customised contracts transacted in the over-the-counter market.
Swaps are contractual agreements between two parties to exchange interest or foreign currency differentials based on a specific notional amount. For interest rate swaps, counterparties generally exchange fixed and floating rate interest payments based on a notional value in a single currency. For currency swaps, the underlying amounts are exchanged in different currencies.
Options are contractual agreements that convey the right, but not the obligation, to either buy or sell a specific amount of a commodity or financial instrument at a fixed price, either at a fixed future date or at any time within a specified period.
Derivative related credit risk
Credit risk in respect of derivative financial instruments arises from the potential for a counterparty to default on its contractual obligations and is limited to the positive fair value of instruments that are favourable to the Group and potential future fluctuations. The majority of the fair value of favourable contracts (and therefore credit risk) is exposure to financial institutions. All credit exposure is managed under approved facilities, and in many cases are collateralized under Credit Support Annex (CSA). The Group takes a Credit Value Adjustment (CVA) on outstanding derivative transactions. The methodology for CVA calculation relies on three components: the probability of default of the counterparty, the expected positive exposure and the recovery rate. CVA is computed on all asset classes including Foreign Exchange, Interest Rates and Commodities.
Derivatives held or issued for trading purposes
Most of the Group’s derivative trading activities relate to sales and position coverage. Sales activities involve offering products to customers at competitive prices in order to enable them to transfer, modify or reduce current and expected risks.
Interest rate derivatives trading is conducted under Board approved limits.
Derivatives held or issued for hedging purposes
As part of its asset and liability management, the Group uses derivatives for hedging purposes in order to reduce its exposure to currency and interest rate risks. This is achieved by hedging specific financial instruments and forecasted transactions as well as strategic hedging against overall balance sheet exposures.
The Group designates its derivatives held or issued for hedging purposes as:
• Fair value hedges: Hedges of the fair value of recognised assets or liabilities or firm commitments;• Cash flow hedges: Hedges of highly probable future cash flows attributable to a recognised asset or
liability, or a highly probable forecast transaction; and• Net investment hedges: Hedges of net investments in foreign operations.
Hedge accounting is used for derivatives designated as above, provided certain criteria as specified under IFRS 9 (IAS 39 for 2017) are met.
38 DERIVATIVES (continued)
Derivatives held for risk management (continued)
Further, in terms of the hedging transactions carried out by the Group, the Group documents:
• At the inception of the transaction, the relationship between hedging instruments and hedged items, the risk being hedged and the Group’s risk management objective and strategy for undertaking a hedge transaction.
• The manner in which effectiveness will be measured throughout the life of the hedge relationship.• The Group’s assessment, both at hedge inception and on an ongoing basis, of whether the derivatives
that are used in hedging transactions are highly effective in offsetting changes in fair values or cash flows of hedged items.
Hedge effectiveness is measured by the Group on a prospective basis at inception, as well as retrospectively (where applicable) and prospectively over the term of the hedge relationship. Sources of ineffectiveness in hedge accounting include the impact of derivative related credit risk on the valuation of the hedging derivative and hedged item. To mitigate this credit risk, the Group executes hedging derivatives with high quality counterparties and the majority of the Group’s hedging derivatives are collateralised.
Before 1 January 2018 the Group assessed the hedge effectiveness on the basis of the quantitative measures specified under IAS 39.
Fair value hedges:
The Group uses interest rate swaps to hedge against changes in value of investment securities due to interest rate movements. These are designated by the Group as fair value hedges and, therefore the fair value hedge accounting is applied to hedge movements in the value of fixed interest rate assets and liabilities subject to interest rate risk, as well as assets and liabilities subject to foreign exchange risk. Subsequent to initial designation, changes in the fair value of derivatives designated as fair value hedges are accounted for in the ‘other operating income’, along with any changes in the fair value of thehedged asset or liability attributable to the hedged risk.
Cash flow hedges:
The Group uses interest rate swaps and forward rate agreements to hedge against the cash flow risks arising on certain floating rate customer deposits and medium term borrowings. Interest rate swaps are also used to hedge against the cash flow risks arising on certain floating rate loans and receivables. These are designated by the Group as cash flow hedges, and, as such, the Group applies cash flow hedge accounting to hedge the variability in highly probable forecast future cash flows attributable to interest rate risk on variable rate assets and liabilities, and assets and liabilities subject to foreign exchange risk.
The effective portion of changes in the fair value of derivatives designated as cash flow hedges are recognised in the fair value reserve within equity. Any gain or loss relating to the ineffective portion is recognised immediately in the Group consolidated income statement.
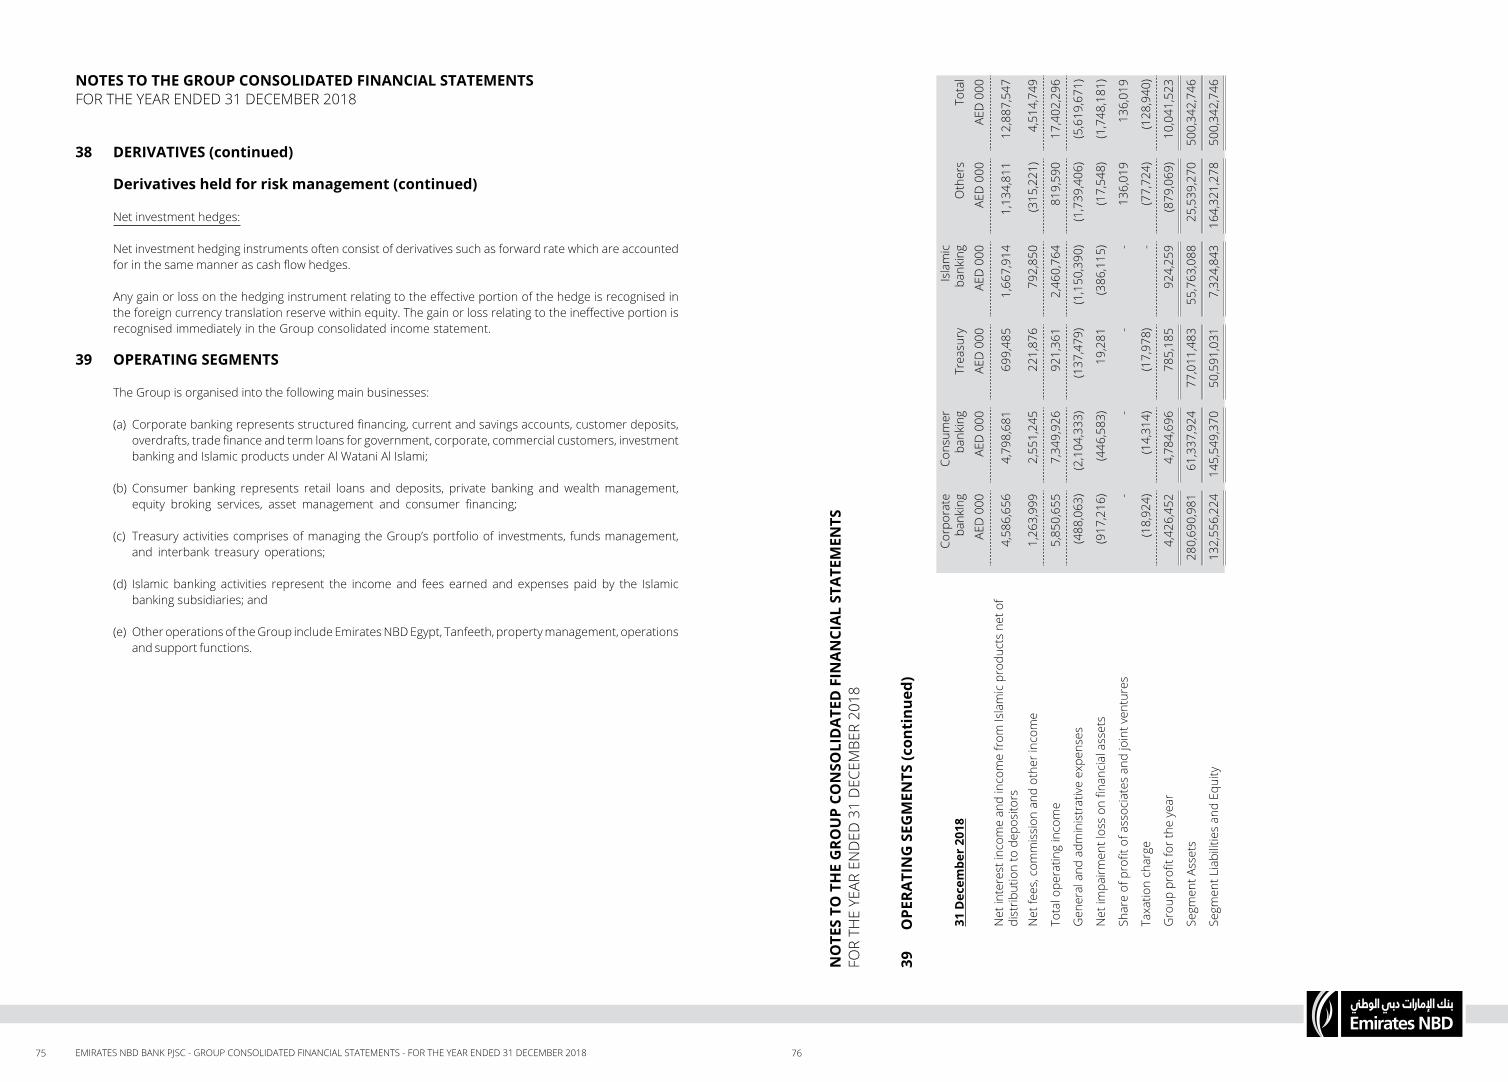
75 76EMIRATES NBD BANK PJSC - GROUP CONSOLIDATED FINANCIAL STATEMENTS - FOR THE YEAR ENDED 31 DECEMBER 2018
NOTES TO THE GROUP CONSOLIDATED FINANCIAL STATEMENTSFOR THE YEAR ENDED 31 DECEMBER 2018
38 DERIVATIVES (continued)
Derivatives held for risk management (continued)
Net investment hedges:
Net investment hedging instruments often consist of derivatives such as forward rate which are accounted for in the same manner as cash flow hedges.
Any gain or loss on the hedging instrument relating to the effective portion of the hedge is recognised in the foreign currency translation reserve within equity. The gain or loss relating to the ineffective portion is recognised immediately in the Group consolidated income statement.
39 OPERATING SEGMENTS
The Group is organised into the following main businesses:
(a) Corporate banking represents structured financing, current and savings accounts, customer deposits, overdrafts, trade finance and term loans for government, corporate, commercial customers, investment banking and Islamic products under Al Watani Al Islami;
(b) Consumer banking represents retail loans and deposits, private banking and wealth management, equity broking services, asset management and consumer financing;
(c) Treasury activities comprises of managing the Group’s portfolio of investments, funds management, and interbank treasury operations;
(d) Islamic banking activities represent the income and fees earned and expenses paid by the Islamic
banking subsidiaries; and
(e) Other operations of the Group include Emirates NBD Egypt, Tanfeeth, property management, operations and support functions.
39
OPE
RATI
NG
SEG
MEN
TS (c
onti
nued
)
31 D
ecem
ber
2018
Corp
orat
e ba
nkin
gCo
nsum
er
bank
ing
Trea
sury
Isla
mic
ba
nkin
gO
ther
sTo
tal
AED
000
AED
000
AED
000
AED
000
AED
000
AED
000
Net
inte
rest
inco
me
and
inco
me
from
Isla
mic
pro
duct
s ne
t of
dist
ribut
ion
to d
epos
itors
4,58
6,65
64,
798,
681
699,
485
1,66
7,91
41,
134,
811
12,8
87,5
47
Net
fees
, com
mis
sion
and
oth
er in
com
e1,
263,
999
2,55
1,24
522
1,87
679
2,85
0(3
15,2
21)
4,51
4,74
9
Tota
l ope
ratin
g in
com
e5,
850,
655
7,34
9,92
692
1,36
12,
460,
764
819,
590
17,4
02,2
96
Gen
eral
and
adm
inis
trat
ive
expe
nses
(488
,063
)(2
,104
,333
)(1
37,4
79)
(1,1
50,3
90)
(1,7
39,4
06)
(5,6
19,6
71)
Net
impa
irmen
t los
s on
fina
ncia
l ass
ets
(917
,216
)(4
46,5
83)
19,2
81(3
86,1
15)
(17,
548)
(1,7
48,1
81)
Shar
e of
pro
fit o
f ass
ocia
tes
and
join
t ven
ture
s-
--
-13
6,01
913
6,01
9
Taxa
tion
char
ge(1
8,92
4)(1
4,31
4)(1
7,97
8)-
(77,
724)
(128
,940
)
Gro
up p
rofit
for t
he y
ear
4,42
6,45
24,
784,
696
785,
185
924,
259
(879
,069
)10
,041
,523
Segm
ent A
sset
s28
0,69
0,98
161
,337
,924
77,0
11,4
8355
,763
,088
25,5
39,2
7050
0,34
2,74
6
Segm
ent L
iabi
litie
s an
d Eq
uity
132,
556,
224
145,
549,
370
50,5
91,0
317,
324,
843
164,
321,
278
500,
342,
746
NO
TES
TO T
HE
GRO
UP
CON
SOLI
DA
TED
FIN
AN
CIA
L ST
ATE
MEN
TSFO
R TH
E YE
AR E
ND
ED 3
1 D
ECEM
BER
2018

77 78EMIRATES NBD BANK PJSC - GROUP CONSOLIDATED FINANCIAL STATEMENTS - FOR THE YEAR ENDED 31 DECEMBER 2018
NOTES TO THE GROUP CONSOLIDATED FINANCIAL STATEMENTSFOR THE YEAR ENDED 31 DECEMBER 2018
NO
TES
TO T
HE
GRO
UP
CON
SOLI
DA
TED
FIN
AN
CIA
L ST
ATE
MEN
TSFO
R TH
E YE
AR E
ND
ED 3
1 D
ECEM
BER
2018
40 SUBSIDIARIES ASSOCIATES AND JOINT VENTURES
The direct subsidiaries, associates and joint ventures of the Group are as follows:
Group % Share-holding Nature of business
Country of incorporation
S. No. As at 31 December 2018
Subsidiaries:
1. Buzz Contact Centre Solutions LLC 100 Call centre management services Dubai, U.A.E.
2. Dubai Bank PJSC 100 Islamic banking Dubai, U.A.E.3. Emirates NBD Capital PSC 100 Funds management Dubai, U.A.E.
4. Emirates Funds Managers (Jersey) Limited 100 Asset management Jersey
5. Emirates NBD Global Funding Limited 100
Medium-term borrowing and money market transactions
Cayman Islands
6. Emirates NBD Properties LLC 100 Real estate Dubai, U.A.E.7. Emirates NBD Securities LLC 100 Brokerage services Dubai, U.A.E.
8. Emirates NBD Asset Management Limited 100 Asset management Dubai, U.A.E.
9. Emirates Islamic Bank PJSC 99.9 Islamic banking Dubai, U.A.E.
10. Emirates Money Consumer Finance LLC 100 Consumer finance Dubai, U.A.E.
11. Emirates Funds LLC 100 Asset management Dubai, U.A.E.12. Emirates NBD Capital (KSA) LLC 100 Investment services KSA
13. Emirates NBD Trust Company (Jersey) Limited 100 Trust administration
services Jersey
14. Tanfeeth LLC 100 Shared services organisation Dubai, U.A.E.
15. The Emirates National Dubai Real Estate Company LLC 100 Nominee company for
mortgage business KSA
16. ENBD London Branch Nominee Company 100 Asset management England
17. Emirates NBD Egypt S.A.E 100 Banking EgyptAssociate:
1. National General Insurance Company PSC 36.7 General and life insurance Dubai, U.A.E.
Joint venture:1. Network International LLC 51 Card processing services Dubai, U.A.E.
Other entities consolidated by the Group based on an assessment of control are as follows:
S. No.
Names Nature of business
1. Group tranche of Emblem Finance Company No. 2 Limited SPE for asset securitisation2. Emirates NBD Global Markets Limited SPE for funding purpose3. ENBD Asset Finance Company No.1 DAC SPE for asset securitisation4. ENBD Asset Finance Company No. 2 Limited SPE for asset securitisation5. Emirates NBD Tier 1 Limited SPE for funding purpose6. Emirates NBD 2014 Tier 1 Limited SPE for funding purpose7. EIB Sukuk Company Limited SPE for asset securitisation8. EI Funding Limited SPE for asset securitisation39
O
PERA
TIN
G S
EGM
ENTS
(con
tinu
ed)
31 D
ecem
ber
2017
Corp
orat
e ba
nkin
gCo
nsum
er
bank
ing
Trea
sury
Isla
mic
ba
nkin
gO
ther
sTo
tal
AED
000
AED
000
AED
000
AED
000
AED
000
AED
000
Net
inte
rest
inco
me
and
inco
me
from
Isla
mic
pro
duct
s ne
t of
dist
ribut
ion
to d
epos
itors
3,69
5,17
54,
414,
118
253,
910
1,61
1,10
481
1,65
310
,785
,960
Net
fees
, com
mis
sion
and
oth
er in
com
e1,
283,
455
2,41
8,71
052
7,87
876
5,66
3(3
26,5
06)
4,66
9,20
0
Tota
l ope
ratin
g in
com
e4,
978,
630
6,83
2,82
878
1,78
82,
376,
767
485,
147
15,4
55,1
60
Gen
eral
and
adm
inis
trat
ive
expe
nses
(412
,100
)(1
,908
,367
)(1
24,2
01)
(1,0
11,8
74)
(1,3
87,6
87)
(4,8
44,2
29)
Net
impa
irmen
t los
s on
fina
ncia
l ass
ets
(805
,390
)(5
85,0
04)
(3,1
39)
(664
,006
)(1
70,9
78)
(2,2
28,5
17)
Shar
e of
pro
fit o
f ass
ocia
tes
and
join
t ven
ture
s-
--
-72
,167
72,1
67
Taxa
tion
char
ge4,
294
(14,
002)
(8,4
11)
-(9
0,66
6)(1
08,7
85)
Gro
up p
rofit
for t
he y
ear
3,76
5,43
44,
325,
455
646,
037
700,
887
(1,0
92,0
17)
8,34
5,79
6
Segm
ent A
sset
s26
9,17
1,36
753
,560
,741
62,5
78,7
2256
,331
,103
28,7
30,3
5047
0,37
2,28
3
Segm
ent L
iabi
litie
s an
d Eq
uity
125,
938,
531
141,
763,
617
39,3
57,9
9957
,008
,709
106,
303,
427
470,
372,
283

79 80EMIRATES NBD BANK PJSC - GROUP CONSOLIDATED FINANCIAL STATEMENTS - FOR THE YEAR ENDED 31 DECEMBER 2018
NOTES TO THE GROUP CONSOLIDATED FINANCIAL STATEMENTSFOR THE YEAR ENDED 31 DECEMBER 2018
NOTES TO THE GROUP CONSOLIDATED FINANCIAL STATEMENTSFOR THE YEAR ENDED 31 DECEMBER 2018
43 RELATED PARTY TRANSACTIONS
Emirates NBD Group is partly owned by Investment Corporation of Dubai (55.75%), a company in which the Government of Dubai is the majority shareholder.
Deposits from and loans to government related entities, other than those that have been individually disclosed, amount to 6% (2017: 7%) and 5% (2017: 6%) respectively, of the total deposits and loans of the Group. These entities are independently run business entities, and all financial dealings with the Group are on normal commercial terms.
The Group has also entered into transactions with certain other related parties who are non government related entities. Such transactions were also made on substantially the same terms, including interest rates and collateral, as those prevailing at the same time for comparable transactions with third parties and do not involve more than a normal amount of risk.
Related party balances and transactions are carried out on normal commercial terms and are as follows:
2018 2017AED 000 AED 000
Loans and receivables:To majority shareholder of the parent 150,218,137 139,581,859To parent 1,303,838 1,037,082To directors and related companies 2,122,591 2,259,083To associates and joint ventures 327,119 420,953
153,971,685 143,298,977
2018 2017AED 000 AED 000
Customer and Islamic deposits:From majority shareholder of the parent 3,024,926 2,891,100From parent 2,393,514 2,917,016From associates and joint ventures 366,044 636,983
5,784,484 6,445,099
41 OPERATING LEASES
At 31 December, the Group’s non-cancellable operating lease rentals are payable as follows:
2018 2017AED 000 AED 000
Less than one year 50,607 43,649Between one and five years 153,010 147,200More than five years 160,080 177,416
363,697 368,265
42 COMMITMENTS AND CONTINGENCIES
(a) At 31 December, the Groups commitments and contingencies are as follows:
2018 2017AED 000 AED 000
Letters of credit 11,368,782 11,489,707Guarantees 49,590,310 48,801,287Liability on risk participations 593,804 1,161,869Irrevocable loan commitments* 20,795,849 25,279,231
82,348,745 86,732,094
Allowances of impairment on Irrevocable loan commitments and financial guarantee contracts have been disclosed in further detail in note 50.
* Irrevocable loan commitments represent a contractual commitment to permit draw downs on a facility within a defined period subject to conditions precedent and termination clauses. Since commitments may expire without being drawn down, and as conditions precedent to draw down have to be fulfilled the total contract amounts do not necessarily represent exact future cash requirements.
(b) Acceptance
Under IFRS 9 (before 1 January 2018: IAS 39), acceptances are recognised on balance sheet with a corresponding liability. Accordingly, there is no off balance sheet commitment for acceptances.
(c) Capital Commitments
The Group has commitments as at 31 December 2018 for branch refurbishments and automation projects of AED 407.7 million (2017: AED 348.5 million).
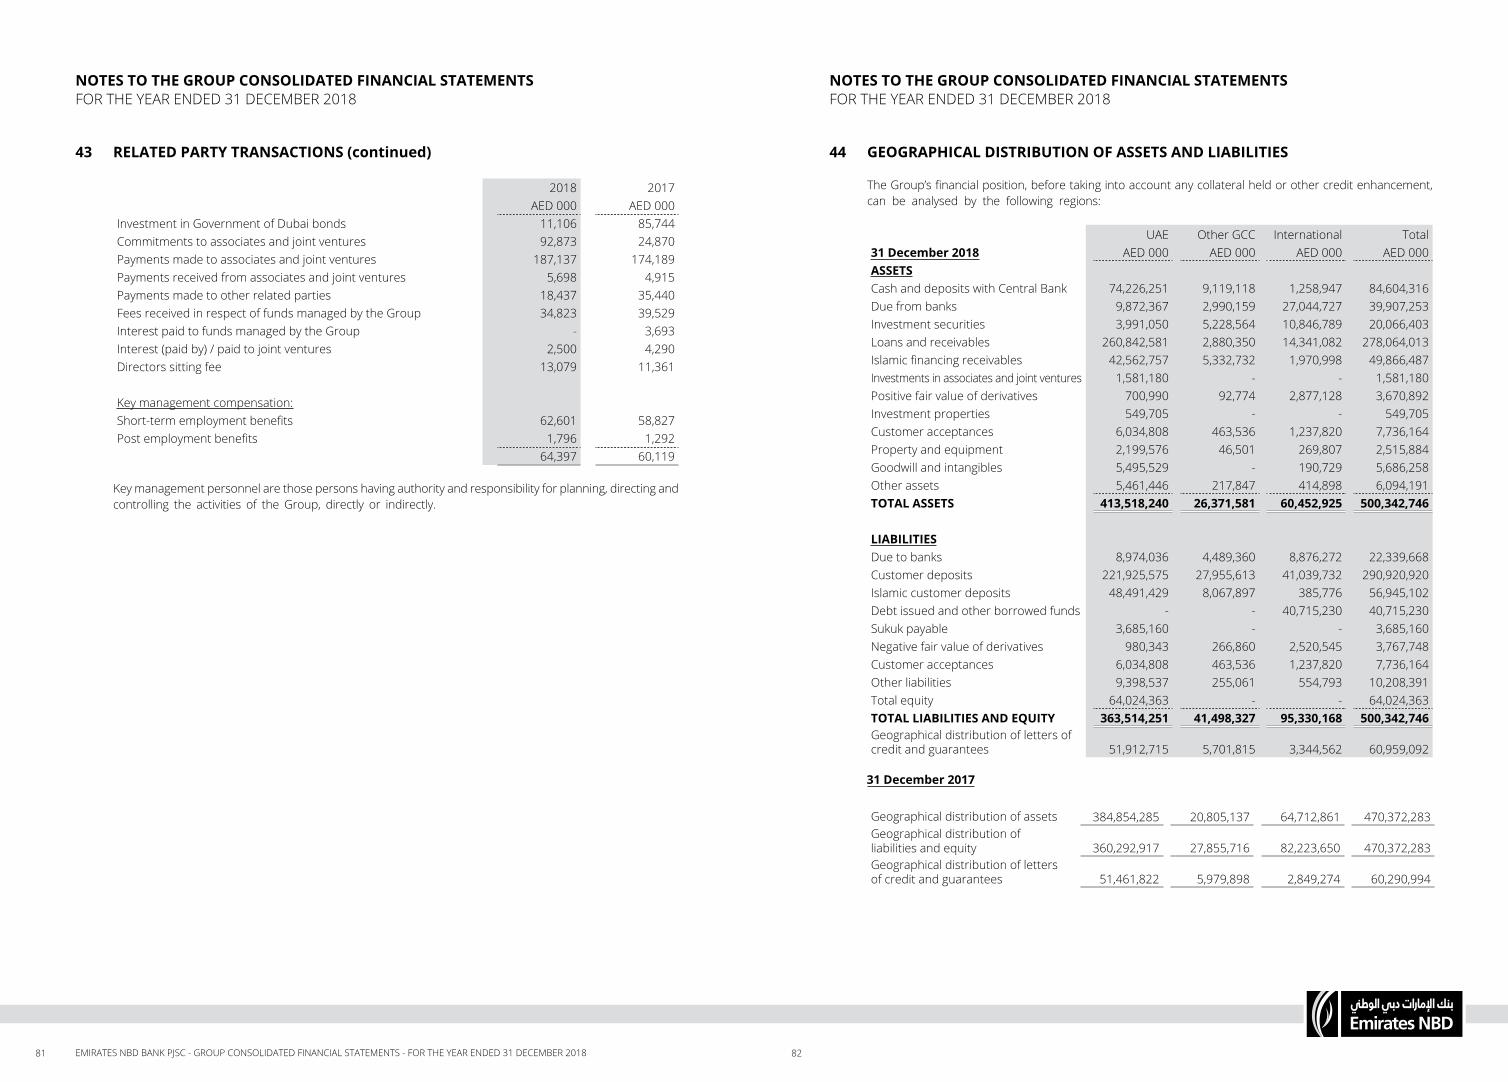
81 82EMIRATES NBD BANK PJSC - GROUP CONSOLIDATED FINANCIAL STATEMENTS - FOR THE YEAR ENDED 31 DECEMBER 2018
NOTES TO THE GROUP CONSOLIDATED FINANCIAL STATEMENTSFOR THE YEAR ENDED 31 DECEMBER 2018
NOTES TO THE GROUP CONSOLIDATED FINANCIAL STATEMENTSFOR THE YEAR ENDED 31 DECEMBER 2018
43 RELATED PARTY TRANSACTIONS (continued)
2018 2017AED 000 AED 000
Investment in Government of Dubai bonds 11,106 85,744Commitments to associates and joint ventures 92,873 24,870Payments made to associates and joint ventures 187,137 174,189Payments received from associates and joint ventures 5,698 4,915Payments made to other related parties 18,437 35,440Fees received in respect of funds managed by the Group 34,823 39,529Interest paid to funds managed by the Group - 3,693Interest (paid by) / paid to joint ventures 2,500 4,290Directors sitting fee 13,079 11,361
Key management compensation:Short-term employment benefits 62,601 58,827Post employment benefits 1,796 1,292
64,397 60,119
Key management personnel are those persons having authority and responsibility for planning, directing and controlling the activities of the Group, directly or indirectly.
44 GEOGRAPHICAL DISTRIBUTION OF ASSETS AND LIABILITIES
The Group’s financial position, before taking into account any collateral held or other credit enhancement, can be analysed by the following regions:
UAE Other GCC International Total
31 December 2018 AED 000 AED 000 AED 000 AED 000ASSETSCash and deposits with Central Bank 74,226,251 9,119,118 1,258,947 84,604,316Due from banks 9,872,367 2,990,159 27,044,727 39,907,253Investment securities 3,991,050 5,228,564 10,846,789 20,066,403Loans and receivables 260,842,581 2,880,350 14,341,082 278,064,013Islamic financing receivables 42,562,757 5,332,732 1,970,998 49,866,487Investments in associates and joint ventures 1,581,180 - - 1,581,180Positive fair value of derivatives 700,990 92,774 2,877,128 3,670,892Investment properties 549,705 - - 549,705Customer acceptances 6,034,808 463,536 1,237,820 7,736,164Property and equipment 2,199,576 46,501 269,807 2,515,884Goodwill and intangibles 5,495,529 - 190,729 5,686,258Other assets 5,461,446 217,847 414,898 6,094,191TOTAL ASSETS 413,518,240 26,371,581 60,452,925 500,342,746
LIABILITIESDue to banks 8,974,036 4,489,360 8,876,272 22,339,668Customer deposits 221,925,575 27,955,613 41,039,732 290,920,920Islamic customer deposits 48,491,429 8,067,897 385,776 56,945,102Debt issued and other borrowed funds - - 40,715,230 40,715,230Sukuk payable 3,685,160 - - 3,685,160Negative fair value of derivatives 980,343 266,860 2,520,545 3,767,748Customer acceptances 6,034,808 463,536 1,237,820 7,736,164Other liabilities 9,398,537 255,061 554,793 10,208,391Total equity 64,024,363 - - 64,024,363TOTAL LIABILITIES AND EQUITY 363,514,251 41,498,327 95,330,168 500,342,746Geographical distribution of letters of credit and guarantees 51,912,715 5,701,815 3,344,562 60,959,092
31 December 2017
Geographical distribution of assets 384,854,285 20,805,137 64,712,861 470,372,283Geographical distribution of liabilities and equity 360,292,917 27,855,716 82,223,650 470,372,283Geographical distribution of letters of credit and guarantees 51,461,822 5,979,898 2,849,274 60,290,994

83 84EMIRATES NBD BANK PJSC - GROUP CONSOLIDATED FINANCIAL STATEMENTS - FOR THE YEAR ENDED 31 DECEMBER 2018
NO
TES
TO T
HE
GRO
UP
CON
SOLI
DA
TED
FIN
AN
CIA
L ST
ATE
MEN
TSFO
R TH
E YE
AR E
ND
ED 3
1 D
ECEM
BER
2018
NO
TES
TO T
HE
GRO
UP
CON
SOLI
DA
TED
FIN
AN
CIA
L ST
ATE
MEN
TSFO
R TH
E YE
AR E
ND
ED 3
1 D
ECEM
BER
2018
45
FIN
AN
CIA
L A
SSET
S A
ND
LIA
BILI
TIES
(con
tinu
ed)
31 D
ecem
ber
2017
Des
igna
ted
at
FVTP
LH
eld-
to-m
atur
ityAv
aila
ble-
for-
sale
Loan
s an
d re
ceiv
able
sAm
ortis
ed c
ost
Hed
ging
in
stru
men
tsTo
tal c
arry
ing
valu
e*
AED
000
AED
000
AED
000
AED
000
AED
000
AED
000
AED
000
Fina
ncia
l ass
ets
Cash
& d
epos
its w
ith C
entr
al B
ank
--
--
71,8
52,6
18-
71,8
52,6
18
Due
from
ban
ks-
--
-49
,726
,135
-49
,726
,135
Inve
stm
ent s
ecur
ities
3,56
1,20
71,
178,
221
14,3
08,8
14-
--
19,0
48,2
42
Loan
s an
d re
ceiv
able
s-
--
257,
604,
666
--
257,
604,
666
Isla
mic
fina
ncin
g re
ceiv
able
s-
--
46,4
87,9
48-
-46
,487
,948
Inve
stm
ents
in a
ssoc
iate
s an
d jo
int
vent
ures
--
--
1,62
4,33
0-
1,62
4,33
0
Posi
tive
fair
valu
e of
der
ivat
ives
2,43
6,18
4-
--
-41
5,33
62,
851,
520
Oth
ers
--
--
11,2
28,6
98-
11,2
28,6
98
5,99
7,39
11,
178,
221
14,3
08,8
1430
4,09
2,61
413
4,43
1,78
141
5,33
646
0,42
4,15
7
Fina
ncia
l lia
bilit
ies
Due
to b
anks
--
--
21,3
11,1
93-
21,3
11,1
93
Cust
omer
dep
osits
--
--
265,
712,
916
-26
5,71
2,91
6
Isla
mic
cus
tom
er d
epos
its-
--
-60
,815
,385
-60
,815
,385
Deb
t iss
ued
and
othe
r bor
row
ed fu
nds
--
--
39,7
88,8
48-
39,7
88,8
48
Suku
k pa
yabl
e-
--
-5,
526,
649
-5,
526,
649
Neg
ativ
e fa
ir va
lue
of d
eriv
ativ
es1,
948,
648
--
--
303,
847
2,25
2,49
5
Oth
ers
--
--
15,6
03,2
60-
15,6
03,2
60
1,94
8,64
8-
--
408,
758,
251
303,
847
411,
010,
746
*
The
carr
ying
val
ues
of th
e fin
anci
al a
sset
s an
d lia
bilit
ies
(that
are
not
sta
ted
at fa
ir va
lue)
are
not
sig
nific
antly
diff
eren
t to
thei
r fai
r val
ues.
45
FIN
AN
CIA
L A
SSET
S A
ND
LIA
BILI
TIES
A.
Cla
ssifi
cati
on o
f fina
ncia
l ass
ets
and
fina
ncia
l lia
bilit
ies
Th
e ta
ble
belo
w s
ets
out t
he G
roup
’s cl
assi
ficat
ion
of e
ach
clas
s of
fina
ncia
l ass
ets
and
liabi
litie
s, a
nd th
eir c
arry
ing
valu
es.
31 D
ecem
ber
2018
Trad
ing
secu
ritie
s at
FVT
PLD
esig
nate
d at
FV
TPL
FVO
CI –
deb
t in
stru
men
tsFV
OCI
– eq
uity
in
stru
men
tsAm
ortis
ed c
ost
Hed
ging
in
stru
men
tsTo
tal c
arry
ing
valu
e*
AED
000
AED
000
AED
000
AED
000
AED
000
AED
000
AED
000
Fina
ncia
l ass
ets
Cash
& d
epos
its w
ith C
entr
al B
ank
--
--
84,6
04,3
16-
84,6
04,3
16
Due
from
ban
ks-
--
-39
,907
,253
-39
,907
,253
Inve
stm
ent s
ecur
ities
3,02
4,56
574
9,17
02,
306,
536
66,1
0613
,920
,026
-20
,066
,403
Loan
s an
d re
ceiv
able
s-
--
-27
8,06
4,01
3-
278,
064,
013
Isla
mic
fina
ncin
g re
ceiv
able
s-
--
-49
,866
,487
-49
,866
,487
Inve
stm
ents
in a
ssoc
iate
s an
d jo
int
vent
ures
--
--
1,58
1,18
0-
1,58
1,18
0
Posi
tive
fair
valu
e of
der
ivat
ives
3,25
6,50
7-
--
-41
4,38
53,
670,
892
Oth
ers
--
--
12,7
15,1
96-
12,7
15,1
96
6,28
1,07
274
9,17
02,
306,
536
66,1
0648
0,65
8,47
141
4,38
549
0,47
5,74
0
Fina
ncia
l lia
bilit
ies
Due
to b
anks
--
--
22,3
39,6
68-
22,3
39,6
68
Cust
omer
dep
osits
--
--
290,
920,
920
-29
0,92
0,92
0
Isla
mic
cus
tom
er d
epos
its-
--
-56
,945
,102
-56
,945
,102
Deb
t iss
ued
and
othe
r bor
row
ed fu
nds
--
--
40,7
15,2
30-
40,7
15,2
30
Suku
k pa
yabl
e-
--
-3,
685,
160
-3,
685,
160
Neg
ativ
e fa
ir va
lue
of d
eriv
ativ
es2,
853,
626
--
--
914,
122
3,76
7,74
8
Oth
ers
--
--
17,9
44,5
5517
,944
,555
2,85
3,62
6-
--
432,
550,
635
914,
122
436,
318,
383
*T
he c
arry
ing
valu
es o
f the
fina
ncia
l ass
ets
and
liabi
litie
s (th
at a
re n
ot s
tate
d at
fair
valu
e) a
re n
ot s
igni
fican
tly d
iffer
ent t
o th
eir f
air v
alue
s.

85 86EMIRATES NBD BANK PJSC - GROUP CONSOLIDATED FINANCIAL STATEMENTS - FOR THE YEAR ENDED 31 DECEMBER 2018
NOTES TO THE GROUP CONSOLIDATED FINANCIAL STATEMENTSFOR THE YEAR ENDED 31 DECEMBER 2018
45 FINANCIAL ASSETS AND LIABILITIES (CONTINUED)
B. Classification of financial assets and financial liabilities on the date of initial application of IFRS 9 (continued)
The following table analyses the impact, net of tax, on reserves and retained earnings arising as a result of the transition to IFRS 9. The impact relates to the fair value reserve and retained earnings. There is no impact on other components of equity.
AED 000Fair value reserveClosing balance under IAS 39 (31 December 2017) 261,568 Reclassification of investment securities (debt) from available-for-sale to amortized cost 47,448
Reclassification of investment securities (debt and equity) from available-for-sale to FVTPL (62,361)
Reclassification of equity securities from available-for-sale to FVOCI (112,567)Reclassification of investment securities (debt) measured at amortised cost to FVOCI (14,920)
Recognition of ECL under IFRS 9 for debt financial assets at FVOCI 826 Other movements 22,999 Opening balance under IFRS 9 (1 January 2018) 142,993
Retained earningsClosing balance under IAS 39 (31 December 2017) 27,403,808 Reclassification of investment securities (debt and equity) from available-for-sale to FVTPL 32,226
Reclassification of investment securities (debt) from held-to-maturity to FVTPL 1,799 Reclassification of equity securities from available-for-sale to FVOCI 112,567 Remeasurement of impairment under IFRS 9 and other movements (2,300,758)Other movements (32,805)Opening balance under IFRS 9 (1 January 2018) 25,216,837
45
FIN
AN
CIA
L A
SSET
S A
ND
LIA
BILI
TIES
(con
tinu
ed)
B.
Cla
ssifi
cati
on o
f fina
ncia
l ass
ets
and
fina
ncia
l lia
bilit
ies
on t
he d
ate
of in
itia
l app
licat
ion
of IF
RS 9
Ex
cept
for t
he fi
nanc
ial s
tate
men
t cap
tions
list
ed in
the
tabl
e be
low
, the
re h
ave
been
no
chan
ges
in th
e ca
rryi
ng a
mou
nts
of a
sset
s an
d lia
bilit
ies
on a
pplic
atio
n of
IFRS
9.
Clas
sifi
cati
on u
nder
IAS
39
(31
Dec
embe
r 201
7)Cl
assi
fica
tion
und
er IF
RS 9
(1 Ja
nuar
y 20
18)
Loan
s an
d re
ceiv
able
sH
eld
to
mat
urity
Avai
labl
e fo
r sa
leFV
TPL
Bala
nce
Amor
tized
co
stFV
OCI
FVTP
LBa
lanc
e
AED
000
Fina
ncia
l ass
ets
Cash
and
dep
osits
with
Cen
tral
Ba
nk 7
1,85
2,61
8 -
- -
71,
852,
618
71,
840,
210
- -
71,
840,
210
Due
from
ban
ks 4
9,72
6,13
5 -
- -
49,
726,
135
49,
583,
960
- -
49,
583,
960
Inve
stm
ent s
ecur
ities
:
Trad
ing
secu
ritie
s m
easu
red
at
FVTP
L -
- -
3,5
55,2
97
3,5
55,2
97
- -
3,5
55,2
97
3,5
55,2
97
Des
igna
ted
as a
t FVT
PL -
- -
5,9
10
5,9
10
- -
951
,610
9
51,6
10
Mea
sure
d at
am
ortis
ed c
ost
- 1
,178
,221
-
- 1
,178
,221
1
3,20
8,16
9 -
- 1
3,20
8,16
9
Mea
sure
d at
FVO
CI –
deb
t in
stru
men
ts
- -
13,
266,
375
- 1
3,26
6,37
5 -
1,1
38,3
72
- 1
,138
,372
Mea
sure
d at
FVO
CI –
equ
ity
inst
rum
ents
- -
1,0
42,4
39
- 1
,042
,439
-
199
,817
-
199
,817
Loan
s an
d re
ceiv
able
s
257,
604,
666
- -
- 25
7,60
4,66
6
256,
864,
879
- -
256
,864
,879
Isla
mic
fina
ncin
g re
ceiv
able
s 4
6,48
7,94
8 -
- -
46,
487,
948
45,
081,
555
- -
45,
081,
555
NO
TES
TO T
HE
GRO
UP
CON
SOLI
DA
TED
FIN
AN
CIA
L ST
ATE
MEN
TSFO
R TH
E YE
AR E
ND
ED 3
1 D
ECEM
BER
2018

87 88EMIRATES NBD BANK PJSC - GROUP CONSOLIDATED FINANCIAL STATEMENTS - FOR THE YEAR ENDED 31 DECEMBER 2018
NOTES TO THE GROUP CONSOLIDATED FINANCIAL STATEMENTSFOR THE YEAR ENDED 31 DECEMBER 2018
45 FINANCIAL ASSETS AND LIABILITIES (continued)
C. Fair value of financial instruments
The table below analyses financial instruments measured at fair value on a recurring basis. The different levels in the fair value hierarchy have been defined as follows:• Level 1: quoted prices (unadjusted) in principal markets for identified assets or liabilities.• Level 2: valuation using inputs other than quoted prices included within Level 1 that are observable for
the assets or liabilities, either directly (i.e., as prices) or indirectly (i.e., derived from prices).• Level 3: valuation using inputs for the assets or liabilities that are not based on observable market data
(unobservable inputs).
Level 1 Level 2 Level 3 Total31 December 2018 AED 000 AED 000 AED 000 AED 000Investment securitiesTrading securities at FVTPLGovernment Bonds 1,439,869 - - 1,439,869Corporate Bonds 1,584,696 - - 1,584,696
3,024,565 - - 3,024,565
FVOCI - debt instrumentsGovernment Bonds 557,685 14,215 - 571,900Corporate Bonds 1,689,783 50,802 - 1,740,585
2,247,468 65,017 - 2,312,485
FVOCI - equity instruments 61,388 - 4,718 66,106
Designated at FVTPLEquity 60,142 - 372,109 432,251Others 37,341 81,064 198,514 316,919
97,483 81,064 570,623 749,170Positive fair value of derivativesDerivatives held for trading - 3,256,507 - 3,256,507Derivatives held as cash flow hedges:Interest rate swaps - 296,268 - 296,268Derivatives held as fair value hedges:Interest rate swaps - 105,268 - 105,268Derivatives held as hedge of a net investment in foreign operations:Forward foreign exchange contracts - 12,849 - 12,849
- 3,670,892 - 3,670,892Negative fair value of derivativesDerivatives held for trading - (2,853,626) - (2,853,626)Derivatives held as cash flow hedges:Interest rate swaps - (56,492) - (56,492)Derivatives held as fair value hedges:Interest rate swaps - (857,630) - (857,630)Derivatives held as hedge of a net investment in foreign operations:Forward foreign exchange contracts - - - -
- (3,767,748) - (3,767,748)5,430,904 49,225 575,341 6,055,470
NOTES TO THE GROUP CONSOLIDATED FINANCIAL STATEMENTSFOR THE YEAR ENDED 31 DECEMBER 2018
45 FINANCIAL ASSETS AND LIABILITIES (CONTINUED)
B. Classification of financial assets and financial liabilities on the date of initial application of IFRS 9 (continued)
The following table reconciles the closing balance of financial assets under IAS 39 to the opening balance of financial assets under IFRS 9 on 1 January 2018.
31 December 2017 (IAS 39)
Remeasurement / Reclassification of financial assets
Remeasurement of impairment and other movements
1 January 2018 (IFRS 9)
AED 000Cash and deposits with Central Banks 71,852,618 - (12,408) 71,840,210
Due from Banks 49,726,135 - (142,175) 49,583,960
Investment securities: Trading securities measured at FVTPL 3,555,297 - - 3,555,297
Designated as at FVTPL 5,910 945,700 - 951,610 Equity securities AFS / FVOCI 1,042,439 (842,622) - 199,817
Debt investments at AFS / FVOCI 13,266,375 (12,127,177) (826) 1,138,372
Debt investments at HTM / Amortised cost 1,178,221 12,049,588 (19,640) 13,208,169
Loans and receivables 257,604,666 (51,830) (687,957) 256,864,879
Islamic financing 46,487,948 - (1,406,393) 45,081,555
Total 444,719,609 (26,341) (2,269,399) 442,423,869

89 90EMIRATES NBD BANK PJSC - GROUP CONSOLIDATED FINANCIAL STATEMENTS - FOR THE YEAR ENDED 31 DECEMBER 2018
NOTES TO THE GROUP CONSOLIDATED FINANCIAL STATEMENTSFOR THE YEAR ENDED 31 DECEMBER 2018
NOTES TO THE GROUP CONSOLIDATED FINANCIAL STATEMENTSFOR THE YEAR ENDED 31 DECEMBER 2018
45 FINANCIAL ASSETS AND LIABILITIES (continued)
C. Fair value of financial instruments (continued)
Level 1 Level 2 Level 3 Total31 December 2017 AED 000 AED 000 AED 000 AED 000Investment securitiesHELD FOR TRADINGGovernment Bonds 2,010,393 - - 2,010,393Corporate Bonds 1,496,872 36,725 - 1,533,597Equity 11,307 - - 11,307Others - - - -
3,518,572 36,725 - 3,555,297
AVAILABLE-FOR-SALE:Government bonds 9,141,137 115,068 - 9,256,205Corporate bonds 3,996,811 13,359 - 4,010,170Equity 113,827 297 655,431 769,555Others - 95,408 177,476 272,884
13,251,775 224,132 832,907 14,308,814
Designated at FVTPLOthers - 5,910 - 5,910
- 5,910 - 5,910Positive fair value of derivativesDerivatives held for trading - 2,436,184 - 2,436,184Derivatives held as cash flow hedges:Interest rate swaps - 379,847 - 379,847Derivatives held as fair value hedges:Interest rate swaps - 35,489 - 35,489
- 2,851,520 - 2,851,520Negative fair value of derivativesDerivatives held for trading - (1,948,648) - (1,948,648)Derivatives held as cash flow hedges:Interest rate swaps - (48,092) - (48,092)Derivatives held as fair value hedges:Interest rate swaps - (246,596) - (246,596)Derivatives held as hedge of a net investment in foreign operations:Forward foreign exchange contracts - (9,159) - (9,159)
- (2,252,495) - (2,252,495)16,770,347 865,792 832,907 18,469,046
45 FINANCIAL ASSETS AND LIABILITIES (continued)
C. Fair value of financial instruments (continued)
The following table shows a reconciliation from the beginning balances to the ending balances for the fair value measurements in Level 3 of the fair value hierarchy.
Trading securities at
FVTPLDesignated
at FVTPL
FVOCI – debt
instruments
FVOCI– equity
instruments TotalAED 000 AED 000 AED 000 AED 000 AED 000
Balance as at 31 December 2017 - - - 832,907 832,907
Impact of IFRS 9 at 1 January 2018 - 677,403 - (709,598) (32,195)
Balance as at 1 January 2018 - 677,403 - 123,309 800,712
Total gains or losses:- in profit or loss 330 (84,532) - - (84,202)- in other comprehensive income - - - 187 187
Purchases 335,040 - - - 335,040Issues - - - - -Settlements and other adjustments (335,370) (22,248) - (118,778) (476,396)
Transfers into Level 3 - - - - -Transfers out of Level 3 - - - - -
Balance as at 31 December 2018 - 570,623 - 4,718 575,341

91 92EMIRATES NBD BANK PJSC - GROUP CONSOLIDATED FINANCIAL STATEMENTS - FOR THE YEAR ENDED 31 DECEMBER 2018
NOTES TO THE GROUP CONSOLIDATED FINANCIAL STATEMENTSFOR THE YEAR ENDED 31 DECEMBER 2018
NOTES TO THE GROUP CONSOLIDATED FINANCIAL STATEMENTSFOR THE YEAR ENDED 31 DECEMBER 2018
46 NOTES TO THE GROUP CONSOLIDATED CASH FLOW STATEMENT
2018 2017AED 000 AED 000
(a) Analysis of changes in cash and cash equivalents during the year Balance at beginning of year 43,527,409 43,633,819 Net cash inflow/(outflow) (17,286,239) (106,410) Balance at end of year 26,241,170 43,527,409(b) Analysis of cash and cash equivalents Cash and deposits with Central Bank 84,604,316 71,852,618 Due from banks 39,907,253 49,726,135 Due to banks (22,339,668) (21,311,193)
102,171,901 100,267,560 Less: deposits with Central Bank for regulatory purposes (32,135,965) (31,982,679) Less: certificates of deposits / placements with Central
Bank maturing after three months (27,300,000) (13,119,093) Less: amounts due from banks maturing after three months (22,373,804) (17,155,123) Add: amounts due to banks maturing after three months 5,879,038 5,516,744
26,241,170 43,527,409(c) Adjustment for non cash items
Impairment loss on cash and deposits with central banks (3,148) -Impairment loss on loans and receivables 1,595,748 1,704,447Impairment loss on Islamic financing receivables 549,668 574,927Impairment loss on investment securities 16,442 47,227Impairment loss on due from banks / other assets 53,050 8,870Amortisation of fair value 163,705 102,717Discount on Investment securities 33,946 57,969Unrealised foreign exchange gain (174,223) (207,988)Amortisation of intangibles - 37,000Depreciation of property and equipment / Investmentproperty 414,139 366,664
Share of (profit) / loss of associates and joint ventures (136,019) (72,167)Unrealized (gain)/loss on investments 148,880 15,701Unrealized (gain)/loss on FV Hedged item (578,001) 122,525Gain on sale of investment properties - -Gain on sale of properties (inventories) (1,783) (16,220)
2,082,404 2,741,672
45 FINANCIAL ASSETS AND LIABILITIES (continued)
C. Fair value of financial instruments (continued)
The following table shows a reconciliation from the beginning balances to the ending balances for the fair value measurements in Level 3 of the fair value hierarchy.
Available for sale
financial assets
Financial assets
designated at fair value
through profit or loss
Financial assets held for trading TOTAL
AED 000 AED 000 AED 000 AED 000Balance as at 1 January 2017 1,106,579 - - 1,106,579Total gains or losses:- in profit or loss - - - -- in other comprehensive income 22,748 - - 22,748Purchases - - 94,016 94,016Issues - - - -Settlements and other adjustments (302,105) - (94,016) (396,121)Transfers into Level 3 5,685 - - 5,685Transfers out of Level 3 - - - -Balance as at 31 December 2017 832,907 - - 832,907
The fair value of financial instruments classified as level 3 are, in certain circumstances, measured using valuation techniques that incorporate assumptions that are not evidenced by the prices from observable current market transactions in the same instrument and are not based on observable market data. The Group employs valuation techniques, depending on the instrument type and available market data. For example, in the absence of active market, an investment’s fair value is estimated on the basis of an analysis of the investee’s financial position and results, risk profile and other factors. Favourable and unfavourable changes in the value of financial instruments are determined on the basis of changes in the value of the instruments as a result of varying the levels of the unobservable parameters, quantification of which is judgmental.
There have been no transfers between Level 1 and Level 2 during the years ended 31 December 2018 and 31 December 2017.

93 94EMIRATES NBD BANK PJSC - GROUP CONSOLIDATED FINANCIAL STATEMENTS - FOR THE YEAR ENDED 31 DECEMBER 2018
NOTES TO THE GROUP CONSOLIDATED FINANCIAL STATEMENTSFOR THE YEAR ENDED 31 DECEMBER 2018
NOTES TO THE GROUP CONSOLIDATED FINANCIAL STATEMENTSFOR THE YEAR ENDED 31 DECEMBER 2018
47 CAPITAL MANAGEMENT AND ALLOCATION
The capital overview as per Basel III framework is given below:
2018 2017AED 000 AED 000
Available capital Common equity tier 1 capital 46,678,016 42,649,802Tier 1 capital 55,607,384 51,527,359Total eligible capital 58,802,536 57,782,602
Risk-weighted assets Credit risk 243,860,147 238,799,078Market risk 9,035,854 7,841,446Operational risk 28,043,576 26,381,543Total risk-weighted assets 280,939,577 273,022,067
Minimum capital
requirement 2018
2018 2017
Capital Ratioa. Total capital ratio for consolidated Group 13.50% 20.93% 21.16%b. Tier 1 ratio only for consolidated Group 11.50% 19.79% 18.87%c. CET1 ratio only for consolidated Group 10.00% 16.61% 15.62%
47 CAPITAL MANAGEMENT AND ALLOCATION
The Central Bank of UAE (‘CBUAE’) supervises the Group on a consolidated basis, and therefore receives information on the capital adequacy of, and sets capital requirements for, the Group as a whole. Effective from 2017, the capital is computed at a Group level using the Basel III framework of the Basel Committee on Banking Supervision (‘Basel Committee’), after applying the amendments advised by the CBUAE, within national discretion. The Basel III framework, like Basel II, is structured around three ‘pillars’: minimum capital requirements, supervisory review process and market discipline.
Minimum Capital Requirements
The CBUAE issued Basel III capital regulations, which came into effect from 1 February 2017 introducing minimum capital requirements at three levels, namely Common Equity Tier 1 (‘CET1’), Additional Tier 1 (‘AT1’) and Total Capital.
Additional capital buffers (Capital Conservation Buffer (CCB) and Countercyclical Capital Buffer (CCyB) - maximum up to 2.5% for each buffer) introduced over and above the minimum CET1 requirement of 7%.
For 2018, CCB is effective in transition arrangement and is required to keep at 1.88% of the Capital base and from 2019; it will be required to keep at 2.5% of the Capital base. CCyB is not in effect and is not required to keep for 2018.
Over and above additional capital buffers, the Group as a Domestic Systematically Important Bank (D-SIB) is required to keep an additional D-SIB buffer of 1.13% of the Capital base for 2018. This buffer will increase to 1.5% of the Capital base by 2019.
Regulatory Capital
The Bank’s capital base is divided into three main categories, namely CET1, AT1 and Tier 2 (‘T2’), depending on their characteristics.
• CET1 capital is the highest quality form of capital, comprising share capital, share premium, legal, statutory and other reserves, fair value reserve, retained earnings, non-controlling interest after deductions for goodwill and intangibles and other regulatory adjustments relating to items that are included in equity but are treated differently for capital adequacy purposes under ‘CBUAE’ guidelines.
• AT 1 capital comprises eligible non-common equity capital instruments.
• T2 capital comprises qualifying subordinated debt and undisclosed reserve.

95 96EMIRATES NBD BANK PJSC - GROUP CONSOLIDATED FINANCIAL STATEMENTS - FOR THE YEAR ENDED 31 DECEMBER 2018
NOTES TO THE GROUP CONSOLIDATED FINANCIAL STATEMENTSFOR THE YEAR ENDED 31 DECEMBER 2018
NOTES TO THE GROUP CONSOLIDATED FINANCIAL STATEMENTSFOR THE YEAR ENDED 31 DECEMBER 2018
48 FUND MANAGEMENT
The Group manages a number of funds which are not consolidated in the financial statements. The funds have no recourse to the general assets of the Group and further the Group has no recourse to the assets of the funds. Third party funds managed by the Group were AED 15,226 million at 31 December 2018 (2017: AED 17,710 million).
49 ASSETS HELD IN FIDUCIARY CAPACITY
The Group holds assets in a fiduciary capacity and provides custodian services for some of its customers. The underlying assets held in a custodial or fiduciary capacity are excluded from the Group consolidated financial statements.
50 RISK MANAGEMENT
The primary risks to the Group arise from extending credit to wholesale and consumer banking customers. The Group is also exposed to a range of other risk types such as market, operational, liquidity, compliance, reputational, country and legal that drive the direction of its risk management strategy, product range and risk diversification strategies.
Group Risk Management Framework (GRMF):
The GRMF enables the Group to manage group-wide risks with the objective of maximizing returns while adhering to our risk appetite.
The Group uses a three lines of defense model to support its approach to risk management by clarifying responsibility, encouraging collaboration, and enabling efficient coordination of risk and control activities. The three lines of defense are summarized below:
• Business units: required to ensure the effective management of risks within the scope of their direct organizational responsibilities. All employees within the business units are sufficiently trained and have access to appropriate tools to ensure risk-taking is controlled. Each business unit primarily owns the risk that it underwrites and is equally responsible for designing and implementing necessary controls to mitigate risks emanating from its activities.
• Risk control units: responsible for implementing policies and procedures, monitoring risks taken to ensure all risks are within the Group’s risk appetite. Appropriate controls are designed and implemented with adequate reporting in place to anticipate future risks and improve the level of preparedness across the management chain.
• Group Internal Audit: provides independent assurance and reports its findings to all relevant management and governance bodies, accountable line managers, relevant oversight function and committee(s) of the Board.
47 CAPITAL MANAGEMENT AND ALLOCATION (continued)
The capital adequacy ratios as per Basel III capital regulation are given below:
2018 2017
AED 000 AED 000
Common Equity Tier 1 (CET1) Capital
Share Capital 5,557,775 5,557,775
Share premium account 12,270,124 12,270,124
Eligible reserves 4,384,056 4,429,333
Retained earnings / (-) loss 32,412,538 27,403,808
Dividend expected/proposed* (2,223,110) (2,223,110)
Eligible amount of minority interest 9,066 8,028CET1 capital before the regulatory adjustments and threshold deduction 52,410,449 47,445,958
Less: Regulatory deductions (5,732,433) (5,995,195)Total CET1 capital after the regulatory adjustments and threshold deduction 46,678,016 41,450,763
Total CET1 capital after transitional arrangement for deductions (CET1) (A) 46,678,016 42,649,802
Additional Tier 1 (AT1) Capital
Eligible AT1 capital 8,929,368 9,477,076
Other AT1 Capital e.g. (Share premium, minority interest) - -
Total AT1 capital 8,929,368 9,477,076
Total AT1 capital after transitional arrangements (AT1) (B) 8,929,368 8,877,557
Tier 2 (T2) Capital
Tier 2 Instruments e.g. subordinated loan 146,900 3,752,068
Other Tier 2 capital (including General Provisions, etc.) 3,048,252 3,102,694
Total T2 Capital 3,195,152 6,854,762
Total T2 capital after transitional arrangements (T2) (C) 3,195,152 6,255,243
Total Regulatory Capital ( A+B+C) 58,802,536 57,782,602
* On 17 January 2018, CBUAE issued BASEL III Capital supply standards and guidance, based on this guidance Banks are required to deduct proposed dividend from retained earnings while calculating the Capital Adequacy ratio.
Accordingly, the Capital Adequacy ratio for 2017 and 2018 is calculated after considering the impact of proposed dividend for 2017 and 2018.
97 98EMIRATES NBD BANK PJSC - GROUP CONSOLIDATED FINANCIAL STATEMENTS - FOR THE YEAR ENDED 31 DECEMBER 2018
NOTES TO THE GROUP CONSOLIDATED FINANCIAL STATEMENTSFOR THE YEAR ENDED 31 DECEMBER 2018
NOTES TO THE GROUP CONSOLIDATED FINANCIAL STATEMENTSFOR THE YEAR ENDED 31 DECEMBER 2018
50 RISK MANAGEMENT (CONTINUED)
B. The risk function (continued)
Group Risk assists in controlling and actively managing the Group’s overall risk profile. The role of the function is:
• To ensure the risk management framework is effectively communicated and implemented across the Group and is appropriate to the Group’s activities;
• To exercise direct ownership for various risk types including but not limited to credit, market, country, operational, reputational risks;
• To ensure that the Group’s business strategies, risk policies, procedures and methodologies are consistent with the Group’s risk appetite;
• To ensure the integrity of the Group’s risk/return decisions guaranteeing their transparency;• To ensure that appropriate risk management architecture and systems are developed and implemented.
C. Risk appetite
The Group Risk Appetite Statement (Group RAS) is an articulation of the risk that the Group would be willing to accept, underwrite and/or be exposed to in the normal course of its business conduct.
The Group RAS is a critical component and extension of the GRMF. It is a mechanism used by the Group to proactively establish and subsequently monitor the group’s risk profile using a set of pre-defined key risk metrics and respective thresholds.
D Credit risk
Credit risk is the risk of suffering financial loss, should any of the Group’s customers, clients or market counterparties fail to fulfil their contractual obligation to the Group. Credit risk arises mainly from interbank, commercial and consumer loans and advances, and loan commitments arising from such lending activities, but can also arise from credit enhancement provided, such as credit derivatives (credit default swaps), financial guarantees, letter of credit, endorsement and acceptances.
The Group is also exposed to other credit risks arising from investments in debt securities and other exposures arising from its trading activities (“trading exposures”) including non-equity trading portfolio assets and derivatives as well as settlement balances with market counterparties and reverse repurchase agreements.
Credit risk management
Group’s approach to credit risk management is based on the foundation of independence and integrity of risk management. This is ensured through a well-defined and robust organisation structure duly supported by various risk committees, forums, systems, policies, procedures and processes providing a strong risk infrastructure and management framework.
The Group’s credit policy focuses on the core credit principles, lending guidelines and parameters, control and monitoring requirements, problem loan identification, management of high risk counterparties and provisioning. Standard procedures specific to businesses have been established to manage various types of risks across different business segments, products and portfolios.
Portfolio performance is periodically measured against RAS parameters and breaches if any are actioned by the Group’s Executive Committee.
50 RISK MANAGEMENT (CONTINUED)
A. Risk governance
The risk governance structure of the Group ensures central oversight and control with clear accountability for and ownership of risk.
The Board of Directors (the Board) has the ultimate responsibility for setting Group’s risk appetite and for the establishment and oversight of the Group’s risk management framework. This is managed through a number of committees; namely Board Risk Committee (BRC), Board Credit & Investment Committee (BCIC) and Board Audit Committee (BAC). The management level committees also actively manage risk particularly the Group Risk Committee (GRC), Management Credit Committee (MCC), Management Investment Committee (MIC), Retail Credit Committee (RCC) and Group Asset Liability Management Committee (Group ALCO).
BRC comprises of members of the Board and is responsible for risk oversight responsibilities of the Board with regards to risk governance, risk appetite and the risk management framework. The BRC receives reports on risk management including our portfolio trends, policies and standards, stress testing, liquidity and capital adequacy and is authorized to investigate or seek any information relating to any activity within its terms of reference.
BCIC is responsible for approval of credit and investment decisions above the MCC and MIC’s authority.
The primary role BAC is to have oversight and review of financial, audit and internal control issues as well as oversee the independence and performance of Group’s external and internal auditors.
MCC is management level committee which carries out credit lending decisions including but not limited to approval and renewal of credit facilities, review and monitor portfolio performance, decisions on debt settlement, provisioning write off and amendments to pricing, grades and waiver.
The role of the MIC is to support the Board in the management of the Investment Portfolios of the Group to ensure they conform to the strategic vision of the same and support the Board in monitoring and reporting the performance of these portfolios.
The Group ALCO is responsible for balance sheet management and quality of the funding plan as well as the management of capital and the establishment of, and compliance with, policies relating to balance sheet management, including management of our liquidity, capital adequacy and structural foreign exchange and interest rate risk. The committee also approves the contingency funding plan as well as the funds transfer pricing among other things.
The GRC is responsible for the management of all risks other than those delegated to MCC, MIC and Group ALCO and ensures the effective management of risk throughout the Group in support of the Group’s business strategy and group’s risk appetite. The committee approves risk policies and analytical models to ensure effective management of credit, market, operational, business continuity and reputational, compliance, legal and other risks confronting the Group.
B. The risk function
The GRMF is managed by the Group Risk management function (Group Risk), headed by the Group Chief Risk Officer (CRO). The function is independent of the business (origination, trading and sales functions) to ensure that the necessary balance in risk/return decisions is not compromised by pressures for better results in terms of revenues and to ensure transparency of decisions in accordance with group standards and policies.
99 100EMIRATES NBD BANK PJSC - GROUP CONSOLIDATED FINANCIAL STATEMENTS - FOR THE YEAR ENDED 31 DECEMBER 2018
NOTES TO THE GROUP CONSOLIDATED FINANCIAL STATEMENTSFOR THE YEAR ENDED 31 DECEMBER 2018
NOTES TO THE GROUP CONSOLIDATED FINANCIAL STATEMENTSFOR THE YEAR ENDED 31 DECEMBER 2018
50 RISK MANAGEMENT (CONTINUED)
D. Model risk management (continued)
clearly defined roles and responsibilities, policies and controls for managing model risk. The Framework is reviewed on a regular basis to ensure it meets regulatory standards and international practices. Any major change to the Framework must be approved by the Board of Directors or the BRC.
The Group has an independent validation function that performs independent model validation. It provides Fit-for-Purpose (FFP), Conditional Approval (CA) or Not Fit-for-Purpose (NFFP) recommendation for the BRC or an appropriately delegated authority to approve the use of the new risk quantification / valuation models. In addition to new model validation, the validation function also evaluates the performance of existing models through an annual validation process. The independency of the team enables it to serve as an effective second line of defense for the bank.
Credit approving authorities
BCIC has delegated credit approving authorities to the MCC, MIC, RCC and members of senior management to facilitate and effectively manage the business. However, BCIC has retained the ultimate authority to approve credits beyond MCC authority.
Credit risk measurement
The estimation of credit risk for risk management purpose is complex and requires use of models, as the exposure varies with changes in market condition, expected cash flows and the passage of time. The assessment of credit risk of a portfolio of assets entails further estimations as to the likelihood of defaults occurring and of the associated loss ratios. The Group measures credit risk using PD, EAD and LGD. This is similar to the approach used for the purpose of measuring ECL under IFRS 9.
Credit risk grading
The Group uses internal credit risk grading that reflects its assessment of the probability of default of individual counterparties. The Group uses internal rating models tailored to various categories of counterparty. Borrower and loan specific information collected at the time of application (such as disposable income, and level of collateral for retail exposure; and turnover and industry type considerations which may not be captured as part of the other data inputs into the model.
The credit grades are calibrated, such that the risk of default increases exponentially at each higher risk grade. For example, the difference in the PD between a 1A and 2A rating grade is lower than the difference in the PD between a 3A and 4A rating grade.
The following are additional considerations for each type of portfolio held by the Group:
Retail:
After the date of initial recognition, for retail business, the payment behavior of the borrower is monitored on a periodic basis to develop a behavioral score. Any other known information about the borrower which impacts their credit worthiness such as: unemployment and previous delinquency history is also incorporated into the behavior score. This score is mapped to a PD.
50 RISK MANAGEMENT (CONTINUED)
D. Credit Risk (continued)
Credit risk management (continued)
Wholesale banking credit risk management:
Credit facilities are granted based on the detailed credit risk assessment of the counterparty. The assessment considers amongst other things the purpose of the facility, sources of re-payment, prevailing and potential macro-economic factors, industry trends, customers’ credit worthiness and standing within the industry.
The credit facility administration process is undertaken by an independent function to ensure proper execution of all credit approvals, maintenance of documentation and proactive controls over maturities, expiry of limits and collaterals.
Operations are managed by independent units responsible for processing transactions in line with credit approvals and standard operating guidelines.
Management of Early Alert (EA), Watch List (WL) & Impaired Non Performing Loans (NPL) - The Group has
a well-defined process for identification of EA, WL & NPL accounts and dealing with them effectively. There are policies which govern credit grading of EA, WL & NPL accounts and impairment, in line with IFRS and regulatory guidelines.
Consumer banking credit risk management:
The Group has a structured management framework for Consumer Banking risk management. The framework enables the Group in identification and evaluation of the significance of all credit risks that the Group faces, which may have an adverse material impact on its financial position.
In the Consumer Banking portfolio, losses stem from outright default due to inability or unwillingness of a customer to meet commitments in relation to lending transactions.
The Group’s provisioning policy, which is in line with the IFRS and the regulatory guidelines, allows the Group to prudently recognize impairment on its retail portfolios.
Model risk management
The Group has utilised models in many of its financial and business activities from underwriting a credit facility to reporting expected loss under the IFRS9 accounting standards.
To manage the model risks, the Group has implemented the Group Model Governance Framework (the Framework). The Framework is a group wide policy and is applicable to models in all entities and subsidiaries of the Group. According to the Framework, all internally or externally (vendor based) developed risk quantification models that directly affect the financial reporting on Expected Loss (EL) and Lifetime Expected Loss (LEL) require independent validation.
The Framework establishes a systematic approach to manage the development, validation, approval, implementation and on-going use of the models. It sets out an effective management structure with
101 102EMIRATES NBD BANK PJSC - GROUP CONSOLIDATED FINANCIAL STATEMENTS - FOR THE YEAR ENDED 31 DECEMBER 2018
NOTES TO THE GROUP CONSOLIDATED FINANCIAL STATEMENTSFOR THE YEAR ENDED 31 DECEMBER 2018
NOTES TO THE GROUP CONSOLIDATED FINANCIAL STATEMENTSFOR THE YEAR ENDED 31 DECEMBER 2018
50 RISK MANAGEMENT (CONTINUED)
D. Credit Risk (continued)
Credit risk measurement (continued)
Wholesale:
For wholesale business, the rating is determined at the borrower level. A relationship manager will incorporate any updated or new information/credit assessment into the credit system on an ongoing basis. In addition, the relationship manager will also update information about the creditworthiness of the borrower every year from sources such as public financial statements. This will determine the updated internal credit rating and PD.
Treasury:
For debt securities in the Treasury portfolio, external rating agency credit grades are used. These published grades are continuously monitored and updated. The PDs associated with each grade are determined based on realized default rates over the prior 12 months, as published by the rating agency.
The Group’s rating method comprises 24 rating levels for instruments not in default (1 to 24) and 4 default classes (25 to 28). The Group’s internal rating scale are mapped with external ratings. The master scale assigns each rating category a specified range of probabilities of default, which is stable over time. The rating models are reviewed for recalibration so that they reflect the latest projections in the light of all actually
observed defaults.
ECL measurement
IFRS 9 outlines a ‘three-stage’ model for impairment based on changes in credit-quality since initial recognition as summarized below:
• A financial instrument that is not credit-impaired on initial recognized is classified in stage 1 and has its credit risk continuously monitored by the Group.
• If a significant increase in credit risk (‘SICR’) since initial recognition is identified, the financial instrument is moved to ‘stage 2’ but is not yet deemed to be credit-impaired.
• If the financial instrument is credit-impaired, the financial instrument is then moved to stage 3. • Financial instrument in stage 1 have their ECL measured at an amount equal to the portion of lifetime ECL
that results from default events possible within the next 12 months. Instruments in stages 2 or 3 have their ECL measured based on a lifetime basis.
• ECL is measured after factoring forward-looking information. • ECL on Purchase or originated credit-impaired financial assets is measured on a lifetime basis.
Significant increase in credit risk
The Group considers a financial instrument to have experienced a significant increase in credit risk when one or more of the following quantitative, qualitative or backstop criteria have been met:
50 RISK MANAGEMENT (CONTINUED)
D. Credit Risk (continued)
Credit risk measurement (continued)
Quantitative criteria:
Wholesale: Significant increase in credit risk is measured by comparing the risk of default estimated at origination with
the risk of default at reporting date.
Retail: Thresholds have been set for each portfolio based on historical default rates. Facilities exceeding the threshold are considered for significant increase in credit risk. Qualitative criteria: The Group also considers in its assessment of significant increase in credit risk, various qualitative factors
like significant adverse changes in business, extension of term granted, actual and expected forbearance or restructuring, early sign of cash flows and liquidity problems.
Backstop: A backstop is applied and the financial instrument considered to have experienced a significant increase in
credit risk if the borrower is more than 30 days past due on its contractual payments.
Definition of default and credit-impaired assets
The Group defines a financial instrument as in default, which is fully aligned with definition of credit-impaired, when it meets one or more of the following criteria:
Quantitative: The borrower is more than 90 days past due on its contractual payments.
Qualitative: The borrower meets unlikeliness to pay criteria, which indicates the borrower is in significant financial difficulty.
These are instances like long-term forbearance, borrower is insolvent, borrower is entering bankruptcy etc.
103 104EMIRATES NBD BANK PJSC - GROUP CONSOLIDATED FINANCIAL STATEMENTS - FOR THE YEAR ENDED 31 DECEMBER 2018
NOTES TO THE GROUP CONSOLIDATED FINANCIAL STATEMENTSFOR THE YEAR ENDED 31 DECEMBER 2018
NOTES TO THE GROUP CONSOLIDATED FINANCIAL STATEMENTSFOR THE YEAR ENDED 31 DECEMBER 2018
50 RISK MANAGEMENT (CONTINUED)
D. Credit Risk (continued)
Credit risk measurement (continued)
Forward-looking information incorporated in the ECL model
The assessment of SICR and the calculation of ECL both incorporate forward-looking information. The Group has performed historical analysis and identified key economic variables impacting credit risk and ECL for each portfolio.
These economic variables and their associated impact on PD, EAD and LGD vary by financial instrument. Expert judgement has also been applied in this process. Forecast of these economic variables (the “base economic scenario”) are provided by the Group’s Economic Research team on a quarterly basis.
The impact of these economic variables on the PD, EAD and LGD has been determined by performing statistical analysis to understand the impact changes in these variables have had historically on default rates and on the components of LGD and EAD.
In addition to the base economic scenario, the Group’s Economic Research team also provide other possible scenarios along with scenarios weighting. The Group as at 31 December 2018, concluded that non-linearity’s are captured. The scenario weighting are determined by an expert credit judgement. As with any economic forecasts, the projections and likelihoods of the occurrence are subject to a high degree of inherent uncertainty and therefore the actual outcomes may be significantly different to those projected. The Group considers these estimates of the possible outcomes and has analyzed the non-linearity within the Group’s different portfolios to establish that the chosen scenario are appropriately representative of the range of portfolio scenarios. The Group has used base, upside and downside scenarios for its ECL estimation.
50 RISK MANAGEMENT (CONTINUED)
D. Credit Risk (continued)
Credit risk measurement (continued)
Curing
The Group continues to monitor such financial instruments for a minimum probationary period of 12 months to confirm if the risk of default has decreased sufficiently before upgrading such exposure from Lifetime ECL (Stage 2) to 12 months ECL (Stage 1).
The Group is observing a probationary period of a minimum of 3 instalments (for repayments which are on a quarterly basis or shorter) and 12 months (in cases where instalments are on a longer frequency than quarterly) after the restructuring, before upgrading from Stage 3 to 2.
Measuring ECL- Explanations of input, assumptions and estimation techniques
PD, EAD and LGD are multiplied together and adjusted for the likelihood of survival (i.e. the exposure has not prepaid or defaulted in earlier year) on annual basis. This effectively calculates an ECL for each future year, which is then discounted back to the reporting date and summed. The discount rate used in ECL computation is the original effective interest rate or an approximation thereof.
The Lifetime PDs are determined based on maturity profile. The maturity profile looks at how defaults develop on a portfolio throughout the remaining life of the loans. The maturity profile is based on historical observed data.
The EADs are determined based on the expected payment profile, which varies by product type.
• For amortizing products and bullet repayment loans, this is based on the contractual repayments owed by the borrower over the 12 months and lifetime basis. This is also adjusted for any overpayments made by the borrower.
• For revolving products, the EAD is predicted by taking current drawn balance and adding a credit conversion factor which allows for the expected drawdown of the remaining limit by the time of default.
LGDs are computed at facility level. This is dependent upon information such as exposure, collateral, business segment characteristics and macro-economic outlook.
Forward looking economic information is also included in determining the 12 month and lifetime PD, EAD and LGD.

105 106EMIRATES NBD BANK PJSC - GROUP CONSOLIDATED FINANCIAL STATEMENTS - FOR THE YEAR ENDED 31 DECEMBER 2018
NOTES TO THE GROUP CONSOLIDATED FINANCIAL STATEMENTSFOR THE YEAR ENDED 31 DECEMBER 2018
NOTES TO THE GROUP CONSOLIDATED FINANCIAL STATEMENTSFOR THE YEAR ENDED 31 DECEMBER 2018
50 RISK MANAGEMENT (CONTINUED)
D. Credit Risk (continued)
Credit risk measurement (continued)
Collateral management
Collaterals and guarantees are effectively used as mitigating tools by the Group. The quality of collateral is continuously monitored and assessed and the Group seeks to ensure enforceability of the collateral. Major categories of collaterals include cash/ fixed deposits, inventories, shares, guarantees (corporate, bank and personal guarantees), immovable properties, receivables, gold and vehicles.
Collaterals are revalued regularly as per the Group’s credit policy. In addition, ad hoc valuations are also carried out depending on the nature of collateral and general economic condition. This enables the Group to assess the fair market value of the collateral and ensure that risks are appropriately covered. Security structures and legal covenants are also subject to regular review.
Please refer to Pillar 3 disclosures for additional information on collaterals.
Write offs Loans and debt securities in wholesale banking are written off (either partially or in full) when there is no
realistic prospect of recovery. This is generally the case when the Group has exhausted all legal and remedial efforts to recover from the customers. However, financial assets that are written off could still be subject to enforcement activities in order to comply with the Group’s procedures for recovery of amounts due.
Non performing consumer loans, except for mortgage facilities and home financing, are written off at 181 days past due. All receivables remain active on the loan management system for recovery and any legal strategy the Group may deem fit to use.
50 RISK MANAGEMENT (CONTINUED)
D. Credit Risk (continued)
Credit risk measurement (continued)
Credit risk monitoring
Wholesale Banking: the Group’s exposures are continuously monitored through a system of triggers and early warning signals. These are supplemented by monitoring of account conduct, assessment of collateral and market intelligence and early alerts.
Early Alert accounts are identified based on oversight, vigilance and risk triggers. Account strategy and action plans on these accounts are regularly monitored and discussed in the Early Alert Committee meetings.
Additionally for IFRS 9 ECL computation, credit exposures are monitored and reported as per IFRS 9 requirements. Stage migrations, any exceptions to SICR criteria, other credit and impairment related matters are reviewed and approved by IFRS 9 Governance Forum.
Consumer Banking: risks of the Group’s loan portfolio are continuously assessed and monitored on the basis of exceptions, management information reports and returns generated by the business and credit units. Credit risk is also monitored on an ongoing basis with formal monthly and quarterly reporting to ensure that senior management is aware of shifts in the credit quality of the portfolio along with changing external factors.
Group credit risk mitigation strategy
The Group operates within prudential exposure ceilings set by the Board in line with UAE Central Bank guidelines. There are well laid out processes for exception management and escalation.
The Group has adopted measures to diversify the exposures to various sectors. Diversification is achieved by limiting concentration through setting customer, industry and geographical limits.
The risk transfer in the form of syndicated loans, risk participation agreements with other banks, credit default swaps and sale of loans are globally accepted practices followed by the Group, where appropriate, to limit its exposure.

107 108EMIRATES NBD BANK PJSC - GROUP CONSOLIDATED FINANCIAL STATEMENTS - FOR THE YEAR ENDED 31 DECEMBER 2018
NOTES TO THE GROUP CONSOLIDATED FINANCIAL STATEMENTSFOR THE YEAR ENDED 31 DECEMBER 2018
NOTES TO THE GROUP CONSOLIDATED FINANCIAL STATEMENTSFOR THE YEAR ENDED 31 DECEMBER 2018
50 RISK MANAGEMENT (CONTINUED)
F. Classification of investment securities as per their external ratings
As of 31 December 2018
Trading securities at
FVTPLDesignated
at FVTPLFVOCI – debtinstruments
FVOCI– equity instruments
Amortised cost Total
AED 000 AED 000 AED 000 AED 000 AED 000 AED 000
AAA - - - - 668,851 668,851
AA- to AA+ 601,868 - 54,530 - 5,826,992 6,483,390
A- to A+ 979,200 - 999,634 - 3,209,957 5,188,791
Lower than A- 1,237,433 1,025 947,085 771 3,769,455 5,955,769
Unrated 206,064 748,145 311,236 65,335 474,673 1,805,453
3,024,565 749,170 2,312,485 66,106 13,949,928 20,102,254 Of which issued by:
Trading securities at
FVTPLDesignated
at FVTPLFVOCI – debtinstruments
FVOCI– equity instruments
Amortised cost Total
AED 000 AED 000 AED 000 AED 000 AED 000 AED 000
Governments 1,439,869 - 571,900 - 11,466,464 13,478,233Public sector enterprises 837,242 6,314 1,055,516 74 1,121,192 3,020,338
Private sector and others 747,454 742,856 685,069 66,032 1,362,272 3,603,683
3,024,565 749,170 2,312,485 66,106 13,949,928 20,102,254
50 RISK MANAGEMENT (CONTINUED)
E. Analysis by economic activity for assets:
The Group monitors concentrations of credit risk by economic activity sector. The analysis by economic activity is as follows:
2018 2017
AED 000 AED 000Loans and
ReceivablesIslamic
Financing Others Loans and Receivables
Islamic Financing Others
Manufacturing 5,991,431 2,371,589 - 6,393,109 1,691,366 147,004
Construction 7,022,626 1,618,561 77,805 5,696,969 2,168,691 360,477
Trade 18,398,133 7,971,047 - 13,897,772 6,349,359 -
Transport and communication 2,601,702 422,221 135,087 2,447,165 895,632 215,785
Services 5,202,191 1,733,913 799,627 5,124,307 1,690,464 739,126
Sovereign 150,269,100 1,112,846 13,478,234 139,986,832 558,814 12,396,349
Personal 39,302,586 26,216,463 - 35,315,689 25,557,267 -
Real estate 35,910,500 8,762,171 1,671,184 35,296,763 9,384,740 1,539,249
Hotels and restaurants 2,645,882 89,238 - 2,666,805 82,019 -Management of companiesand enterprises 11,647,190 1,176,078 - 12,463,393 290,842 -
Financial institutions and investment companies 14,278,395 3,406,788 45,304,444 13,361,246 2,722,103 52,598,251
Others 5,911,302 2,645,680 227,353 5,602,650 2,376,539 2,402,466
Total Assets 299,181,038 57,526,595 61,693,734 278,252,700 53,767,836 70,398,707
Less: Deferred Income - (2,074,625) - - (2,634,875) -
Less: Allowances for impairment (21,117,025) (5,585,483) (138,898) (20,648,034) (4,645,013) -
278,064,013 49,866,487 61,554,836 257,604,666 46,487,948 70,398,707
Others includes due from banks, investment securities and investments in associates and joint ventures.
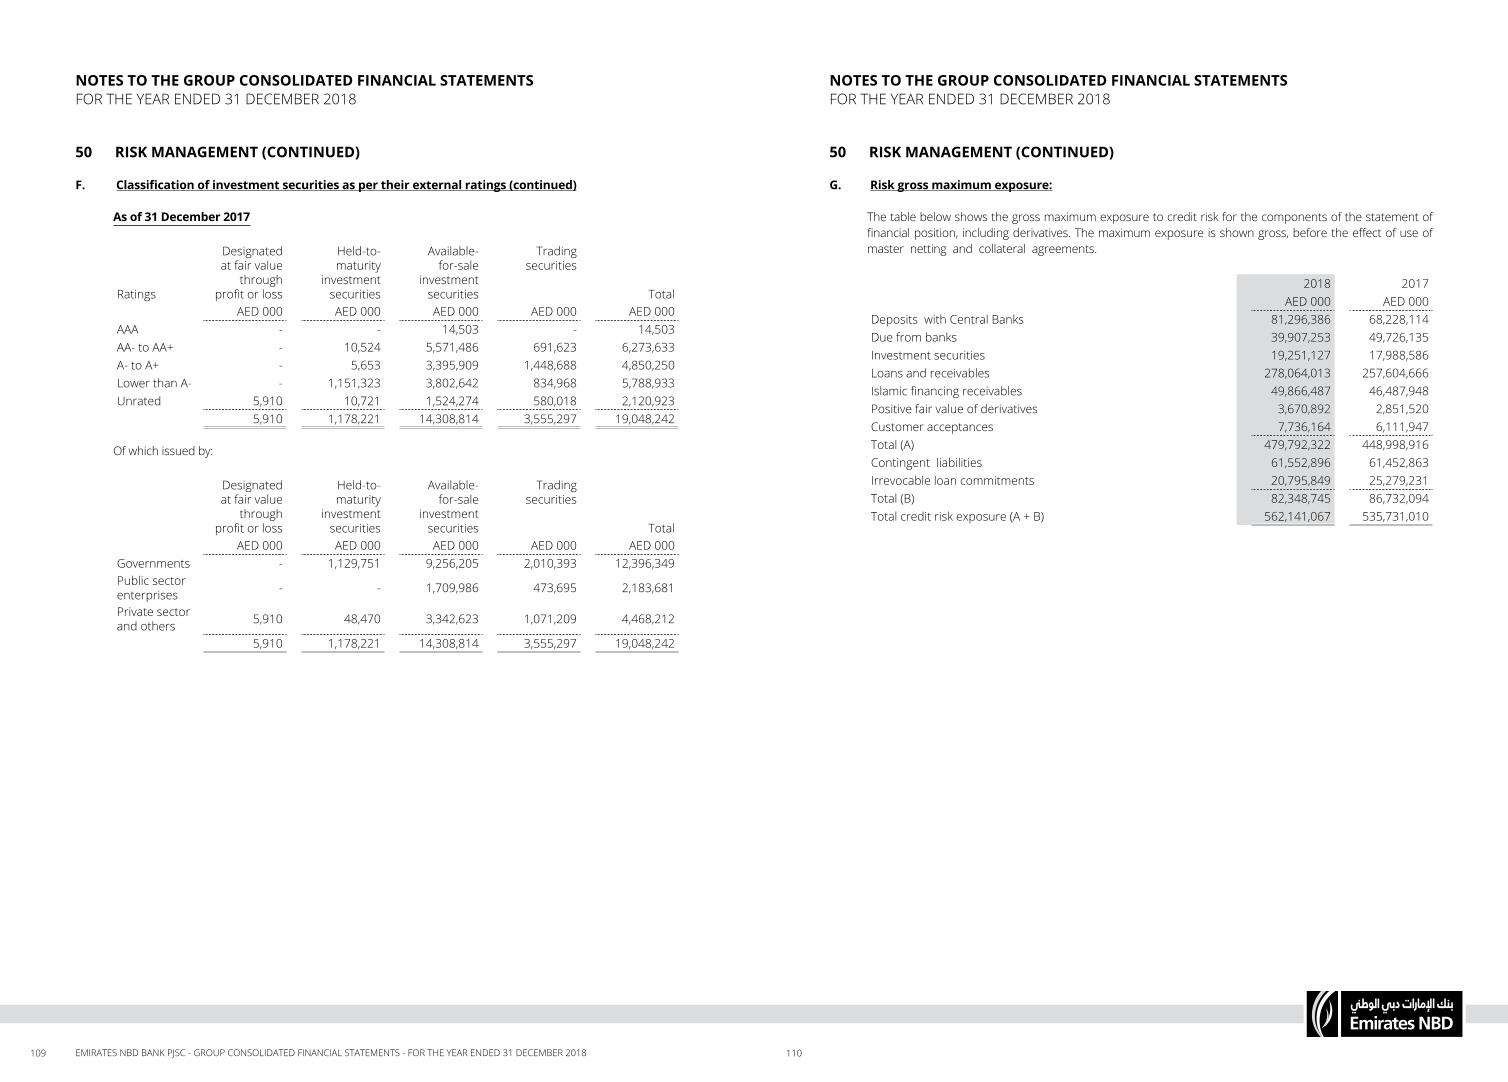
109 110EMIRATES NBD BANK PJSC - GROUP CONSOLIDATED FINANCIAL STATEMENTS - FOR THE YEAR ENDED 31 DECEMBER 2018
NOTES TO THE GROUP CONSOLIDATED FINANCIAL STATEMENTSFOR THE YEAR ENDED 31 DECEMBER 2018
NOTES TO THE GROUP CONSOLIDATED FINANCIAL STATEMENTSFOR THE YEAR ENDED 31 DECEMBER 2018
50 RISK MANAGEMENT (CONTINUED)
G. Risk gross maximum exposure:
The table below shows the gross maximum exposure to credit risk for the components of the statement of financial position, including derivatives. The maximum exposure is shown gross, before the effect of use of master netting and collateral agreements.
2018 2017AED 000 AED 000
Deposits with Central Banks 81,296,386 68,228,114Due from banks 39,907,253 49,726,135Investment securities 19,251,127 17,988,586Loans and receivables 278,064,013 257,604,666Islamic financing receivables 49,866,487 46,487,948Positive fair value of derivatives 3,670,892 2,851,520Customer acceptances 7,736,164 6,111,947Total (A) 479,792,322 448,998,916Contingent liabilities 61,552,896 61,452,863Irrevocable loan commitments 20,795,849 25,279,231Total (B) 82,348,745 86,732,094Total credit risk exposure (A + B) 562,141,067 535,731,010
50 RISK MANAGEMENT (CONTINUED)
F. Classification of investment securities as per their external ratings (continued)
As of 31 December 2017
Ratings
Designated at fair value
through profit or loss
Held-to- maturity
investment securities
Available-for-sale
investment securities
Trading securities
TotalAED 000 AED 000 AED 000 AED 000 AED 000
AAA - - 14,503 - 14,503AA- to AA+ - 10,524 5,571,486 691,623 6,273,633A- to A+ - 5,653 3,395,909 1,448,688 4,850,250Lower than A- - 1,151,323 3,802,642 834,968 5,788,933Unrated 5,910 10,721 1,524,274 580,018 2,120,923
5,910 1,178,221 14,308,814 3,555,297 19,048,242 Of which issued by:
Designated at fair value
through profit or loss
Held-to- maturity
investment securities
Available-for-sale
investment securities
Trading securities
TotalAED 000 AED 000 AED 000 AED 000 AED 000
Governments - 1,129,751 9,256,205 2,010,393 12,396,349Public sector enterprises - - 1,709,986 473,695 2,183,681
Private sector and others 5,910 48,470 3,342,623 1,071,209 4,468,212
5,910 1,178,221 14,308,814 3,555,297 19,048,242

111 112EMIRATES NBD BANK PJSC - GROUP CONSOLIDATED FINANCIAL STATEMENTS - FOR THE YEAR ENDED 31 DECEMBER 2018
NOTES TO THE GROUP CONSOLIDATED FINANCIAL STATEMENTSFOR THE YEAR ENDED 31 DECEMBER 2018
NOTES TO THE GROUP CONSOLIDATED FINANCIAL STATEMENTSFOR THE YEAR ENDED 31 DECEMBER 2018
50 RISK MANAGEMENT (CONTINUED)
H. Credit quality analysis:
AED 00031 December 2018
12-month ECL
Lifetime ECL not credit-
impaired
Lifetime ECL credit-
impairedTotal
Islamic financing receivables - Corporate bankingPerforming (Grades 1a-4f) 23,823,025 2,640,153 - 26,463,178Non performing (Grades 5a5-d) - - 4,319,255 4,319,255
Gross islamic financing receivables - Corporate banking
23,823,025 2,640,153 4,319,255 30,782,433
Islamic financing receivables - Retail bankingPerforming (Grades 1a-4f) 23,322,602 609,062 - 23,931,664Non performing (Grades 5a-5d) - - 737,873 737,873
Gross islamic financing receivables - Retail banking
23,322,602 609,062 737,873 24,669,537
Total gross islamic financing receivables 47,145,627 3,249,215 5,057,128 55,451,970
Allowance for impairment * (1,122,321) (752,284) (3,710,878) (5,585,483)
Carrying amount 46,023,306 2,496,931 1,346,250 49,866,487
Corporate Banking – Performing includes AED 45 million (2017: AED 328 million) for exposure against watchlist customers.
*This includes ECL on unfunded exposures amounting to AED 505 million in Stage 1 (exposure of AED 67,769 million), AED 20 million in Stage 2 (exposure of AED 3,339 million) and AED 1 million in Stage 3 (exposure of AED 2,228 million). Unfunded exposure includes guarantees, standby letter of credits and irrevocable loan commitments.
50 RISK MANAGEMENT (CONTINUED)
H. Credit quality analysis:
The following table sets out information about the credit quality of financial assets measured at amortised cost. Unless specifically indicated, for financial assets, the amounts in the table represent gross carrying amounts.
AED 00031 December 2018
12-month ECL
Lifetime ECL not credit-
impaired
Lifetime ECL credit-
impairedTotal
Loans and receivables to customers - Corporate bankingPerforming (Grades 1a-4f) 241,343,177 8,554,019 - 249,897,196Non performing (Grades 5a-5d) - - 15,373,245 15,373,245
Gross loans and receivables to customers - Corporate banking
241,343,177 8,554,019 15,373,245 265,270,441
Loans and receivables to customers - Retail bankingPerforming (Grades 1a-4f) 32,505,945 855,696 - 33,361,641Non performing (Grades 5a-5d) - - 548,956 548,956
Gross loans and receivables to customers - Retail banking
32,505,945 855,696 548,956 33,910,597
Total gross loans and receivables to customers 273,849,122 9,409,715 15,922,201 299,181,038
Allowance for impairment* (3,928,737) (1,639,483) (15,548,805) (21,117,025)
Carrying amount 269,920,385 7,770,232 373,396 278,064,013
Corporate Banking – Performing includes AED 2,803 million (2017: AED 4,650 million) for exposure against watchlist customers.

113 114EMIRATES NBD BANK PJSC - GROUP CONSOLIDATED FINANCIAL STATEMENTS - FOR THE YEAR ENDED 31 DECEMBER 2018
NO
TES
TO T
HE
GRO
UP
CON
SOLI
DA
TED
FIN
AN
CIA
L ST
ATE
MEN
TSFO
R TH
E YE
AR E
ND
ED 3
1 D
ECEM
BER
2018
50
RI
SK M
AN
AG
EMEN
T (C
ON
TIN
UED
)
I. Am
ount
s ar
isin
g fr
om E
CL (C
onti
nued
)
Isla
mic
fina
ncin
g re
ceiv
able
s31
Dec
embe
r 201
831
Dec
embe
r 201
7
AED
000
12-m
onth
EC
L
Life
time
ECL
not c
redi
t-im
paire
d
Life
time
ECL
cred
it-im
paire
dTo
tal
Specific
Colle
ctiv
eTo
tal
Bala
nce
at 1
Janu
ary
(as
per I
AS 3
9)58
3,66
4-
4,06
1,34
94,
645,
013
3,97
1,70
978
2,39
14,
754,
100
Reve
rsal
on
tran
sitio
n to
IFRS
9(5
83,6
64)
--
(583
,664
)-
--
ECL
reco
gnis
ed u
nder
IFRS
91,
324,
035
912,
169
13,4
562,
249,
660
--
-
Bala
nce
at 1
Janu
ary
(Adj
uste
d op
enin
g as
per
IFRS
9)
1,32
4,03
591
2,16
94,
074,
805
6,31
1,00
93,
971,
709
782,
391
4,75
4,10
0
Allo
wan
ces
for i
mpa
irmen
t mad
e du
ring
the
year
(201
,714
)(1
59,8
85)
1,42
6,38
01,
064,
781
1,42
6,78
5(1
98,7
39)
1,22
8,04
6
Writ
e ba
ck /
reco
verie
s m
ade
durin
g th
e ye
ar-
-(5
15,1
13)
(515
,113
)(6
53,1
19)
-(6
53,1
19)
Amou
nts
writ
ten
off d
urin
g th
e ye
ar-
-(1
,275
,439
)(1
,275
,439
)(6
84,1
47)
-(6
84,1
47)
Exch
ange
and
oth
er a
djus
tmen
ts-
-24
524
512
112
133
Clos
ing
bala
nce
1,12
2,32
175
2,28
43,
710,
878
5,58
5,48
34,
061,
349
583,
664
4,64
5,01
3
The
cont
ract
ual a
mou
nt o
utst
andi
ng o
n lo
ans
and
rece
ivab
les
whi
ch w
ere
writ
ten
off d
urin
g th
e ye
ar, a
nd a
re s
till s
ubje
ct to
enf
orce
men
t act
ivity
am
ount
ed to
AED
3,1
49
mill
ion.
NO
TES
TO T
HE
GRO
UP
CON
SOLI
DA
TED
FIN
AN
CIA
L ST
ATE
MEN
TSFO
R TH
E YE
AR E
ND
ED 3
1 D
ECEM
BER
2018
50
RI
SK M
AN
AG
EMEN
T (C
ON
TIN
UED
)
I. Am
ount
s ar
isin
g fr
om E
CL
Loan
s an
d re
ceiv
able
s31
Dec
embe
r 201
831
Dec
embe
r 201
7
AED
000
12-m
onth
ECL
Life
time
ECL
not c
redi
t- im
paire
d
Life
time
ECL
cred
it-im
paire
dTo
tal
Spec
ific
Colle
ctive
Tota
l
Bala
nce
at 1
Janu
ary
(as
per I
AS 3
9)7,
027,
384
-13
,620
,650
20,6
48,0
3413
,355
,890
6,23
7,30
619
,593
,196
Reve
rsal
on
tran
sitio
n to
IFRS
9(7
,027
,384
)-
-(7
,027
,384
)-
--
ECL
reco
gnis
ed u
nder
IFRS
93,
600,
003
1,65
2,87
12,
522,
864
7,77
5,73
8-
--
Bala
nce
at 1
Janu
ary
(Adj
uste
d op
enin
g as
per
IFRS
9)
3,60
0,00
31,
652,
871
16,1
43,5
1421
,396
,388
13,3
55,8
906,
237,
306
19,5
93,1
96
Allo
wan
ces
for i
mpa
irmen
t mad
e du
ring
the
year
328,
734
(13,
388)
2,39
6,49
92,
711,
845
2,03
7,85
879
0,73
12,
828,
589
Writ
e ba
ck /
reco
verie
s m
ade
durin
g th
e ye
ar-
-(1
,116
,097
)(1
,116
,097
)(1
,124
,142
)-
(1,1
24,1
42)
Amou
nts
writ
ten
off d
urin
g th
e ye
ar-
-(1
,873
,405
)(1
,873
,405
)(6
48,2
82)
-(6
48,2
82)
Exch
ange
and
oth
er a
djus
tmen
ts-
-(1
,706
)(1
,706
)(6
74)
(653
)(1
,327
)
Clos
ing
bala
nce
3,92
8,73
71,
639,
483
15,5
48,8
0521
,117
,025
13,6
20,6
507,
027,
384
20,6
48,0
34
115 116EMIRATES NBD BANK PJSC - GROUP CONSOLIDATED FINANCIAL STATEMENTS - FOR THE YEAR ENDED 31 DECEMBER 2018
NOTES TO THE GROUP CONSOLIDATED FINANCIAL STATEMENTSFOR THE YEAR ENDED 31 DECEMBER 2018
NOTES TO THE GROUP CONSOLIDATED FINANCIAL STATEMENTSFOR THE YEAR ENDED 31 DECEMBER 2018
50 RISK MANAGEMENT (CONTINUED)
K. Market risk
Market risk is the risk that the value of financial instruments in the Group’s books – with the inclusion of some other financial assets and liabilities could produce a loss because of changes in future market conditions.
The Group takes on Market Risks in the pursuit of its strategic and business objectives.
The Group predominantly pursues opportunities in the market that exposes itself to the following categories of market risk - which are actively managed and monitored:
1. Interest Rate Risk: losses in value due to changes in the level, slope and curvature of yield curves, the volatility of interest rates and changes in credit spreads;
2. FX Risk: losses in value due to exposures to changes in spot prices, forward prices and volatilities of currency rates;
3. Commodity Price Risk: losses in value due to exposures to changes in spot prices, forward prices and volatilities of commodities such as petrochemicals, base and precious metals, and food stocks.
Respective portfolio managers are accountable for managing market risk within the approved limits. These managers have extensive knowledge of markets and products, their risk exposures and of the financial instruments available to hedge their exposures.
The Group’s risk exposures to market risk are segregated into Trading and Banking Books. The Trading Book include those financial instruments held with trading intent arising from market-making, position-taking and other so designated financial instruments accounted for at fair value daily. The Banking Book include financial instruments not held with trading intent that arise from the management of Interest Rate risk and FX risk from the Group’s consumer and commercial banking assets and liabilities, and other financial investments designated as either FVOCI or Amortised Cost.
Market risk oversight and management process
As part of the Group’s enterprise-wide risk management framework, an extensive governance processes is applied to the market risk taking activities. This governance framework includes, inter alia:
• Approval by the Board Risk Committee and Group Asset-Liability Committee of a set of risk limits with appropriate monitoring, reporting and limits excesses’ escalation procedures;
• Independent valuation of financial instruments in the Trading Book and measurement of market risk;• A comprehensive set of policies, procedures and limits; and• Monitoring a wide range of risk metrics appropriate for the respective trading activities - such as risk
sensitivities, Gross and Net open positions, Value-at-Risk (VaR) and stop-loss limits.
50 RISK MANAGEMENT (CONTINUED)
J. Impairment reserve under the Central Bank of UAE (CBUAE) guidance
The CBUAE issued its IFRS 9 guidance on 30 April 2018 via notice no. CBUAE/BSD/2018/458 addressing various implementation challenges and practical implications for Banks adopting IFRS 9 in the UAE (“the guidance”).
Pursuant to clause 6.4 of the guidance, the reconciliation between general and specific provision under Circular 28/2010 of CBUAE and IFRS 9 is as follows:
2018AED 000
Impairment reserve: General
General provisions under Circular 28/2010 of CBUAE 3,657,902
Less: Stage 1 and Stage 2 provisions under IFRS 9 7,442,825
General provision transferred to the impairment reserve* -
Impairment reserve: SpecificSpecific provisions under Circular 28/2010 of CBUAE 19,259,683
Less: Stage 3 provisions under IFRS 9 (19,259,683)
Specific provision transferred to the impairment reserve* -
Total provision transferred to the impairment reserve -
*In the case where provisions under IFRS 9 exceed provisions under CBUAE, no amount shall be transferred to the impairment reserve.

117 118EMIRATES NBD BANK PJSC - GROUP CONSOLIDATED FINANCIAL STATEMENTS - FOR THE YEAR ENDED 31 DECEMBER 2018
NOTES TO THE GROUP CONSOLIDATED FINANCIAL STATEMENTSFOR THE YEAR ENDED 31 DECEMBER 2018
NOTES TO THE GROUP CONSOLIDATED FINANCIAL STATEMENTSFOR THE YEAR ENDED 31 DECEMBER 2018
50 RISK MANAGEMENT (CONTINUED)
K. Market risk (continued)
Market risk oversight and management process (continued)
December 2017
Market risk measureTrading portfolio
Non-trading portfolio
AED 000 AED 000 AED 000
Assets subject to market risk
Cash and deposits with Central Banks 71,852,618 - 71,852,618
Due from banks 49,726,135 - 49,726,135
Loans and receivables 257,604,666 - 257,604,666
Islamic financing receivables 46,487,948 - 46,487,948
Investment securities 19,048,242 3,561,207 15,487,035Investments in associates and joint ventures 1,624,330 - 1,624,330
Positive fair value of derivatives 2,851,520 2,436,184 415,336
Liabilities subject to market risk
Due to banks 21,311,193 - 21,311,193
Customer deposits 265,712,916 - 265,712,916
Islamic customer deposits 60,815,385 - 60,815,385
Debt issued and other borrowed funds 39,788,848 - 39,788,848
Sukuk payable 5,526,649 - 5,526,649
Negative fair value of derivatives 2,252,495 1,948,648 303,847
The impact of sensitivity analysis on foreign exchange risk and equity price risk on the income statement and other comprehensive income is immaterial.
50 RISK MANAGEMENT (CONTINUED)
K. Market risk (continued)
Market risk oversight and management process (continued)
The Group uses appropriate and independently validated market standard models for the revaluation and risk measurement of its linear and non-linear financial products and receives regular market information from independent market data providers in order to measure and monitor market risk.
Details of allocation of assets and liabilities subject to market risk between trading and non-trading portfolios are as follows:
December 2018
Market risk measureTrading portfolio
Non-trading portfolio
AED 000 AED 000 AED 000
Assets subject to market risk
Cash and deposits with Central Banks 84,604,316 - 84,604,316
Due from banks 39,907,253 - 39,907,253
Loans and receivables 278,064,013 - 278,064,013
Islamic financing receivables 49,866,487 - 49,866,487
Investment securities 20,066,403 3,024,565 17,041,838Investments in associates and joint ventures 1,581,180 - 1,581,180
Positive fair value of derivatives 3,670,892 3,256,507 414,385
Liabilities subject to market risk
Due to banks 22,339,668 - 22,339,668
Customer deposits 290,920,920 - 290,920,920
Islamic customer deposits 56,945,102 - 56,945,102
Debt issued and other borrowed funds 40,715,230 - 40,715,230
Sukuk payable 3,685,160 - 3,685,160
Negative fair value of derivatives 3,767,748 2,853,626 914,122

119 120EMIRATES NBD BANK PJSC - GROUP CONSOLIDATED FINANCIAL STATEMENTS - FOR THE YEAR ENDED 31 DECEMBER 2018
NOTES TO THE GROUP CONSOLIDATED FINANCIAL STATEMENTSFOR THE YEAR ENDED 31 DECEMBER 2018
NOTES TO THE GROUP CONSOLIDATED FINANCIAL STATEMENTSFOR THE YEAR ENDED 31 DECEMBER 2018
50 RISK MANAGEMENT (CONTINUED)
K. Market risk (continued)
Value-at-risk (continued)
Major currency-wise open positions of the Group are as follows:
2018 2017Long / (Short)
AED 000Long / (Short)
AED 000U.S. Dollar (USD) 3,331,213 (3,073,311)Oman Riyal (OMR) (307,621) (492,500)Saudi Riyal (SAR) (443,688) (543,313)Egyptian Pound (EGP) 88,823 223,897Bahraini Dinar (BHD) (244,256) (122,813)
L. Operational risk
Operational risk is defined as the risk of losses resulting from inadequate or failed internal processes, people, systems or from external events.
The Group’s objective is to prevent major Operational Risk losses and to protect the Group against any material damage. A Group-wide framework applying a pro-active approach to managing operational risk has been established. The Group has chosen a holistic approach to systematically identify, assess and manage operational risks across different products, processes, and client segments.
A comprehensive information security framework has been implemented to safeguard data and systems.
Requisite policies and processes are in place to report and monitor fraud.
A comprehensive and tailored insurance program is in place to protect the Group against unexpected and substantial unforeseeable losses.
Business Continuity Management
Business Continuity Management (BCM) is defined as a “holistic management process that identifies potential threats to an organization and the impacts to business operations that those threats, if realized, might cause, and which provides a framework for building organizational resilience with the capability for an effective response that safeguards the interests of its key stakeholders, reputation, brand and value-creating activities.”
The business continuity process across the Group is based on the international standard ISO22301:2012 (E). The BRC is responsible for providing oversight and strategy for Business Continuity Management.
50 RISK MANAGEMENT (CONTINUED)
K. Market risk (continued)
Trading book oversight by Group Market & Treasury Credit Risk (MTCR)
MTCR monitors the limits’ utilization in the Trading Book of the Group on a daily basis through a multi-layered Limit Monitoring System which uses independently sourced data and reports from the GM&T IT systems. Depending on the trading exposure and as appropriate, MTCR uses appropriate metrics including:
1. Non statistical metrics: Interest rate sensitivity, (DV01/PV01), FX sensitivity (FX01), Net open/ Net Gross outstanding positions, Maximum notional and tenor measures, Derivatives’ Greek sensitivities (Delta, Gamma, Vega), and Stop Loss limits;
2. Statistical metrics: Value-at-Risk (VaR), by Desk as well as total for the whole Trading Book.
The Group is not significantly exposed to structural FX Risk - which is a component of market risk - since the majority of the assets and liabilities of the Group are denominated predominately in either AED or in USD-pegged currencies from other GCC countries.
Value-at-Risk
To better capture the multi-dimensional aspects of market risk, the Group’s primary market risk metric is a statistical one, Value-at-Risk, which is used for short-term risk holding periods. VaR metrics are calculated daily for the specific Trading Desk, such as Interest Rate Desk VaR, Foreign Exchange Desk VaR and overall Trading Book VaR.
The Group’s year-end VaR numbers reported below have been calculated using the following parameters:
• Statistical level of confidence: 99% • Holding period: 1 business day • Methodology: Full Revaluation, Historical Simulation using over 2 years of historical market data
* Note that the sum of asset class VaR metrics does not add up to the reported Total VaR metric due to diversification and cross correlation effects.
2018AED 000
2017AED 000
Average Maximum Minimum Actual* Average Maximum Minimum Actual*
By Trading desk
Interest rate risk 18,470 29,223 2,381 3,402 5,972 15,553 2,454 12,034
Foreign exchange risk 12,687 26,764 6,648 7,307 9,528 29,134 2,442 12,081
Credit trading risk 929 3,015 220 1,831 1,103 3,291 150 1,244
Total 23,947 42,902 6,331 6,647 10,680 28,560 3,233 11,595

121 122EMIRATES NBD BANK PJSC - GROUP CONSOLIDATED FINANCIAL STATEMENTS - FOR THE YEAR ENDED 31 DECEMBER 2018
NOTES TO THE GROUP CONSOLIDATED FINANCIAL STATEMENTSFOR THE YEAR ENDED 31 DECEMBER 2018
NO
TES
TO T
HE
GRO
UP
CON
SOLI
DA
TED
FIN
AN
CIA
L ST
ATE
MEN
TSFO
R TH
E YE
AR E
ND
ED 3
1 D
ECEM
BER
2018
50
RI
SK M
AN
AG
EMEN
T (C
ON
TIN
UED
)
N.
Mat
urit
y an
alys
is o
f ass
ets
and
liabi
litie
s
Th
e ta
ble
belo
w s
umm
arize
s th
e m
atur
ity p
rofil
e of
the
Gro
up’s
asse
ts a
nd li
abilit
ies
base
d on
thei
r car
ryin
g va
lue:
31 D
ecem
ber
2018
With
in 3
m
onth
sO
ver 3
mon
ths
to 1
yea
rO
ver 1
yea
r to
3 ye
ars
Ove
r 3 y
ears
to
5 ye
ars
Und
ated
and
O
ver 5
yea
rsTo
tal
AED
000
AED
000
AED
000
AED
000
AED
000
AED
000
ASS
ETS
Cash
and
dep
osits
with
Cen
tral
Ban
ks71
,904
,316
12,7
00,0
00-
--
84,6
04,3
16
Due
from
ban
ks23
,473
,263
13,6
87,9
761,
369,
979
535,
811
840,
224
39,9
07,2
53
Inve
stm
ent s
ecur
ities
2,25
0,69
42,
388,
209
3,84
2,74
25,
234,
148
6,35
0,61
020
,066
,403
Loan
s an
d re
ceiv
able
s16
6,66
2,29
117
,369
,436
31,5
03,7
5919
,592
,159
42,9
36,3
6827
8,06
4,01
3
Isla
mic
fina
ncin
g re
ceiv
able
s18
,443
,130
8,57
8,07
09,
124,
026
4,47
8,09
59,
243,
166
49,8
66,4
87In
vest
men
ts in
ass
ocia
tes
and
join
t ve
ntur
es-
--
-1,
581,
180
1,58
1,18
0
Posi
tive
fair
valu
e of
der
ivat
ives
580,
867
858,
979
989,
171
709,
568
532,
307
3,67
0,89
2
Inve
stm
ent p
rope
rtie
s-
--
-54
9,70
554
9,70
5
Cust
omer
acc
epta
nces
7,73
6,16
4-
--
-7,
736,
164
Prop
erty
and
equ
ipm
ent
--
--
2,51
5,88
42,
515,
884
Goo
dwill
and
Inta
ngib
les
--
--
5,68
6,25
85,
686,
258
Oth
er a
sset
s3,
794,
233
2,29
9,95
8-
--
6,09
4,19
1
TOTA
L A
SSET
S29
4,84
4,95
857
,882
,628
46,8
29,6
7730
,549
,781
70,2
35,7
0250
0,34
2,74
6
RISK MANAGEMENT (CONTINUED)
M. Liquidity risk
Liquidity Risk refers to the inability of the Group to fund an increase in assets and meet obligations as they become due (Structural Funding Risk), or the inability to convert assets into cash at reasonable prices (Market Liquidity Risk). The risk arises from mismatches in the amount and timings of cash flows.
Objectives and Governance structure
The objective of the Group’s liquidity and funding management framework is to ensure that all foreseeable funding commitments (under both normal and stressed conditions) can be met when due, and that access to the wholesale markets is coordinated and cost effective. To this end, the Group maintains a diversified funding base comprising core consumer and corporate customer deposits and institutional balances. This is augmented with wholesale funding and portfolios of highly liquid assets diversified by currency and maturity which are held to enable the Group to respond quickly and smoothly to unforeseen liquidity requirements.
Policies and Procedures
Specifically, liquidity and funding management process includes:
• projecting cash flows under various stress scenarios and considering the level of liquid assets necessary in relation thereto;
• mis-match analysis between assets and liabilities for different periods with a focus on shorter time frames. These gap reports are based on contractual cash flow, retention and decay assumptions for non-maturing assets and liabilities and potential liquidity demand through undrawn commitments;
• monitoring balance sheet liquidity and advances to deposits ratios against internal and regulatory requirements;
• maintaining a diverse range of funding sources with back-up facilities;
• managing the concentration and profile of debt maturities;
• maintaining debt financing plans;
• monitoring customer depositor concentration in order to avoid undue reliance on large individual depositors and ensure a satisfactory overall funding mix; and
• maintaining liquidity and funding contingency plans. These plans identify early indicators of distress conditions and describe actions to be taken in the event of difficulties arising from systemic or other crisis, while minimising adverse long-term implications for the business.

123 124EMIRATES NBD BANK PJSC - GROUP CONSOLIDATED FINANCIAL STATEMENTS - FOR THE YEAR ENDED 31 DECEMBER 2018
NO
TES
TO T
HE
GRO
UP
CON
SOLI
DA
TED
FIN
AN
CIA
L ST
ATE
MEN
TSFO
R TH
E YE
AR E
ND
ED 3
1 D
ECEM
BER
2018
NO
TES
TO T
HE
GRO
UP
CON
SOLI
DA
TED
FIN
AN
CIA
L ST
ATE
MEN
TSFO
R TH
E YE
AR E
ND
ED 3
1 D
ECEM
BER
2018
50
RI
SK M
AN
AG
EMEN
T (C
ON
TIN
UED
)
O.
Anal
ysis
of fi
nanc
ial l
iabi
litie
s by
rem
aini
ng c
ontr
actu
al m
atur
itie
s
Th
e ta
ble
belo
w s
umm
arize
s th
e m
atur
ity p
rofil
e of
the
Gro
up’s
finan
cial
liab
ilitie
s at
31
Dec
embe
r 201
8 ba
sed
on c
ontr
actu
al u
ndis
coun
ted
repa
ymen
t obl
igat
ions
.
Re
paym
ents
whi
ch a
re s
ubje
ct to
not
ice
are
trea
ted
as if
not
ice
was
give
n im
med
iate
ly. H
owev
er, t
he G
roup
exp
ects
that
man
y cu
stom
ers
will
not r
eque
st re
paym
ent
on th
e ea
rlies
t dat
e, th
e G
roup
cou
ld b
e re
quire
d to
pay
and
the
tabl
e do
es n
ot r
eflec
t the
exp
ecte
d ca
sh fl
ows
indi
cate
d by
the
Gro
up’s
depo
sit r
eten
tion
hist
ory.
As
at 3
1 D
ecem
ber
2018
Carr
ying
am
ount
Gro
ss n
omin
al
outfl
ows
With
in 3
m
onth
sO
ver 3
mon
ths
to 1
yea
rO
ver 1
yea
r to
3 ye
ars
Ove
r 3 y
ears
to
5 ye
ars
Ove
r 5 y
ears
AED
000
AED
000
AED
000
AED
000
AED
000
AED
000
AED
000
Fina
ncia
l lia
bilit
ies
Due
to b
anks
22,3
39,6
68(2
3,61
9,75
9)(1
6,08
2,86
6)(3
,406
,360
)(6
00,3
28)
(1,4
77,8
46)
(2,0
52,3
59)
Cust
omer
dep
osits
290,
920,
920
(294
,137
,852
)(2
05,6
01,0
05)
(75,
376,
156)
(12,
214,
171)
(946
,520
)-
Isla
mic
cus
tom
er d
epos
its56
,945
,102
(57,
440,
383)
(41,
197,
939)
(15,
023,
715)
(1,1
77,3
69)
(41,
360)
-D
ebt i
ssue
d an
d ot
her
borr
owed
fund
s40
,715
,230
(45,
006,
508)
(650
,668
)(7
,610
,625
)(2
0,47
2,73
1)(9
,922
,037
)(6
,350
,447
)
Suku
k pa
yabl
e3,
685,
160
(4,0
03,4
94)
(32,
520)
(99,
367)
(3,8
71,6
07)
--
414,
606,
080
(424
,207
,996
)(2
63,5
64,9
98)
(101
,516
,223
)(3
8,33
6,20
6)(1
2,38
7,76
3)(8
,402
,806
)Le
tter
s of
cre
dit a
nd
guar
ante
es60
,959
,092
(60,
959,
092)
(26,
330,
006)
(22,
254,
978)
(9,5
45,4
10)
(1,0
86,5
28)
(1,7
42,1
70)
Irrev
ocab
le lo
an
com
mitm
ents
20,7
95,8
49(2
0,79
5,84
9)(9
,384
,987
)(4
,245
,575
)(7
,165
,287
)-
-
50
RI
SK M
AN
AG
EMEN
T (C
ON
TIN
UED
)
N.
Mat
urit
y an
alys
is o
f ass
ets
and
liabi
litie
s (c
onti
nued
)
31 D
ecem
ber
2018
With
in 3
m
onth
sO
ver 3
mon
ths
to 1
yea
rO
ver 1
yea
r to
3 ye
ars
Ove
r 3 y
ears
to
5 ye
ars
Und
ated
and
O
ver 5
yea
rsTo
tal
AED
000
AED
000
AED
000
AED
000
AED
000
AED
000
LIA
BILI
TIES
Due
to b
anks
16,0
21,3
943,
328,
080
479,
532
1,46
8,74
31,
041,
919
22,3
39,6
68
Cust
omer
dep
osits
203,
906,
236
74,9
79,3
7511
,110
,297
925,
012
-29
0,92
0,92
0
Isla
mic
cus
tom
er d
epos
its41
,019
,745
14,7
60,5
861,
125,
319
39,4
52-
56,9
45,1
02
Deb
t iss
ued
and
othe
r bor
row
ed fu
nds
296,
527
6,67
9,59
418
,813
,308
9,37
1,52
85,
554,
273
40,7
15,2
30
Suku
k pa
yabl
e-
-3,
685,
160
--
3,68
5,16
0
Neg
ativ
e fa
ir va
lue
of d
eriv
ativ
es66
8,19
71,
127,
094
639,
899
664,
228
668,
330
3,76
7,74
8
Cust
omer
acc
epta
nces
7,73
6,16
4-
--
-7,
736,
164
Oth
er li
abili
ties
5,77
5,78
04,
432,
611
--
-10
,208
,391
Tota
l equ
ity-
--
-64
,024
,363
64,0
24,3
63
TOTA
L LI
ABI
LITI
ES A
ND
EQ
UIT
Y27
5,42
4,04
310
5,30
7,34
035
,853
,515
12,4
68,9
6371
,288
,885
500,
342,
746
OFF
BA
LAN
CE S
HEE
T
Lett
ers
of c
redi
t and
gua
rant
ees
26,3
30,0
0622
,254
,978
9,54
5,41
01,
086,
528
1,74
2,17
060
,959
,092
31 D
ecem
ber
2017
ASS
ETS
261,
780,
972
62,8
64,4
1639
,034
,332
31,0
67,4
8675
,625
,077
470,
372,
283
LIA
BILI
TIES
AN
D E
QU
ITY
286,
811,
318
73,4
87,7
1228
,996
,745
14,6
86,1
3566
,390
,373
470,
372,
283
OFF
BA
LAN
CE S
HEE
T IT
EMS
28,3
18,2
6218
,912
,823
9,10
6,15
51,
882,
347
2,07
1,40
760
,290
,994

125 126EMIRATES NBD BANK PJSC - GROUP CONSOLIDATED FINANCIAL STATEMENTS - FOR THE YEAR ENDED 31 DECEMBER 2018
NOTES TO THE GROUP CONSOLIDATED FINANCIAL STATEMENTSFOR THE YEAR ENDED 31 DECEMBER 2018
NO
TES
TO T
HE
GRO
UP
CON
SOLI
DA
TED
FIN
AN
CIA
L ST
ATE
MEN
TSFO
R TH
E YE
AR E
ND
ED 3
1 D
ECEM
BER
2018
50 RISK MANAGEMENT (CONTINUED)
P. Interest rate risk in the banking book
Interest Rate Risk in the Banking Book (‘IRRBB’) is defined as the exposure of the non-trading products of the Group to interest rates. Non-trading portfolios include all banking book positions that arise from the interest rate on the Group’s consumer and commercial banking assets and liabilities, and financial investments designated as available for sale and amortised cost / held to maturity. IRRBB arises principally from mismatches between the future yields on assets and their funding costs, as a result of interest rate changes.
In order to manage this risk optimally, IRRBB in non-trading portfolios is transferred to Group Treasury under the supervision of the Group ALCO, through Funds Transfer Pricing (FTP) Systems. Group ALCO is required to regularly monitor all such interest rate risk positions to ensure they comply with interest rate risk limits.
For measuring overall interest sensitivity in the banking book, the Group conducts stress tests by simulating parallel shifts to the yield curve(s) ranging from 50 basis points to 200 basis points, and assessing the corresponding impact on its Net Interest Income.
As at 31 December 2018 As at 31 December 2017
AmountAED 000
VarianceAED 000
AmountAED 000
VarianceAED 000
Rates Up 200 bp 16,951,915 3,305,288 13,636,006 2,207,109Base Case 13,646,627 - 11,428,897 -Rates Down 200 bp 9,737,839 (3,908,788) 9,007,996 (2,420,901)
The interest rate sensitivities set out in the table above are based on a set scenario i.e. the projections above assume that interest rates of all maturities move by the same amount and, therefore, do not reflect the potential effect on net interest income of some rates changing while others remain unchanged. The projections also make the assumption that all positions run to maturity. This effect does not incorporate actions that would be taken by Group Treasury or in the business units to mitigate the impact of this interest rate risk. In practice, Group Treasury seeks proactively to change the interest rate risk profile to minimize losses and optimize net revenues.
50
RI
SK M
AN
AG
EMEN
T (C
ON
TIN
UED
)
O.
Anal
ysis
of fi
nanc
ial l
iabi
litie
s by
rem
aini
ng c
ontr
actu
al m
atur
itie
s (c
onti
nued
)
As
at 3
1 D
ecem
ber
2017
Carr
ying
am
ount
Gro
ss n
omin
al
outfl
ows
With
in 3
m
onth
sO
ver 3
mon
ths
to 1
yea
rO
ver 1
yea
r to
3 ye
ars
Ove
r 3 y
ears
to
5 ye
ars
Ove
r 5 y
ears
AED
000
AED
000
AED
000
AED
000
AED
000
AED
000
AED
000
Fina
ncia
l lia
bilit
ies
Due
to b
anks
21,3
11,1
93(2
1,36
7,99
5)(1
5,82
1,99
3)(4
,544
,512
)(3
0,33
2)(1
,989
)(9
69,1
69)
Cust
omer
dep
osits
265,
712,
916
(267
,258
,722
)(2
06,4
73,4
59)
(51,
911,
361)
(7,8
56,7
40)
(1,0
17,1
62)
-
Isla
mic
cus
tom
er d
epos
its60
,815
,385
(61,
189,
890)
(49,
257,
094)
(11,
736,
105)
(194
,044
)(2
,647
)-
Deb
t iss
ued
and
othe
r bo
rrow
ed fu
nds
39,7
88,8
48(4
3,39
4,21
9)(2
,831
,344
)(2
,400
,113
)(2
1,86
5,27
0)(1
0,27
3,34
3)(6
,024
,149
)
Suku
k pa
yabl
e5,
526,
649
(5,9
78,9
85)
(1,8
88,7
84)
(99,
367)
(264
,134
)(3
,726
,700
)-
393,
154,
991
(399
,189
,811
)(2
76,2
72,6
74)
(70,
691,
458)
(30,
210,
520)
(15,
021,
841)
(6,9
93,3
18)
Lett
ers
of c
redi
t and
gu
aran
tees
60,2
90,9
94(6
0,29
0,99
4)(2
8,31
8,26
2)(1
8,91
2,82
3)(9
,106
,155
)(1
,882
,347
)(2
,071
,407
)
Irrev
ocab
le lo
an
com
mitm
ents
25,2
79,2
31(2
5,27
9,23
1)(1
3,07
5,20
8)(5
,392
,458
)(6
,811
,565
)-
-
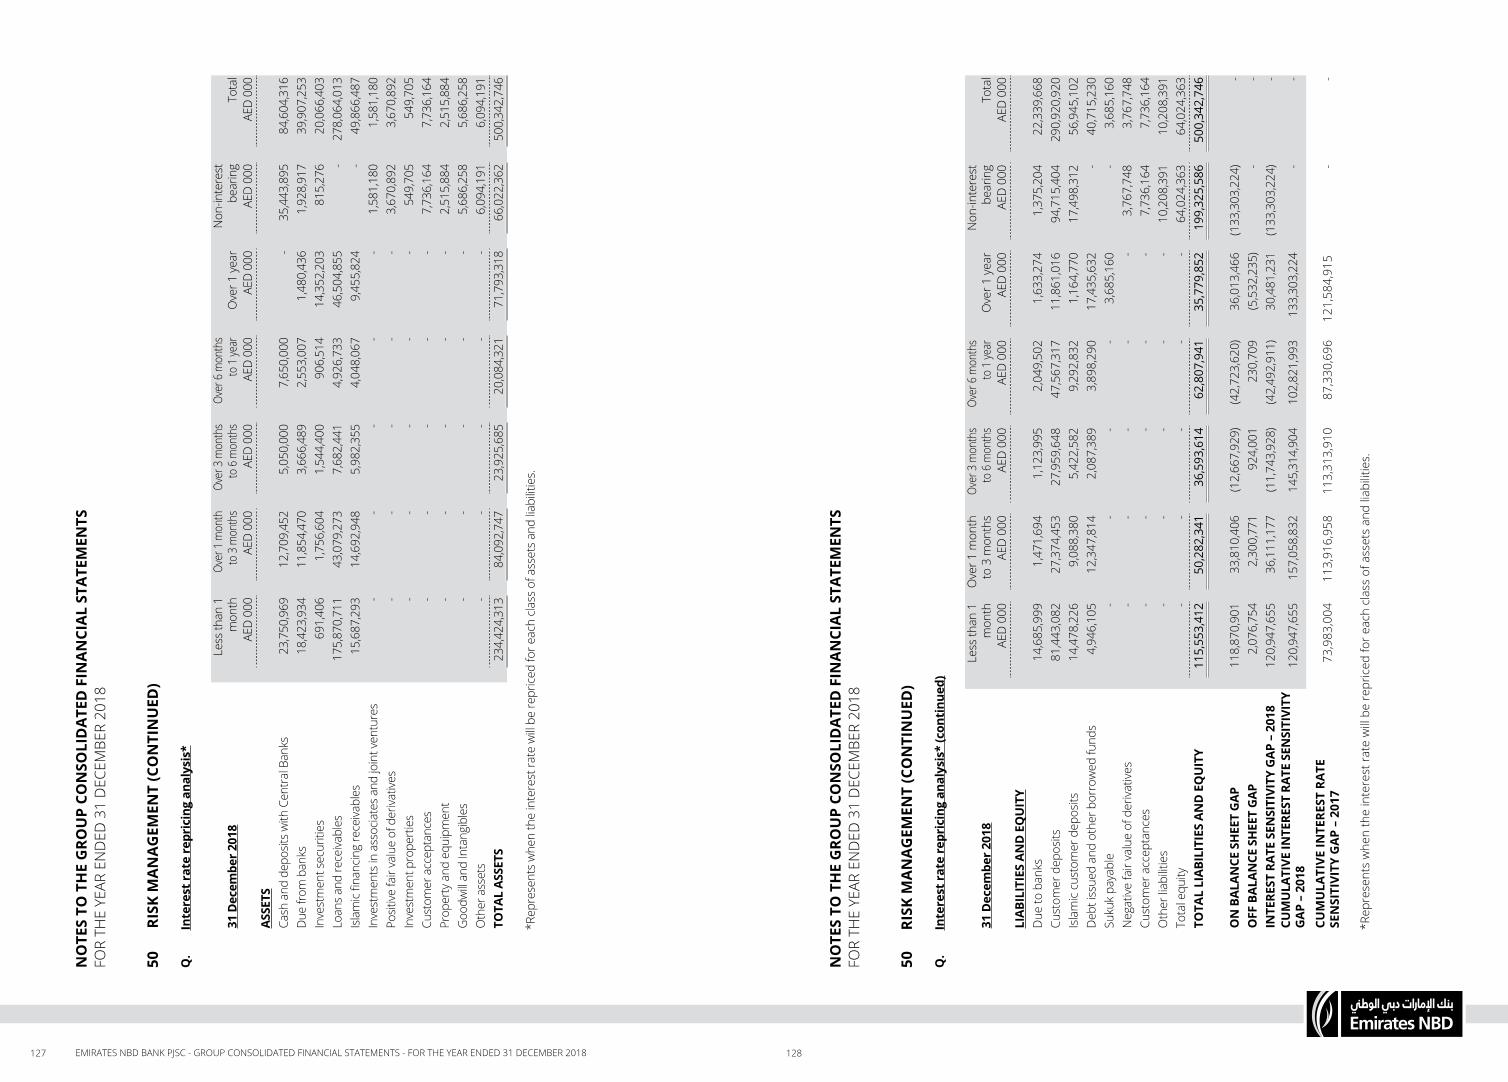
127 128EMIRATES NBD BANK PJSC - GROUP CONSOLIDATED FINANCIAL STATEMENTS - FOR THE YEAR ENDED 31 DECEMBER 2018
NO
TES
TO T
HE
GRO
UP
CON
SOLI
DA
TED
FIN
AN
CIA
L ST
ATE
MEN
TSFO
R TH
E YE
AR E
ND
ED 3
1 D
ECEM
BER
2018
NO
TES
TO T
HE
GRO
UP
CON
SOLI
DA
TED
FIN
AN
CIA
L ST
ATE
MEN
TSFO
R TH
E YE
AR E
ND
ED 3
1 D
ECEM
BER
2018
50
RISK
MA
NA
GEM
ENT
(CO
NTI
NU
ED)
Q.
Inte
rest
rat
e re
pric
ing
anal
ysis
* (c
onti
nued
)
31 D
ecem
ber
2018
Les
s th
an 1
mon
th O
ver 1
mon
thto
3 m
onth
s O
ver 3
mon
ths
to 6
mon
ths
Ove
r 6 m
onth
sto
1 ye
arO
ver 1
yea
r N
on-in
tere
stbe
arin
gTo
tal
AED
000
AED
000
AED
000
AED
000
AED
000
AED
000
AED
000
LIAB
ILIT
IES
AND
EQ
UIT
YD
ue to
ban
ks14
,685
,999
1,47
1,69
41,
123,
995
2,04
9,50
21,
633,
274
1,37
5,20
422
,339
,668
Cust
omer
dep
osits
81,4
43,0
8227
,374
,453
27,9
59,6
4847
,567
,317
11,8
61,0
1694
,715
,404
290,
920,
920
Isla
mic
cus
tom
er d
epos
its14
,478
,226
9,08
8,38
05,
422,
582
9,29
2,83
21,
164,
770
17,4
98,3
1256
,945
,102
Deb
t iss
ued
and
othe
r bor
row
ed fu
nds
4,94
6,10
512
,347
,814
2,08
7,38
93,
898,
290
17,4
35,6
32-
40,7
15,2
30Su
kuk
paya
ble
--
--
3,68
5,16
0-
3,68
5,16
0N
egat
ive fa
ir va
lue
of d
eriva
tives
--
--
-3,
767,
748
3,76
7,74
8Cu
stom
er a
ccep
tanc
es-
--
--
7,73
6,16
47,
736,
164
Oth
er li
abilit
ies
--
--
-10
,208
,391
10,2
08,3
91To
tal e
quity
--
--
-64
,024
,363
64,0
24,3
63TO
TAL
LIAB
ILIT
IES
AND
EQ
UIT
Y11
5,55
3,41
250
,282
,341
36,5
93,6
1462
,807
,941
35,7
79,8
5219
9,32
5,58
650
0,34
2,74
6
ON
BAL
ANCE
SH
EET
GAP
118,
870,
901
33,8
10,4
06(1
2,66
7,92
9)(4
2,72
3,62
0)36
,013
,466
(133
,303
,224
)-
OFF
BAL
ANCE
SH
EET
GAP
2,07
6,75
42,
300,
771
924,
001
230,
709
(5,5
32,2
35)
--
INTE
REST
RAT
E SE
NSI
TIVI
TY G
AP –
201
812
0,94
7,65
536
,111
,177
(11,
743,
928)
(42,
492,
911)
30,4
81,2
31(1
33,3
03,2
24)
-CU
MU
LATI
VE IN
TERE
ST R
ATE
SEN
SITI
VITY
G
AP –
201
812
0,94
7,65
515
7,05
8,83
214
5,31
4,90
410
2,82
1,99
313
3,30
3,22
4-
-
CU
MU
LATI
VE IN
TERE
ST R
ATE
SEN
SITI
VITY
GA
P –
2017
73,9
83,0
0411
3,91
6,95
811
3,31
3,91
087
,330
,696
121,
584,
915
--
*R
epre
sent
s w
hen
the
inte
rest
rate
will
be
repr
iced
for e
ach
clas
s of
ass
ets
and
liabi
litie
s.
50
RI
SK M
AN
AG
EMEN
T (C
ON
TIN
UED
)
Q.
Inte
rest
rat
e re
pric
ing
anal
ysis
*
31 D
ecem
ber 2
018
Les
s th
an 1
mon
th O
ver 1
mon
thto
3 m
onth
s O
ver 3
mon
ths
to 6
mon
ths
Ove
r 6 m
onth
sto
1 ye
arO
ver 1
yea
r N
on-in
tere
stbe
arin
gTo
tal
AED
000
AED
000
AED
000
AED
000
AED
000
AED
000
AED
000
ASSE
TSCa
sh a
nd d
epos
its w
ith C
entr
al B
anks
23,7
50,9
6912
,709
,452
5,05
0,00
07,
650,
000
-35
,443
,895
84,6
04,3
16D
ue fr
om b
anks
18,4
23,9
3411
,854
,470
3,66
6,48
92,
553,
007
1,48
0,43
61,
928,
917
39,9
07,2
53In
vest
men
t sec
uriti
es69
1,40
61,
756,
604
1,54
4,40
090
6,51
414
,352
,203
815,
276
20,0
66,4
03Lo
ans
and
rece
ivabl
es17
5,87
0,71
143
,079
,273
7,68
2,44
14,
926,
733
46,5
04,8
55-
278,
064,
013
Isla
mic
finan
cing
rece
ivabl
es15
,687
,293
14,6
92,9
485,
982,
355
4,04
8,06
79,
455,
824
-49
,866
,487
Inve
stm
ents
in a
ssoc
iate
s an
d jo
int v
entu
res
--
--
-1,
581,
180
1,58
1,18
0Po
sitive
fair
valu
e of
der
ivativ
es-
--
--
3,67
0,89
23,
670,
892
Inve
stm
ent p
rope
rtie
s-
--
--
549,
705
549,
705
Cust
omer
acc
epta
nces
--
--
-7,
736,
164
7,73
6,16
4Pr
oper
ty a
nd e
quip
men
t-
--
--
2,51
5,88
42,
515,
884
Goo
dwill
and
Inta
ngib
les
--
--
-5,
686,
258
5,68
6,25
8O
ther
ass
ets
--
--
-6,
094,
191
6,09
4,19
1TO
TAL
ASSE
TS23
4,42
4,31
384
,092
,747
23,9
25,6
8520
,084
,321
71,7
93,3
1866
,022
,362
500,
342,
746
*Rep
rese
nts
whe
n th
e in
tere
st ra
te w
ill be
repr
iced
for e
ach
clas
s of
ass
ets
and
liabi
litie
s.

129 130EMIRATES NBD BANK PJSC - GROUP CONSOLIDATED FINANCIAL STATEMENTS - FOR THE YEAR ENDED 31 DECEMBER 2018
NOTES TO THE GROUP CONSOLIDATED FINANCIAL STATEMENTSFOR THE YEAR ENDED 31 DECEMBER 2018
NOTES TO THE GROUP CONSOLIDATED FINANCIAL STATEMENTSFOR THE YEAR ENDED 31 DECEMBER 2018
50 RISK MANAGEMENT (CONTINUED)
U. Risk management framework and processes at Group entities
In establishing risk management policies & processes at the Group entities level, due consideration is given to the entities’ specific regulatory environment.
51 LEGAL PROCEEDINGS
Litigation is a common occurrence in the banking industry due to the nature of the business undertaken. The Group has proper controls and policies for managing legal claims. Once professional advice has been obtained and the amount of loss reasonably estimated, the Group makes adjustments to account for any adverse effects which the claims may have on its financial standing. Based on the information available, no material adverse impact on the financial position of the Group is expected to arise from legal claims as at 31 December 2018 other than to the extent already provided, hence no additional provision for any claim needs to be made in these financial statements.
52 SOCIAL CONTRIBUTIONS
The social contributions (including donations and charity) made during the year amount to AED 70.7 million (2017: AED 65.3 million).
50 RISK MANAGEMENT (CONTINUED)
R. Reputational risk
Reputational risk is the risk of potential loss of earnings and future revenue, loss in market value or lack of liquidity supply due to deterioration of reputation. It also includes the threat to the brand value of a financial institution.
Reputational risk can arise as a consequence of failures with a strong negative perception amongst clients, shareholders, creditors or the public. The Group has measures to ensure a positive perception of the Group and that overall risk management ensures appropriate management of reputational risk.
S. Regulatory/compliance risk
Regulatory/Compliance risk is the risk of reputational and/or financial losses due to the failure to comply with applicable laws, regulations or sanctions.
The Group has an independent Compliance function, with the necessary mandate and authority to enforce and monitor compliance on a Group wide basis. This includes compliance with the applicable laws and regulations across the various jurisdictions where the Group operates as well as those of the USD / EU clearing centres.
Compliance policies covering key areas such as Sanctions, Anti Money Laundering (AML), Counter Terrorist Financing (CTF), Foreign Account Tax Compliance Act (FATCA) and Common Reporting Standards (CRS) are applicable Group wide and are supplemented where necessary to address any unique local requirements. These policies are supported by automated screening and monitoring systems and associated investigation teams to help comply with the Sanctions, AML, CTF, FATCA and CRS requirements. Independent Compliance Monitoring is undertaken to provide assurance over the effectiveness of controls. Mandatory Compliance Training is provided to all relevant staff both at onboarding and periodically thereafter to help ensure that key requirements are complied with.
T. Internal Audit’s role in overall risk management
Emirates NBD Group Internal Audit is an independent appraisal function established by the Board of Directors to examine and evaluate the activities of the Emirates NBD Group including all aspects of the Group Risk Management. The department is organisationally independent of all other functions in the bank. The unit is headed by the Group Chief Audit Officer, who is accountable to the Board of Directors through the Board Audit Committee.
The primary objectives of Group Internal Audit is to provide assurance on risks to which the Group’ business are exposed, evaluate the adequacy and effectiveness of financial/operating controls and the Corporate Governance environment, assess the extent to which assets are accounted for and safeguarded from losses and conduct follow-up activities to assess and report on the degree to which management has addressed risks and compliance with action plans previously agreed.
The unit’s mission is achieved through a risk based annual audit plan approved by the Board Audit Committee. A formal report is prepared at the end of each quarter which includes a summary of audit activity completed during the period and an update on the status of previously reported matters for Board Audit Committee attention.
The Board Audit Committee reviews and approves Group Internal Audit’s plans and resources, and evaluates the effectiveness of the Internal Audit function. External advisers also periodically conduct an assessment of the function.