Directions and Rates of Biochemical Processes. Copyright © 2005 Pearson Education, Inc. publishing...
25
Directions and Rates of Biochemical Processes
-
Upload
marjory-baker -
Category
Documents
-
view
213 -
download
0
Transcript of Directions and Rates of Biochemical Processes. Copyright © 2005 Pearson Education, Inc. publishing...

Directions and Rates of Biochemical Processes
Copyright © 2005 Pearson Education, Inc. publishing as Benjamin Cummings
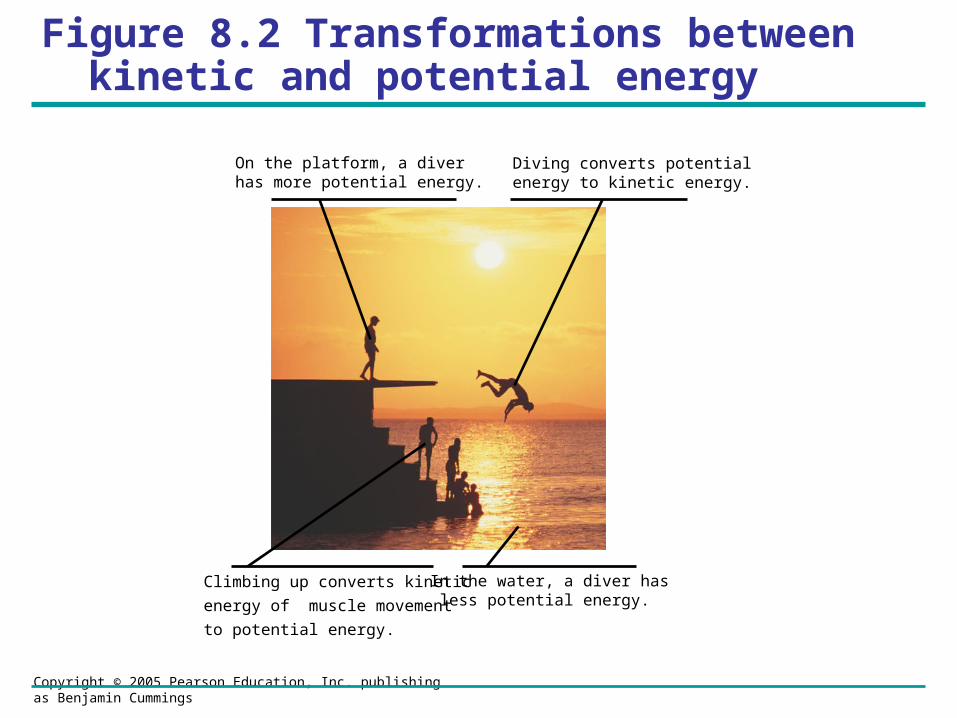
Figure 8.2 Transformations between kinetic and potential energy
On the platform, a diverhas more potential energy.
Diving converts potentialenergy to kinetic energy.
Climbing up converts kinetic
energy of muscle movement
to potential energy.
In the water, a diver has less potential energy.
Copyright © 2005 Pearson Education, Inc. publishing as Benjamin Cummings
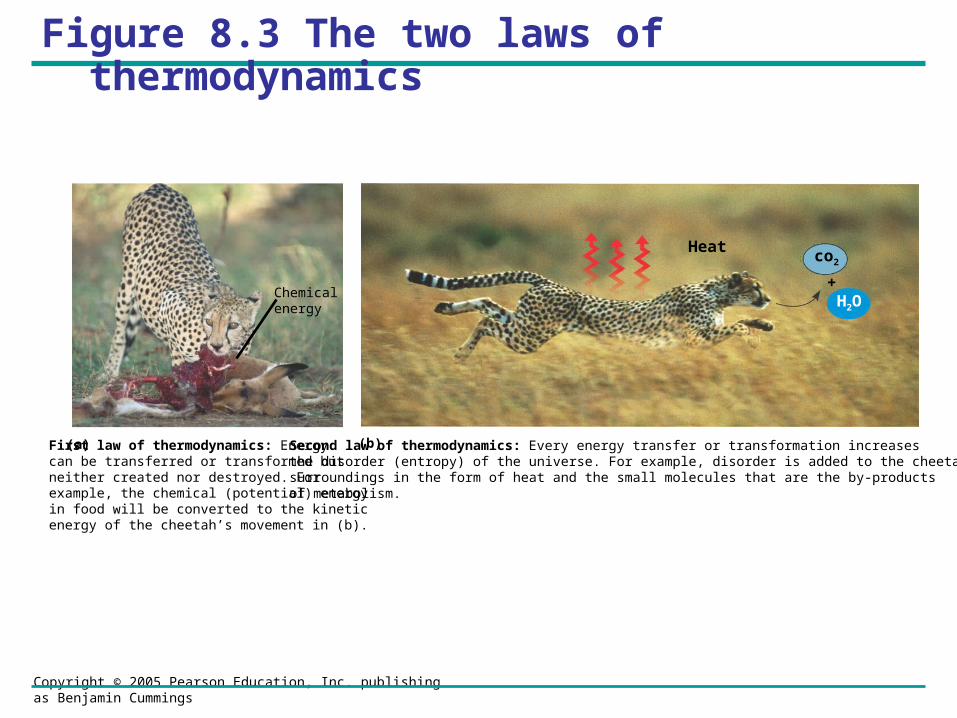
Figure 8.3 The two laws of thermodynamics
(a) First law of thermodynamics: Energy can be transferred or transformed but neither created nor destroyed. For example, the chemical (potential) energy in food will be converted to the kinetic energy of the cheetah’s movement in (b).
Second law of thermodynamics: Every energy transfer or transformation increasesthe disorder (entropy) of the universe. For example, disorder is added to the cheetah’ssurroundings in the form of heat and the small molecules that are the by-productsof metabolism.
(b)
Chemicalenergy
Heatco2
H2O+
Copyright © 2005 Pearson Education, Inc. publishing as Benjamin Cummings
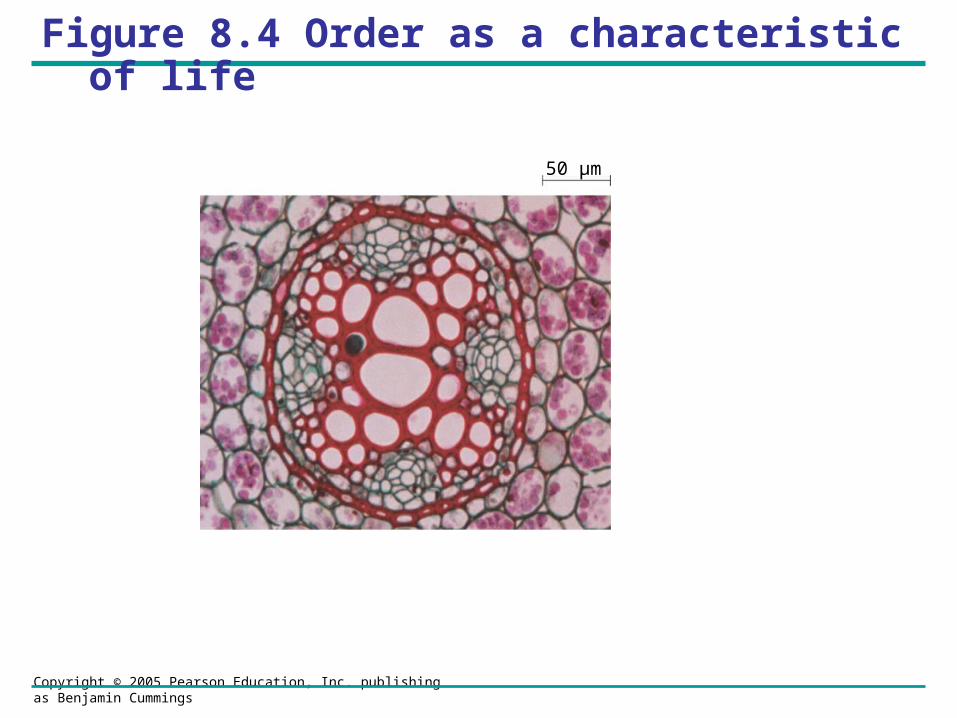
Figure 8.4 Order as a characteristic of life
50 µm
Copyright © 2005 Pearson Education, Inc. publishing as Benjamin Cummings
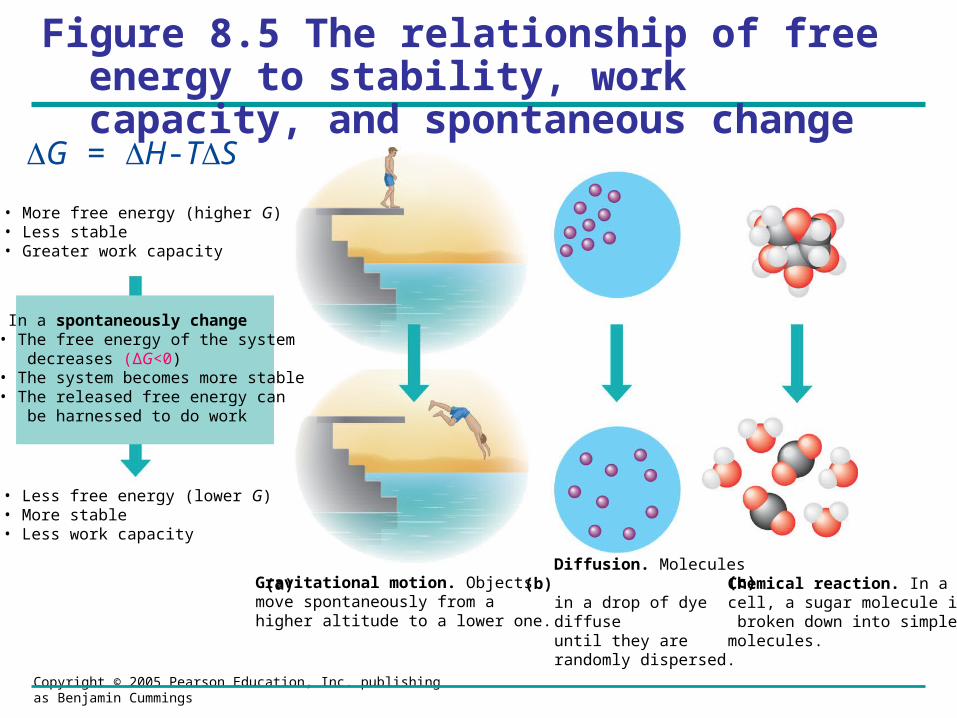
Figure 8.5 The relationship of free energy to stability, work capacity, and spontaneous change
.
Chemical reaction. In a cell, a sugar molecule is broken down into simpler molecules.
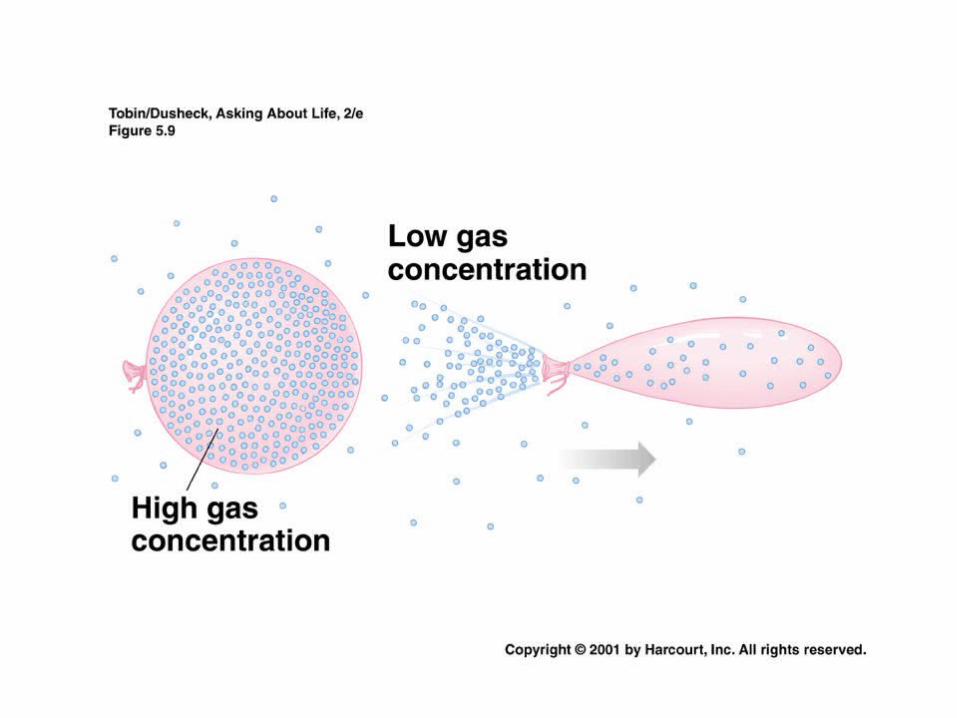
Diffusion. Molecules in a drop of dye diffuse until they are randomly dispersed.
Gravitational motion. Objectsmove spontaneously from ahigher altitude to a lower one.
• More free energy (higher G)• Less stable• Greater work capacity
• Less free energy (lower G)• More stable• Less work capacity
In a spontaneously change • The free energy of the system decreases (∆G<0) • The system becomes more stable• The released free energy can be harnessed to do work
(a) (b) (c)
G = H-TS
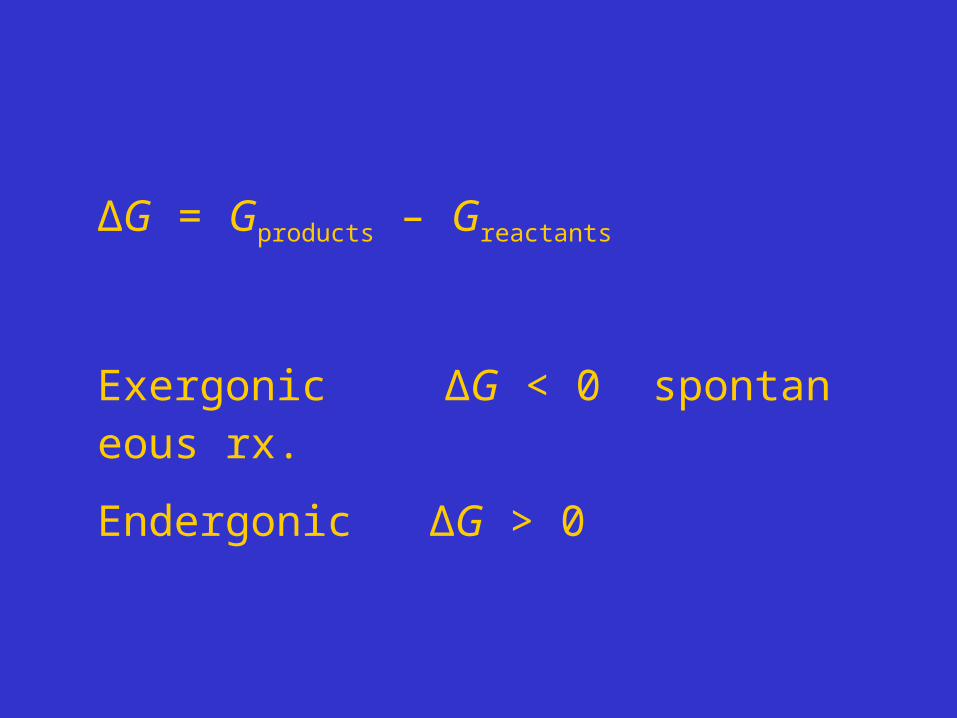
∆G = Gproducts – Greactants
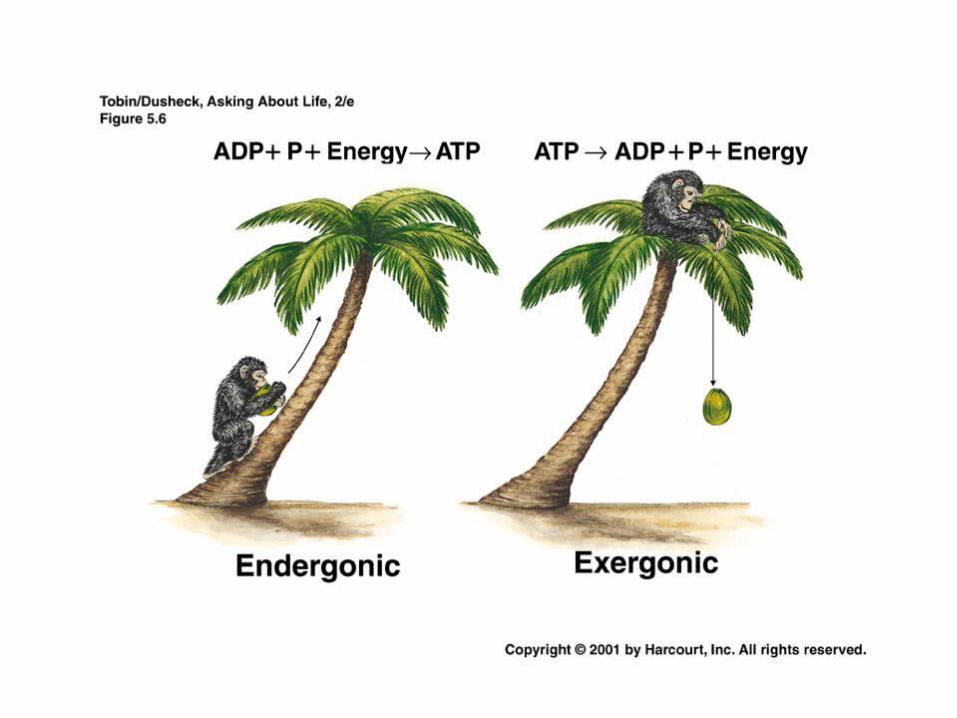
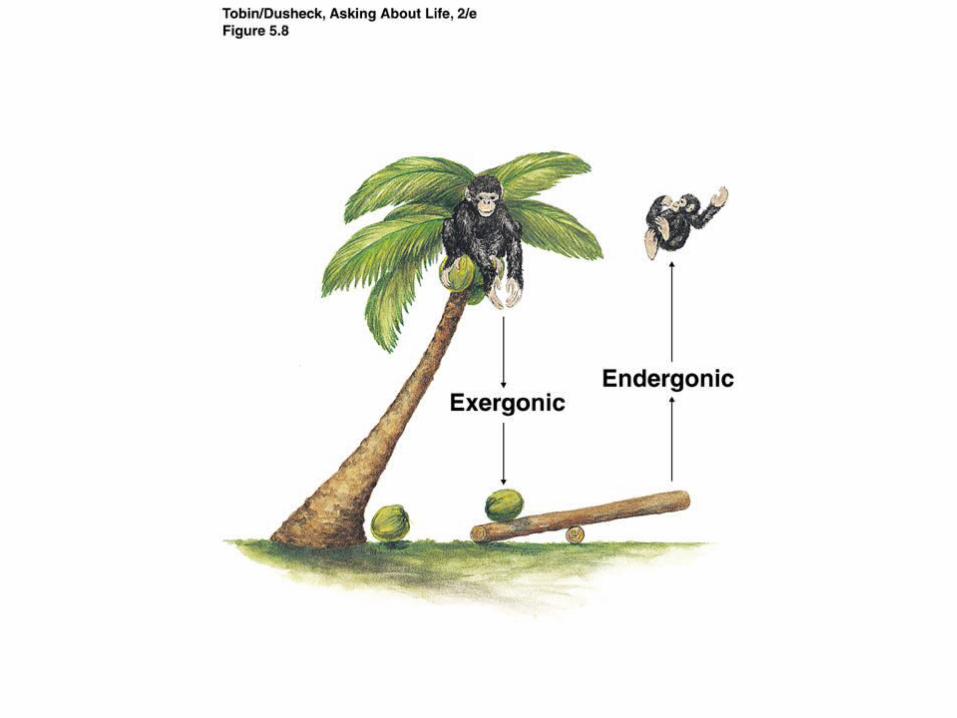
Exergonic ∆G < 0 spontaneous rx.
Endergonic ∆G > 0
Copyright © 2005 Pearson Education, Inc. publishing as Benjamin Cummings
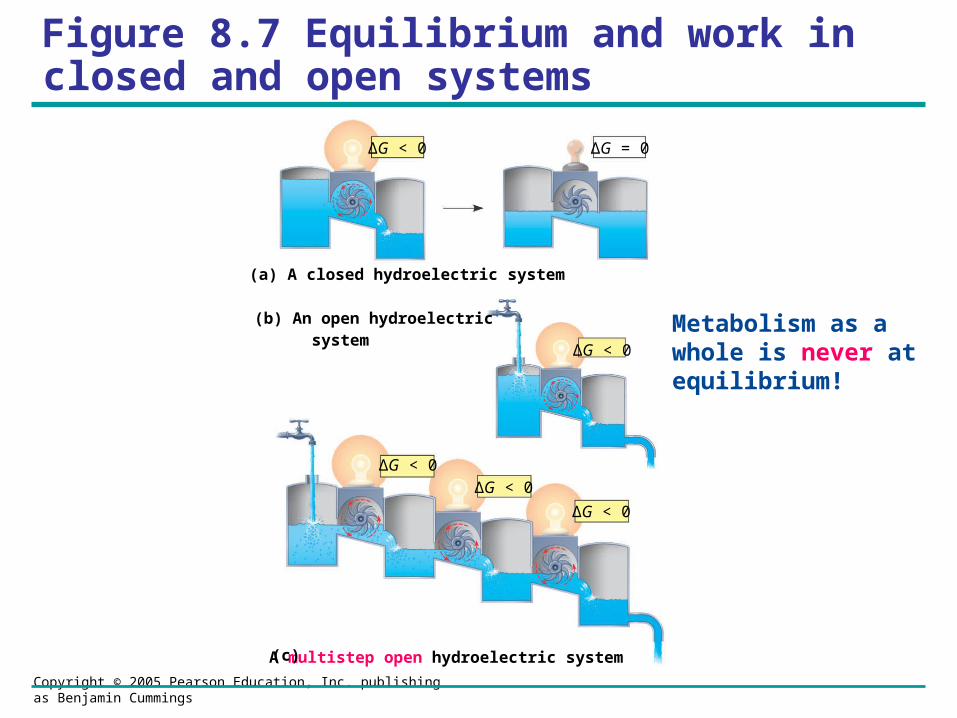
(a) A closed hydroelectric system
∆G < 0 ∆G = 0
(b) An open hydroelectric system
∆G < 0
∆G < 0
∆G < 0
A multistep open hydroelectric system (c)
∆G < 0
Figure 8.7 Equilibrium and work in closed and open systems
Metabolism as a whole is never at equilibrium!
Directions and Rates of Biochemical Processes
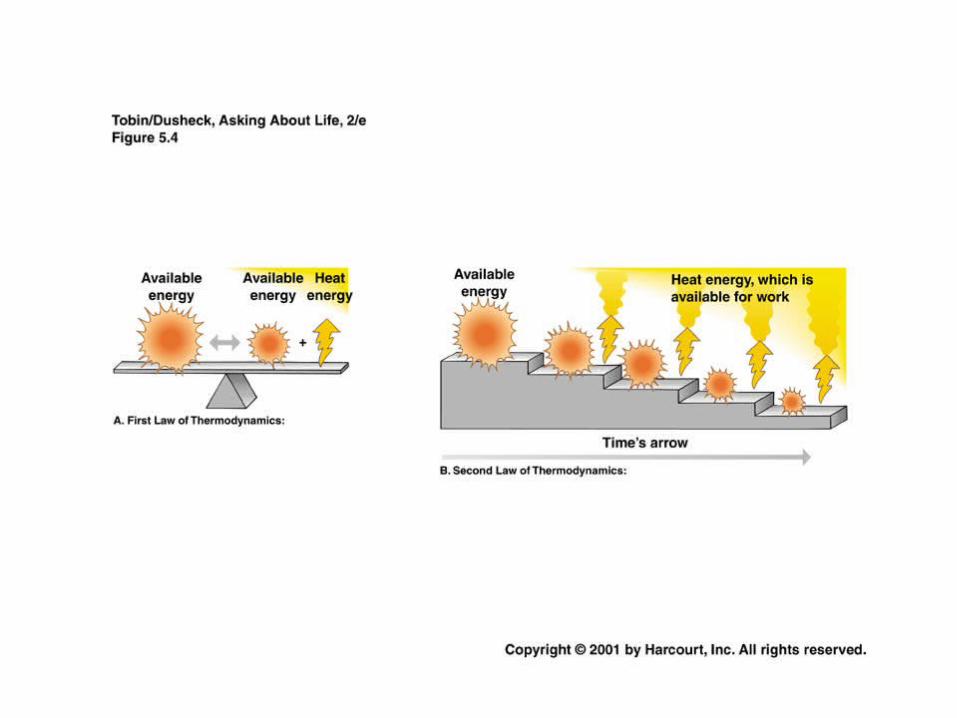
• How Does Thermodynamics Predict the Direction of a Reaction?– The First Law of Thermodynamics
• The total amount of energy in any process stays constant. Energy cannot be created or destroyed, only converted from one form to another.
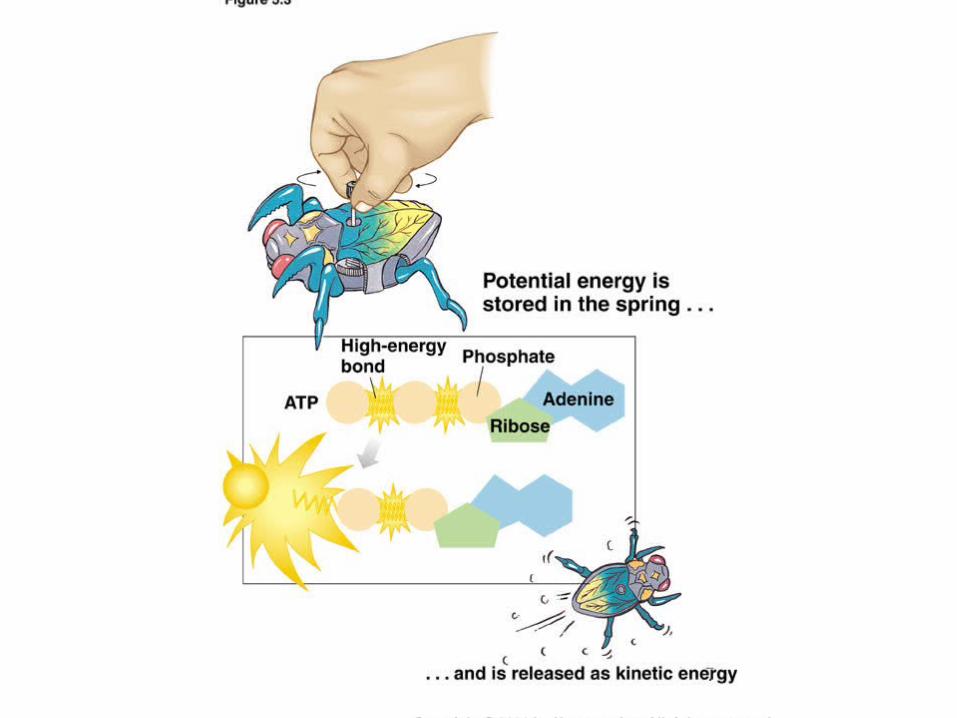
• So, energy may switch from potential to kinetic and back again, but it is neither created nor destroyed.
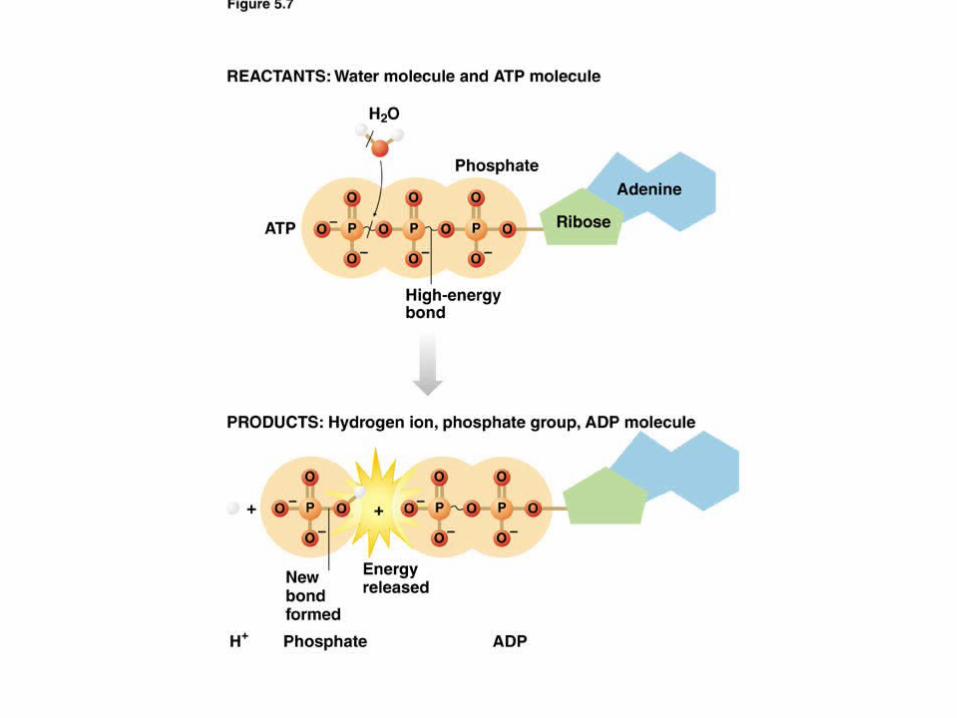
» For example, the potential energy stored in the chemical bonds of ATP is converted into kinetic energy when it is split to allow a muscle contraction to occur.
Directions and Rates of Biochemical Processes
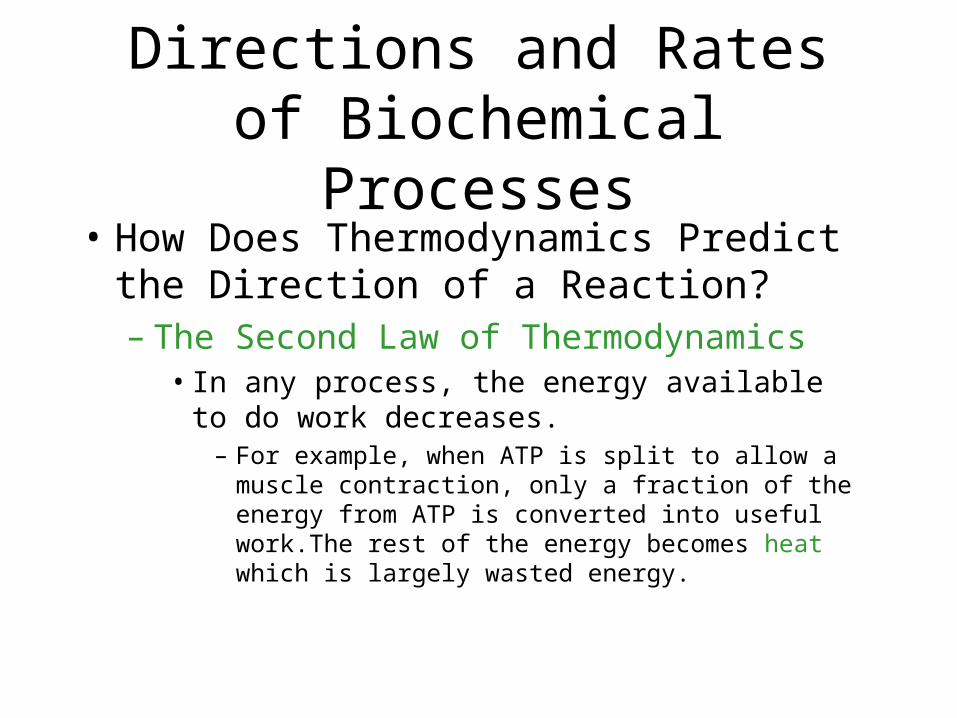
• How Does Thermodynamics Predict the Direction of a Reaction?– The Second Law of Thermodynamics
• In any process, the energy available to do work decreases.
– For example, when ATP is split to allow a muscle contraction, only a fraction of the energy from ATP is converted into useful work.The rest of the energy becomes heat which is largely wasted energy.
Copyright 2001 by Harcourt, Inc.
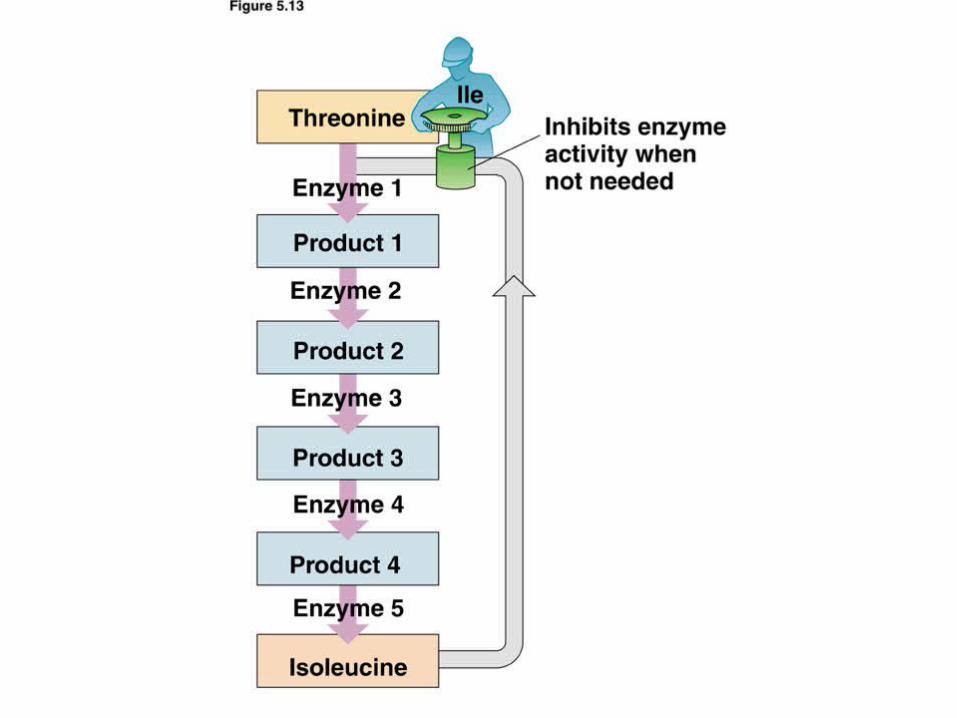
Directions and Rates of Directions and Rates of Biochemical ProcessesBiochemical Processes
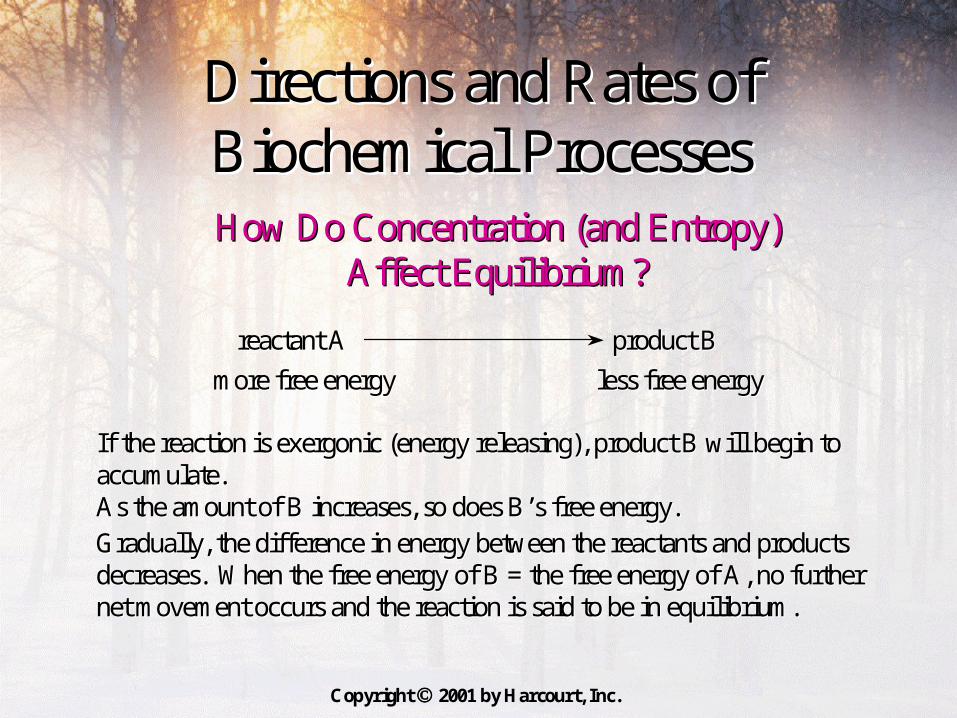
How Do Concentration (and Entropy) How Do Concentration (and Entropy) Affect Equilibrium?Affect Equilibrium?
reactant Areactant A product Bproduct B
more free energymore free energy less free energyless free energy
If the reaction isIf the reaction is exergonicexergonic (energy releasing), product B will begin to (energy releasing), product B will begin to accumulate.accumulate.As the amount of B increases, so does BAs the amount of B increases, so does B’’s free energy.s free energy.
Gradually, the difference in energy between the reactants and prGradually, the difference in energy between the reactants and products oducts decreases. When the free energy of B = the free energy of A, nodecreases. When the free energy of B = the free energy of A, no further further net movement occurs and the reaction is said to be in equilibriunet movement occurs and the reaction is said to be in equilibrium.m.


Copyright © 2005 Pearson Education, Inc. publishing as Benjamin Cummings
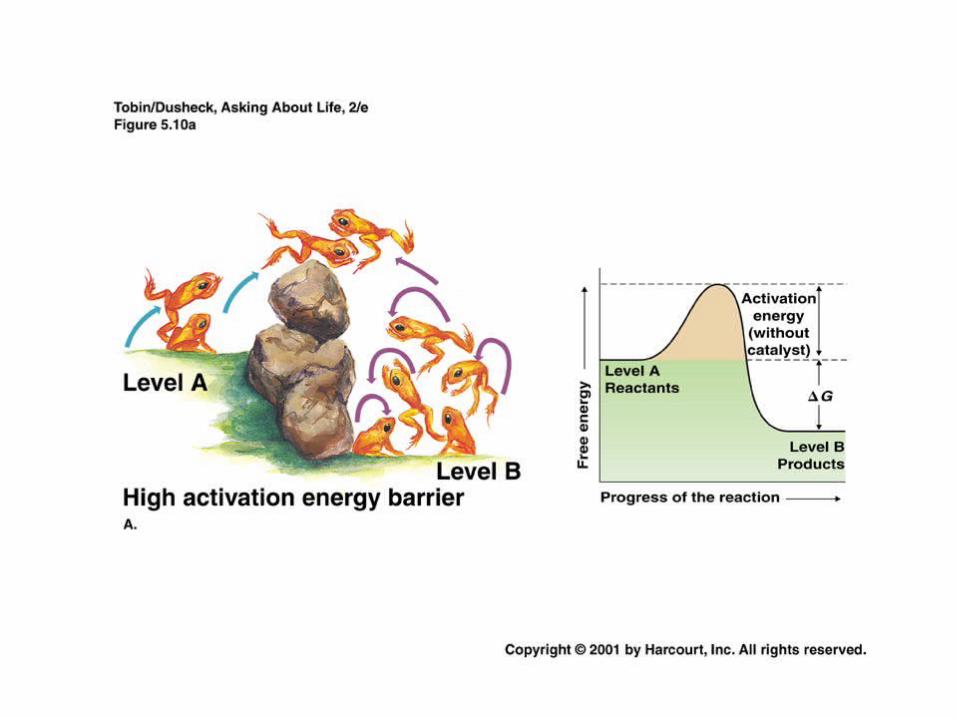
Figure 8.14 Energy profile of an exergonic reaction
A
C D
A
A
B
B
B
C
C
D
D
Transition state
Products
Progress of the reaction
∆G < O
Reactants
Fre
e en
ergy
EA
The reactants AB and CD must absorbenough energy from the surroundingsto reach the unstable transition state,where bonds can break.
Bonds break and newbonds form, releasingenergy to thesurroundings.
Copyright © 2005 Pearson Education, Inc. publishing as Benjamin Cummings
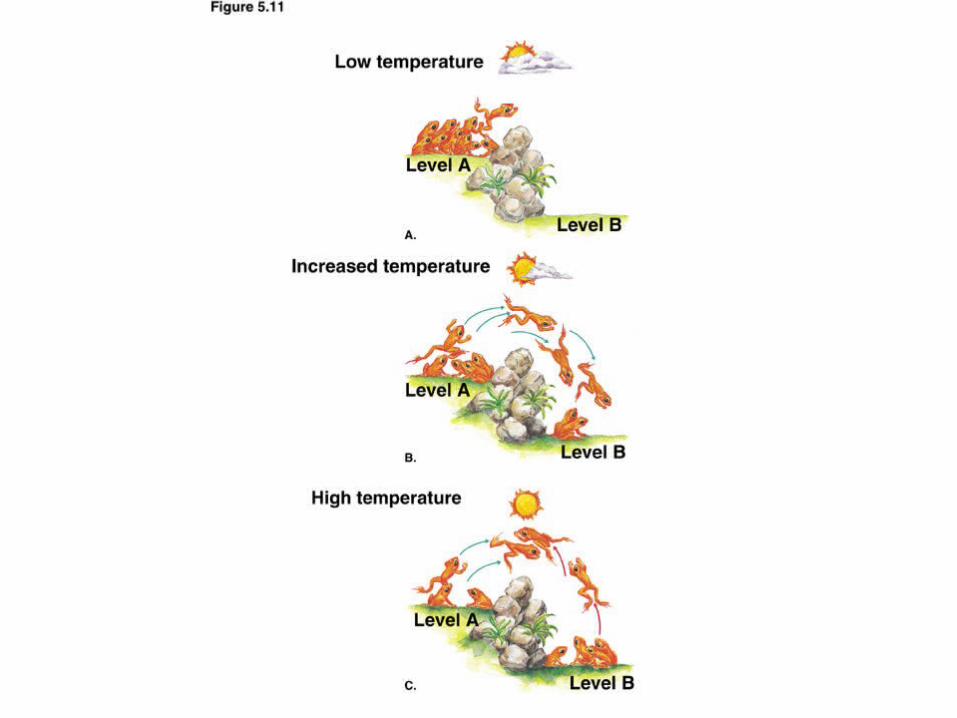
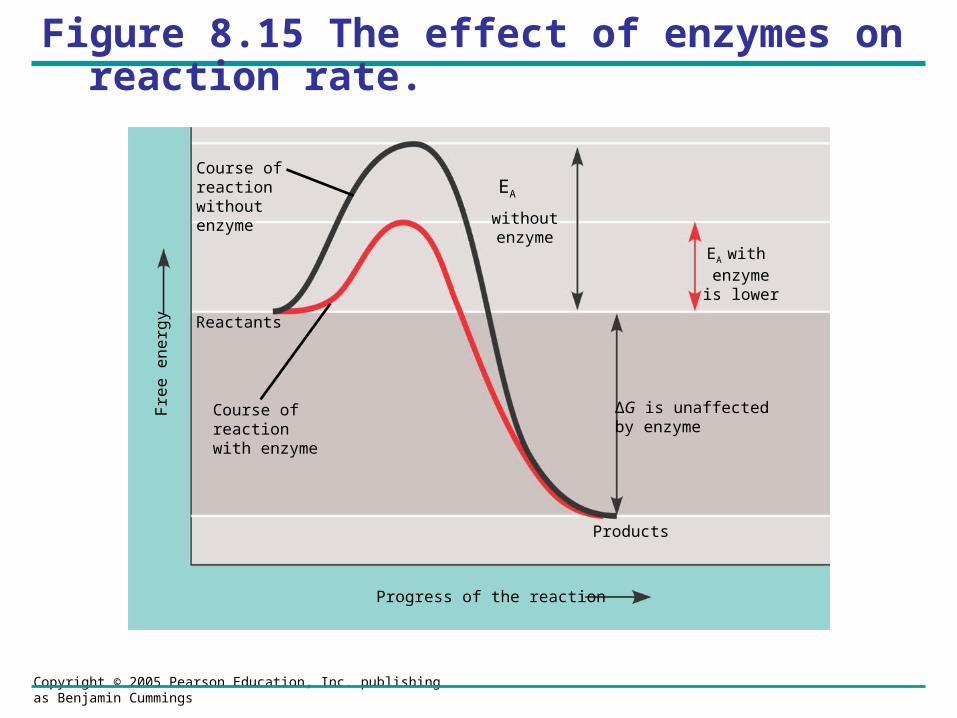
Figure 8.15 The effect of enzymes on reaction rate.
Progress of the reaction
Products
Course of reaction without enzyme
Reactants
Course of reaction with enzyme
EA
withoutenzyme
EA with enzymeis lower
∆G is unaffected by enzyme
Fre
e e
ne
rgy
Copyright © 2005 Pearson Education, Inc. publishing as Benjamin Cummings
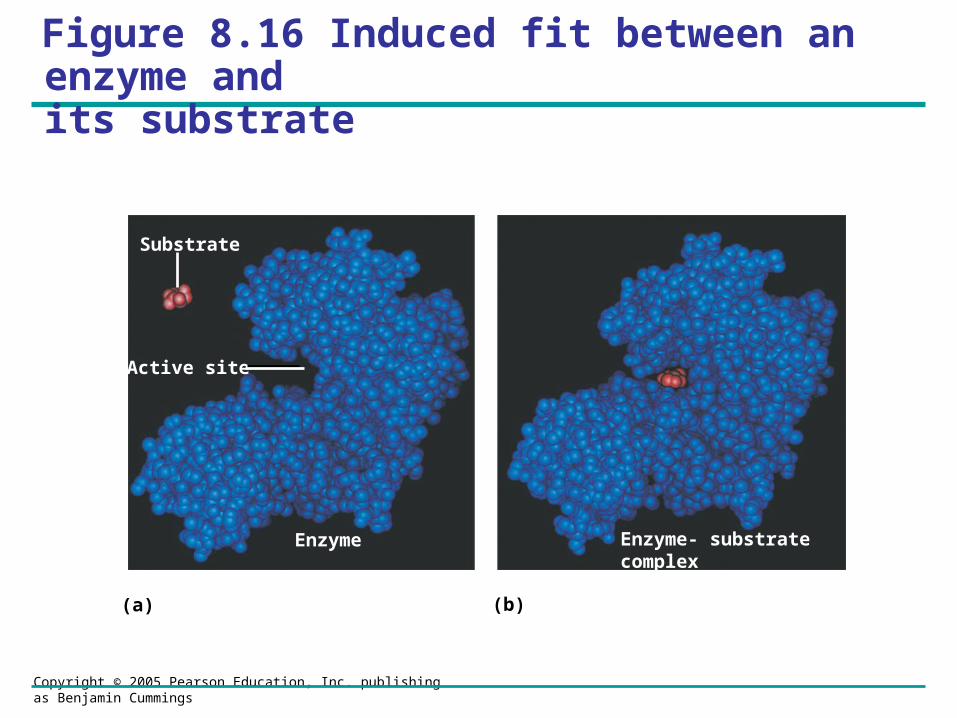
Substrate
Active site
Enzyme
(a) (b)
Enzyme- substratecomplex
Figure 8.16 Induced fit between an enzyme and its substrate
Copyright © 2005 Pearson Education, Inc. publishing as Benjamin Cummings
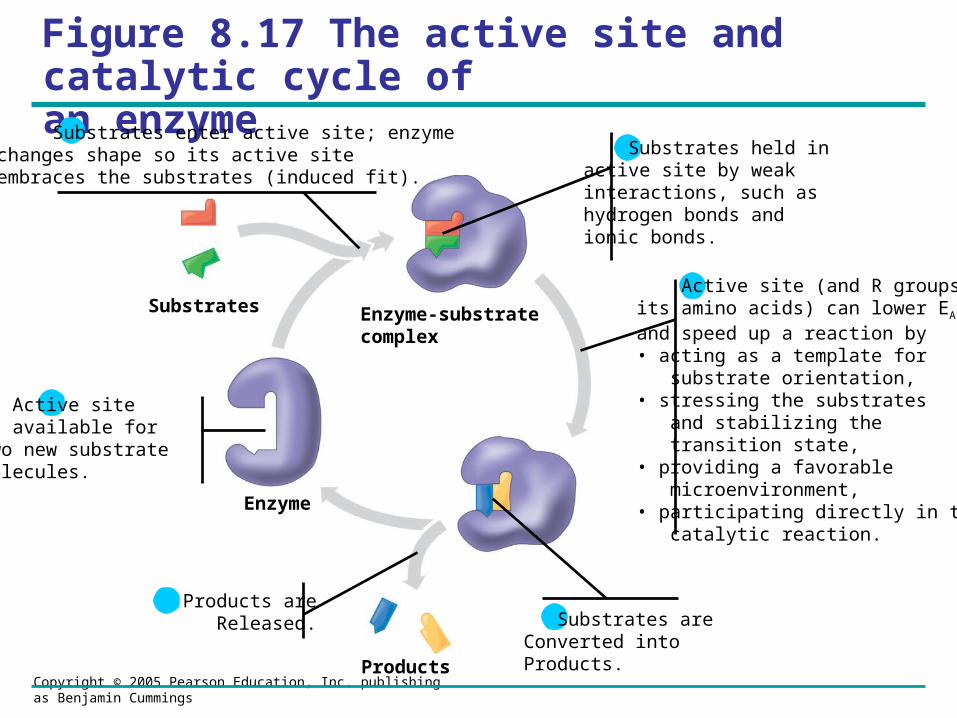
Figure 8.17 The active site and catalytic cycle of an enzyme
1 Substrates enter active site; enzymechanges shape so its active siteembraces the substrates (induced fit).
Substrates
Products
Enzyme
Enzyme-substratecomplex
5 Products areReleased.
2 Substrates held inactive site by weakinteractions, such ashydrogen bonds andionic bonds.
3 Active site (and R groups ofits amino acids) can lower EA
and speed up a reaction by• acting as a template for substrate orientation,• stressing the substrates and stabilizing the transition state,• providing a favorable microenvironment,• participating directly in the catalytic reaction.
4 Substrates are Converted intoProducts.
6 Active siteis available fortwo new substratemolecules.