Directionality of ground motions in the NGA-West2...
45
Directionality of ground motions in the NGA-West2 database Shrey K. Shahi & Jack W. Baker Stanford University Directionality Working Group: Brian Chiou, Nicolas Luco, Mahmoud Hachem, Tom Shantz, Paul Somerville, Paul Spudich, Jon Stewart, Badie Rowshandel
-
Upload
hoangkhanh -
Category
Documents
-
view
224 -
download
0
Transcript of Directionality of ground motions in the NGA-West2...

Directionality of ground motions in the NGA-West2 database
Shrey K. Shahi & Jack W. Baker Stanford University
Directionality Working Group: Brian Chiou, Nicolas Luco, Mahmoud Hachem, Tom Shantz, Paul Somerville, Paul Spudich, Jon Stewart, Badie Rowshandel

2
Motivation
• “Maximum-direction” spectral accelerations have received increasing attention in the engineering community in recent years (e.g., 2009 NEHRP Provisions)
• NGA-West2 models will provide predictions of “SaRotD50” spectra
• We provide a modification to convert those predictions to maximum-direction spectra
• We also report on orientations of the maximum direction motions, and suggest how to use these models for engineering analysis

3 Example 1-second oscillator responses to multi-component motions
HWA031 recording from Chi-Chi-04, 1999 earthquake
Gilroy Array #6 recording from Morgan Hill,1984 earthquake
Sa(1s) / SaRotD100(1s) Displacement / Maximum displacement SaRotD100 orientation
SaRotD0 orientation
SaRotD50 orientation

4
Model formulation for SaRotD100 at a specified period
100100 50
50
100 100 50 50
ln ln( / ) ln( )
RotDRotD RotD
RotD
RotD RotD RotD RotD
SaSa SaSa
Sa Sa Sa Sa
=
= +
This study Primary GMPE
5 300 ( , , ,..l .)n( )RotD Sf M R VSa η ε= + +100 50ln( / ) ' 'RotD RotD aSa Sa η ε= + +
Complex prediction Simple prediction (constant?)
Independent of primary GMPE

5
Results to discuss today
• SaRotD100 /SaRotD50 ratios • Orientation of SaRotD100 relative
to strike
• Difference in orientation of SaRotD100(T1) and SaRotD100(T2)
• Change in Sa(T) at angles away from the SaRotD100 orientation
• Amplitude of Sa(T) in a specified direction
T’ = 3 s
T* = 1.5 s
Oscillator responses to 1979 Imperial Valley-06, El Centro Differential Array recording

6
Data set
• NGA-West2 database
• We used subsets of the data chosen by the modelers (as of 11/1/2011), to ensure use of appropriate data and to be compatible with NGA West 2 models for SaRotD50
• Sa values computed for – 5% damping only – 21 periods – All orientations in 1º
increments

7
Histograms of SaRotD100/SaRotD50
T = 0.2 s T = 1.0 s
Num
ber
of g
roun
d m
otio
ns

8
Median SaRotD100/SaGMRotI50 ratios, versus previous models
There is a clear period dependence in these ratios

9
These ratios differ from the NEHRP Provisions ratios

10
Variation in SaRotD100/SaGMRotI50 with closest distance (Rrup)?
T = 0.2 s T = 1 s
Other variables (M, directivity parameters) had less strong effects
Rrup (km) Rrup (km)
Rrup

11
Model with Rrup dependence
100 50 0 1ln( / ) ' '·( 60)Rot rupD RotD a a RSa Sa η ε= + ++ −

12
Standard deviations (example numbers for Sa(1s))
100 100 50 50ln ln( / ) ln( )RotD RotD RotD RotDSa Sa Sa Sa= +
This study Primary GMPE
50 30ln( ) ( , , ,...)RotD SSa f M R V η ε= + +100 50ln( / ) ' 'RotD RotDSa Sa a η ε= + +
This study: Campbell Bozorgnia
(2008) NGA:
σ = 0.623 σ’ = 0.629

13
Orientation of SaRotD100 (using α as angle to strike parallel)
Site
Fault rupture
α Strike parallel orientation
• Dependence of α on various parameters was studied
• A parametric model to predict the distribution of α is proposed
Oscillator responses to 1979 Imperial Valley-06, El Centro Differential Array recording
T’ = 3 s
T* = 1.5 s

14
Dependence of α on M and Rrup
Rrup bins

15
Distribution of α for varying T, with Rrup between 0 and 5 km
Apparent division at 0.5 or 1 second

16
Observations regarding distributions of α
Some dependence on distance and period (consistent with previous work)
– The distribution tends towards fault normal for R < 5 km and T ≥ 0.5 s (This is not the same as saying α is always fault normal)
– The distribution is apparently uniform otherwise
No obvious dependence on magnitude, directivity parameters, etc.

17
Other models for directionality
α
The direction of SaRotD100(T) will vary with period
1. By how much will the azimuths of SaRotD100(T*) and SaRotD100(T’) vary?
2. If we identify a target SaRotD100 at one period (T*), what will the spectral value be at some other period (T’)?
T’ = 3 s
T* = 1.5 s
Oscillator responses to 1979 Imperial Valley-06, El Centro Differential Array recording

18
Distribution of α*-α’ for various T* and T’
T* = 1 s, T’ = 2 s T* = 0.1 s, T’ = 0.2 s
T* = 1 s, T’ = 5 s T* = 0.1 s, T’ = 0.5 s

19 Median ratio of Saφ/SaRotD50, as a function of distance from SaRotD100 orientation
Geo
met
ric
mea
n Saφ/S
a Rot
D50
Example 1s response case:
φ = Angle relative to SaRotD100 (degrees)

20
Individual ground motion example
TCU076 station, 1999 Chi-Chi earthquake Rrup = 3 km, M = 7.6

21
Example predictions using above results
M = 7, Rclst = 2.5 km, VS30 = 760 m/s

22
Conclusions
• Observed ratios of SaRotD100/ SaRotD50 are consistent with previous studies – Dependent on period and (weakly) on distance – No clear dependence on other properties (magnitude, directivity-related parameters)
• Orientations of SaRotD100 appear to be uniform beyond 5 km closest distance – Within 5 km and for T ≥ 0.5s, there is a tendency towards fault-normal orientation
• Orientations of SaRotD100 vary with period, for a given ground motion, which complicates target spectrum calculation and ground motion selection
• We aim to address that problem by providing models for: – Difference in orientation of SaRotD100 at two periods – Deviation from SaRotD100 as a function of the above orientation difference

23
Thanks to the project technical review team:
• Brian Chiou • Nicolas Luco • Mahmoud Hachem • Tom Shantz • Paul Somerville • Paul Spudich • Jon Stewart • Badie Rowshandel

24

25
Fault normal spectra versus SaRotD50

26
Is SaRotD100 = SaFN for directivity ground motions?
• Each ground motion in the NGA West 2 database classified as pulse or non-pulse
– Improved pulse-classification algorithm (Shahi and Baker) – Documentation in progress
• Source-site geometry used to manually identify Pulse-like ground motions caused by directivity
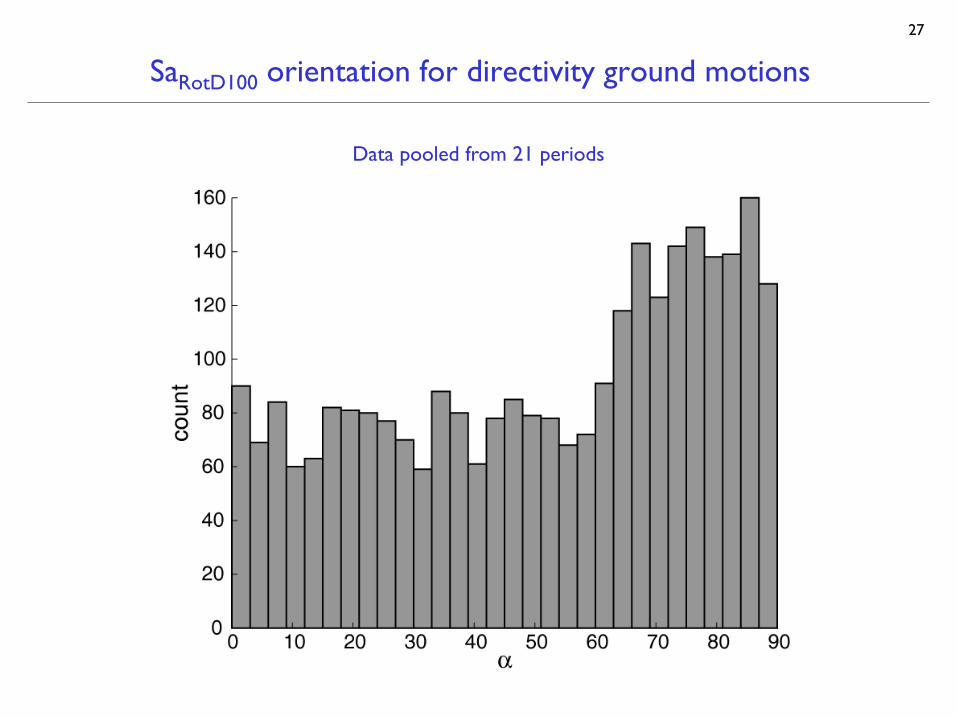
27
SaRotD100 orientation for directivity ground motions
Data pooled from 21 periods

28
SaRotD100 orientation for directivity ground motions
Data for period closest to Tp

29
Effect of Chi-Chi

30
Effect of changing the dataset

31
Any variation in this ratio with distance (M)?
T = 7.5 s T = 3 s
T = 0.1 s T = 1 s

32
Any variation in this ratio with s? (Strike slip only)
T = 7.5 s T = 3 s
T = 0.1 s T = 1 s

33
Any variation in this ratio with θ? (Strike slip only) T = 0.1 s T = 1 s
T = 3 s T = 7.5 s

34
Any variation in this ratio with D? (Non-strike-slip only)
T = 7.5 s T = 3 s
T = 0.1 s T = 1 s

35
Regression analysis to evaluate significance of above parameters
• Both forward and backward step-wise regression was used to select statistically significant parameters
• Some dependence on M and R (depends upon period)
• Some dependence on directivity parameters at higher periods • Our recommendation : a simple model dependent on R only

36
Distribution of α for different M-R bins
T = 1 s
Distance range (km) M
agnitude range

37
Distribution of α for different M-R bins
Data pooled from all periods
Distance range (km) M
agnitude range

38
Distribution of α for different R bins
Data pooled from all periods
Distance range (km)

39
Models for α? Two options:
1. Parametric model for distribution of α (i.e., equation for a probability distribution) – Linearly-varying distribution of α for R < 5 km (function of T) – Uniform distribution for R > 5 km
2. Just report histogram values at different T for R < 5 km – Simpler, but hard to do calculations with
R < 5 km, T = 0.1s R < 5 km, T = 7.5s

40
Direction of RotD100 with θ
T = 3 s
T = 0.1 s T = 1 s
T = 7.5 s

41
Zooming in towards high θ
T = 3 s
T = 0.1 s T = 1 s
T = 7.5 s

42
Only records with high amplification
T = 3 s
T = 0.1 s T = 1 s
T = 7.5 s

43
• When θ is high some Sa,RotD100 values are found in fault parallel orientation. This may be due to the radiation patterns
• Due to low sample size and presence of randomness we cant make confident conclusions.

44
Distribution of α*-α’ for different T*,T’ T* = 1 s, T’ = 2 s T* = 0.1 s, T’ = 0.2 s
T* = 1 s, T’ = 5 s T* = 0.1 s, T’ = 0.5 s

45 Median ratio of Sa(Φ)/SaRotD50, as a function of distance from SaRotD100 orientation