Directional Data analysis Multivariate Statistics Chapter 15 Mardia, Kent and Bibby Presented by...
26
Directional Data analysis Multivariate Statistics Chapter 15 Mardia, Kent and Bibby Presented by Steven Brown
-
Upload
jasmine-nicholson -
Category
Documents
-
view
224 -
download
0
Transcript of Directional Data analysis Multivariate Statistics Chapter 15 Mardia, Kent and Bibby Presented by...

Directional Data analysisMultivariate Statistics
Chapter 15Mardia, Kent and Bibby
Presented by Steven Brown
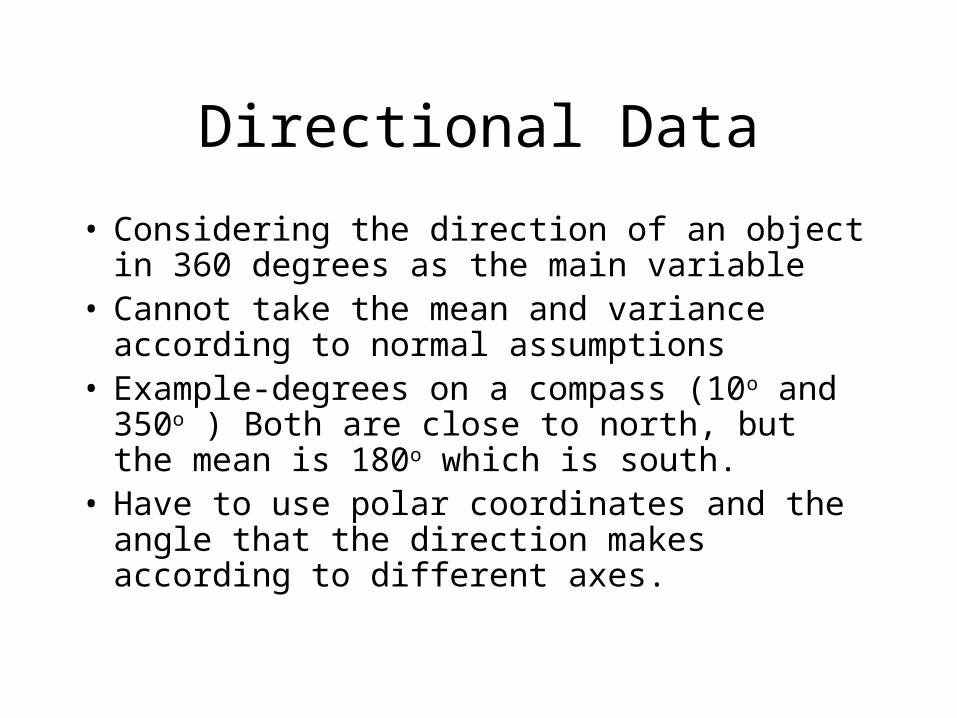
Directional Data
• Considering the direction of an object in 360 degrees as the main variable
• Cannot take the mean and variance according to normal assumptions
• Example-degrees on a compass (10o and 350o ) Both are close to north, but the mean is 180o which is south.
• Have to use polar coordinates and the angle that the direction makes according to different axes.

x2
x1
(cos , sin )
Circular direction data

x1
x3
Spherical direction data
x2
0
N
P
φ

Descriptive measures
• I=()()=cos(i) i-1 sin(i)
• Mean direction Io=Ī / Ř
• Ī = ¹/n Σn Ii
• Distance from the center = Ř=(Ī´ Ī)½
i=0
i=1
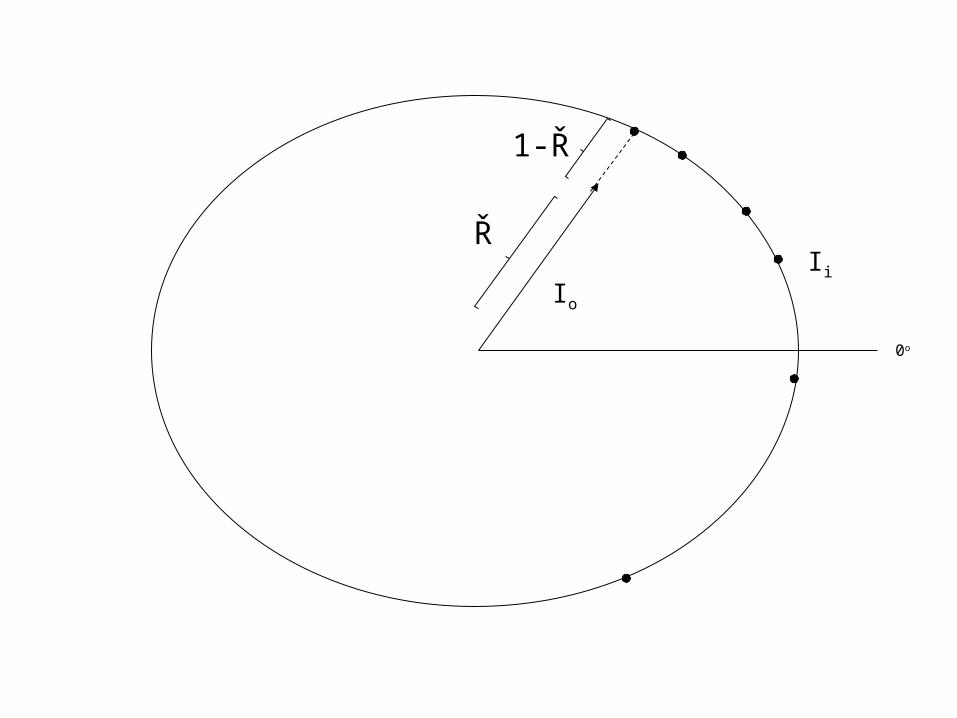
0o
1-Ř
Io
Ii
Ř

Uniform Distribution
• E(I)=0 not defined
• Second moment equal to 1/p
• P.d.f.=Cp=(½p)/(2p/2)

Von Mises Distribution
• Named after Richard Von Mises • His brother was a famous economist
Ludwig Von Mises• He developed the axiom of randomness and
convergence for the field of probability• He introduced the birthday problem in 1939 • The distribution is a Circular normal
distribution

Von Mises Distribution
• Von mises and Fisher Distribution
p.e.=Cp(k)e kldSp
• P=2 in Von Mises distribution
• k=concentration parameter
• k=0 then uniform distribution
• Mean =
• Variance = 1 − I1(κ)2 / I0(κ)
2 (circular)
• There is a Fisher distribution that has similar distribution with p=3
• There is modified Bessel function with a similar distribution
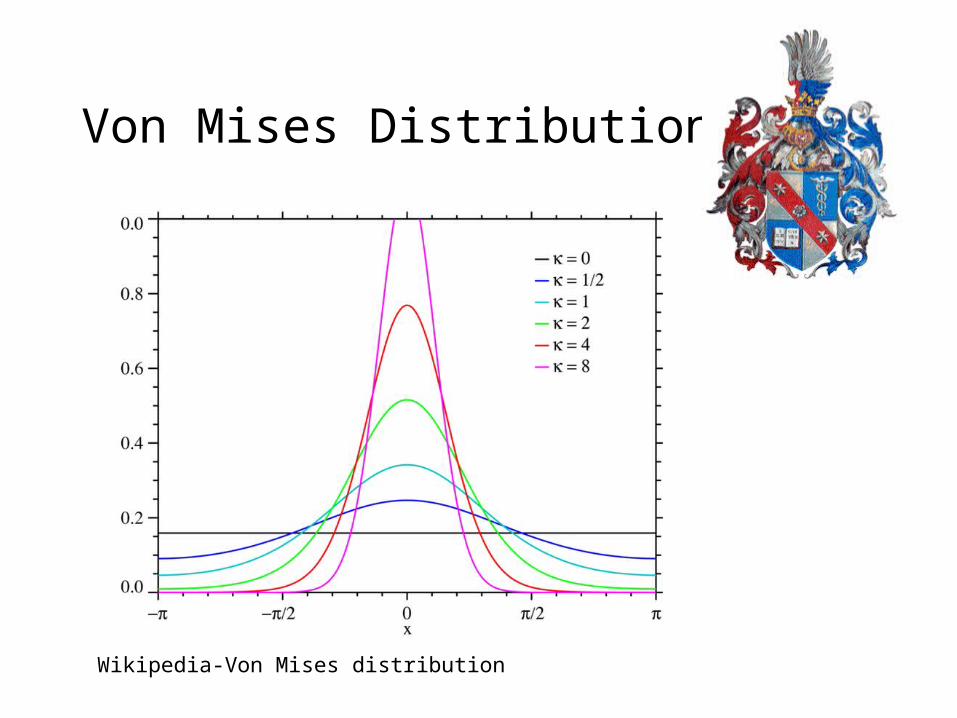
Von Mises Distribution
Wikipedia-Von Mises distribution

Rayleigh Test of uniformity
• Ho: k=0 vs Ha k0
• Use Likelihood ratio test
log=-n(log(Cp(k)/Cp) + kA(k)
• Critical region Ř > K
• pn Ř 2~2 for large n
• Compare to a 2 distributionp
p

Orbits of nine planets(Watson 1970)
Planet i Ώ
Mercury 7o 0' 47o 08'
Venus 3o 23' 75o 47'
Earth 0o 0' 0o 0'
Mars 1o 51' 48o 47'
Jupiter 1o 19' 48o 47'
Saturn 2o 30' 112o 47'
Uranus 0o 46' 73o 29'
Neptune 1o 47' 130o 41'
Pluto 7o 0' 109o 0'
Results
• Direction (sin Ώ sin i - cos Ώ sin i, cos i)
• Ř =0.79
• Reject null hypothesis for the Rayleigh test

Watson and William Test for mean direction
• Ho: = o vs Ha o
• Use Likelihood ratio test
• F p-1,(n-1)(p-1) = (n-1)(R-r1o )/(n-R)
• Compared to a F distribution

Pluto’s origin• The ninth planet• An asteroid- largest of Kuiper Belt objects• Comet
• A dwarf planet-Pluto and any other round object that "has not cleared the neighborhood around its orbit, and is not a satellite.“
• A solar system body-All other objects orbiting the Sun.
Pluto Demoted: No Longer a Planet in Highly Controversial Definition By Robert Roy Britt Senior Science Writer posted: 24 August 2006
• Aug 16, 2006 Pluto demoted to dwarf planet

http://csep10.phys.utk.edu/astr161/lect/solarsys/nebular.html
Solar Nebula theory

http://csep10.phys.utk.edu/astr161/lect/solarsys/nebular.html
Solar Nebula theory
The collapsing, spinning nebula begins to flatten into a rotating pancake

http://csep10.phys.utk.edu/astr161/lect/solarsys/nebular.html
Solar Nebula theory
As the nebula collapses further, local regions begin to contract gravitationally on their own because of instabilities in the collapsing, rotating cloud

The normals to the orbital of nine planets(Patrangenaru &Mardia 2002)
Planet nx ny nz
Mercury 0.001151 0.121864 0.99255
Venus 0.022170 -0.054694 0.99826
Earth 0.000000 0.000000 0.00000
Mars 0.032156 -0.002858 0.99948
Jupiter 0.020454 -0.010471 0.99974
Saturn 0.013473 -0.041487 0.99905
Uranus 0.012596 0.004514 0.99991
Neptune 0.029663 -0.009412 0.99952
Pluto 0.241063 0.170303 0.95545

Parametric Results
• Direction (sin Ώ sin i - cos Ώ sin i, cos i)
• Test the mean direction with Watson William
• Ř =0.9987-highly significant according to Rayleigh
• Reject null hypothesis using the Watson William F-test

Non-Parametric Results
• Extrinsic mean = Ř / || Ř||• Assume that the asymptotic distribution is normal• Bootstrap approximation for the distribution
T(Q)=T(X1,…, Xn, Q) with the data
• Substitute the bootstrap samples of (X1*,…, Xn
*) for (X1,…, Xn)
• This is a better approximation than standard normal distribution


DDSTAP
• Software developed to analyze directional data
• Developed by Ashis Sengupta