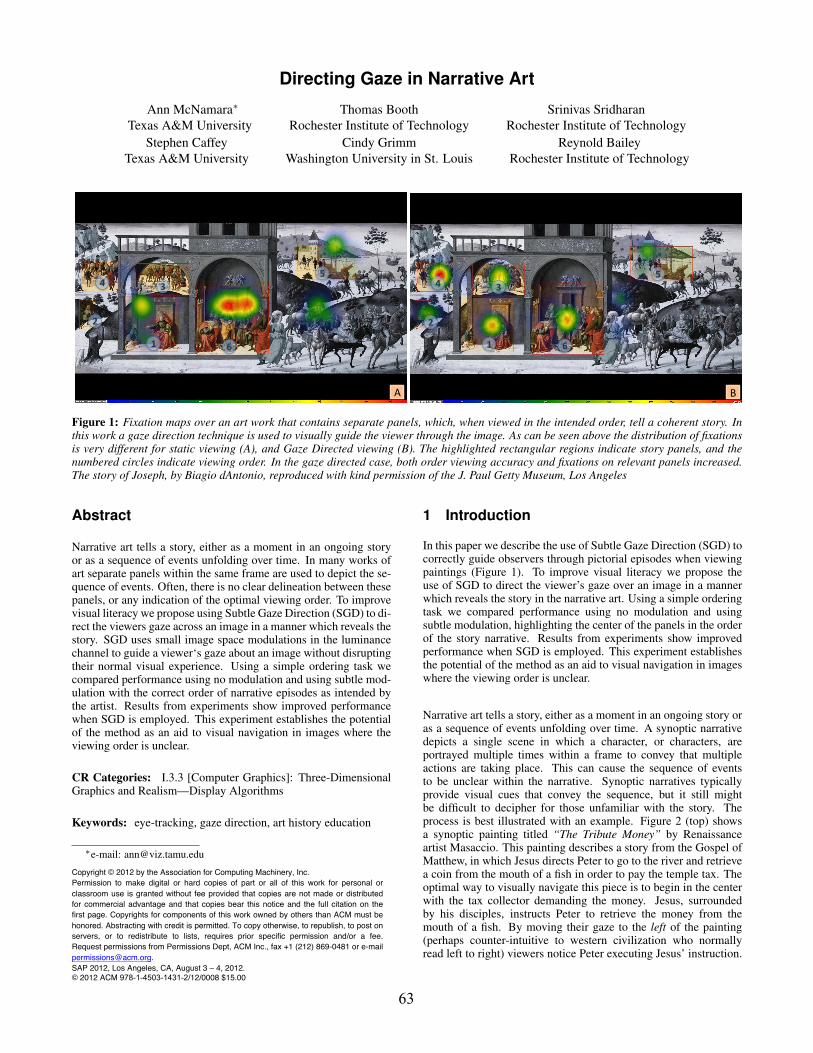
Directing Gaze in Narrative Art - Oregon State...
8
Copyright © 2012 by the Association for Computing Machinery, Inc. Permission to make digital or hard copies of part or all of this work for personal or classroom use is granted without fee provided that copies are not made or distributed for commercial advantage and that copies bear this notice and the full citation on the first page. Copyrights for components of this work owned by others than ACM must be honored. Abstracting with credit is permitted. To copy otherwise, to republish, to post on servers, or to redistribute to lists, requires prior specific permission and/or a fee. Request permissions from Permissions Dept, ACM Inc., fax +1 (212) 869-0481 or e-mail [email protected]. SAP 2012, Los Angeles, CA, August 3 – 4, 2012. © 2012 ACM 978-1-4503-1431-2/12/0008 $15.00 Directing Gaze in Narrative Art Ann McNamara * Texas A&M University Thomas Booth Rochester Institute of Technology Srinivas Sridharan Rochester Institute of Technology Stephen Caffey Texas A&M University Cindy Grimm Washington University in St. Louis Reynold Bailey Rochester Institute of Technology B A 1 2 3 4 5 6 1 2 3 4 5 6 Figure 1: Fixation maps over an art work that contains separate panels, which, when viewed in the intended order, tell a coherent story. In this work a gaze direction technique is used to visually guide the viewer through the image. As can be seen above the distribution of fixations is very different for static viewing (A), and Gaze Directed viewing (B). The highlighted rectangular regions indicate story panels, and the numbered circles indicate viewing order. In the gaze directed case, both order viewing accuracy and fixations on relevant panels increased. The story of Joseph, by Biagio dAntonio, reproduced with kind permission of the J. Paul Getty Museum, Los Angeles Abstract Narrative art tells a story, either as a moment in an ongoing story or as a sequence of events unfolding over time. In many works of art separate panels within the same frame are used to depict the se- quence of events. Often, there is no clear delineation between these panels, or any indication of the optimal viewing order. To improve visual literacy we propose using Subtle Gaze Direction (SGD) to di- rect the viewers gaze across an image in a manner which reveals the story. SGD uses small image space modulations in the luminance channel to guide a viewer‘s gaze about an image without disrupting their normal visual experience. Using a simple ordering task we compared performance using no modulation and using subtle mod- ulation with the correct order of narrative episodes as intended by the artist. Results from experiments show improved performance when SGD is employed. This experiment establishes the potential of the method as an aid to visual navigation in images where the viewing order is unclear. CR Categories: I.3.3 [Computer Graphics]: Three-Dimensional Graphics and Realism—Display Algorithms Keywords: eye-tracking, gaze direction, art history education * e-mail: [email protected] 1 Introduction In this paper we describe the use of Subtle Gaze Direction (SGD) to correctly guide observers through pictorial episodes when viewing paintings (Figure 1). To improve visual literacy we propose the use of SGD to direct the viewer’s gaze over an image in a manner which reveals the story in the narrative art. Using a simple ordering task we compared performance using no modulation and using subtle modulation, highlighting the center of the panels in the order of the story narrative. Results from experiments show improved performance when SGD is employed. This experiment establishes the potential of the method as an aid to visual navigation in images where the viewing order is unclear. Narrative art tells a story, either as a moment in an ongoing story or as a sequence of events unfolding over time. A synoptic narrative depicts a single scene in which a character, or characters, are portrayed multiple times within a frame to convey that multiple actions are taking place. This can cause the sequence of events to be unclear within the narrative. Synoptic narratives typically provide visual cues that convey the sequence, but it still might be difficult to decipher for those unfamiliar with the story. The process is best illustrated with an example. Figure 2 (top) shows a synoptic painting titled “The Tribute Money” by Renaissance artist Masaccio. This painting describes a story from the Gospel of Matthew, in which Jesus directs Peter to go to the river and retrieve a coin from the mouth of a fish in order to pay the temple tax. The optimal way to visually navigate this piece is to begin in the center with the tax collector demanding the money. Jesus, surrounded by his disciples, instructs Peter to retrieve the money from the mouth of a fish. By moving their gaze to the left of the painting (perhaps counter-intuitive to western civilization who normally read left to right) viewers notice Peter executing Jesus’ instruction. 63
Transcript of Directing Gaze in Narrative Art - Oregon State...
Copyright © 2012 by the Association for Computing Machinery, Inc. Permission to make digital or hard copies of part or all of this work for personal or classroom use is granted without fee provided that copies are not made or distributed for commercial advantage and that copies bear this notice and the full citation on the first page. Copyrights for components of this work owned by others than ACM must be honored. Abstracting with credit is permitted. To copy otherwise, to republish, to post on servers, or to redistribute to lists, requires prior specific permission and/or a fee. Request permissions from Permissions Dept, ACM Inc., fax +1 (212) 869-0481 or e-mail [email protected]. SAP 2012, Los Angeles, CA, August 3 – 4, 2012. © 2012 ACM 978-1-4503-1431-2/12/0008 $15.00
Directing Gaze in Narrative Art
Ann McNamara∗
Texas A&M UniversityThomas Booth
Rochester Institute of TechnologySrinivas Sridharan
Rochester Institute of TechnologyStephen Caffey
Texas A&M UniversityCindy Grimm
Washington University in St. LouisReynold Bailey
Rochester Institute of Technology
B A
1
2
3 4 5
6 1
2
3 4 5
6
Figure 1: Fixation maps over an art work that contains separate panels, which, when viewed in the intended order, tell a coherent story. Inthis work a gaze direction technique is used to visually guide the viewer through the image. As can be seen above the distribution of fixationsis very different for static viewing (A), and Gaze Directed viewing (B). The highlighted rectangular regions indicate story panels, and thenumbered circles indicate viewing order. In the gaze directed case, both order viewing accuracy and fixations on relevant panels increased.The story of Joseph, by Biagio dAntonio, reproduced with kind permission of the J. Paul Getty Museum, Los Angeles
Abstract
Narrative art tells a story, either as a moment in an ongoing storyor as a sequence of events unfolding over time. In many works ofart separate panels within the same frame are used to depict the se-quence of events. Often, there is no clear delineation between thesepanels, or any indication of the optimal viewing order. To improvevisual literacy we propose using Subtle Gaze Direction (SGD) to di-rect the viewers gaze across an image in a manner which reveals thestory. SGD uses small image space modulations in the luminancechannel to guide a viewer‘s gaze about an image without disruptingtheir normal visual experience. Using a simple ordering task wecompared performance using no modulation and using subtle mod-ulation with the correct order of narrative episodes as intended bythe artist. Results from experiments show improved performancewhen SGD is employed. This experiment establishes the potentialof the method as an aid to visual navigation in images where theviewing order is unclear.
CR Categories: I.3.3 [Computer Graphics]: Three-DimensionalGraphics and Realism—Display Algorithms
Keywords: eye-tracking, gaze direction, art history education
∗e-mail: [email protected]
1 Introduction
In this paper we describe the use of Subtle Gaze Direction (SGD) tocorrectly guide observers through pictorial episodes when viewingpaintings (Figure 1). To improve visual literacy we propose theuse of SGD to direct the viewer’s gaze over an image in a mannerwhich reveals the story in the narrative art. Using a simple orderingtask we compared performance using no modulation and usingsubtle modulation, highlighting the center of the panels in the orderof the story narrative. Results from experiments show improvedperformance when SGD is employed. This experiment establishesthe potential of the method as an aid to visual navigation in imageswhere the viewing order is unclear.
Narrative art tells a story, either as a moment in an ongoing story oras a sequence of events unfolding over time. A synoptic narrativedepicts a single scene in which a character, or characters, areportrayed multiple times within a frame to convey that multipleactions are taking place. This can cause the sequence of eventsto be unclear within the narrative. Synoptic narratives typicallyprovide visual cues that convey the sequence, but it still mightbe difficult to decipher for those unfamiliar with the story. Theprocess is best illustrated with an example. Figure 2 (top) showsa synoptic painting titled “The Tribute Money” by Renaissanceartist Masaccio. This painting describes a story from the Gospel ofMatthew, in which Jesus directs Peter to go to the river and retrievea coin from the mouth of a fish in order to pay the temple tax. Theoptimal way to visually navigate this piece is to begin in the centerwith the tax collector demanding the money. Jesus, surroundedby his disciples, instructs Peter to retrieve the money from themouth of a fish. By moving their gaze to the left of the painting(perhaps counter-intuitive to western civilization who normallyread left to right) viewers notice Peter executing Jesus’ instruction.
63

The viewer’s eyes next need to travel to the extreme right of thepainting to view the third episode in which Peter pays the taxcollector. At the time it was painted, audiences were conditionedto recognize repeated elements in a frame and identify panels,thereby intuitively understanding the intended order in which eachepisode of the painting was to be viewed. However, our ability,as artists and audiences, to correctly “read” these paintings maynot be so accurate in present day because our visual literacy is notconditioned to follow the viewing pattern the artist intended. In the15th century the audience would understand that there are multipleepisodes in this painting, and also in which order to view thesepanels in order to comprehend the story. Web-based solutionsdo exist which manipulate a digital representation of a paintingusing strong outlines, or interruptive text over the image to explainwhere the viewer should direct their gaze (see Figure 2, [Masaccio1421]). While these represent a promising initial approach, a moreelegant solution would not disrupt interrupt the visual experienceof the audience. Employing gaze direction techniques wouldallow the viewer to see the actual painting with areas of interestaccentuated in a manner which preserves the visual experienceby acknowledging the artist’s intent. In this work we investigatethe use of Subtle Gaze Direction (SGD) as an aid to navigatenarrative art. This goal of this work is to satisfy the need to displayinformation in a manner that minimizes disruption to the viewer,but can accurately direct gaze to certain locations of an image, ina specific sequence. In other words, our original SGD techniquedid not examine how well SGD directs gaze to multiple imagelocations in a specific sequence.
Figure 2: Above: “The Tribute Money”, by Masaccio tells thestory of Jesus and the tax collector. The piece should be viewed inthe following order: center, left, then right. Current web-browserbased educational tools use text pop-ups with interruptive rectan-gular outlines to highlight important information in a visual narra-tive. This not only distracts the viewer from appreciating the image,but also breaks up the image into smaller pieces so it is not viewedin a holistic manner. The red colored rectangle destroys the visualexperience by superimposing a distracting overlay on the originalpainting.
The main contributions of this work is validation of SGD as atechnique to influence where viewers look in a scene, both spatiallyand temporally. This technique will be especially useful in the dig-ital humanities, as it will allow scholars to recuperate various types
of visual literacy specific to a historical moment. We focus on ArtHistory Education as an application but it is easy to extend to anyvisual task in which viewing order is critical to understanding ortask completion.
2 Previous Work
Subtle Gaze Direction (SGD) [Bailey et al. 2009] exploits the wellestablished fact that human peripheral vision processes stimulifaster than foveal vision [Ogden and Miller 1966]. On initialviewing of a scene the low-acuity peripheral vision of the HumanVisual System (HVS) locates regions of interest. The fovealvision, which is slower and has higher acuity, is then involuntarilydirected to focus on these regions. SGD proceeds by modulatingregions of an image that appear only to peripheral vision. Inthis manner peripheral vision is forced to locate the indicatedregions of interest, which are subsequently fixated on. This causesinvoluntary saccades to move the eye to fixate on the modulatedregion as it attempts to resolve the detected stimuli. Luminancemodulation works well as the HVS is highly sensitive to changesin luminance values [Spillman 1990].
Modulations are constructed by alternately blending small pixel re-gions with some amount of black, then some amount of white. Therate at which the blend is modulated is 10Hz. A Gaussian falloffwith a radius of 32 pixels is used which (in our viewing configura-tion) corresponds to approximately a 2cm diameter circular screenarea.
The marriage of technology and art appreciation is not new — sev-eral existing applications have successfully been applied in the Artdomain [Gwilt 2009] [Damala et al. 2008] [Andolina et al. 2009][Bruns et al. 2007] [Choudary et al. 2009] [Chou et al. 2005] [Srini-vasan et al. 2009]. To date, however, few have proposed eye-tracking as an added dimension. The novelty of this approach liesin the eye-tracking and in attracting and directing the gaze to thecorrect region of the artwork in a sequence that will encourageappropriate visual navigation and understanding of the image andstrengthen observation skills.
Obviously conspicuous objects in a scene (such as a black sheepin a white flock) will draw the viewer‘s attention first. However,there are more subtle image characteristics that can also draw ourgaze. Image properties such as color, size and orientation canbe used to control attention [Veas et al. 2011] [Underwood andFoulsham 2006] [Underwood et al. 2009]. In movies, directors usean arsenal of cinematographic “tricks” to lead the audience to lookwhere they want them to look (see [Bordwell 2011]). Taking anautomated approach, Itti and Koch [Itti and Koch 2000][Itti andKoch 2001] developed an algorithm to measure visual saliency(how likely people are to look at parts of an image) on the basis ofimage characteristics such as intensity distribution, color changes,and orientation. Saliency maps could prove to be a good candidateto indicate the initial attention in a painting. Then, by modifyingthe digital version of the painting to re-distribute saliency, wecould build several versions of the painting with the pre-selectedinteresting regions manipulated to increase saliency. For example,in “The Tribute Money” when it is time to look at Peter retrievingthe coin from the mouth of the fish, SGD could boost the saliencyin that region and thereby influence the viewer to re-direct theirgaze.
This remainder of this paper presents a psychophysical experimentthat explores the impact of SGD on performance during a viewingof narrative art works. The results show that this method works well
64
without introducing noticeable artifacts into images, which mightdegrade the viewing experience.
3 Experimental Design
The goal of this experiment is to determine to what extent SGDlends itself to aid observers in extracting the intended sequence ofevents from regions of an episodic image. Participants viewed asequence of images, each of which contained three or more panelsintended as episodes. The intended viewing order of these pan-els is not always immediately clear. Art history research providesthe narrative for each art piece, from which panels are determined[Velli 2007]. Panels (in each image) were manually selected asrectangular regions which enclosed the relevant portion of the im-age that conveyed an episode of the story. In the non-control group,after viewing the image for a short period of time, relevant panelswere highlighted using SGD at the panel center. Participants thenindicated the order they perceived to be the correct viewing orderby clicking on image sections outlined with boxes. We compareperformance using SGD with performance under normal viewingconditions.
3.1 Stimuli
Eleven images served as stimuli for the experiment, two of whichwere used for observer training, see Figure 7). In each image,episodes or panels were identified and served as targets for SGD.The number of episodes (panels) varied from painting to painting,ranging from three to seven.
The size of panels also varied within each image (see Figure 3), ini-tially we were concerned that fixations may be artificially increasedin proportion to panel size, but this did not turn out to be the case.
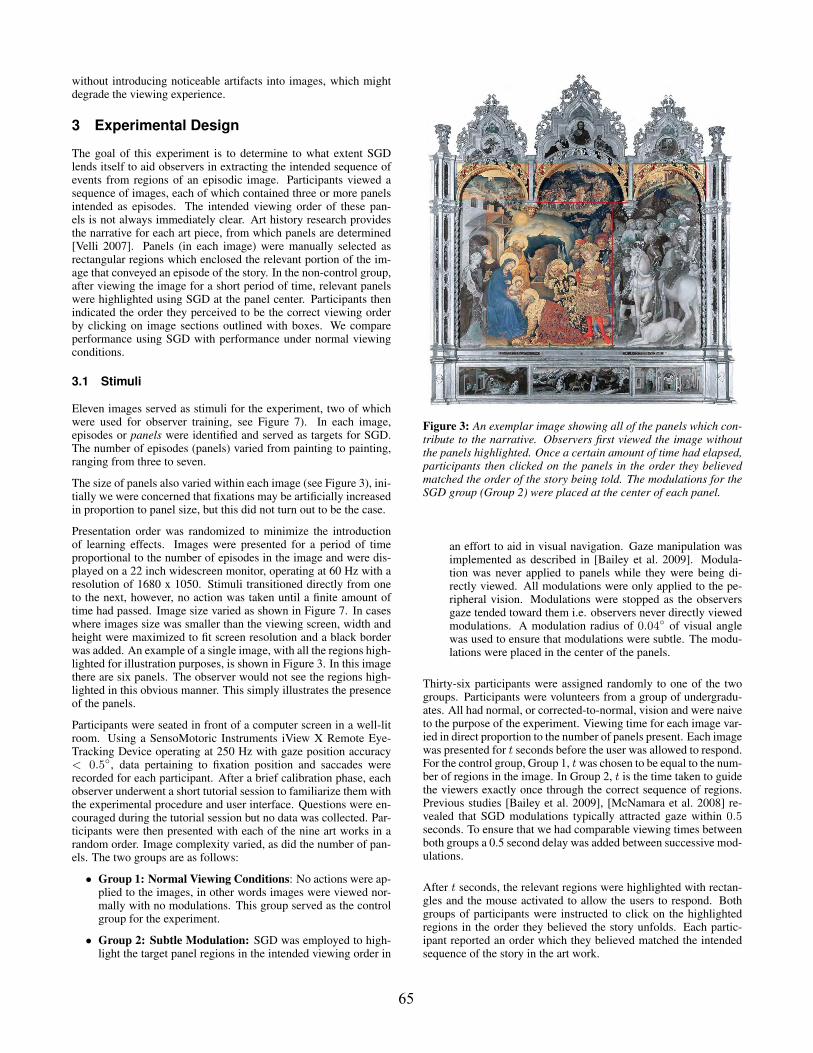
Presentation order was randomized to minimize the introductionof learning effects. Images were presented for a period of timeproportional to the number of episodes in the image and were dis-played on a 22 inch widescreen monitor, operating at 60 Hz with aresolution of 1680 x 1050. Stimuli transitioned directly from oneto the next, however, no action was taken until a finite amount oftime had passed. Image size varied as shown in Figure 7. In caseswhere images size was smaller than the viewing screen, width andheight were maximized to fit screen resolution and a black borderwas added. An example of a single image, with all the regions high-lighted for illustration purposes, is shown in Figure 3. In this imagethere are six panels. The observer would not see the regions high-lighted in this obvious manner. This simply illustrates the presenceof the panels.
Participants were seated in front of a computer screen in a well-litroom. Using a SensoMotoric Instruments iView X Remote Eye-Tracking Device operating at 250 Hz with gaze position accuracy< 0.5◦, data pertaining to fixation position and saccades wererecorded for each participant. After a brief calibration phase, eachobserver underwent a short tutorial session to familiarize them withthe experimental procedure and user interface. Questions were en-couraged during the tutorial session but no data was collected. Par-ticipants were then presented with each of the nine art works in arandom order. Image complexity varied, as did the number of pan-els. The two groups are as follows:
• Group 1: Normal Viewing Conditions: No actions were ap-plied to the images, in other words images were viewed nor-mally with no modulations. This group served as the controlgroup for the experiment.
• Group 2: Subtle Modulation: SGD was employed to high-light the target panel regions in the intended viewing order in
Figure 3: An exemplar image showing all of the panels which con-tribute to the narrative. Observers first viewed the image withoutthe panels highlighted. Once a certain amount of time had elapsed,participants then clicked on the panels in the order they believedmatched the order of the story being told. The modulations for theSGD group (Group 2) were placed at the center of each panel.
an effort to aid in visual navigation. Gaze manipulation wasimplemented as described in [Bailey et al. 2009]. Modula-tion was never applied to panels while they were being di-rectly viewed. All modulations were only applied to the pe-ripheral vision. Modulations were stopped as the observersgaze tended toward them i.e. observers never directly viewedmodulations. A modulation radius of 0.04◦ of visual anglewas used to ensure that modulations were subtle. The modu-lations were placed in the center of the panels.
Thirty-six participants were assigned randomly to one of the twogroups. Participants were volunteers from a group of undergradu-ates. All had normal, or corrected-to-normal, vision and were naiveto the purpose of the experiment. Viewing time for each image var-ied in direct proportion to the number of panels present. Each imagewas presented for t seconds before the user was allowed to respond.For the control group, Group 1, t was chosen to be equal to the num-ber of regions in the image. In Group 2, t is the time taken to guidethe viewers exactly once through the correct sequence of regions.Previous studies [Bailey et al. 2009], [McNamara et al. 2008] re-vealed that SGD modulations typically attracted gaze within 0.5seconds. To ensure that we had comparable viewing times betweenboth groups a 0.5 second delay was added between successive mod-ulations.
After t seconds, the relevant regions were highlighted with rectan-gles and the mouse activated to allow the users to respond. Bothgroups of participants were instructed to click on the highlightedregions in the order they believed the story unfolds. Each partic-ipant reported an order which they believed matched the intendedsequence of the story in the art work.
65

3.2 Analysis of Data
In addition to recording eye-movements for each participants, eachparticipant reported an order for each image, based on their un-derstanding of panel sequence within that image. We needed arobust mechanism to compare accuracy of performance betweenthe two groups. Levenshtein distance [Navarro 2001] [Levenshtein1965] [Levenshtein 1966] is a string metric, developed in the filedof information theory and computer science to compute differencesbetween sequences. Levenshtein distance provides an appropriatemeasure to compare distances between ordered sequences, such asthose recorded during our experiment. To accurately compare se-quences using Levenshtein distance the correct (intended) viewingorder of each image is converted into a string sequence. All re-sponses from each participant are also converted to an appropri-ate string sequence in order to facilitate comparison to the correctsequence. Since the number of relevant regions varies across theimages we normalize the distance measure computed for each im-age by dividing by the number of panels. The normalized Leven-shtein distance L between the correct sequence Scorrect and usersequence Suser is as follows:
L =Levenshtein Distance(Scorrect, Suser)
# of Panels∗ 100 (1)
For example, let the correct panel order be [ABCDE] and let[ACBDE] denote the participant’s response. The number of pan-els in this image is five. Using Equation 1, we obtain a normalizedLevenshtein distance value of 40. A distance of 0 would indicateno difference, whereas a distance of 100 would indicate maximaldistance.
4 Results and Discussion
The predicted sequence of panels reported by each participant foreach image was recorded. Normalized distances for each imagewere compared to the actual intended sequence for that image us-ing the distance metric expressed in Equation 1. The calculated nor-malized Levenshtein distance measures between conditions showeddifferences across the two groups with a mean distance measuresof 57.32 and 34.79 for groups 1 and 2 respectively, as illustratedin Figure 4. These values were calculated by averaging the nor-malized Leveshtein distance (L) for all the participants in a groupover all the images used in the experiment. This implies that par-ticipants from Group 2 (guided by SGD) consistently proved to bemore accurate at predicting the intended sequence of panels con-tained in narrative art when compared to Group 1, the control group(no SGD). This measure indicates that, for example, when view-ing a narrative art image containing ten panels, the static viewinggroup will incorrectly predict the order of approximately 5−6 pan-els, while the gaze directed group, Group 2, will return a predictionwith only 3−4 panels out of the sequence. An independent-samplespaired t− test suggests that this was a significant effect:
t(316) = 1.9675; p < 0.05 (2)
Figure 5 shows the average L value for each image across all theparticipants in each group. This analysis gives some intuition on thethe influence of the number of panels over the accuracy in detectingthe correct sequences in the narrative art. The images in the graphare arranged in the increasing order of number of panels. In all nineimages, the average L value indicates that the participants in Group2, the gaze directed group, predict panel order more accurately thanthe participants from Group 1, the static viewing group. This alsoshows that the gaze directed group performed better than the static
0
20
40
60
80
100
Normalized
Leven
shtein
Distan
ce
Normalized Levenshtein Distance between Sta7c Viewing and Gaze Directed group
Sta+c Viewing Gaze Directed
Figure 4: Normalized Levenshtein distance measure betweenGroup 1 (static viewing group) and Group 2( gaze directed group).Error bars represent one standard error. The graph shows thatGroup 2 participants, who viewed SGD images were able to predictthe intended viewing order of panels more accurately than those inGroup 1 that did not have the benefit of SGD as a gaze directionaid.
0 10 20 30 40 50 60 70 80 90 100
3 3 4 4 4 5 6 7 26
Normalized
Leven
shtein Distance
Number of panels in each image
Average Levenshtein Distance between Groups by Image
Sta/c Viewing Gaze Directed
Figure 5: Normalized Levenshtein distance measure between staticviewing group and gaze directed group for each image. The x-axisindicates the number of panels in each image. The error bars rep-resent one standard error.
group for images having relevant regions varying from 3 to 26. Ineight of the nine images used in the study, this result was shownto be significant. Independent-samples t-tests reveal that this effectwas significant and not due to chance, the t-test results for imageswith relevant regions 3,4,5,6,7 and 26 are shown in Table 1.
The results did reveal a single anomaly where the t-test did not showa significant difference between groups. Image “C”, shown in Fig-ure 7, revealed no significant difference in performance betweenthe two groups. Further inspection showed that in this image, theartist has gradually decreased the luminance of the narrative art overthe story. This analysis was possible as the same characters appearover multiple regions in the image. We reason that this luminancechange in itself would provide a strong enough visual cue to enablethe participants in Group 1 to correctly navigate the story. This alsosuggest that luminance changes could serve to guide direct gaze in
66

Sta$c Viewing Group Gaze Directed Group
A B
C D
1 2 3
4
1 2 3
4
1 2 3
4
1 2 3
4
Figure 6: This Figure shows the scan paths and heat-maps for one participant from each of the two groups (no modulation and SGD), ImageA & C represent data collected from Group 1, while images B & D were collected from Group 2. Rectangular highlighted regions denotepanels. Blue numbered circles indicate the correct viewing order of panels within the image. As can be seen from the images, gaze distributionand fixations are more accurately aligned with panel (modulated) regions in the SGD condition.
Number of panels Independent t-test (Group 1 V Group 2)3 t(33) = 2.03224 t(33) = 2.03465 t(33) = 2.03456 t(33) = 2.03407 t(33) = 2.028
26 t(33) = 2.0364
Table 1: Independent t-tests indicate significant differences in theability to correctly predict intended panel sequences for imageswith vary in numbers of panels. In each case, p < 0.05.
imagery. This phenomenon is a topic for future research.
To further illustrate the success of SGD we present a single ex-ample. Figure 6 shows the images for the static viewing and thegaze directed group respectively. Images are placed side-by-sidefor comparison.
Image A depicting the scan path of the viewer’s gaze over the staticimages shows that the viewer’s gaze does not coincide with all ofthe relevant story panels. Contrast this with image B, which showsthe scan path over the SGD enhanced image. This image revealsa more coherent scan path in terms of visitation to each relevantpanel.
Comparing heat maps reveals a similar story. The heat maps repre-sent the amount of time spent fixating in each image region. Figure6,Image C reveals that most fixations fall to the left of the image,and the distribution does not encompass the story panels. Con-versely, examination of the heat map for image D (SGD) indicatesthat viewer fixations are distributed over the story panels.
Examining the L value measures (as described in Section 3.2) forthis single image, the Group 1 (no SGD) participant’s value is 71.45compared to 28.57 for the participant from Group 2 (the gaze di-rected group). Thus the heat map and scan path analysis not onlyreflect the increase in the gaze coverage and attention to all rele-vant regions of the image for the gaze directed group over the staticviewing group, but also correspond well with the L-value metricchosen to compare performance.
It is important to note that Figure 6 serves as a representative ex-ample of a consistent trend across all nine images viewed. Thisanalysis reveals that, without SGD, not only did participants failto view all of the story panels, but they failed to fixate on all therelevant story panels. The exact opposite is true for those imagespresented with SGD applied to the story panels, giving a high levelof confidence in the success of applying SGD to subtly reveal anintended viewing sequence.
Informal reporting, post experiment, showed that a small subsetof participants (approximately 15%) reported noticing the modu-lations, but (as designed) the modulation disappeared before they
67

could inspect it. A single participant reported trying to follow themodulations, again performing exactly the action SGD is designedfor. In these cases we reason that certain individuals may haveheightened peripheral vision e.g. it has been proposed by severalresearchers, for example, that strong peripheral vision may givebasketball players, and other athletes a distinct advantage duringgame play [Vickerss 2007]. In general, however the premise of sub-tly holds well for SGD. Even in cases where individual participantsnoticed SGD task performance was not impeded.
In summary our results show that gains can be made in task per-formance when modulation is employed to direct gaze to target asequence of panels in a specific order. Even if the modulationsare noticed to some degree, there is still an increased accuracy intask performance. This seems to hold true over a range of images,and over a range of panel numbers. For applications that require aspecific viewing order for understanding or performance, SGD canserve as a subtle aid to boost accuracy of performance on a sub-image ordering task.
5 Conclusions and Future Work
We presented an experiment to compare task performance in digitalimages across two groups of stimuli. In one group no image alter-ations were used (Group 1), in the second group small modulationswere applied to image panels in an effort to direct the viewers gaze(Group 2). The participant’s task was to specify the order of panels(contained in episodic art pieces) which revealed the intended story.The results indicate that using a subtle gaze direction technique,which modulates the appropriate panel in the intended sequence,does indeed improve the precision of panel ordering. The differ-ence between performance between the two groups was shown tobe significant.
For this study we chose to modulate the luminance channel withina small radius of pixels. All modulations took the same shape andwere modulated using the same oscillation strength. Given the vari-ation of the subset of images we included in this study, and thevariation in the number of panels, it may be that variation of modu-lation shape and strength would yield further improvements in taskperformance. For example, when the number of relevant panels islarge, perhaps a stronger modulation would attract gaze faster. Forfuture work it may be useful to implement modulations character-istics based on image content rather than take a “one-size-fits-all”approach.
Also, in this chosen domain, all of the imagery is static. We areinterested in applying SGD to dynamic environments, which maypose increased difficulty due to the attentional draw of objects inmotion. We anticipate that stronger modulations will be requiredto successfully used SGD effectively in dynamic environments, butthe payoff could be beneficial in areas such as simulation trainingand educational gaming.
We have shown that SGD can improve performance on a within-image panel ordering set without noticeably disrupting the visualexperience of the image. This technique can be applied to helpguide gaze in complex applications where viewing order is criti-cal to understanding, such as in story telling, or training task per-formance where sequence of operations is important, for example,construction instructions.
Acknowledgements
This material is based in part on work supported be the NationalScience Foundation under Award No. IIS-0952631. Any opin-ions, findings, and conclusions or recommendations expressed in
this material are those of the author(s) and do not necessarily re-flect the views of the National Science Foundation.
References
ANDOLINA, S., SANTANGELO, A., CANNELLA, M., GENTILE,A., AGNELLO, F., AND VILLA, B. 2009. Multimodal virtualnavigation of a cultural heritage site: the medieval ceiling of steriin palermo. In Proceedings of the 2nd conference on HumanSystem Interactions, IEEE Press, Piscataway, NJ, USA, HSI’09,559–564.
BAILEY, R., MCNAMARA, A., SUDARSANAM, N., AND GRIMM,C. 2009. Subtle gaze direction. ACM Trans. Graph. 28 (Septem-ber), 100:1–100:14.
BORDWELL, D., 2011. http ://www.davidbordwell.net/blog/2011/02/14/watching −you− watch− there− will − be− blood/.
BOSCOTRECASE, 1BC. Landscape with perseus and andromeda ,http://www.metmuseum.org/toah/works-of-art/20.192.16.
BRUNS, E., BROMBACH, B., ZEIDLER, T., AND BIMBER, O.2007. Enabling mobile phones to support large-scale museumguidance. IEEE MultiMedia 14 (April), 16–25.
CHOU, S.-C., HSIEH, W.-T., GANDON, F. L., AND SADEH,N. M. 2005. Semantic web technologies for context-aware mu-seum tour guide applications. In Proceedings of the 19th Inter-national Conference on Advanced Information Networking andApplications - Volume 2, IEEE Computer Society, Washington,DC, USA, AINA ’05, 709–714.
CHOUDARY, O., CHARVILLAT, V., GRIGORAS, R., AND GUR-DJOS, P. 2009. March: mobile augmented reality for culturalheritage. In Proceedings of the 17th ACM international con-ference on Multimedia, ACM, New York, NY, USA, MM ’09,1023–1024.
DA FABRIANO, G., 1423. Adoration of the magi,http://arthistoryblogger.blogspot.com/2011/11/continuous-narrative-in-art.html.
DAMALA, A., CUBAUD, P., BATIONO, A., HOULIER, P., ANDMARCHAL, I. 2008. Bridging the gap between the digital andthe physical: design and evaluation of a mobile augmented real-ity guide for the museum visit. In Proceedings of the 3rd interna-tional conference on Digital Interactive Media in Entertainmentand Arts, ACM, New York, NY, USA, DIMEA ’08, 120–127.
DI BUONINSEGNA, D., 1311. Christtaken prisoner. http://www.wga.hu/frames-e.html?/html/d/duccio/maesta/verso 1/verso07.html.
DI BUONINSEGNA, D., 1311. Maesta alterpiece,http://www.casasantapia.com/art/duccio/maestabackpanels.htm.
DANTONIO, B., 1485. The story of joseph.http://www.getty.edu/education/teachers/classroom resources/curricula/stories in art/downloads/sia story joseph.pdf.
GWILT, I. 2009. Augmented reality and mobile art. In Handbookof Multimedia For Digital Entertainment and Arts, B. Furht, Ed.Springer US, 593–599.
ITTI, L., AND KOCH, C. 2000. A saliency-based search mecha-nism for overt and covert shifts of visual attention. Vision Re-search 40, 10-12 (May), 1489–1506.
ITTI, L., AND KOCH, C. 2001. Computational modelling of visualattention. Nature Reviews Neuroscience 2, 3 (Mar), 194–203.
68
LEVENSHTEIN, V. 1965. Binary codes capable of correcting spu-rious insertions and deletions of ones. Problems of InformationTransmission 1, 8–17.
LEVENSHTEIN, V. I. 1966. Binary codes capable of correctingdeletions, insertions, and reversals. Tech. Rep. 8.
MASACCIO, A., 1421. The tribute money,http://en.wikipedia.org/wiki/the tribute money.
MCNAMARA, A., BAILEY, R., AND GRIMM, C. 2008. Improvingsearch task performance using subtle gaze direction. In Proceed-ings of the 5th symposium on Applied perception in graphics andvisualization, ACM, New York, NY, USA, APGV ’08, 51–56.
NAVARRO, G. 2001. A guided tour to approximate string matching.ACM Comput. Surv. 33, 1 (Mar.), 31–88.
OGDEN, T. E., AND MILLER, R. F. 1966. Studies of the opticnerve of the rhesus monkey: Nerve fiber spectrum and physio-logical properties. Vision Research 6, 1, 485–506.
SPILLMAN, L. 1990. Visual Perception: The NeurophysiologicalFoundations. Academic Press, San Diego.
SRINIVASAN, R., BOAST, R., FURNER, J., AND BECVAR, K. M.2009. Digital museums and diverse cultural knowledges: Mov-ing past the traditional catalog. The Information Society 25(July), 265–278.
UNDERWOOD, G., AND FOULSHAM, T. 2006. Visual saliencyand semantic incongruency influence eye movements when in-specting pictures. Q J Exp Psychol (Colchester) 59, 11 (Nov.),1931–1949.
UNDERWOOD, J., TEMPLEMAN, E., AND UNDERWOOD, G.2009. Attention in cognitive systems. Springer-Verlag, Berlin,Heidelberg, ch. Conspicuity and Congruity in Change Detection,85–97.
VEAS, E. E., MENDEZ, E., FEINER, S. K., AND SCHMALSTIEG,D. 2011. Directing attention and influencing memory with vi-sual saliency modulation. In Proceedings of the 2011 annualconference on Human factors in computing systems, ACM, NewYork, NY, USA, CHI ’11, 1471–1480.
VELLI, S. T. 2007. Le immagini e il tempo: Narrazione visiva,storia e allegoria tra Cinque e Seicento. Edizioni Della Normale,Italy.
VICKERSS, J. 2007. Perception, Cognition, and Decision Training:The Quiet Eye in Action. Human Kinetics, New York, NY.
WITZ, K., 1434. The miraculous draught of the fishes,http://mydailyartdisplay.wordpress.com/2011/07/18/the-miraculous-draught-of-the-fishes-by-konrad-witz-2/.
69
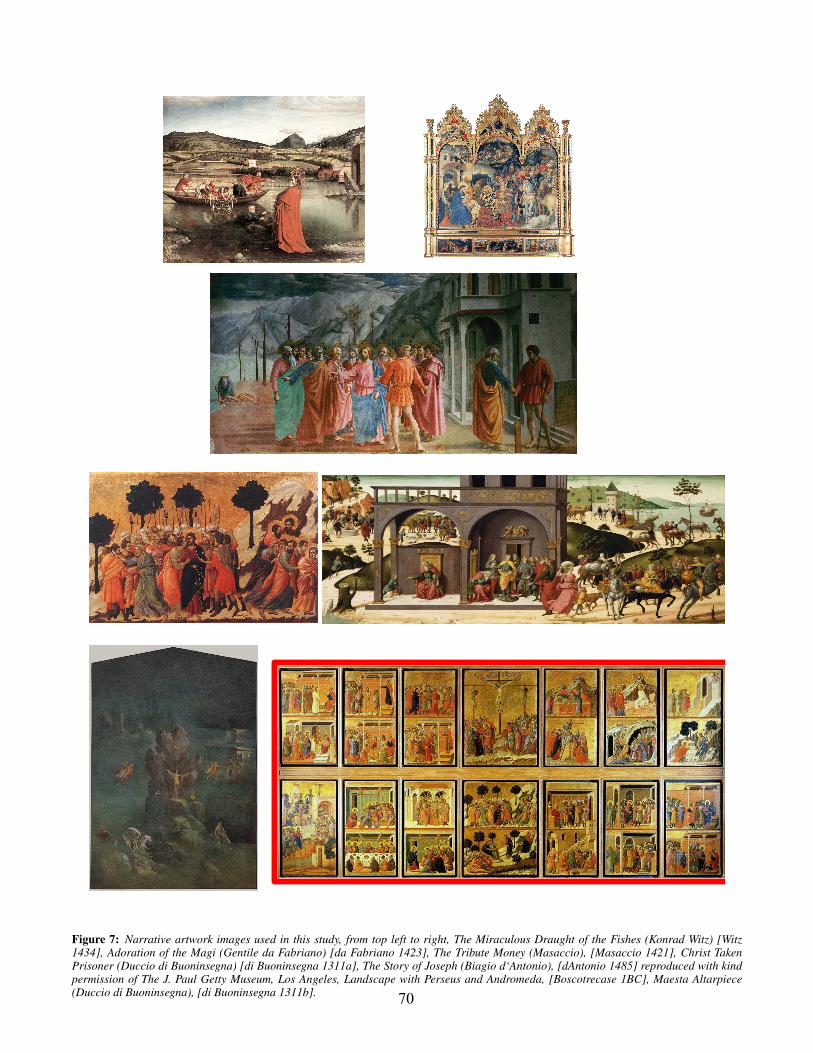
Figure 7: Narrative artwork images used in this study, from top left to right, The Miraculous Draught of the Fishes (Konrad Witz) [Witz1434], Adoration of the Magi (Gentile da Fabriano) [da Fabriano 1423], The Tribute Money (Masaccio), [Masaccio 1421], Christ TakenPrisoner (Duccio di Buoninsegna) [di Buoninsegna 1311a], The Story of Joseph (Biagio d‘Antonio), [dAntonio 1485] reproduced with kindpermission of The J. Paul Getty Museum, Los Angeles, Landscape with Perseus and Andromeda, [Boscotrecase 1BC], Maesta Altarpiece(Duccio di Buoninsegna), [di Buoninsegna 1311b]. 70