
Direct the Rein - bi.go.id · Direct the Rein to Sail Along the Ocean ... This stance was picked in...
32
Direct the Rein to Sail Along the Ocean The desnaon has been vowed, the ark moves bravely facing the wave in the middle of the sea. Let the helmsman takes control and negoates with the situaon to e-up safely at the piers
Transcript of Direct the Rein - bi.go.id · Direct the Rein to Sail Along the Ocean ... This stance was picked in...

i
Direct the Reinto Sail Along the Ocean
The destination has been vowed, the ark moves bravely facing the wave in the middle of the sea. Let the helmsman takes control and negotiates with the situation to tie-up safely at the piers

MONETARY POLICY RESPONSETO GLOBAL ECONOMIC CRISIS
CHAPTER
III
78
Indonesia Monetary Policy Response amidst Global Economic Crisis
The global economic crisis, still lingering in 2009, has put enormous pressure on the country’s monetary policy as manifested particularly in the increasingly unstable domestic financial system. Such a prolonged global economic slump had led to a considerable short-term capital outflow in the first quarter of 2009, significantly undermining the country’s stock and bond market performance, putting a strain on the rupiah exchange rate, and carrying added risks to the domestic banking industry. Such a blow to the country’s financial system should not be left unchecked since it may undo the numerous positive outcomes previously brought about by the country’s macroeconomic stability.
The monetary policy taken in response to such a pressure was aimed not only at striking a harmonious balance between targeted price stability and economic growth, but also at safeguarding the country’s financial system stability. By taking into account indications of decline in inflationary pressure, the country’s monetary policy has been directed to take a loose stance in order to prevent the country’s economic growth from decelerating even further and to maintain the country’s financial system stability. Following a series of policies pursued in the last quarter of 2008, Bank Indonesia lowered the BI Rate significantly in 2009. This policy has been supported by several other policies made operational both on rupiah money markets as well as foreign currency markets. Such supporting policies were intended to boost confidence over the
Monetary Policy Response to Global Economic Crisis | CHAPTER III 79
availability of short term liquidity to support money market activities, at the same time optimizing the management of bank liquidity.
A series of policies taken since the last quarter of 2008 had been able to support the process of stability recovery in the financial sector. This recovery has taken effect starting from the second quarter of 2009. This was reflected in the decline of various risks within the financial market, and in the prevention of the rupiah exchange rate to further depreciate. This condition was quite favorable in order to restore the performance of the real sector. The real sector itself has started to pick up since the beginning of the second semester of 2009.
In the future, the monetary policy will still face various challenges. Firstly, the still dominant share of portfolio investment within the capital inflow structure poses a risk of putting an increasing strain on the rupiah exchange rate in times of capital
flows reversal. Secondly, the persistently vast excess banking liquidity has the potential to reduce the effectiveness of monetary policy. Thirdly, there are still unresolved structural issues in the real sector, including constraints in the supply side and market structure. Constraints on the supply side will make an increase in demand easily trigger inflationary pressure. Meanwhile, the still distorted market will make it harder for prices to go down.
This chapter will be further divided into five parts. The first part will discuss various responses and monetary policy achievements throughout 2009. The second part will explain the dynamics of capital inflows and the implication toward exchange rate stability. The third part will provide elaboration on various issues potentially distorting the works of monetary policy transmission mechanism. The fourth part will discuss constraints in the supply side, market structure, and their implications toward inflation. The last part is a conclusion.
80 CHAPTER III | Monetary Policy Response to Global Economic Crisis
3.1
Monetary Response in 2009
Throughout 2009, Bank Indonesia took a measured, loose monetary policy stance to promote national economic recovery. As inflationary pressure remained low, the monetary policy was made in a measured response to ongoing economic development. Such a response was aimed not only at minimizing the negative effects of global economic downturn, but also at maintaining the resilience of the country’s macro economy and domestic financial system as a basis to reach a high quality economic growth. This stance was picked in line with the implementation of a flexible ITF framework over the last five years in a bid to reach a harmony between achieving inflation target and economic growth (Box 3.1. Entering the 5th year of ITF Implementation in Indonesia: Success and Challenges).
The measured, loose monetary policy stance can be seen in the development of BI Rate which tended to move downward in a varied pace over three different periods. In those three periods, BI Rate was set based on overall latest economic condition and the economic prospect. The first episode was in January-March 2009 when BI Rate was reduced aggressively at 50 bps monthly. Such an aggressive BI Rate cut was taken to anticipate tight pressure on the financial system and the slowdown in economic growth trend which is expected to be prolonged, while future inflationary pressure was predicted to be weak. The second episode was in April-August 2009 when BI Rate was cut by 25 bps per month. This policy was taken upon considering that the pressure on the financial system was beginning to decline and the condition of minimal inflationary pressure, while economic growth acceleration was still not sufficient. The

Monetary Policy Response to Global Economic Crisis | CHAPTER III 81
third episode was in September-December 2009 when BI Rate was kept on hold. As the financial system condition improved over time, the unchanged level of BI Rate was consistent with the efforts to reach the inflation target in 2010-2011, yet it still provided ample room for the economic recovery.
The widespread financial crisis in developed countries weighing on global economic growth brought about quite strong pressure to the Indonesian economy chiefly in fourth quarter 2008. The impact was observed in a significantly slower economic expansion due to a fall in exports. The balance of payments suffered from a surging deficit and rupiah exchange rate was severely depreciated. Foreign capital flow reversal pushed the risk in interbank money market up,44 sent stock market indices to nosedive, and raised SUN yield to a high level. The weakening economic activity is also registered on slower expansion of liquidity and credit. Responding to a weak future inflationary pressure, in January-March 2009 the BI Rate was lowered by 50 bps per month, making it stand at 7.75% in March 2009. In addition, Bank Indonesia took a number of policies in the foreign exchange market to ease an excessive pressure in exchange rate volatility while maintaining liquidity adequacy in domestic foreign exchange market. Since 30 January 2009 Bank Indonesia also launched a foreign exchange repurchase agreement instrument (repo) by applying Republic of Indonesia Global Bond as transaction collateral.45 With the policy in place, domestic banks could repo their own Indonesian Government Global Bond to Bank Indonesia to fulfill their foreign exchange liquidity needs.
In subsequent developments, positive sentiment from the global financial market began to rise in mid March 2009 bringing foreign capital flows back to emerging markets including Indonesia. This condition in turn helped ease exchange rate pressure. The recovery in global commodity prices along with the positive sentiment over global financial market recovery brought the Indonesia Composite Index up and SUN yield down albeit limitedly since mid March 2009. Positive sentiment also sparked over growing foreign exchange reserves generated from
44 Reflected in some indicators, including the decline in PUAB outstanding position, shrinking PUAB volume and actors, rising spread between PUAB O/N floor and ceiling interest rate, widening JIBOR spread in various maturities, a shift in the augmentation of banking excess liquidity stock placement to shorter term.
45 PBI No. 11/4/2009 on US dollar Transaction of Bank Repurchase Agreement to Bank Indonesia dated on 30 January 2009.
the sales of Indonesian Government Global Medium Term Notes (GMTN). The positive sentiment grew stronger upon the enhancement of cooperation to raise the amount of Bilateral Swap Arrangement (BSA) with Japan and Bilateral Currency Swap Arrangement (BCSA) with China. Those policies and positive sentiments could eventually relax the pressure on rupiah depreciation in the whole first quarter 2009. At the end of March 2009, the rupiah depreciated by 5.7% to Rp11,555 to the US dollar with a volatility of 1.0%.46 This depreciation was lower than that of the last quarter of 2008 recorded at 13.8% with a 2.4% volatility.47 Such an exchange rate development remained in line with conditions in regional countries.
The early signals of global economic recovery drove the improvement in risk perception against both global and domestic economies. The effect of the improved global risk perception was mainly supported by economic recovery momentum in the Asian region continuing since early April 2009. The condition served as one of the supporting factors in restoring domestic export performance, especially for natural-resourced based commodities. In addition, a growing optimism over the recovery of global economy, heightened by the improvement in risk perception against assets in the emerging markets, drove foreign capital inflow back speedily. In the middle of insufficient economic growth and the expectation for a mild inflationary pressure in the future, the initial global economic recovery served as a base for adjustment in BI Rate (a decrease of 25 bps per month). Thus in August 2009, the BI rate stood at 6,5%. In addition, to give a guarantee and temporary cushion for the banking liquidity availability Bank Indonesia launched a 1-month window repo instrument since mid April 2009.
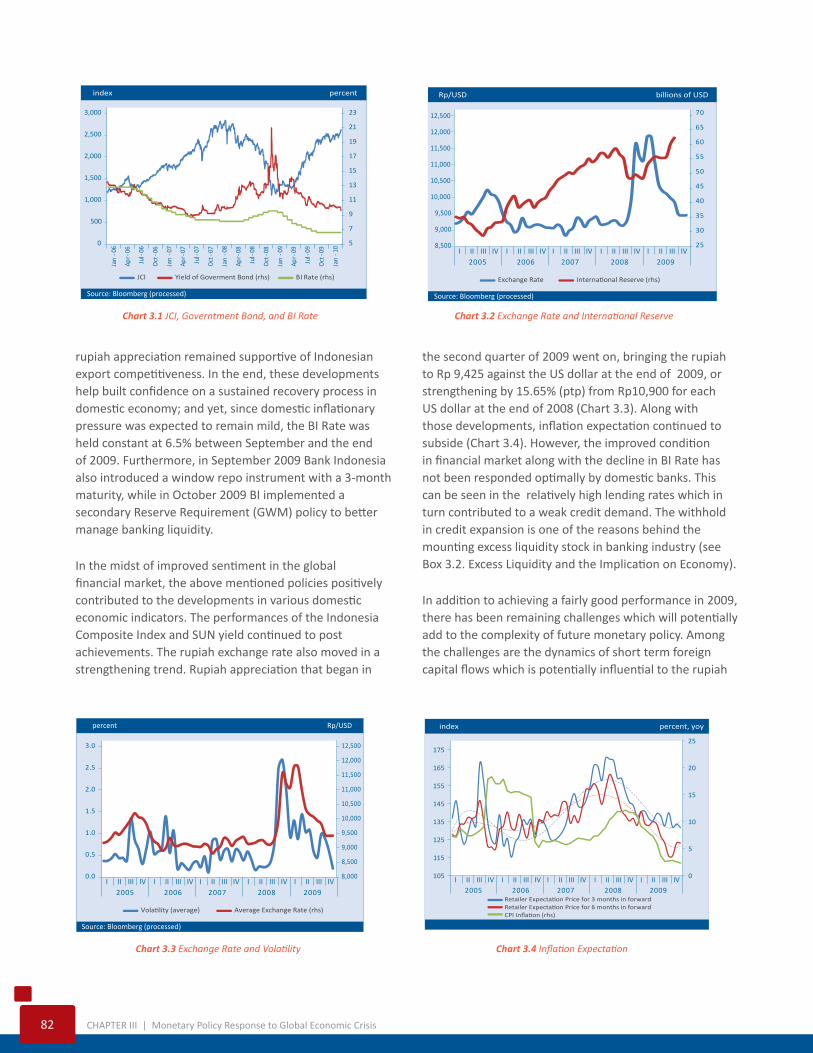
Gradual and consistent monetary policy easing taken amid the continued global economic recovery helped improve various domestic economic indicators. Increases in capital flows and exports were mirrored in the balance of payments surplus. Foreign capital flows also contributed to the lifting of Indonesia Composite Index, while SUN yield moved downward closer to the pre-crisis condition (Chart 3.1). Improvement also occurred in the domestic foreign exchange market, as shown by rupiah appreciation of 14.6% between the end of March to the end of August 2009, rupiah eventually closed at Rp10,080 per US dollar (Chart 3.2). Despite strengthening,
46 Or by an average of Rp11.578 per US dollar.47 Depreciated by an average of 15.3%.
82 CHAPTER III | Monetary Policy Response to Global Economic Crisis
rupiah appreciation remained supportive of Indonesian export competitiveness. In the end, these developments help built confidence on a sustained recovery process in domestic economy; and yet, since domestic inflationary pressure was expected to remain mild, the BI Rate was held constant at 6.5% between September and the end of 2009. Furthermore, in September 2009 Bank Indonesia also introduced a window repo instrument with a 3-month maturity, while in October 2009 BI implemented a secondary Reserve Requirement (GWM) policy to better manage banking liquidity.
In the midst of improved sentiment in the global financial market, the above mentioned policies positively contributed to the developments in various domestic economic indicators. The performances of the Indonesia Composite Index and SUN yield continued to post achievements. The rupiah exchange rate also moved in a strengthening trend. Rupiah appreciation that began in
the second quarter of 2009 went on, bringing the rupiah to Rp 9,425 against the US dollar at the end of 2009, or strengthening by 15.65% (ptp) from Rp10,900 for each US dollar at the end of 2008 (Chart 3.3). Along with those developments, inflation expectation continued to subside (Chart 3.4). However, the improved condition in financial market along with the decline in BI Rate has not been responded optimally by domestic banks. This can be seen in the relatively high lending rates which in turn contributed to a weak credit demand. The withhold in credit expansion is one of the reasons behind the mounting excess liquidity stock in banking industry (see Box 3.2. Excess Liquidity and the Implication on Economy).
In addition to achieving a fairly good performance in 2009, there has been remaining challenges which will potentially add to the complexity of future monetary policy. Among the challenges are the dynamics of short term foreign capital flows which is potentially influential to the rupiah
Chart 3.1 JCI, Governtment Bond, and BI Rate Chart 3.2 Exchange Rate and International Reserve
Source: Bloomberg (processed)
JCI Yield of Goverment Bond (rhs) BI Rate (rhs)
percentindex
5
7
9
11
13
15
17
19
21
23
0
500
1,000
1,500
2,000
2,500
3,000Ja
n-0
6
Apr-
06
Jul-
06
Oct-
06
Jan
-07
Apr-
07
Jul-
07
Oct-
07
Jan
-08
Apr-
08
Jul-
08
Oct-
08
Jan
-09
Apr-
09
Jul-
09
Oct-
09
Jan
-10
Source: Bloomberg (processed)
2005 2006 2007 2008 2009I II III IV I II III IV I II III IV I II III IV I II III IV
Exchange Rate International Reserve (rhs)
billions of USDRp/USD
25
30
35
40
45
50
55
60
65
70
8,500
9,000
9,500
10,000
10,500
11,000
11,500
12,000
12,500
Chart 3.3 Exchange Rate and Volatility Chart 3.4 Inflation Expectation
Source: Bloomberg (processed)
percent Rp/USD
2005 2006 2007 2008 2009I II III IV I II III IV I II III IV I II III IV I II III IV
Volatility (average) Average Exchange Rate (rhs)
8,000
8,500
9,000
9,500
10,000
10,500
11,000
11,500
12,000
12,500
0.0
0.5
1.0
1.5
2.0
2.5
3.0
2005 2006 2007 2008 2009I II III IV I II III IV I II III IV I II III IV I II III IV
percent, yoyindex
0
5
10
15
20
25
105
115
125
135
145
155
165
175
Retailer Expectation Price for 3 months in forwardRetailer Expectation Price for 6 months in forwardCPI Inflation (rhs)

Monetary Policy Response to Global Economic Crisis | CHAPTER III 83
exchange rate development; high risk perception and excess liquidity which can distort the monetary policy transmission mechanism; and the unresolved structural issues in the supply side which may push inflationary pressure up. Those challenges will be further examined in the next section.
84 CHAPTER III | Monetary Policy Response to Global Economic Crisis
3.2
The Dynamics of Foreign Capital Flows
As a small-open economy, developing countries generally face a fundamental challenge when implementing monetary policy in regard to the high dynamics in foreign capital flows. The openness of capital account accompanied by the strong capital flows make exchange rate movement more affected by capital flow activity than the current account. It is worth noting, however, that exchange rate dynamics with open capital account may incite vulnerability in financial system. A more fluctuative capital account compared to the current account in the midst of herding behavior can drive excessive flows or, on the contrary, a sudden stop in capital flows. Moreover, any increases in capital flows, especially the short term ones, will result in elevated volatility in the financial market and will potentially turn into shock amplifier.48 in the middle of weak infrastructure and minimal financial market depth such that of a developing country. It will certainly exacerbate the impact.
The foreign capital inflows in a form of large portfolio investment and the relatively weak structure of financial market put developing countries into a vulnerable position against a sudden stop in capital flows. This could produce large exchange rate depreciation, such as during the 1997/1998 currency crisis that rocked many developing countries, including those in East Asia. Other than a sudden stop in capital flows, a major depreciation can also be caused by a shock to the terms of trade or to
48 Pruski, Jerzy and Piotr Szpunar (2008). ”Capital Flows and Their Implications for Monetary and Financial Stability: The Experience of Poland,” BIS Paper No. 44
Monetary Policy Response to Global Economic Crisis | CHAPTER III 85
the international interest rate. In a developing country adopting an open capital account and applying ITF as a framework in its monetary policy, the floating exchange rate system is an optimum option in accordance with the principle of “impossible trinity”.49
The growing role of capital flows is also experienced in Indonesia. In the 1990s period capitals inflow to Indonesia were mainly foreign currency denominated debt (foreign debt). In 1997/1998, when rupiah was severely depreciated, the vulnerability of corporations having a foreign exchange exposure in their financial structure increased. This added pressure to macroeconomic stability and brought down the performance of the overall economy. This state was due to a lot of imperfectness in the market and the financial instruments. In 2000s, there are push and pull factor which accelerated the integration of the domestic economy into the global economy through financial markets (financial linkage).
Increasingly rapid capital flows entering Indonesia were supported by interactions in the global developments serving as a push factor, while domestic developments act as a pull factor. Meanwhile, the global economy is facing a global imbalance amid an overly loose monetary policy and a large foreign exchange reserves accumulated by some developing countries. This will in turn trigger global excess liquidity. Meanwhile, pull factors were originated from various domestic conditions such as a deregulation policy to set up a free exchange rate system,
49 Impossible trinity or the policy trilema is an international economic term which means that a country can only choose 2 out of the total 3 following policies: fixed exchange rate, free capital flows, and an independent monetary policy.
a favorable exchange rate regime, and a strong optimism among real sector actors. Furthermore, the appeal of capital flows is also influenced by supports from a more prudent macroeconomic policy, both fiscal and monetary particularly after 1997/1998 crisis.
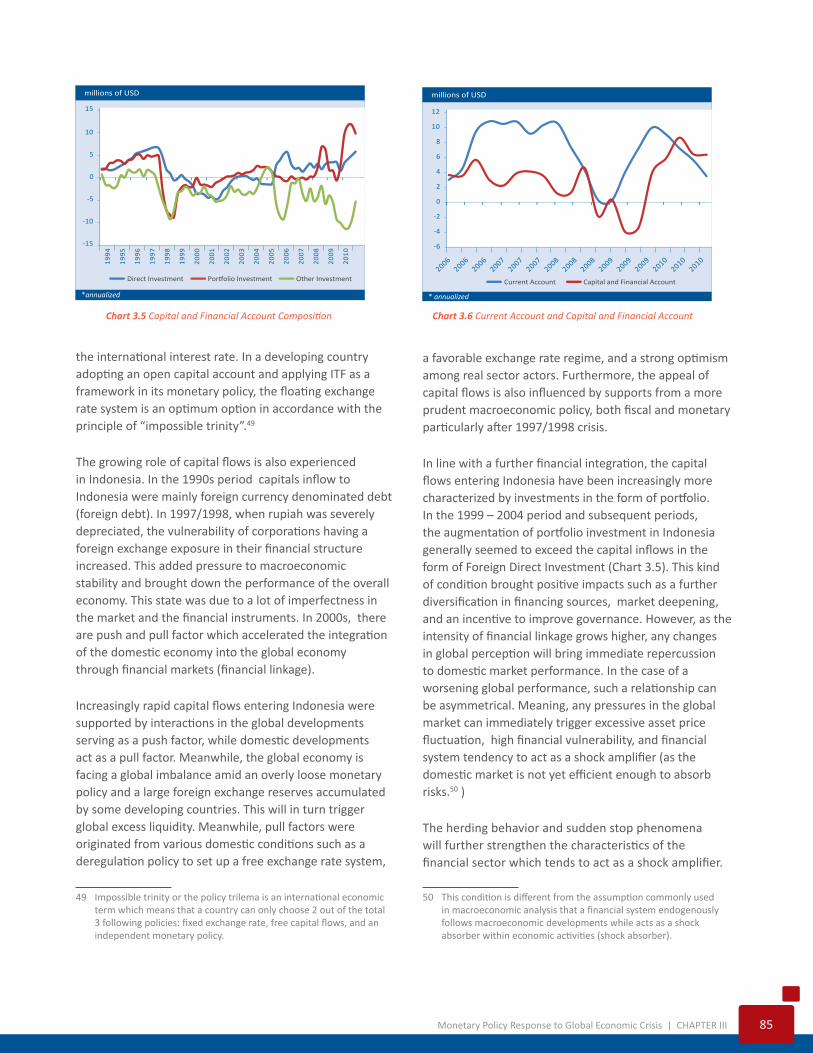
In line with a further financial integration, the capital flows entering Indonesia have been increasingly more characterized by investments in the form of portfolio. In the 1999 – 2004 period and subsequent periods, the augmentation of portfolio investment in Indonesia generally seemed to exceed the capital inflows in the form of Foreign Direct Investment (Chart 3.5). This kind of condition brought positive impacts such as a further diversification in financing sources, market deepening, and an incentive to improve governance. However, as the intensity of financial linkage grows higher, any changes in global perception will bring immediate repercussion to domestic market performance. In the case of a worsening global performance, such a relationship can be asymmetrical. Meaning, any pressures in the global market can immediately trigger excessive asset price fluctuation, high financial vulnerability, and financial system tendency to act as a shock amplifier (as the domestic market is not yet efficient enough to absorb risks.50 )
The herding behavior and sudden stop phenomena will further strengthen the characteristics of the financial sector which tends to act as a shock amplifier.
50 This condition is different from the assumption commonly used in macroeconomic analysis that a financial system endogenously follows macroeconomic developments while acts as a shock absorber within economic activities (shock absorber).
Chart 3.5 Capital and Financial Account Composition Chart 3.6 Current Account and Capital and Financial Account
millions of USD
*annualized
Direct Investment Portfolio Investment Other Investment
-15
-10
-5
0
5
10
1519
94
1995
1996
1997
1998
1999
2000
2001
2002
2003
2004
2005
2006
2007
2008
2009
2010
millions of USD
* annualized
Current Account Capital and Financial Account
-6
-4
-2
0
2
4
6
8
10
12
86 CHAPTER III | Monetary Policy Response to Global Economic Crisis
An excessive capital outflow implicated by a herding behavior and a sudden stop takes its toll on shrinking rupiah exchange rate and domestic financial asset value. Facts show that during 1997/1998 crisis rupiah’s plummet was accompanied by a severe fluctuation as it depreciated by around 85% during the July 1997-June 1998 period. Indonesia Composite Index suffered a sharp drop by 62% in June 1997-September 1998 period. In addition, during a ‘mini’crisis in 2005 SUN yield climbed sharply by 16%, while Indonesia Composite Index was down to the 1,058 level.51 In the 2008 economic crisis, Indonesia Composite Index fell by 54%, while SUN yield was corrected by 20% during the period of February-November 2008.
The dominant role of portfolio investment in capital and financial accounts push rupiah exchange rate volatility up. The growing share of portfolio investment within the balance of payment makes rupiah pricing vulnerable, since it is more affected by any changes in investors’ risk perception within the global financial market than by fundamental factors. This is made more complicated by the phenomenon that the capital flows from the current account, is not fully suppllied the domestic foreign exchange market (Chart 3.6). Some exporters prefer to put their export-generated foreign currencies in overseas placements due to a number of reasons such as (1) the policy of their parent companies, especially for foreign subsidiaries; (2) terms and condition of the Master Loan Agreement, mainly for the exporters who rely their financing on loans; and (3) efforts to optimize the advantage of services provided by overseas banking to the exporters who are also importers at the same time.
The dynamics of an exchange rate which is more affected by portfolio capital flow creates a complexity for monetary management. This is due to the changes in interest rate that will not automatically affect exchange rate movement both through domestic demand channels and financial channels in referrence to the concept of Uncovered Interest Parity (UIP). A measured and prudent policy interest rate setting is indeed able to build up market confidence. However, in times when global condition is overwhelmed by high uncertainties, UIP postulate does not always work, even for developed countries adopting ITF. To the Indonesian economy, these things have added to the complexity of the policies given that exchange rate
51 In 20 October 2005, or depreciated by almost 2% since the end of September 2005.
remains highly influential to domestic prices (pass-through impact).52
The strategy to manage capital flows and exchange rate should be done in line with a flexible ITF implementation. Under general ITF framework, a floating exchange rate system is a strategic choice for an economy. However, in a condition where the role of rupiah exchange rate tends to act as a shock amplifier and where there is relatively high inflation ‘pass-through’, the strategy in exchange rate management needs to be reinforced by policy strategies other than one using interest rate as its main policy instrument. The example of such policy is measured intervention in the foreign exchange market to reduce excessive fluctuation in rupiah exchange rate (smoothing).53 It is worth noting that central bank’s intervention into the foreign exchange market brings a psychological effect to the exchange rate movement and serves as an effective agent to influence a short term exchange rate, especially when compared to the response against interest rate based policy.54 In this regard, the strongest effect of this policy mainly hit developing countries as their markets are smaller while their central banks are relatively better informed than the market players.
In the case of Indonesian economy, the application of the highly flexible exchange rate system inclines to add a depreciative pressure. In such a condition, the Bank Indonesia’s policy toward foreign exchange market is carried out in a measured way over a certain period and degree, thus keeping a depreciative pressure on hold and preventing inflation expectation from sparking. However, the policy is not sustainable when not reinforced with efforts to reach the inflation target. Therefore, commitment and consistency of monetary policy in order to achieve the targeted inflation level should always be continued. This will increase monetary policy credibility, which is in turn will help to create a low and stable
52 Conceptually, under a floating exchange rate system the potential of a pass-through effect from the exchange rate to domestic prices is low (Hufner, Felix. ”Foreign Exchange Intervention as Monetary Policy Instrument: Evidence for Inflation Targeting Countries”, ZEW Economic Studies 23. 2003). However, an idle UIP (caused by, among others, the domination in portfolio capital flows) leads to a high pass-through effect of exchange rate to imported goods prices.
53 Accompanied by sterilization (sterilized intervention) to put a neutral impact to liquidity.
54 Disyatat, Piti and Gabriele Galati (2005), “The Effectiveness of Foreign Exchange Intervention in Emerging Market Countries: Evidence from Czech Korona”, BIS Working Paper 172.
Monetary Policy Response to Global Economic Crisis | CHAPTER III 87
inflation expectation. Such an achievement will also relax the ‘pass-through’ impact on an unexpected depreciation.
Finally, it can be concluded that the rise in capital flows among countries in the world will in turn affect domestic policy. The development in global market nowadays contributes to improved discipline in monetary and fiscal policies. This is done by punishing poor policies and rewarding excellent ones. The efforts to discipline monetary policy are carried out by, among others, implementing ITF, and by reinforcing the commitment in the policy to improve transparency among economic actors. The global financial crisis shows that price stability
will not guarantee stability in financial system. The strong capital flows among countries made exchange rate more affected by capital flows than the current account condition, which serves as a better reflector on economic fundamentals. Therefore, the role of monetary authority in developing countries will not only be limited to managing interest rate policy, but also to monitoring the behavior of capital account, executing interventions along with sterilizations in times of severely fluctuating exchange rate movement, and developing and deepening the domestic financial sector in a bid to make it more capable of absorbing shocks.
88 CHAPTER III | Monetary Policy Response to Global Economic Crisis
3.3
Monetary Policy Transmission in the Midst of High Risk Perception and Excess Banking Liquidity
Monetary policy face challenges from distorted transmission mechanism. In normal circumstances, monetary policy is expected to be capable of directing economic activities effectively. Theoretically, monetary policy response is transmitted through a number of channels such as interest rate, credit, corporate balance sheet, asset value, and exchange rate. In Indonesian context, since the start of ITF implementation in July 2005 monetary policy has put interest rate as its operational target. In this case, policy signals are transmitted through interest rate policy setting, namely BI Rate. By using various monetary instruments to affect the liquidity in money market, the Bank Indonesia’s policy is transmitted through various channels, which in turn will affect domestic demand and inflation. The logic of the interdependency among variables in policy transmission mechanism is illustrated in (Diagram 3.1.)
Generally, the monetary policy transmission has run well in financial markets, especially in stock, government bonds and mutual funds markets. Loose monetary policy seems to be favorable to support improvement in confidence amid the initial recovery in fundamental condition. In 2009 Indonesia Composite Index recorded an annual growth of 87% underpinned by the mining sector (Chart 3.7). In addition, government bond yield significantly declined in comparison with the level during the peak of the global financial crisis (October 2008). The average SUN yield for all tenures declined to 246 bps, which was dominated by short term yield (Chart 3.8). The decline in SUN yield for short, medium and long term maturities were at 375 bps, 239 bps, and 130 bps respectively. The mutual fund Net

Monetary Policy Response to Global Economic Crisis | CHAPTER III 89
Asset Value posted a robust growth reaching Rp113 trillion or up Rp38.7 trillion compared to 2008 level. The types of mutual fund which contributed to the jump in NAB were mainly the protected and fixed-income ones.
During a recovery from crisis period, monetary policy transmission was indicated to work through liquidity channel. That was made possible as a consequence of Bank Indonesia’s effort in managing liquidity and the assumption of a stable money multiplier of narrow economic liquidity (M1). In addition, the relationship among the real M1, interest rate and the real economic growth seemed stable enough in the long run. Under such a relationship, the slowing M1 growth reflects more on
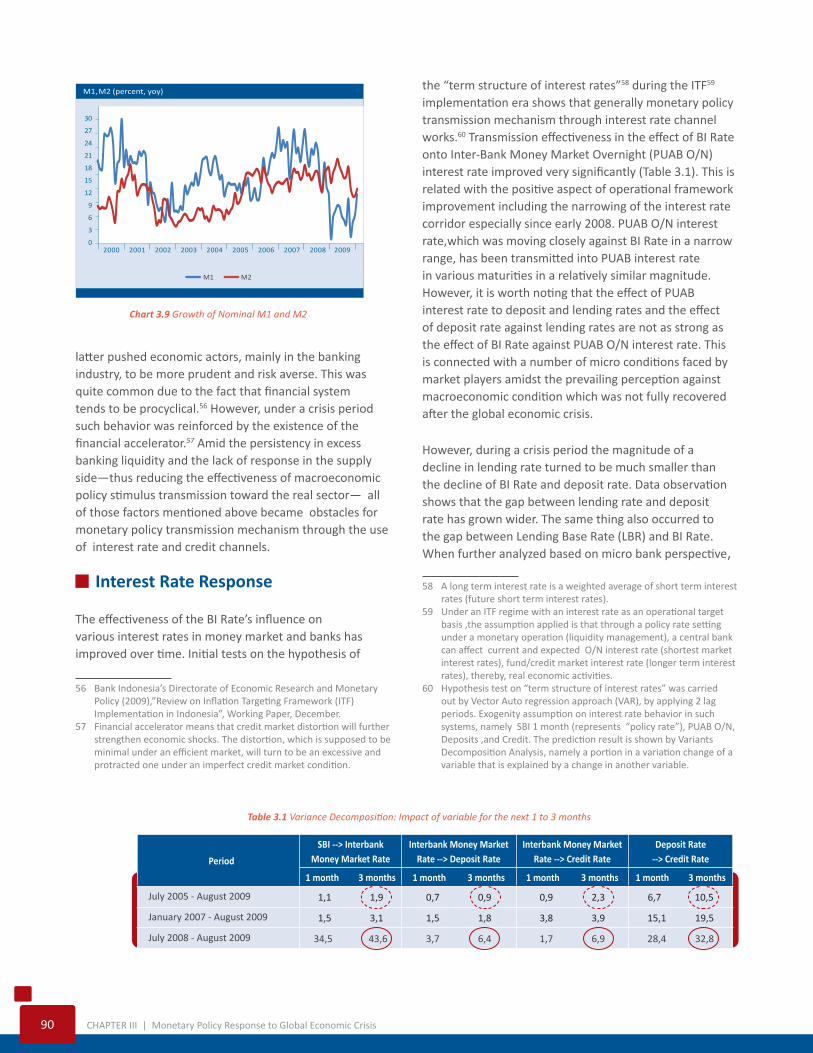
the severity of the impact from deteriorating economic activities than the impact from a decline in deposit rates. This implicitly indicated that M1 condition was in line with the real activity needs within the economy (Chart 3.9).55
However, the global economic downturn forced monetary policy transmission process to face some challenges. The spreading effects of the global economic crisis were strong enough to drive the economy to slowdown and
55 Conducted by comparing test results using standard currency demand function to actual currency demand condition. If the relative test result is equal with the actual condition (deviation within a standard error range) then the currency demand matches with economic needs.
TotalSupplyMoney
MarketLiquidity
Interest Rates
Credit
Balance Sheet
Asset Prices
PriceExpectation
Monetary VariablesBI Rate
ForexIntervention
Minimum ReserveRequirement
Corridor
OMO
MoneyOperation
EXCHANGE RATE
OUTPUTGAP
DomesticInflationary
Pressure
INFLATIONTotal
Demand
ExternalInflationary
Pressure
Diagram 3.1 Monetary Policy Transmission Mechanism
Chart 3.7 BI Rate and JCI Chart 3.8 BI Rate and Yield Government Bond
Source: Bloomberg (processed)
index
2006 2007 2008 2009I II III IV I II III IV I II III IV I II III IV
JCI BI Rate (rhs)
percent
5
6
7
8
9
10
11
12
13
14
500
1,000
1,500
2,000
2,500
3,000
Source: Bloomberg (processed)
2006 2007 2008 2009I II III IV I II III IV I II III IV I II III IV
Yield Government Bond BI Rate
percent
5
7
9
11
13
15
17
19
21
23
90 CHAPTER III | Monetary Policy Response to Global Economic Crisis
latter pushed economic actors, mainly in the banking industry, to be more prudent and risk averse. This was quite common due to the fact that financial system tends to be procyclical.56 However, under a crisis period such behavior was reinforced by the existence of the financial accelerator.57 Amid the persistency in excess banking liquidity and the lack of response in the supply side—thus reducing the effectiveness of macroeconomic policy stimulus transmission toward the real sector— all of those factors mentioned above became obstacles for monetary policy transmission mechanism through the use of interest rate and credit channels.
g Interest Rate Response
The effectiveness of the BI Rate’s influence on various interest rates in money market and banks has improved over time. Initial tests on the hypothesis of
56 Bank Indonesia’s Directorate of Economic Research and Monetary Policy (2009),”Review on Inflation Targeting Framework (ITF) Implementation in Indonesia”, Working Paper, December.
57 Financial accelerator means that credit market distortion will further strengthen economic shocks. The distortion, which is supposed to be minimal under an efficient market, will turn to be an excessive and protracted one under an imperfect credit market condition.
the “term structure of interest rates”58 during the ITF59 implementation era shows that generally monetary policy transmission mechanism through interest rate channel works.60 Transmission effectiveness in the effect of BI Rate onto Inter-Bank Money Market Overnight (PUAB O/N) interest rate improved very significantly (Table 3.1). This is related with the positive aspect of operational framework improvement including the narrowing of the interest rate corridor especially since early 2008. PUAB O/N interest rate,which was moving closely against BI Rate in a narrow range, has been transmitted into PUAB interest rate in various maturities in a relatively similar magnitude. However, it is worth noting that the effect of PUAB interest rate to deposit and lending rates and the effect of deposit rate against lending rates are not as strong as the effect of BI Rate against PUAB O/N interest rate. This is connected with a number of micro conditions faced by market players amidst the prevailing perception against macroeconomic condition which was not fully recovered after the global economic crisis.
However, during a crisis period the magnitude of a decline in lending rate turned to be much smaller than the decline of BI Rate and deposit rate. Data observation shows that the gap between lending rate and deposit rate has grown wider. The same thing also occurred to the gap between Lending Base Rate (LBR) and BI Rate. When further analyzed based on micro bank perspective,
58 A long term interest rate is a weighted average of short term interest rates (future short term interest rates).
59 Under an ITF regime with an interest rate as an operational target basis ,the assumption applied is that through a policy rate setting under a monetary operation (liquidity management), a central bank can affect current and expected O/N interest rate (shortest market interest rates), fund/credit market interest rate (longer term interest rates), thereby, real economic activities.
60 Hypothesis test on “term structure of interest rates” was carried out by Vector Auto regression approach (VAR), by applying 2 lag periods. Exogenity assumption on interest rate behavior in such systems, namely SBI 1 month (represents “policy rate”), PUAB O/N, Deposits ,and Credit. The prediction result is shown by Variants Decomposition Analysis, namely a portion in a variation change of a variable that is explained by a change in another variable.
Table 3.1 Variance Decomposition: Impact of variable for the next 1 to 3 months
Chart 3.9 Growth of Nominal M1 and M2
M1, M2 (percent, yoy)
M1 M2
0
3
6
9
12
15
18
21
24
27
30
2000 2001 2002 2003 2004 2005 2006 2007 2008 2009
Period
SBI --> Interbank Money Market Rate
Interbank Money Market Rate --> Deposit Rate
Interbank Money Market Rate --> Credit Rate
Deposit Rate --> Credit Rate
1 month 3 months 1 month 3 months 1 month 3 months 1 month 3 months
July 2005 - August 2009 1,1 1,9 0,7 0,9 0,9 2,3 6,7 10,5
January 2007 - August 2009 1,5 3,1 1,5 1,8 3,8 3,9 15,1 19,5
July 2008 - August 2009 34,5 43,6 3,7 6,4 1,7 6,9 28,4 32,8
Monetary Policy Response to Global Economic Crisis | CHAPTER III 91
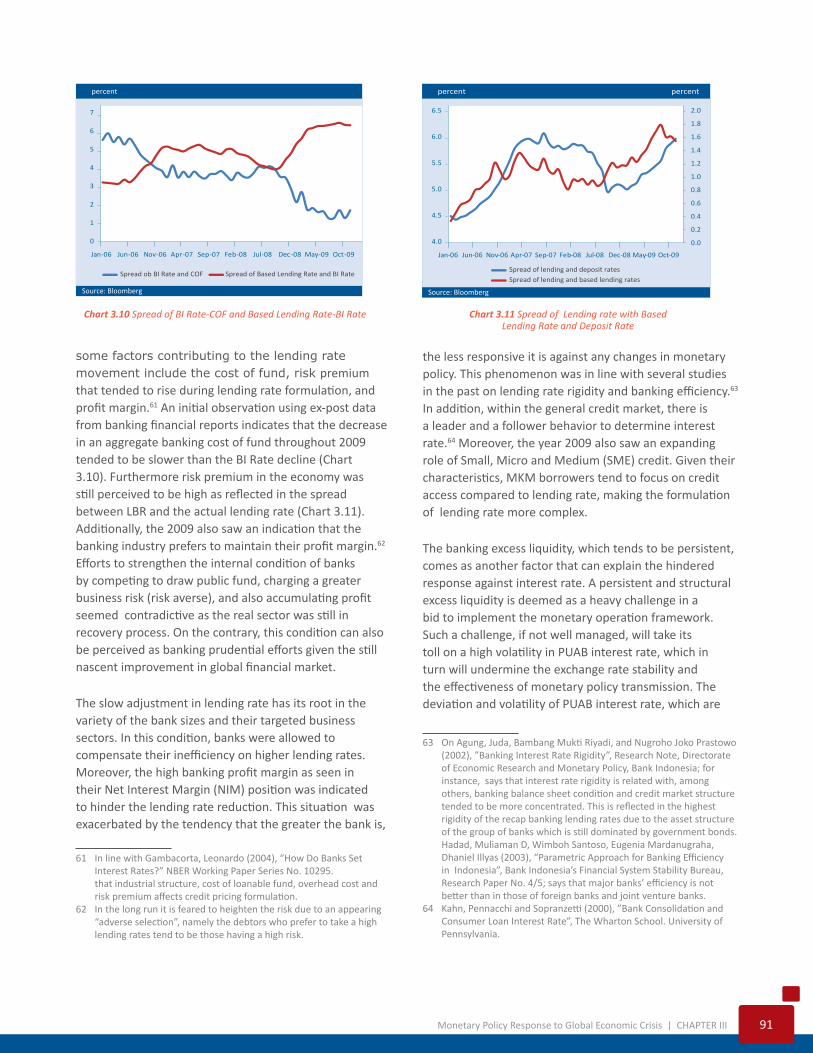
Chart 3.10 Spread of BI Rate-COF and Based Lending Rate-BI Rate Chart 3.11 Spread of Lending rate with Based Lending Rate and Deposit Rate
Source: Bloomberg
Spread of lending and deposit ratesSpread of lending and based lending rates
percent percent
0.0
0.2
0.4
0.6
0.8
1.0
1.2
1.4
1.6
1.8
2.0
4.0
4.5
5.0
5.5
6.0
6.5
Jan-06 Jun-06 Nov-06 Apr-07 Sep-07 Feb-08 Jul-08 Dec-08 May-09 Oct-09
percent
Source: Bloomberg
Spread ob BI Rate and COF Spread of Based Lending Rate and BI Rate
0
1
2
3
4
5
6
7
Jan-06 Jun-06 Nov-06 Apr-07 Sep-07 Feb-08 Jul-08 Dec -08 May-09 Oct-09
some factors contributing to the lending rate movement include the cost of fund, risk premium that tended to rise during lending rate formulation, and profit margin.61 An initial observation using ex-post data from banking financial reports indicates that the decrease in an aggregate banking cost of fund throughout 2009 tended to be slower than the BI Rate decline (Chart 3.10). Furthermore risk premium in the economy was still perceived to be high as reflected in the spread between LBR and the actual lending rate (Chart 3.11). Additionally, the 2009 also saw an indication that the banking industry prefers to maintain their profit margin.62 Efforts to strengthen the internal condition of banks by competing to draw public fund, charging a greater business risk (risk averse), and also accumulating profit seemed contradictive as the real sector was still in recovery process. On the contrary, this condition can also be perceived as banking prudential efforts given the still nascent improvement in global financial market.
The slow adjustment in lending rate has its root in the variety of the bank sizes and their targeted business sectors. In this condition, banks were allowed to compensate their inefficiency on higher lending rates. Moreover, the high banking profit margin as seen in their Net Interest Margin (NIM) position was indicated to hinder the lending rate reduction. This situation was exacerbated by the tendency that the greater the bank is,
61 In line with Gambacorta, Leonardo (2004), “How Do Banks Set Interest Rates?” NBER Working Paper Series No. 10295.
that industrial structure, cost of loanable fund, overhead cost and risk premium affects credit pricing formulation.
62 In the long run it is feared to heighten the risk due to an appearing “adverse selection”, namely the debtors who prefer to take a high lending rates tend to be those having a high risk.
the less responsive it is against any changes in monetary policy. This phenomenon was in line with several studies in the past on lending rate rigidity and banking efficiency.63 In addition, within the general credit market, there is a leader and a follower behavior to determine interest rate.64 Moreover, the year 2009 also saw an expanding role of Small, Micro and Medium (SME) credit. Given their characteristics, MKM borrowers tend to focus on credit access compared to lending rate, making the formulation of lending rate more complex.
The banking excess liquidity, which tends to be persistent, comes as another factor that can explain the hindered response against interest rate. A persistent and structural excess liquidity is deemed as a heavy challenge in a bid to implement the monetary operation framework. Such a challenge, if not well managed, will take its toll on a high volatility in PUAB interest rate, which in turn will undermine the exchange rate stability and the effectiveness of monetary policy transmission. The deviation and volatility of PUAB interest rate, which are
63 On Agung, Juda, Bambang Mukti Riyadi, and Nugroho Joko Prastowo (2002), ”Banking Interest Rate Rigidity”, Research Note, Directorate of Economic Research and Monetary Policy, Bank Indonesia; for instance, says that interest rate rigidity is related with, among others, banking balance sheet condition and credit market structure tended to be more concentrated. This is reflected in the highest rigidity of the recap banking lending rates due to the asset structure of the group of banks which is still dominated by government bonds. Hadad, Muliaman D, Wimboh Santoso, Eugenia Mardanugraha, Dhaniel Illyas (2003), “Parametric Approach for Banking Efficiency in Indonesia”, Bank Indonesia’s Financial System Stability Bureau, Research Paper No. 4/5; says that major banks’ efficiency is not better than in those of foreign banks and joint venture banks.
64 Kahn, Pennacchi and Sopranzetti (2000), ”Bank Consolidation and Consumer Loan Interest Rate”, The Wharton School. University of Pennsylvania.
92 CHAPTER III | Monetary Policy Response to Global Economic Crisis
higher than the BI Rate, will cost monetary policy its credibility. In addition, some observations show that if excess banking liquidity is failed to be absorbed by the authority, it will in turn pose a potential pressure on monetary stability, inflation and exchange rate. Empirical studies done in a lot of countries show that excess banking liquidity pose the potential to undermine monetary policy transmission.65 Responding to such a structural excess liquidity issue, the management of excess banking liquidity needs further coordination among monetary, fiscal and banking authorities.
g Banking Credit Extension
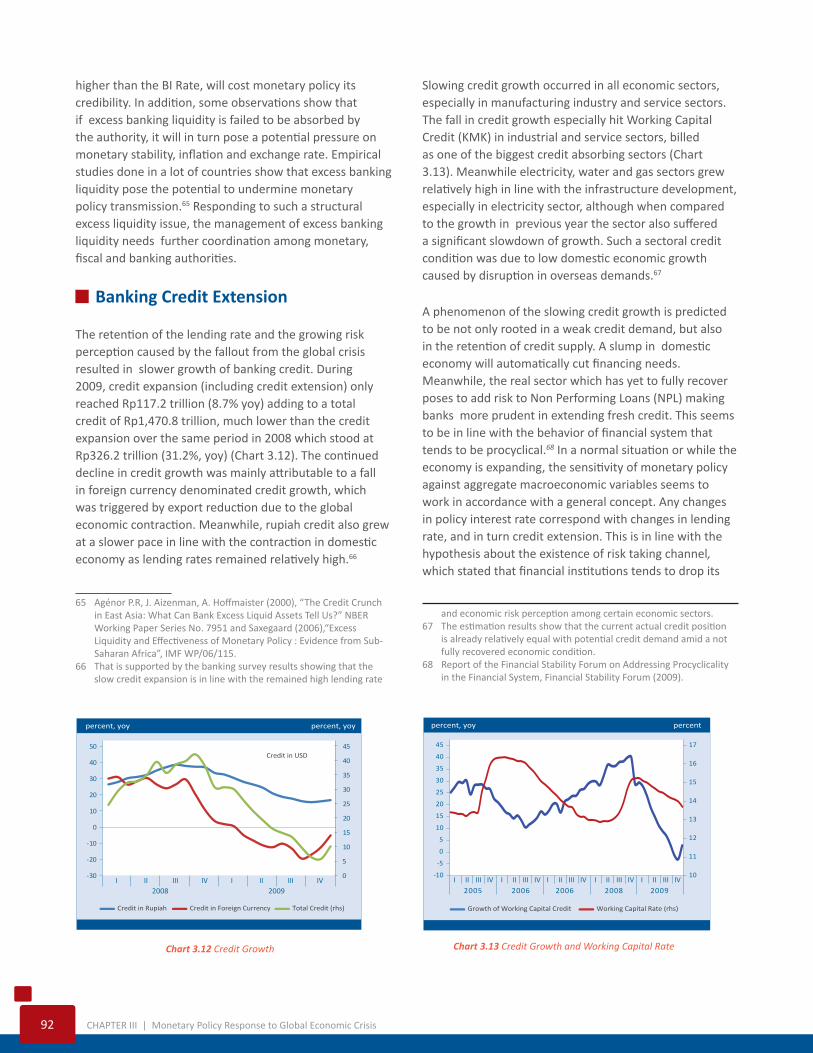
The retention of the lending rate and the growing risk perception caused by the fallout from the global crisis resulted in slower growth of banking credit. During 2009, credit expansion (including credit extension) only reached Rp117.2 trillion (8.7% yoy) adding to a total credit of Rp1,470.8 trillion, much lower than the credit expansion over the same period in 2008 which stood at Rp326.2 trillion (31.2%, yoy) (Chart 3.12). The continued decline in credit growth was mainly attributable to a fall in foreign currency denominated credit growth, which was triggered by export reduction due to the global economic contraction. Meanwhile, rupiah credit also grew at a slower pace in line with the contraction in domestic economy as lending rates remained relatively high.66
65 Agénor P.R, J. Aizenman, A. Hoffmaister (2000), “The Credit Crunch in East Asia: What Can Bank Excess Liquid Assets Tell Us?” NBER Working Paper Series No. 7951 and Saxegaard (2006),“Excess Liquidity and Effectiveness of Monetary Policy : Evidence from Sub-Saharan Africa”, IMF WP/06/115.
66 That is supported by the banking survey results showing that the slow credit expansion is in line with the remained high lending rate
Slowing credit growth occurred in all economic sectors, especially in manufacturing industry and service sectors. The fall in credit growth especially hit Working Capital Credit (KMK) in industrial and service sectors, billed as one of the biggest credit absorbing sectors (Chart 3.13). Meanwhile electricity, water and gas sectors grew relatively high in line with the infrastructure development, especially in electricity sector, although when compared to the growth in previous year the sector also suffered a significant slowdown of growth. Such a sectoral credit condition was due to low domestic economic growth caused by disruption in overseas demands.67
A phenomenon of the slowing credit growth is predicted to be not only rooted in a weak credit demand, but also in the retention of credit supply. A slump in domestic economy will automatically cut financing needs. Meanwhile, the real sector which has yet to fully recover poses to add risk to Non Performing Loans (NPL) making banks more prudent in extending fresh credit. This seems to be in line with the behavior of financial system that tends to be procyclical.68 In a normal situation or while the economy is expanding, the sensitivity of monetary policy against aggregate macroeconomic variables seems to work in accordance with a general concept. Any changes in policy interest rate correspond with changes in lending rate, and in turn credit extension. This is in line with the hypothesis about the existence of risk taking channel, which stated that financial institutions tends to drop its
and economic risk perception among certain economic sectors.67 The estimation results show that the current actual credit position
is already relatively equal with potential credit demand amid a not fully recovered economic condition.
68 Report of the Financial Stability Forum on Addressing Procyclicality in the Financial System, Financial Stability Forum (2009).
Chart 3.12 Credit Growth Chart 3.13 Credit Growth and Working Capital Rate
Credit in Rupiah Credit in Foreign Currency Total Credit (rhs)
percent, yoy percent, yoy
0
5
10
15
20
25
30
35
40
45
-30
-20
-10
0
10
20
30
40
50Credit in USD
2008 2009I III IVII I III IVII
Growth of Working Capital Credit Working Capital Rate (rhs)
percent, yoy percent
10
11
12
13
14
15
16
17
-10
-5
0
5
10
15
20
25
30
35
40
45
2005 2006 2006 2008 2009I II III IV I II III IV I II III IV I II III IV I II III IV
Monetary Policy Response to Global Economic Crisis | CHAPTER III 93
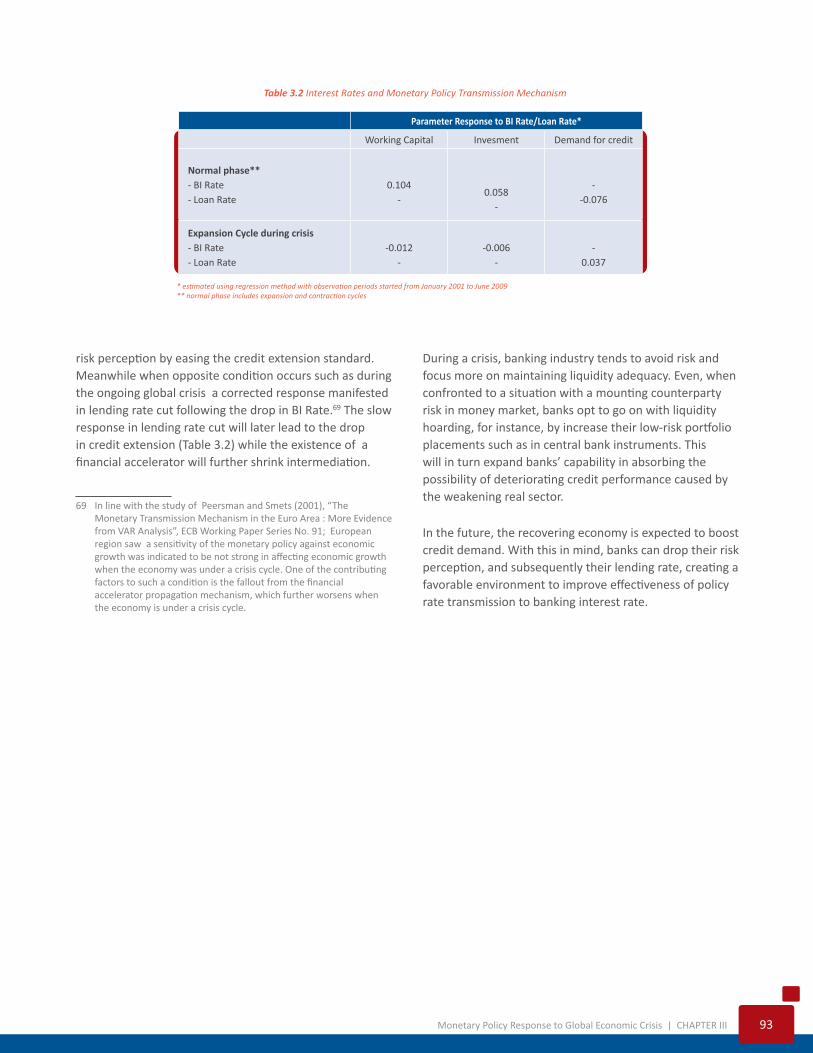
Table 3.2 Interest Rates and Monetary Policy Transmission Mechanism
* estimated using regression method with observation periods started from January 2001 to June 2009 ** normal phase includes expansion and contraction cycles
Parameter Response to BI Rate/Loan Rate*
Working Capital Invesment Demand for credit
Normal phase**- BI Rate - Loan Rate
0.104-
0.058-
--0.076
Expansion Cycle during crisis- BI Rate - Loan Rate
-0.012-
-0.006-
-0.037
risk perception by easing the credit extension standard. Meanwhile when opposite condition occurs such as during the ongoing global crisis a corrected response manifested in lending rate cut following the drop in BI Rate.69 The slow response in lending rate cut will later lead to the drop in credit extension (Table 3.2) while the existence of a financial accelerator will further shrink intermediation.
69 In line with the study of Peersman and Smets (2001), “The Monetary Transmission Mechanism in the Euro Area : More Evidence from VAR Analysis”, ECB Working Paper Series No. 91; European region saw a sensitivity of the monetary policy against economic growth was indicated to be not strong in affecting economic growth when the economy was under a crisis cycle. One of the contributing factors to such a condition is the fallout from the financial accelerator propagation mechanism, which further worsens when the economy is under a crisis cycle.
During a crisis, banking industry tends to avoid risk and focus more on maintaining liquidity adequacy. Even, when confronted to a situation with a mounting counterparty risk in money market, banks opt to go on with liquidity hoarding, for instance, by increase their low-risk portfolio placements such as in central bank instruments. This will in turn expand banks’ capability in absorbing the possibility of deteriorating credit performance caused by the weakening real sector.
In the future, the recovering economy is expected to boost credit demand. With this in mind, banks can drop their risk perception, and subsequently their lending rate, creating a favorable environment to improve effectiveness of policy rate transmission to banking interest rate.
94 CHAPTER III | Monetary Policy Response to Global Economic Crisis
3.4
Supply Side Condition and Implication on Inflationary Pressure
The domestic economy continued facing various problems in its supply side, among others were micro structural constraints. Such constraints were mainly in the forms of inefficiency or a high cost economy, disharmony between central and regional regulation, a lack of infrastructure and energy supply, along with low skilled labor forces, which will not only affect the sustainability of economic prospect and macroeconomic stability, but also will decrease Indonesia’s relative competitiveness in comparison with other countries in the region. Such micro structural constraints brought about several constraints such as a less responsive supply side against any developments or policy stimulus generated in the demand side, the imperfectness of the market structure for certain commodities, and the inefficiency in trade regulation/distribution line.
g Supply Side Response
The lack of response in the supply side developments in relation to developments in the demand side is reflected in a steep and less elastic supply curve during a post-crisis period. Empirical observation on the behavior of the supply side as reflected in the Phillips New Keynesian Curve,70 shows that during a pre-crisis period (1975 –
70 General specification of Phillips New Keynesian Curve is underlied on a staggered price setting model, namely a model which also incorporates a possibility of certain fraction within economic agents to use a backward-looking price adjustment pattern as a rule of thumb. With such a hypothesis, a hybrid model basis can be written as follow: πt = γb πt-1 + γf Et{πt+1} +κ (yt – y*t), in which γb and γf are decomposition coefficient from some parameters within a modeling system, simultaneously reflected as backward-looking and forward-looking behavior of inflation while κ is an output gap parameter.
Monetary Policy Response to Global Economic Crisis | CHAPTER III 95
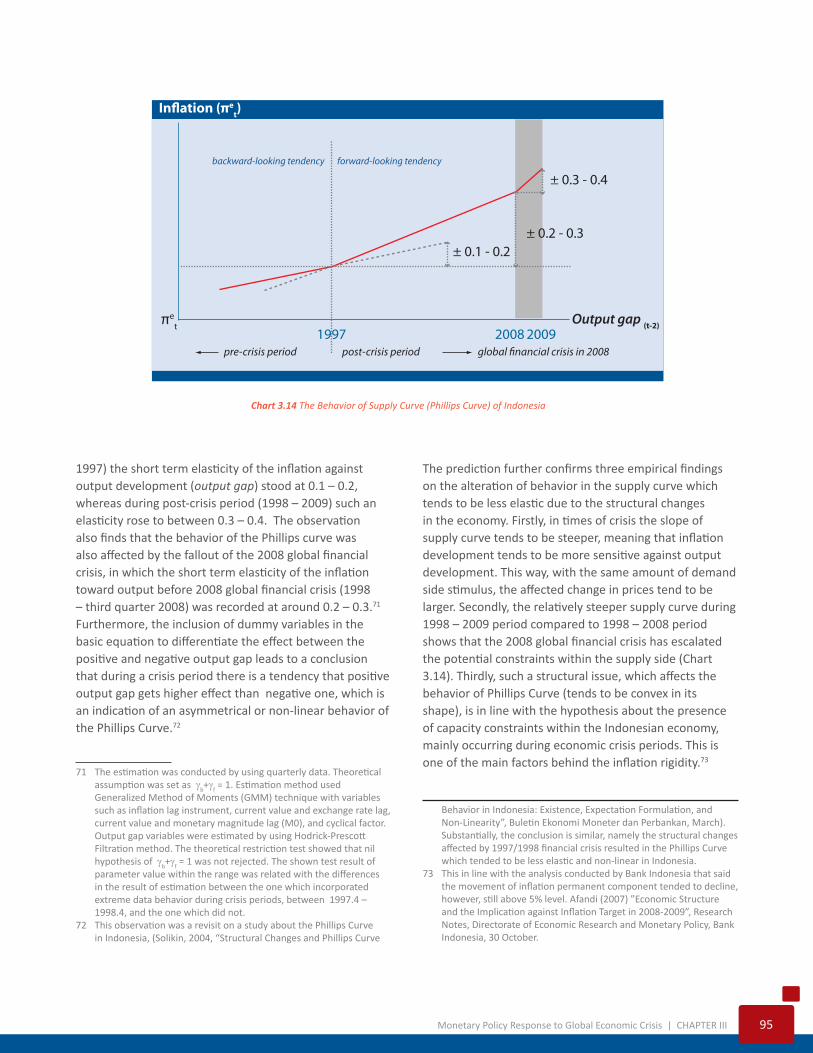
1997) the short term elasticity of the inflation against output development (output gap) stood at 0.1 – 0.2, whereas during post-crisis period (1998 – 2009) such an elasticity rose to between 0.3 – 0.4. The observation also finds that the behavior of the Phillips curve was also affected by the fallout of the 2008 global financial crisis, in which the short term elasticity of the inflation toward output before 2008 global financial crisis (1998 – third quarter 2008) was recorded at around 0.2 – 0.3.71 Furthermore, the inclusion of dummy variables in the basic equation to differentiate the effect between the positive and negative output gap leads to a conclusion that during a crisis period there is a tendency that positive output gap gets higher effect than negative one, which is an indication of an asymmetrical or non-linear behavior of the Phillips Curve.72
71 The estimation was conducted by using quarterly data. Theoretical assumption was set as γb+γf = 1. Estimation method used Generalized Method of Moments (GMM) technique with variables such as inflation lag instrument, current value and exchange rate lag, current value and monetary magnitude lag (M0), and cyclical factor. Output gap variables were estimated by using Hodrick-Prescott Filtration method. The theoretical restriction test showed that nil hypothesis of γb+γf = 1 was not rejected. The shown test result of parameter value within the range was related with the differences in the result of estimation between the one which incorporated extreme data behavior during crisis periods, between 1997.4 – 1998.4, and the one which did not.
72 This observation was a revisit on a study about the Phillips Curve in Indonesia, (Solikin, 2004, “Structural Changes and Phillips Curve
The prediction further confirms three empirical findings on the alteration of behavior in the supply curve which tends to be less elastic due to the structural changes in the economy. Firstly, in times of crisis the slope of supply curve tends to be steeper, meaning that inflation development tends to be more sensitive against output development. This way, with the same amount of demand side stimulus, the affected change in prices tend to be larger. Secondly, the relatively steeper supply curve during 1998 – 2009 period compared to 1998 – 2008 period shows that the 2008 global financial crisis has escalated the potential constraints within the supply side (Chart 3.14). Thirdly, such a structural issue, which affects the behavior of Phillips Curve (tends to be convex in its shape), is in line with the hypothesis about the presence of capacity constraints within the Indonesian economy, mainly occurring during economic crisis periods. This is one of the main factors behind the inflation rigidity.73
Behavior in Indonesia: Existence, Expectation Formulation, and Non-Linearity”, Buletin Ekonomi Moneter dan Perbankan, March). Substantially, the conclusion is similar, namely the structural changes affected by 1997/1998 financial crisis resulted in the Phillips Curve which tended to be less elastic and non-linear in Indonesia.
73 This in line with the analysis conducted by Bank Indonesia that said the movement of inflation permanent component tended to decline, however, still above 5% level. Afandi (2007) ”Economic Structure and the Implication against Inflation Target in 2008-2009”, Research Notes, Directorate of Economic Research and Monetary Policy, Bank Indonesia, 30 October.
backward-looking tendency
πet
In�ation (πet)
Output gap (t-2)
forward-looking tendency
± 0.3 - 0.4
1997pre-crisis period post-crisis period global �nancial crisis in 2008
2008 2009
± 0.2 - 0.3± 0.1 - 0.2
Chart 3.14 The Behavior of Supply Curve (Phillips Curve) of Indonesia
96 CHAPTER III | Monetary Policy Response to Global Economic Crisis
The implication of the three empirical findings to the monetary policy implementation is that the effectiveness of macroeconomic policy stimulus transmission to the real sector is to decline. This condition will cause the economy to heat up faster and the inflationary pressure to be higher. A further impact is in the inflation rate that tends to stabilize in a relatively high level, making interest rate relatively hard to be put down to a lower level. In a macro scale, such a condition will cost economic resources allocation inefficiency, and will further loosen the interconnection between the real and financial sectors (decoupling). The end result is an imbalanced economic growth structure as seen in recent years. Meanwhile, excess liquidity in the financial market continues to rise and remains beset by various vulnerabilities.
Responding to such a problem, some structural steps need to be taken in the form of better coordination between Bank Indonesia and the government. In the monetary policy side, Bank Indonesia is expected to formulate an appropriate policy stance by assessing the ongoing economic condition. Taking into account, that the steeper the slope of the Philips Curve is, the less cost is needed to curb inflation, and vice versa. Therefore, the monetary policy challenge in the future (recovery phase) is tied to a decision on short term policy preference, which is a choice between enforcing economic growth momentum versus reducing inflation. In macro policy perspective, policy coordination should be prioritized in order to strengthen the economy and accelerate infrastructure development so as to improve production capacity and economy in general. Such a move is expected to influence the behavior of the supply side to be more flexible in response to development in the demand side, thereby the
policy support to boost economic recovery process, amid the potentially persistent uncertainties ahead, will end up with optimum result.
g Market Structure and Trade Regulation
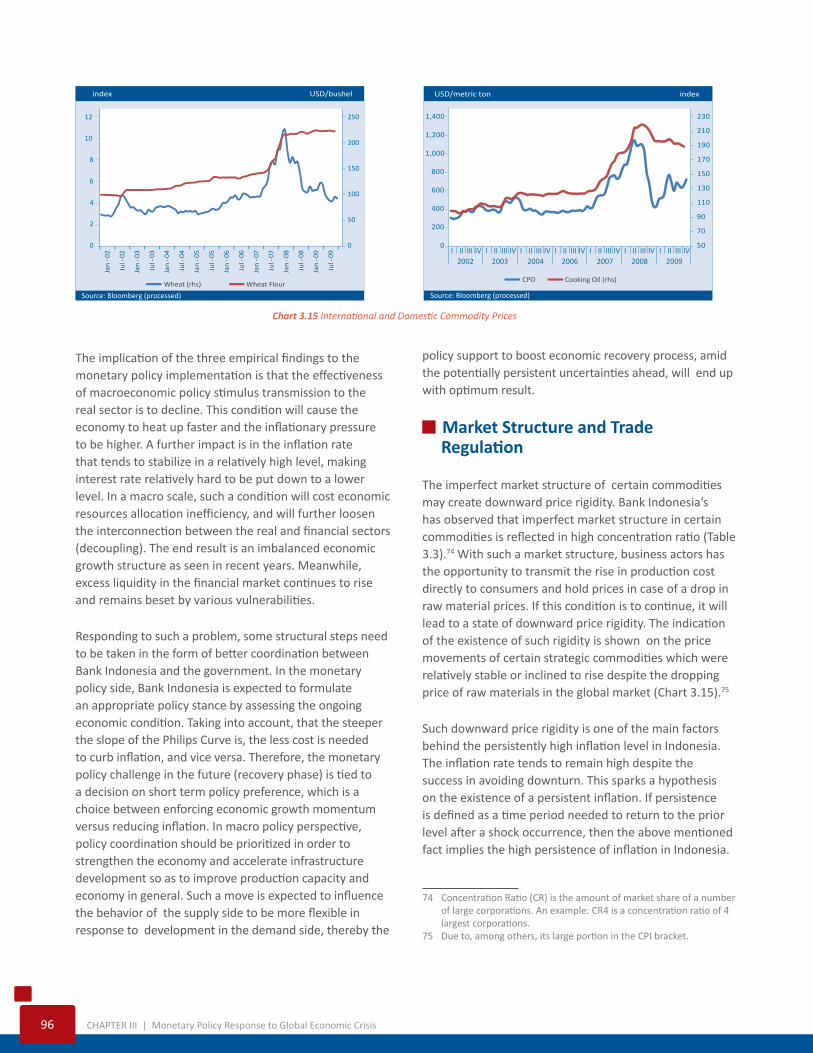
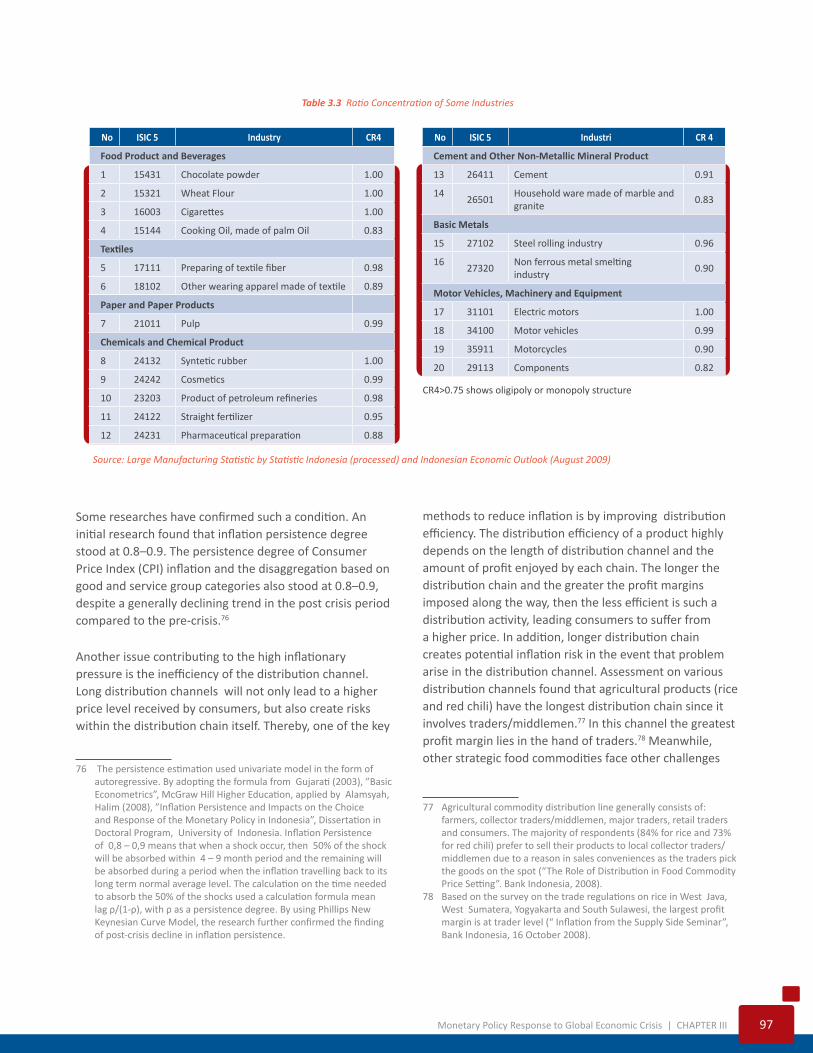
The imperfect market structure of certain commodities may create downward price rigidity. Bank Indonesia’s has observed that imperfect market structure in certain commodities is reflected in high concentration ratio (Table 3.3).74 With such a market structure, business actors has the opportunity to transmit the rise in production cost directly to consumers and hold prices in case of a drop in raw material prices. If this condition is to continue, it will lead to a state of downward price rigidity. The indication of the existence of such rigidity is shown on the price movements of certain strategic commodities which were relatively stable or inclined to rise despite the dropping price of raw materials in the global market (Chart 3.15).75
Such downward price rigidity is one of the main factors behind the persistently high inflation level in Indonesia. The inflation rate tends to remain high despite the success in avoiding downturn. This sparks a hypothesis on the existence of a persistent inflation. If persistence is defined as a time period needed to return to the prior level after a shock occurrence, then the above mentioned fact implies the high persistence of inflation in Indonesia.
74 Concentration Ratio (CR) is the amount of market share of a number of large corporations. An example: CR4 is a concentration ratio of 4 largest corporations.
75 Due to, among others, its large portion in the CPI bracket.
Chart 3.15 International and Domestic Commodity Prices
index USD/bushel
Source: Bloomberg (processed)
Wheat (rhs) Wheat Flour
0
50
100
150
200
250
0
2
4
6
8
10
12Ja
n-0
2
Jul-
02
Jan
-03
Jul-
03
Jan
-04
Jul-
04
Jan
-05
Jul-
05
Jan
-06
Jul-
06
Jan
-07
Jul-
07
Jan
-08
Jul-
08
Jan
-09
Jul-
09
CPO Cooking Oil (rhs)
50
70
90
110
130
150
170
190
210
230
0
200
400
600
800
1,000
1,200
1,400
2003 2004 2006 2007 2008 2009I II III IV I II III IV I II III IV I II III IV I II III IV I II III IV I II III IV
2002
USD/metric ton index
Source: Bloomberg (processed)
Monetary Policy Response to Global Economic Crisis | CHAPTER III 97
Some researches have confirmed such a condition. An initial research found that inflation persistence degree stood at 0.8–0.9. The persistence degree of Consumer Price Index (CPI) inflation and the disaggregation based on good and service group categories also stood at 0.8–0.9, despite a generally declining trend in the post crisis period compared to the pre-crisis.76
Another issue contributing to the high inflationary pressure is the inefficiency of the distribution channel. Long distribution channels will not only lead to a higher price level received by consumers, but also create risks within the distribution chain itself. Thereby, one of the key
76 The persistence estimation used univariate model in the form of autoregressive. By adopting the formula from Gujarati (2003), ”Basic Econometrics”, McGraw Hill Higher Education, applied by Alamsyah, Halim (2008), ”Inflation Persistence and Impacts on the Choice and Response of the Monetary Policy in Indonesia”, Dissertation in Doctoral Program, University of Indonesia. Inflation Persistence of 0,8 – 0,9 means that when a shock occur, then 50% of the shock will be absorbed within 4 – 9 month period and the remaining will be absorbed during a period when the inflation travelling back to its long term normal average level. The calculation on the time needed to absorb the 50% of the shocks used a calculation formula mean lag ρ/(1-ρ), with ρ as a persistence degree. By using Phillips New Keynesian Curve Model, the research further confirmed the finding of post-crisis decline in inflation persistence.
methods to reduce inflation is by improving distribution efficiency. The distribution efficiency of a product highly depends on the length of distribution channel and the amount of profit enjoyed by each chain. The longer the distribution chain and the greater the profit margins imposed along the way, then the less efficient is such a distribution activity, leading consumers to suffer from a higher price. In addition, longer distribution chain creates potential inflation risk in the event that problem arise in the distribution channel. Assessment on various distribution channels found that agricultural products (rice and red chili) have the longest distribution chain since it involves traders/middlemen.77 In this channel the greatest profit margin lies in the hand of traders.78 Meanwhile, other strategic food commodities face other challenges
77 Agricultural commodity distribution line generally consists of: farmers, collector traders/middlemen, major traders, retail traders and consumers. The majority of respondents (84% for rice and 73% for red chili) prefer to sell their products to local collector traders/middlemen due to a reason in sales conveniences as the traders pick the goods on the spot (“The Role of Distribution in Food Commodity Price Setting”. Bank Indonesia, 2008).
78 Based on the survey on the trade regulations on rice in West Java, West Sumatera, Yogyakarta and South Sulawesi, the largest profit margin is at trader level (“ Inflation from the Supply Side Seminar”, Bank Indonesia, 16 October 2008).
Table 3.3 Ratio Concentration of Some Industries
Source: Large Manufacturing Statistic by Statistic Indonesia (processed) and Indonesian Economic Outlook (August 2009)
CR4>0.75 shows oligipoly or monopoly structure
No ISIC 5 Industry CR4
Food Product and Beverages
1 15431 Chocolate powder 1.00
2 15321 Wheat Flour 1.00
3 16003 Cigarettes 1.00
4 15144 Cooking Oil, made of palm Oil 0.83
Textiles
5 17111 Preparing of textile fiber 0.98
6 18102 Other wearing apparel made of textile 0.89
Paper and Paper Products
7 21011 Pulp 0.99
Chemicals and Chemical Product
8 24132 Syntetic rubber 1.00
9 24242 Cosmetics 0.99
10 23203 Product of petroleum refineries 0.98
11 24122 Straight fertilizer 0.95
12 24231 Pharmaceutical preparation 0.88
No ISIC 5 Industri CR 4
Cement and Other Non-Metallic Mineral Product
13 26411 Cement 0.91
1426501
Household ware made of marble and granite
0.83
Basic Metals
15 27102 Steel rolling industry 0.96
1627320
Non ferrous metal smelting industry
0.90
Motor Vehicles, Machinery and Equipment
17 31101 Electric motors 1.00
18 34100 Motor vehicles 0.99
19 35911 Motorcycles 0.90
20 29113 Components 0.82
98 CHAPTER III | Monetary Policy Response to Global Economic Crisis
namely trade regulation issue within the existing auction system. In this case, winning bidders are dominated by distributors/major traders.
Distribution issues can also be viewed from regional economic perspective, as it is worth noticing that high inflation in certain regions is basically caused by high dependency on supplies from other regions, especially Java. This is related to the limited production of foodstuff and processed food in the regions. To make things worse, the distribution chain is quite long with distributors and traders playing a dominant role in the price setting mechanism, especially for food commodities. Moreover, Indonesia’s geographical condition is also prone to problems related with goods distribution in general.
In addition to such problems, limited domestic supply and uneven spread of production centers linger on. The high dependency on imported products and the limited ability to fulfill certain supply of goods within a certain period pushes the inflation to fluctuate. The thin ratio between production and consumption and the dependency on imports on certain strategic food caused prices of this commodities to be highly vulnerable against shocks, both domestic and external. Moreover, the low production of some food commodities force such commodities to continue to rely on imports, making them vulnerable against the movement in international prices, such as in the case of wheat flour, soybean, animal feed79 and
79 As one of the production components of beef and egg. The animal feed price development will also affect the price of those commodities.
beef. Furthermore, price development in some food commodities remains vulnerable against production fluctuation related to harvest cycles and domestic downturn, making stocks and production management essential. The objective is to make goods available continuously and evenly, thereby preventing price hikes soaring. As for the availability of domestic supply (local products), it is also necessary for us to focus on the product quality in a move to reduce import dependency, as the available domestic products at times do not offer the desired quality. Furthermore, the uneven spread of production centers will lead to the rise in distribution cost and price risk. As an example, the production centers are mostly centered on in Java. Considering all the issues above , efforts to help achieve the inflation target rely on improved cross institutional coordination and the industrial structure reinforcement. Essentially low and stable inflation rate can not be achieved by merely managing the aggregate demand side through Bank Indonesia’s monetary policy, but rather, it needs government policy supports, both fiscal and sectoral to consistently support the efforts to reach the inflation target. Other action which needs to be prioritized is the revitalization of the industrial structure so as to improve efficiency and to reduce import dependency (self sufficiency). This needs to be done in order to reduce the impact of international commodity price fluctuation to prices of strategic commodities at home.
Monetary Policy Response to Global Economic Crisis | CHAPTER III 99
3.5
Conclusion
In 2009, the monetary policy stance tended to be loose as a manifestation of BI’s commitment to help economic recovery and also to build up a strong foundation for a sustainable economic growth ahead. Such policies was taken amid pressure from financial system stability. Thus a number of policies effective since the final quarter 2008 remained kept in place, even reinforced, in order to keep money market functioning. All of those policies were made possible due to an easing inflationary pressure. With the various policies taken both in the monetary and fiscal fronts, the Indonesian economy posted a positive growth, better than several countries which currently still face negative growth. Meanwhile the balance of payments recorded surplus, rupiah exchange rate appreciated, and inflation was kept lower than its targeted range.
In the midst of these encouraging achievements, the Indonesian economy continues to be beset by some structural issues. Special attention needs to be paid to such issues since they have the potentials to undermine the achievement of the country’s economic performance in the years ahead. Some main concerns on the monetary policy front are foreign capital flows, monetary policy transmission, and supply side.
Rapid flows of foreign capital may turn out to be a double-edged knife. On the one hand, their presence is so desirable since they can serve as a buffer for domestic foreign exchange supply and thus prevent the exchange rate from being subjected to pressure, which in turn, facilitate the achievement of the inflation target. On the other hand, they can be regarded as a problem,
100 CHAPTER III | Monetary Policy Response to Global Economic Crisis
especially in the event of changes in global perception which lead to capital outflows. Therefore, a favorable and coordinated macroeconomic policy is expected to be able to manage both inflation expectation and market perception on economic condition, thus enabling improvement of foreign capital flow structure making such flows able to support sustainable economic activities. In order to achieve the desired result, active role on the part of the authorities are needed to support domestic foreign exchange market and to facilitate infrastructure improvement which contributes to the financial market deepening.
The constraints in monetary policy transmission especially in interest rate and credit channels stemmed from increasing economic risks. This condition encouraged banks to be more averse to risks. Such a situation can be seen by the tendency of banks to maintain large spread on lending rate and deposite rate while increasing the credit standard. These circumstances might further tighten
the weakening credit demand, already corrected by the slowing economic growth. Meanwhile, the large excess liquidity remaining in national banks needs to be managed since it could potentially increase the complexity and burdens of monetary policy.
Related to several unresolved problems in the supply side, demand side stimulus tended to drive the economy to heat up easily and thus vulnerable to inflationary pressure. Therefore, in order to address the issue a priority should be put on improved coordination between Bank Indonesia and the government. This coordination is necessary to strengthen economic institution and accelerate infrastructure development related with the efforts to expand production capacity and economic capacity in general. The complexities of the monetary policy issues need attention and continuing efforts to seek for solutions in order to provide room for other policies to help optimize economic growth ahead.
Monetary Policy Response to Global Economic Crisis | CHAPTER III 101
Box 3.1: Entering the 5th year of ITF Implementation in Indonesia: Success and Challenges
In the last ten years, and amid an economic situation not fully recovered from the shocks triggered by the onslaught of 2008 financial crisis, the ITF-based monetary policy challenges in Indonesia have become stronger. Various challenges have emerged taking their roots in the global, national, and regional scopes. In the global scope, problems arise related with the impact of the financial crisis and the high mobility of short term capital flows highly influential to the exchange rate development. In addition, the changes in the financial system behavior also could add complexity in a monetary control. In the national scope, problems arise in regard to the presence of excess liquidity and the supply side structural rigidity phenomena. This in turn will fundamentally distort the works of the monetary policy transmission mechanism and bore down pressure on monetary stability. Meanwhile, in the regional perspective, problems related to the high persistence in regional inflation emerged, sparked by, among others, the escalating financial dynamics within regional governments and constraints along the inter-regional distribution channel. Under such a dynamic environment, it is not easy for Bank Indonesia to bring inflation to the target, thereby building the monetary policy credibility.
In relation with such dynamics, Bank Indonesia conducted a study on the implementation of ITF during the nearly last 5 years.1 The study was aimed to conduct a comprehensive review on the performance of ITF implementation in Indonesia and also to provide recommendations to improve ITF implementation strategy in Indonesia in the future. The special objective of the study was to address some fundamental issues related with ITF format suitable for the characteristic of the Indonesian economy. Referring to the scope of the previous studies on ITF implementations in some countries, the study covered five basic aspects, namely inflation target, institutional frameworks, operational frameworks, policy coordination, and the quality of policy research and analysis. The review was done by comparing the performance achievement of ITF
1 Directorate of Economic Research and Monetary Policy (2009),”Review on the Inflation Targeting Frameworks (ITF) Implementation in Indonesia”, Working Paper, December.
implementation in Indonesia against the rule or basic principles of the ITF implementation, either originated from theoretical studies or the best practices imposed in some countries.
Success and Challenges
The review results show that the ITF implementation in Indonesia during the nearly last 5 years has recorded some success. The ITF implementation has been better managed accompanied by an increase in its quality, referring to best practice principles, theoretical thoughts, and Indonesia’s empirical conditions. In general, related to some aspects of business process, some positive developments have occurred, namely in the presence of target setting and the announcement of inflation target, the management of institutional and operational frameworks, the policy coordination improvement, and the improved quality of policy analysis and research.
During the ITF implementation period, there were also some substantial improvements in fundamental aspects. This differentiates the benefit of ITF from other policy frameworks, namely in the aspect of (i) the institutional existence maturation, (ii) the policy signal clarity, and (iii) the policy credibility improvement.
Institutional Existence Maturation
In line with the improvement and consolidation in ITF institutional frameworks, such as on independency, accountability, and transparency, Bank Indonesia has transformed itself from an inward-oriented organization at the beginning into an outward-oriented one. This raises awareness on the effort needed to build a win-win relationship between Bank Indonesia and the public, where openness and communications are expected to serve as the main pillars in improving Bank Indonesia’s policy credibility as a central bank. Such facts are backed by some observations.
Firstly, survey findings on Bank Indonesia’s performance generally show that the respondent’s satisfaction on monetary policy communication was good. The majority of the respondents (57%) said they were satisfied by the monetary policy communication process. With this
102 CHAPTER III | Monetary Policy Response to Global Economic Crisis
positive development, it is expected that Bank Indonesia monetary policy response can be more positively interpreted by the public.
Secondly, in regard to the institutional frameworks, the result of FSAP – IMF analysis in 2009 shows that BI’s monetary policy transparency was classified as reasonably high. This assessment was based on four criteria as follows: (i) the policy goal has been clearly stated in the Bank Indonesia act; (ii) Bank Indonesia act guarantees the central bank’s independency; (iii) the inflation targeting framework is committed to improve the communication with the public; and (iv) regulation guaranteeing the integrity of Bank Indonesia employees.
Policy Signal Clarity
In line with gradual improvement to this date, both on the aspect of setting operational target interest rate and other money market instruments, the current perspective of monetary policy operational framework was now better in accordance to both theoretical thoughts and best practice principles. This condition enables monetary policy signals to be better interpreted by the market. This is different from the pre-ITF implementation condition where Bank Indonesia’s signals using base money could not be quickly interpreted by the market, leading to unchanged or, even, worsening inflation expectation.
One of the positive examples in ITF implementation is the signal of tight monetary policy through BI Rate increase since July 2005 (ahead of the announcement of fuel price hike in October 2005) which were positively responded by economic actors. That was reflected on subsiding depreciation expectation and the decline in inflation expectation in the post-fuel price hike period. Such an episode shows that a clear cut policy signal transmission packaged with the right communication strategy has resulted in a success to build a positive understanding over the Bank Indonesia’s policy measure, while simultaneously directing the public expectation on economic prospect and policy direction ahead.
Policy Credibility Improvement
In line with the ITF implementation, monetary policy credibility has enjoyed improvement. Some following indicators support such a conclusion.
Firstly, several observations, both through surveys and empirical studies, show an ongoing or historical shift in the behavior of public inflation expectation buildup from an initially backward looking tendency into a forward looking one ; and this is positively influential to the reduction in inflation persistence level. Such a condition is confirmed by the result of empirical studies showing that during the ITF implementation the monetary policy credibility degree has doubled, although not fully credible yet (imperfect credibility).
Secondly, in line with the credibility buildup undertaken so far, the regular publication of Bank Indonesia’s policy stance through BI Rate setting became an important economic indicators referred by money market players and business community.
Outside those success stories, ahead, it is important to take some steps to further improve ITF, especially related with the change in financial system behavior and the contribution of ITF in responding to the current global financial crisis, accompanied by, among others, excess liquidity phenomenon and the structural rigidity in the supply side. Another important aspect is how the ITF can be beneficial and later reflected onto an economic development within a regional perspective. Such issues eventually increase the complexity of monetary policy management in Indonesia.
Short Term Policy Implication and Future Thoughts
The fundamental short term policy implication implied in the observations is related to the need for flexibility and policy coordination, better understanding on the important role of the financial sector, a calculation over the monetary policy regional impacts, and reinforcement of the monetary policy communication strategy.
The crisis and the current change in the financial sector behavior demand that Bank Indonesia be more flexible and creative in responding to any emerging uncertainties within the economy and to stay beyond public perception. Partial policies which only prioritize price stability will lead to a less optimal macroeconomic stability management. Addressing the implications, the formulation of Bank Indonesia monetary policy needs to further consider the role and the dynamics of the
Monetary Policy Response to Global Economic Crisis | CHAPTER III 103
financial system, namely by accommodating financial stability indicators in addition to having a longer forward looking horizon.
The lesson learned from the global financial crisis shows that the quantitative easing policy applied by many central banks indicated that monetary magnitudes, such as credit and currency in circulation, played an important role in helping stabilize the financial market and the overall economy during the crisis period. Therefore, the formulation of Bank Indonesia monetary policy needs to pay more attention to the development in monetary magnitudes to make them grow in line with the fundamental economic condition.
In addition, the presence of characteristic differences within regional economies also bears an important implication on the execution of the monetary policy. Thereby, the formulation of monetary policy should also consider the regional economy developments.
Also important is the need for an excellent policy communication strategy. The monetary policy communication is no longer for the sake of the mere interest of transparency and accountability, but rather as an influential monetary policy instrument contributor.
In line with such short term policy implications, in future policy perspective, crisis and change in financial sector behavior justify the need for a flexible ITF implementation. This is not only based on the strategic perspective, but also an operational one. Flexible ITF is seen as an ideal format for the Indonesian economy. In this context, Bank Indonesia will consider some aspects in the implementation of a flexible ITF in Indonesia in the future. Firstly, in the effort to reach price stability, financial system stability will also be considered in formulating monetary policy. Particularly for the Indonesian economy, such financial system stability indicators includes the exchange rate stability and also price developments in stocks and bonds. Secondly, aside from the remaining use of interest rate instrument and liquidity management, monetary policy implementation will also be empowered by regulatory instrument in the financial sector in a macro scope (macro prudential regulatory framework). It is necessary to emphasize that consideration will continue to be made concerning aspects of financial system stability in the formulation and implementation of monetary policy by referring to both institutional and operational frameworks which have been doing well so that the credibility of the monetary policy remains intact.
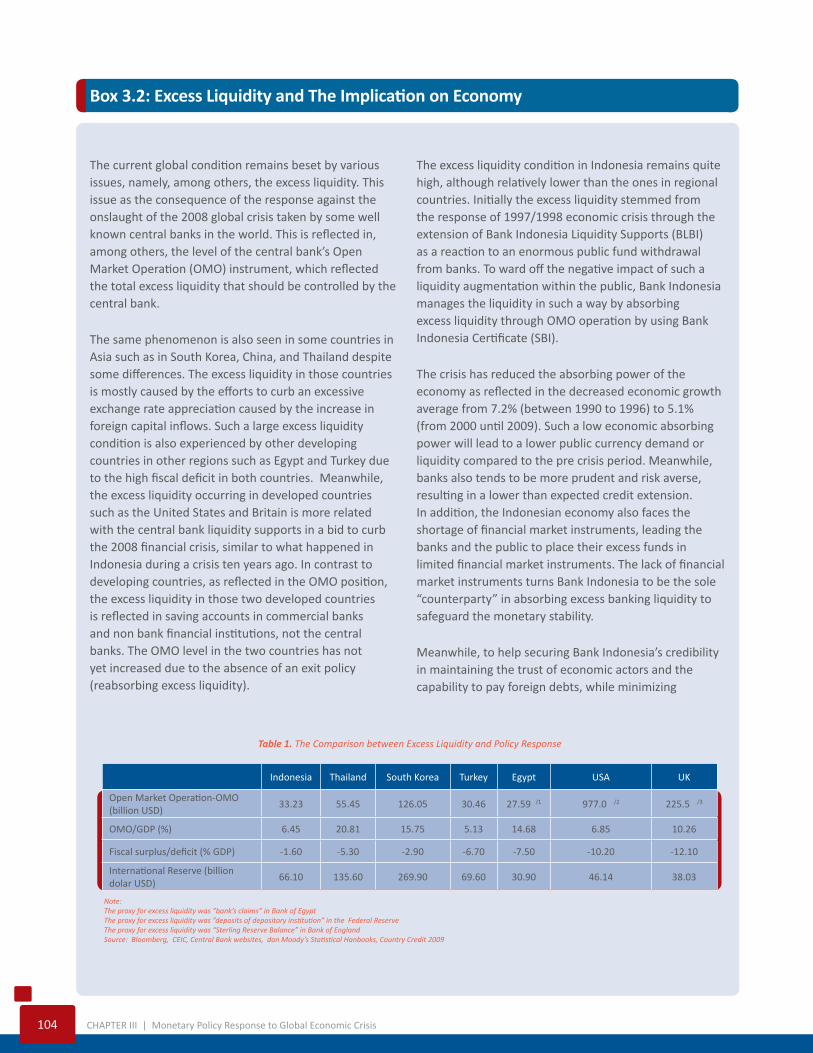
104 CHAPTER III | Monetary Policy Response to Global Economic Crisis
Box 3.2: Excess Liquidity and The Implication on Economy
The current global condition remains beset by various issues, namely, among others, the excess liquidity. This issue as the consequence of the response against the onslaught of the 2008 global crisis taken by some well known central banks in the world. This is reflected in, among others, the level of the central bank’s Open Market Operation (OMO) instrument, which reflected the total excess liquidity that should be controlled by the central bank.
The same phenomenon is also seen in some countries in Asia such as in South Korea, China, and Thailand despite some differences. The excess liquidity in those countries is mostly caused by the efforts to curb an excessive exchange rate appreciation caused by the increase in foreign capital inflows. Such a large excess liquidity condition is also experienced by other developing countries in other regions such as Egypt and Turkey due to the high fiscal deficit in both countries. Meanwhile, the excess liquidity occurring in developed countries such as the United States and Britain is more related with the central bank liquidity supports in a bid to curb the 2008 financial crisis, similar to what happened in Indonesia during a crisis ten years ago. In contrast to developing countries, as reflected in the OMO position, the excess liquidity in those two developed countries is reflected in saving accounts in commercial banks and non bank financial institutions, not the central banks. The OMO level in the two countries has not yet increased due to the absence of an exit policy (reabsorbing excess liquidity).
The excess liquidity condition in Indonesia remains quite high, although relatively lower than the ones in regional countries. Initially the excess liquidity stemmed from the response of 1997/1998 economic crisis through the extension of Bank Indonesia Liquidity Supports (BLBI) as a reaction to an enormous public fund withdrawal from banks. To ward off the negative impact of such a liquidity augmentation within the public, Bank Indonesia manages the liquidity in such a way by absorbing excess liquidity through OMO operation by using Bank Indonesia Certificate (SBI).
The crisis has reduced the absorbing power of the economy as reflected in the decreased economic growth average from 7.2% (between 1990 to 1996) to 5.1% (from 2000 until 2009). Such a low economic absorbing power will lead to a lower public currency demand or liquidity compared to the pre crisis period. Meanwhile, banks also tends to be more prudent and risk averse, resulting in a lower than expected credit extension. In addition, the Indonesian economy also faces the shortage of financial market instruments, leading the banks and the public to place their excess funds in limited financial market instruments. The lack of financial market instruments turns Bank Indonesia to be the sole “counterparty” in absorbing excess banking liquidity to safeguard the monetary stability.
Meanwhile, to help securing Bank Indonesia’s credibility in maintaining the trust of economic actors and the capability to pay foreign debts, while minimizing
Table 1. The Comparison between Excess Liquidity and Policy Response
Note:The proxy for excess liquidity was ”bank’s claims” in Bank of Egypt The proxy for excess liquidity was ”deposits of depository institution” in the Federal ReserveThe proxy for excess liquidity was “Sterling Reserve Balance” in Bank of EnglandSource: Bloomberg, CEIC, Central Bank websites, dan Moody’s Statistical Hanbooks, Country Credit 2009
Indonesia Thailand South Korea Turkey Egypt USA UK
Open Market Operation-OMO (billion USD)
33.23 55.45 126.05 30.46 27.59 /1 977.0 /2 225.5 /3
OMO/GDP (%) 6.45 20.81 15.75 5.13 14.68 6.85 10.26
Fiscal surplus/deficit (% GDP) -1.60 -5.30 -2.90 -6.70 -7.50 -10.20 -12.10
International Reserve (billion dolar USD)
66.10 135.60 269.90 69.60 30.90 46.14 38.03
Monetary Policy Response to Global Economic Crisis | CHAPTER III 105
the exchange rate volatility, Bank Indonesia needs to maintain foreign reserves adequacy. As economic activities keep improving, the need for import financing tends to rise significantly, thereby demanding a larger foreign reserves to maintain they stay in a safe level. The efforts to secure such foreign reserves adequacy will lead to an increase in banking excess liquidity.
Such a high excess liquidity, if not well managed, will bring a negative repercussion to the economy. The excess liquidity can serve as an ammunition for speculative activities mainly in the foreign exchange market. When the exchange rate is under pressure, such a condition can accelerate the volatility and push the rupiah to depreciate. Moreover, excess liquidity has the potential to reduce the monetary policy effectiveness in reaching the inflation target set by the government. Some countries’ experience show that the central bank’s excess liquidity absorption have been proven capable of easing pressure against exchange rates, and in turn also brought about positive effect to inflation.
To overcome such an excess liquidity issue, aside from the use of OMO instrument, a number of central banks have taken a more permanent and structural absorption strategy. This was carried out by, among others, lifting the banks’ ratio of Reserve Requirement (GWM), as applied in China, and by a periodical sterilization in domestic foreign exchange market, as done in South Korea and Thailand. Both South Korea and Thailand are equipped with a well run capital flow information technology infrastructure, so that they can organize the capital flow entering and exiting the countries. Beyond those steps, other structural policies included the application of Treasury Single Account (TSA) agreement exclusively signed between the central banks and the
governments to organize excess banking liquidity and the absorption through a longer term central bank instruments to curb excess liquidity in a longer period.
In Indonesia, effort to overcome excess liquidity are implemented by using two strategies, namely through the use of OMO and a structural policy response. Some structural policies have been taken by Bank Indonesia and the government such as GWM adjustment and foreign exchange sterilization. In addition to the structural policy above Bank Indonesia along with the government has also applied TSA since 2009. Furthermore in a bid to curb the excess liquidity in a longer period while also improving the money market, Bank Indonesia also uses a longer SBI maturity (6 months).
Other than the above mentioned policies, policy to expand economic capacity and financial market deepening is also needed to reduce banking excess liquidity. Economic capacity building can create additional demand for liquidity from the public. Therefore, various efforts to drive economic growth momentum, including by creating an optimum credit expansion, need to be further continued. In this regard, the efforts to reinforce an information bridge between banks and economic actors in the real sector in the form of Debtor Information System (SID) is considered to be highly important. Meanwhile, the financial market deepening is carried out by developing a transaction infrastructure and encouraging the creation of various financial market instruments as an alternatives for excess liquidity placements, while improving the liquidity management efficiency and empowering banking liquidity risk management.

106 CHAPTER III | Monetary Policy Response to Global Economic Crisis